-
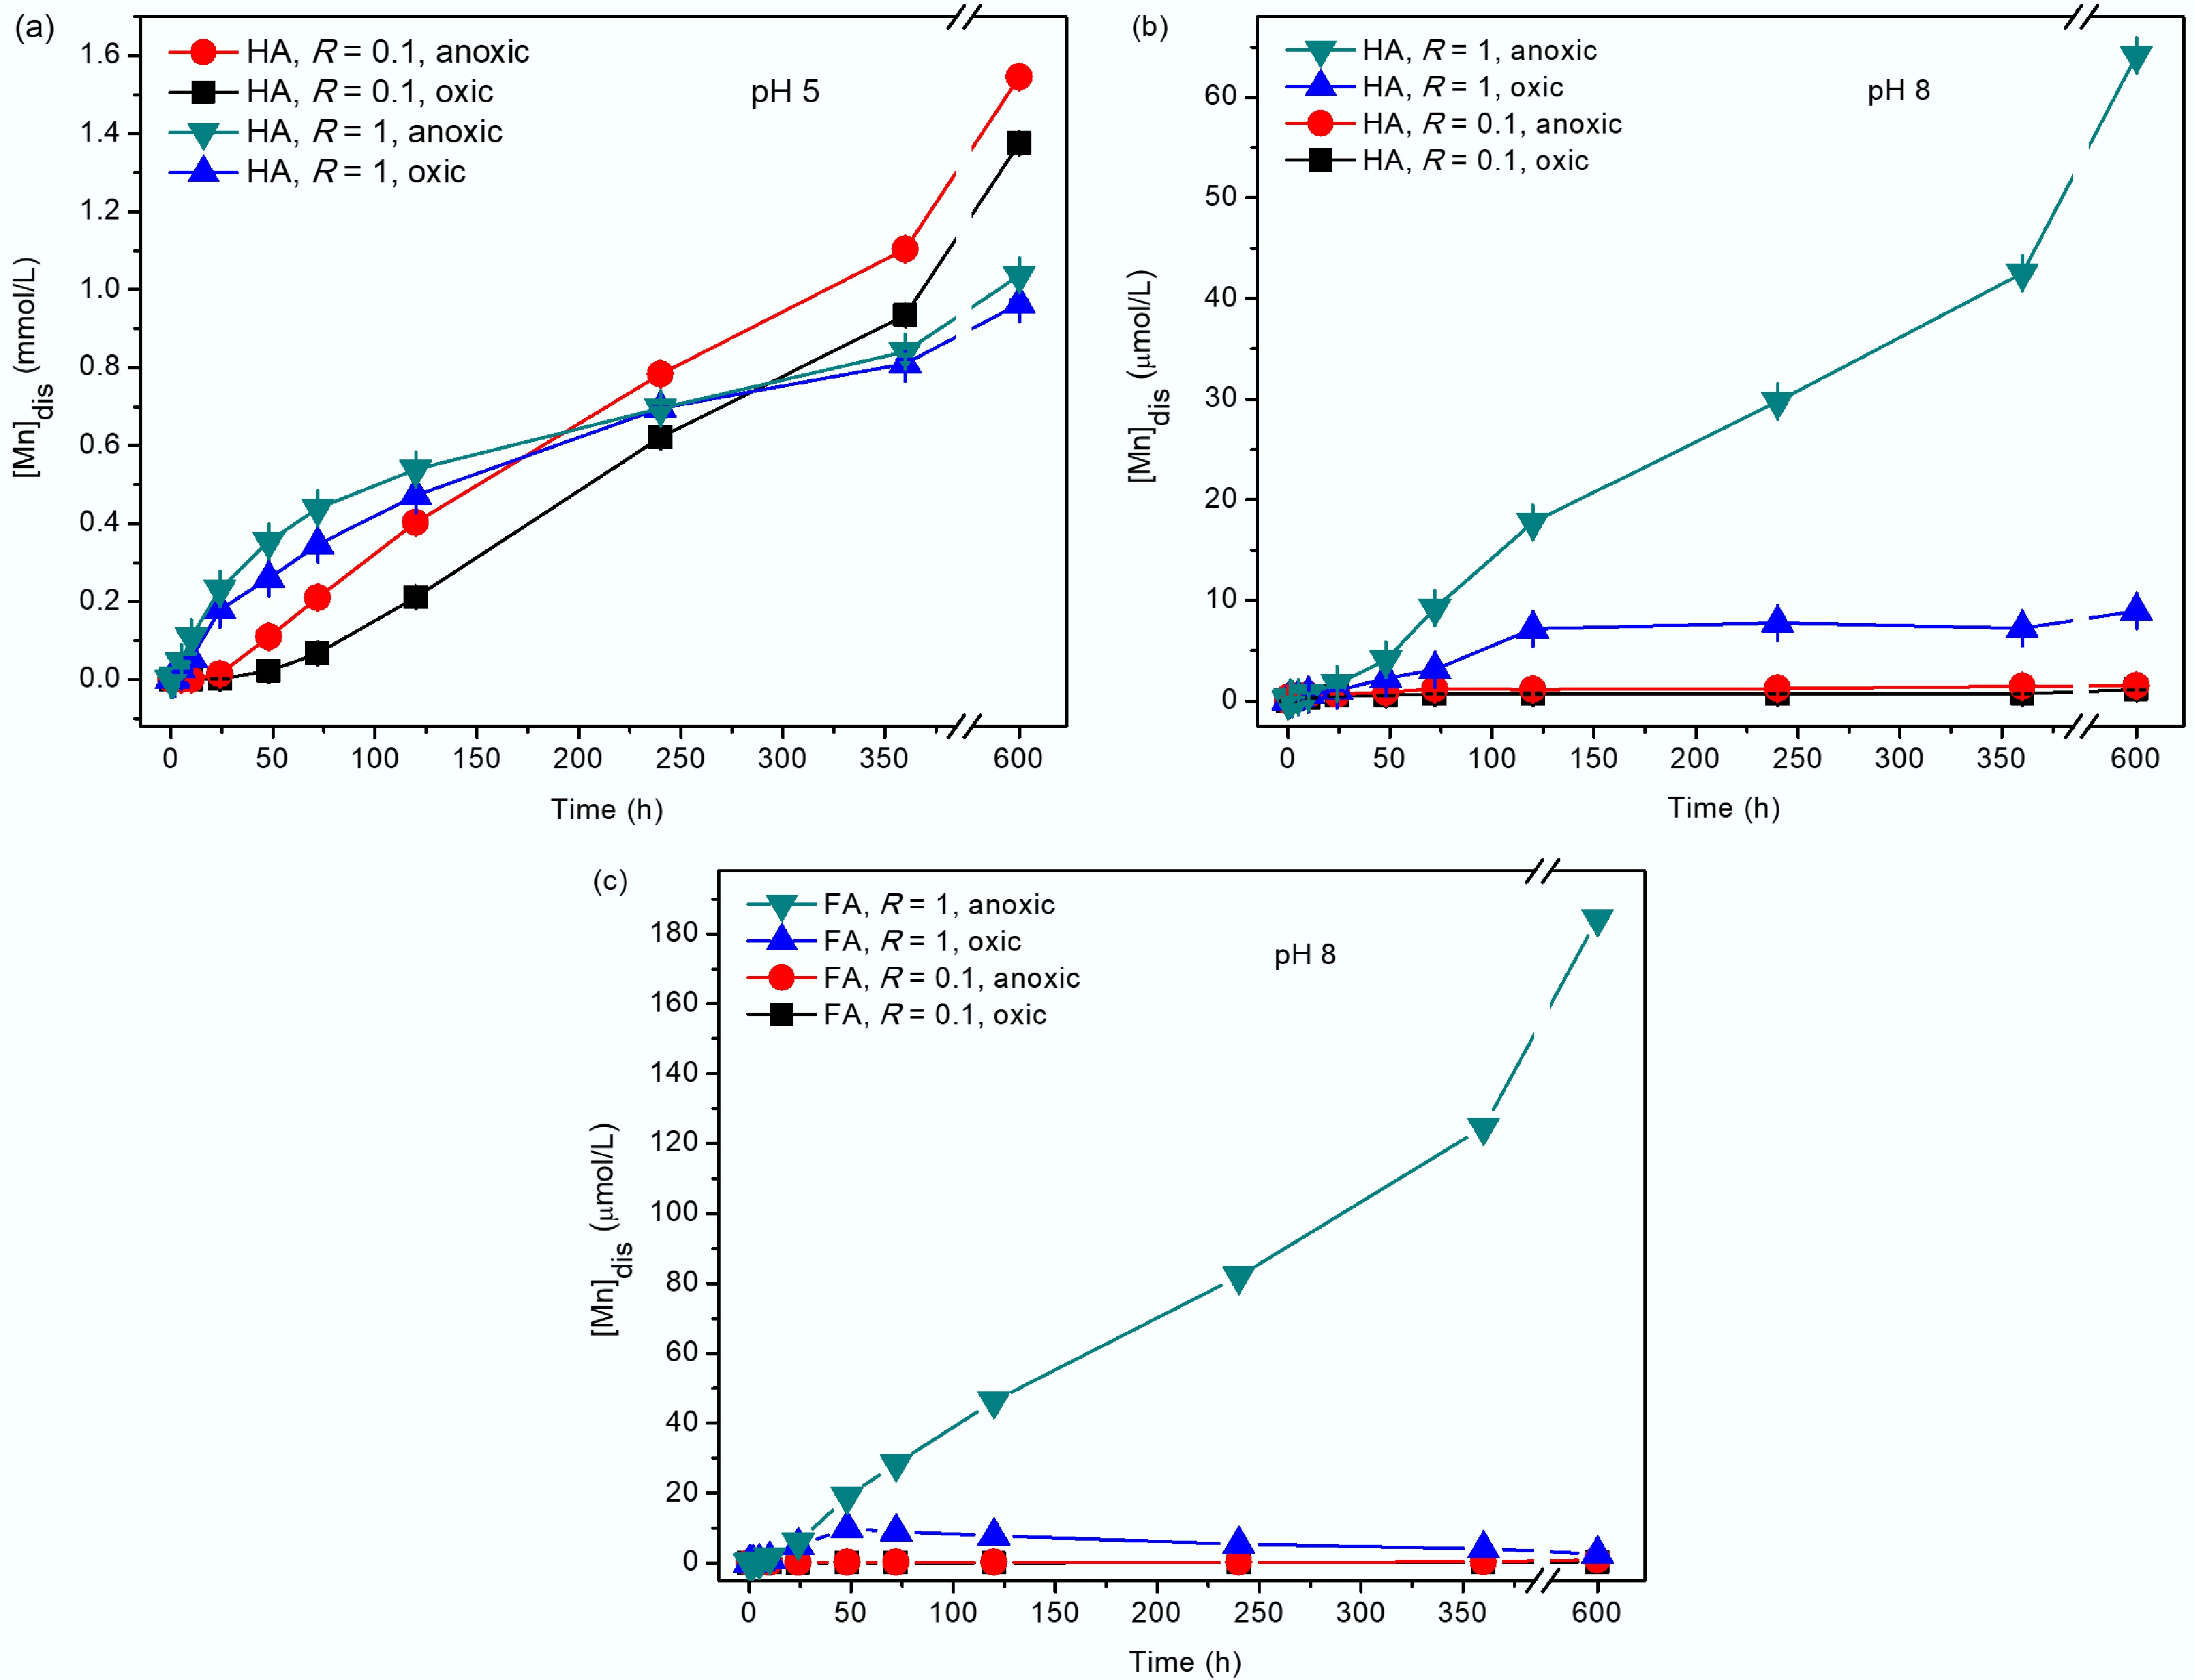
Figure 1.
Dissolved Mn concentration ([Mn]dis) during the reduction of δ-MnO2 by HA at (a) pH 5, (b) pH 8, and (c) FA at pH 8 with R = 0.1 and 1 under anoxic or oxic conditions. The errors resulted from repeated concentration measurements using ICP-OES.
-
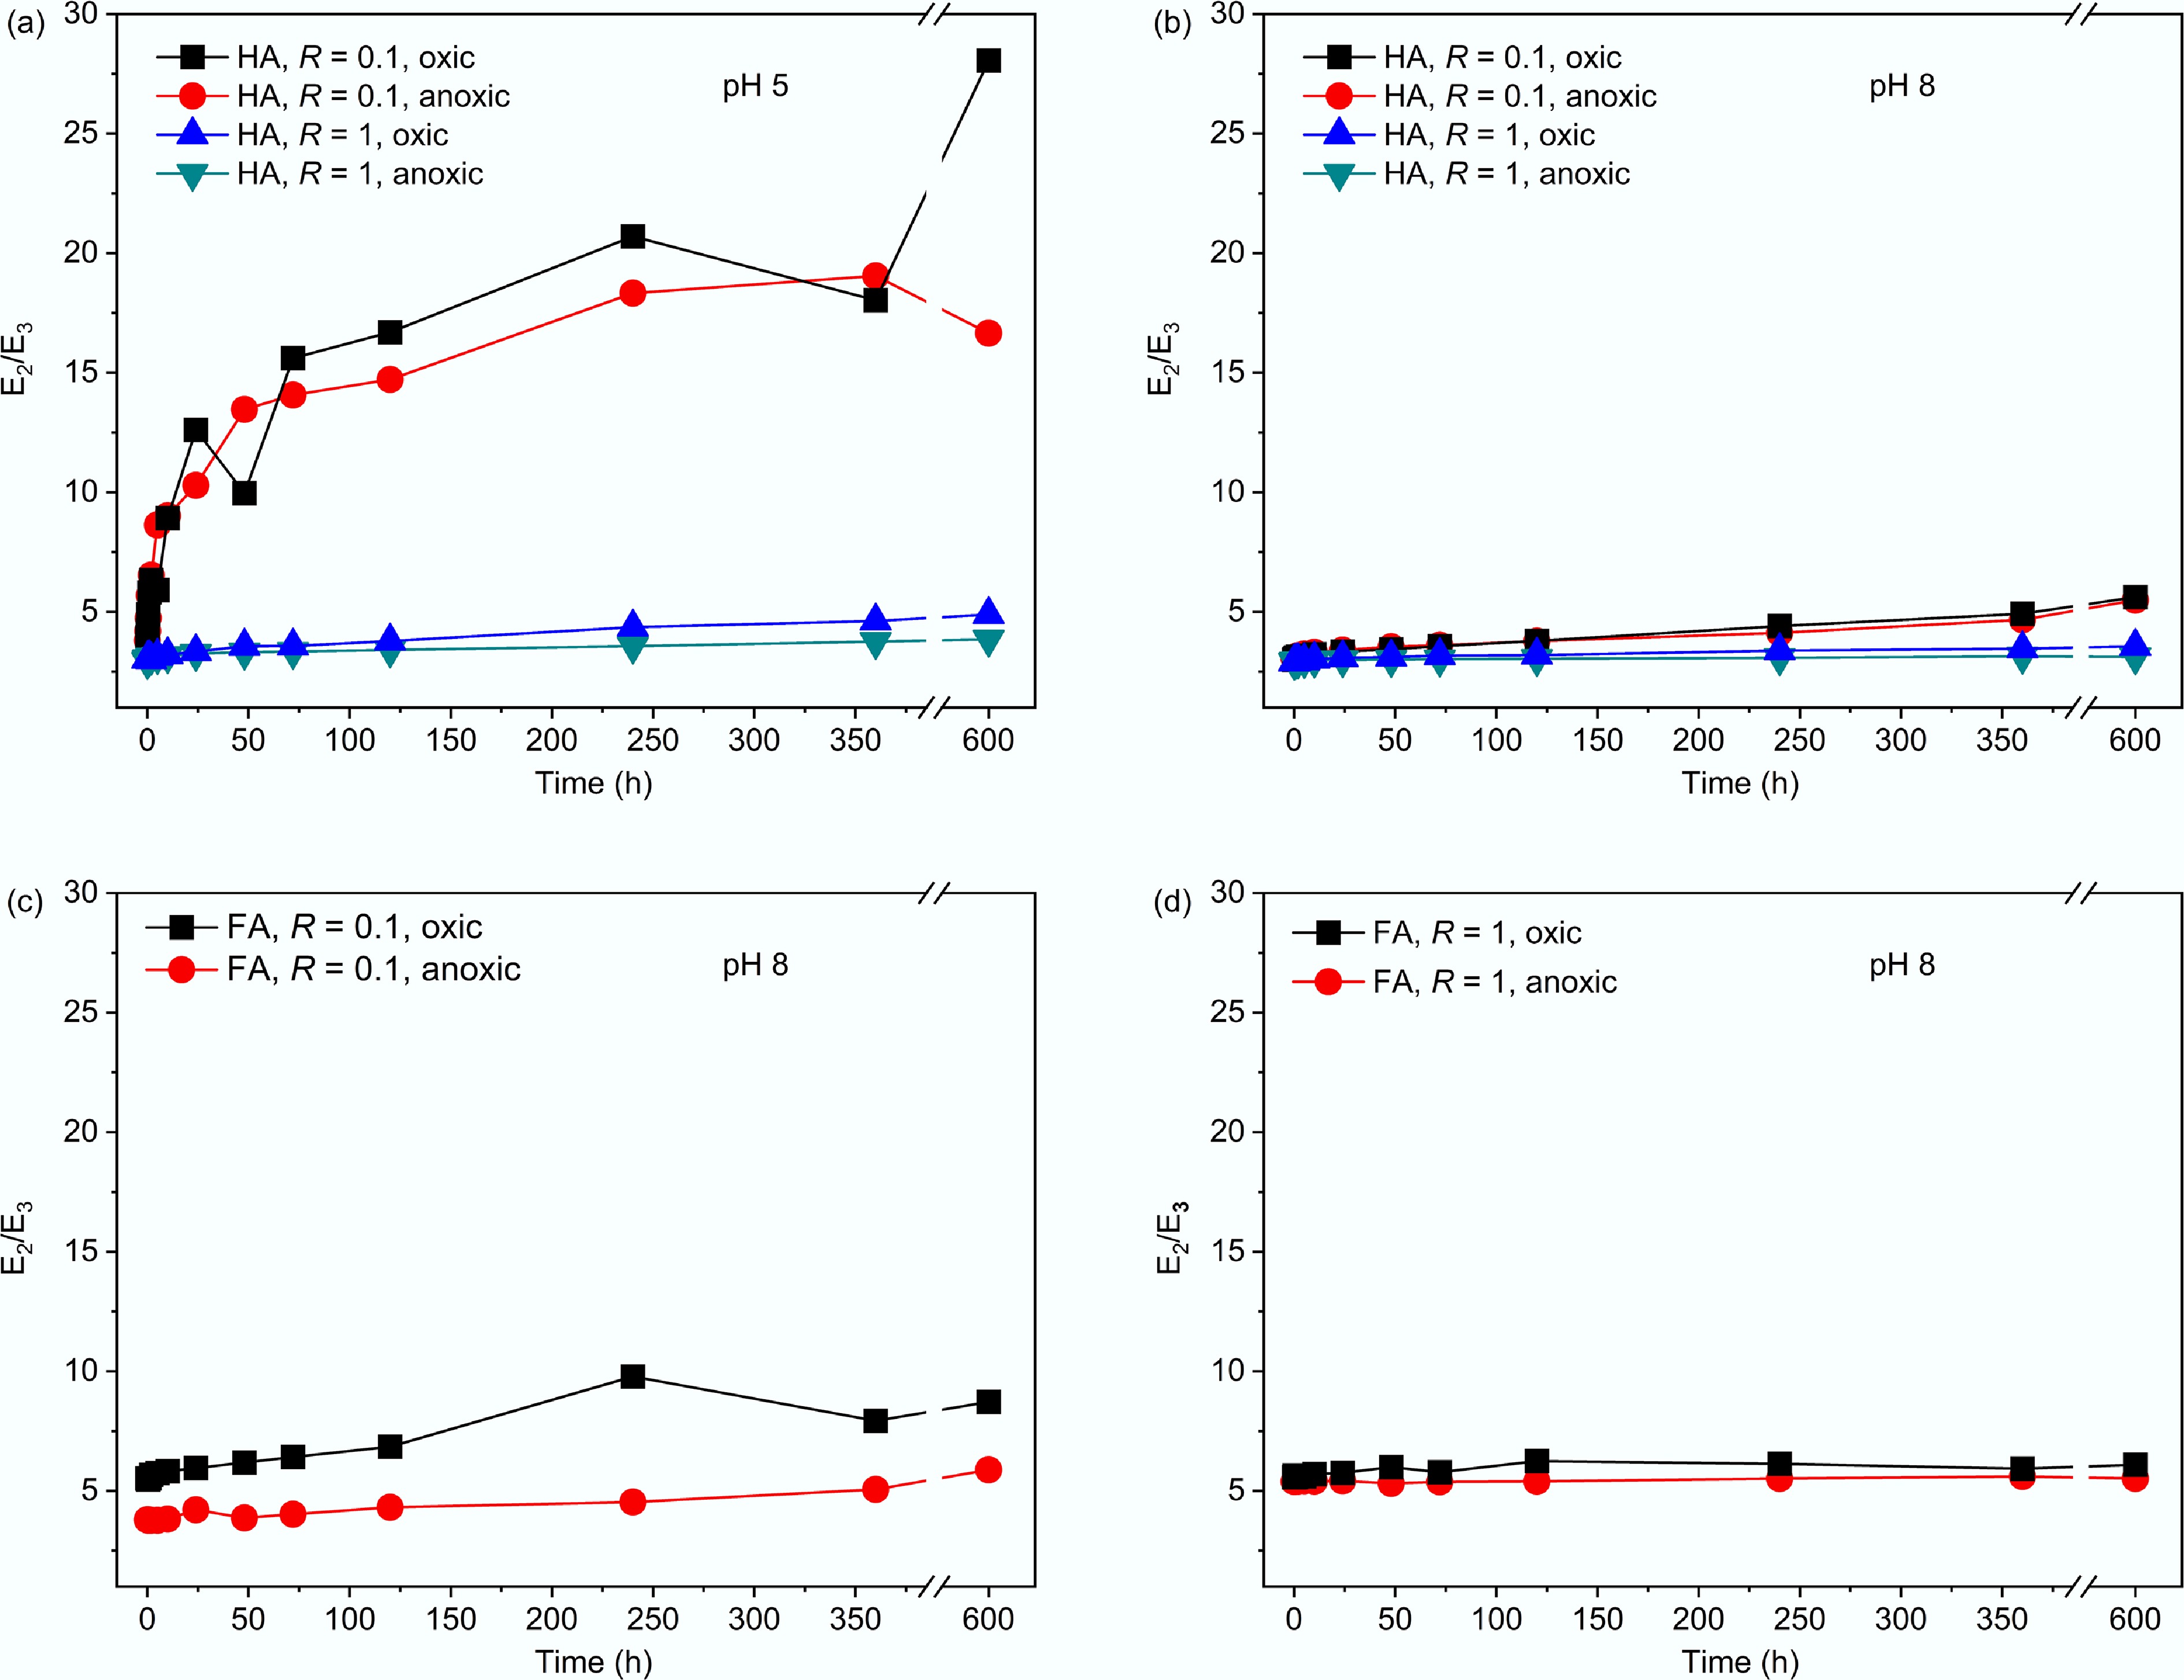
Figure 2.
E2/E3 of HA remained in the reactions with δ-MnO2 at (a) pH 5 and (b) pH 8 with R = 0.1 and 1 and FA remained at pH 8 with (c) R = 0.1 and (d) R = 1. Data for FA under anoxic conditions were adopted from Wang et al.[12].
-
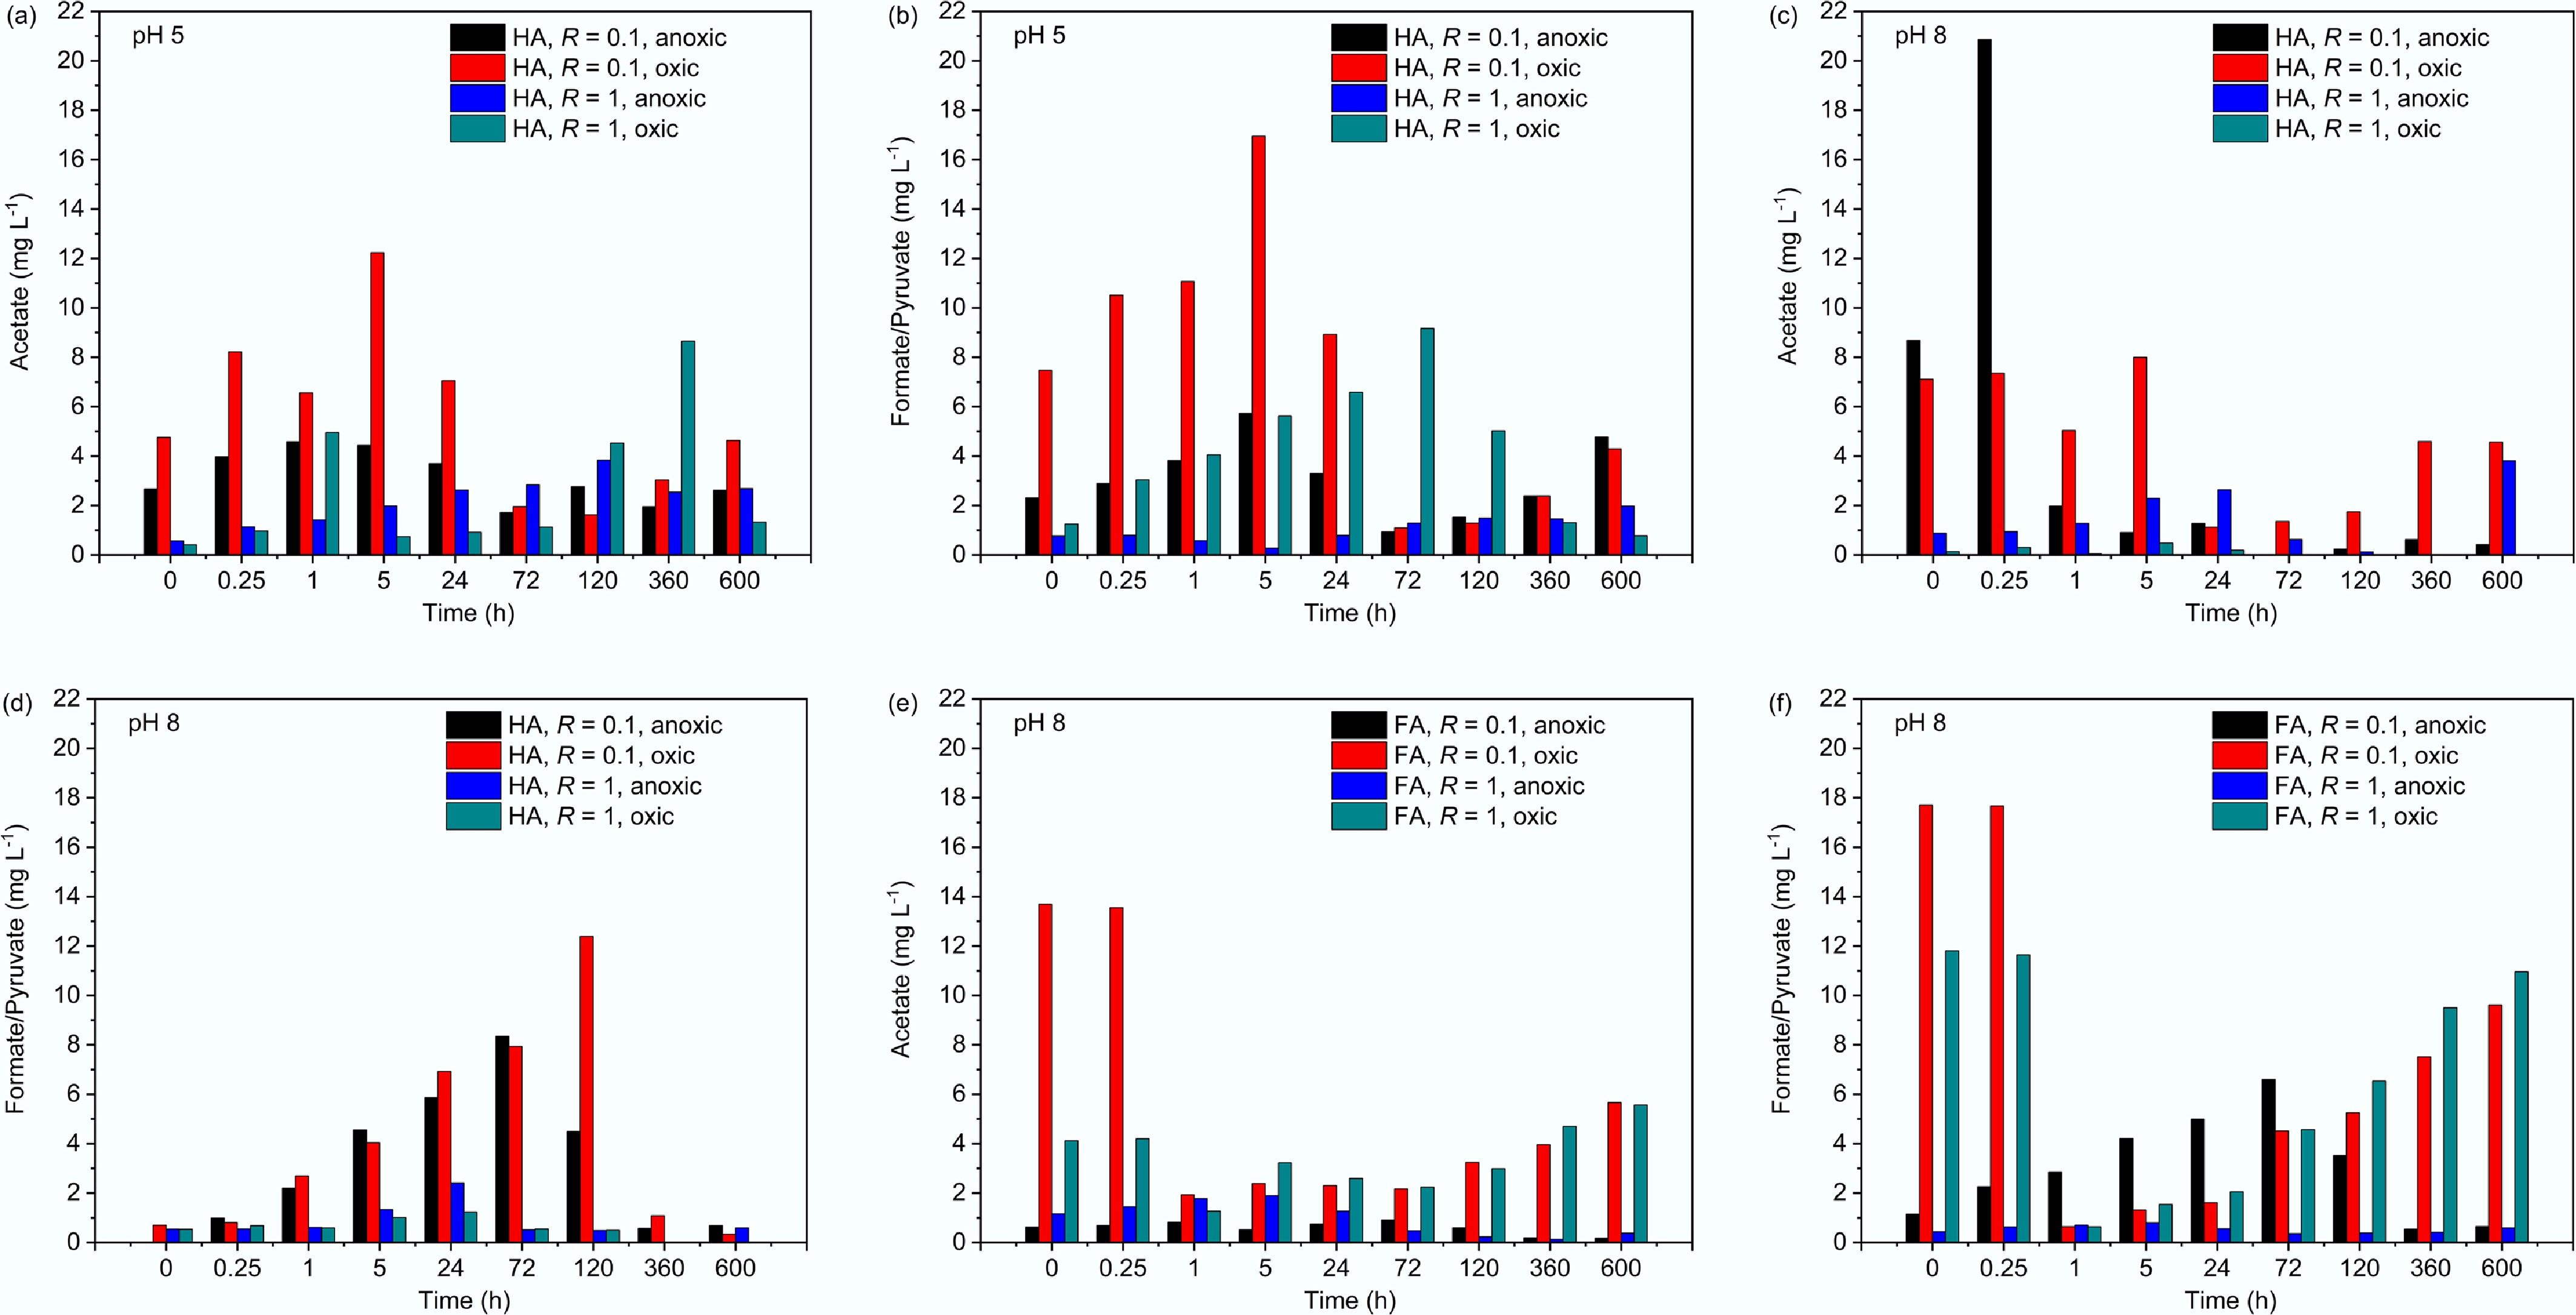
Figure 3.
(a), (c), (e) Concentrations of acetate and (b), (d), (f) formate/pyruvate at different reaction times at pH 5 and 8 with R = 0.1 and 1 under anoxic or oxic conditions. Note: pyruvate had a retention time similar to formate, which makes them indistinguishable by ion chromatography.
-
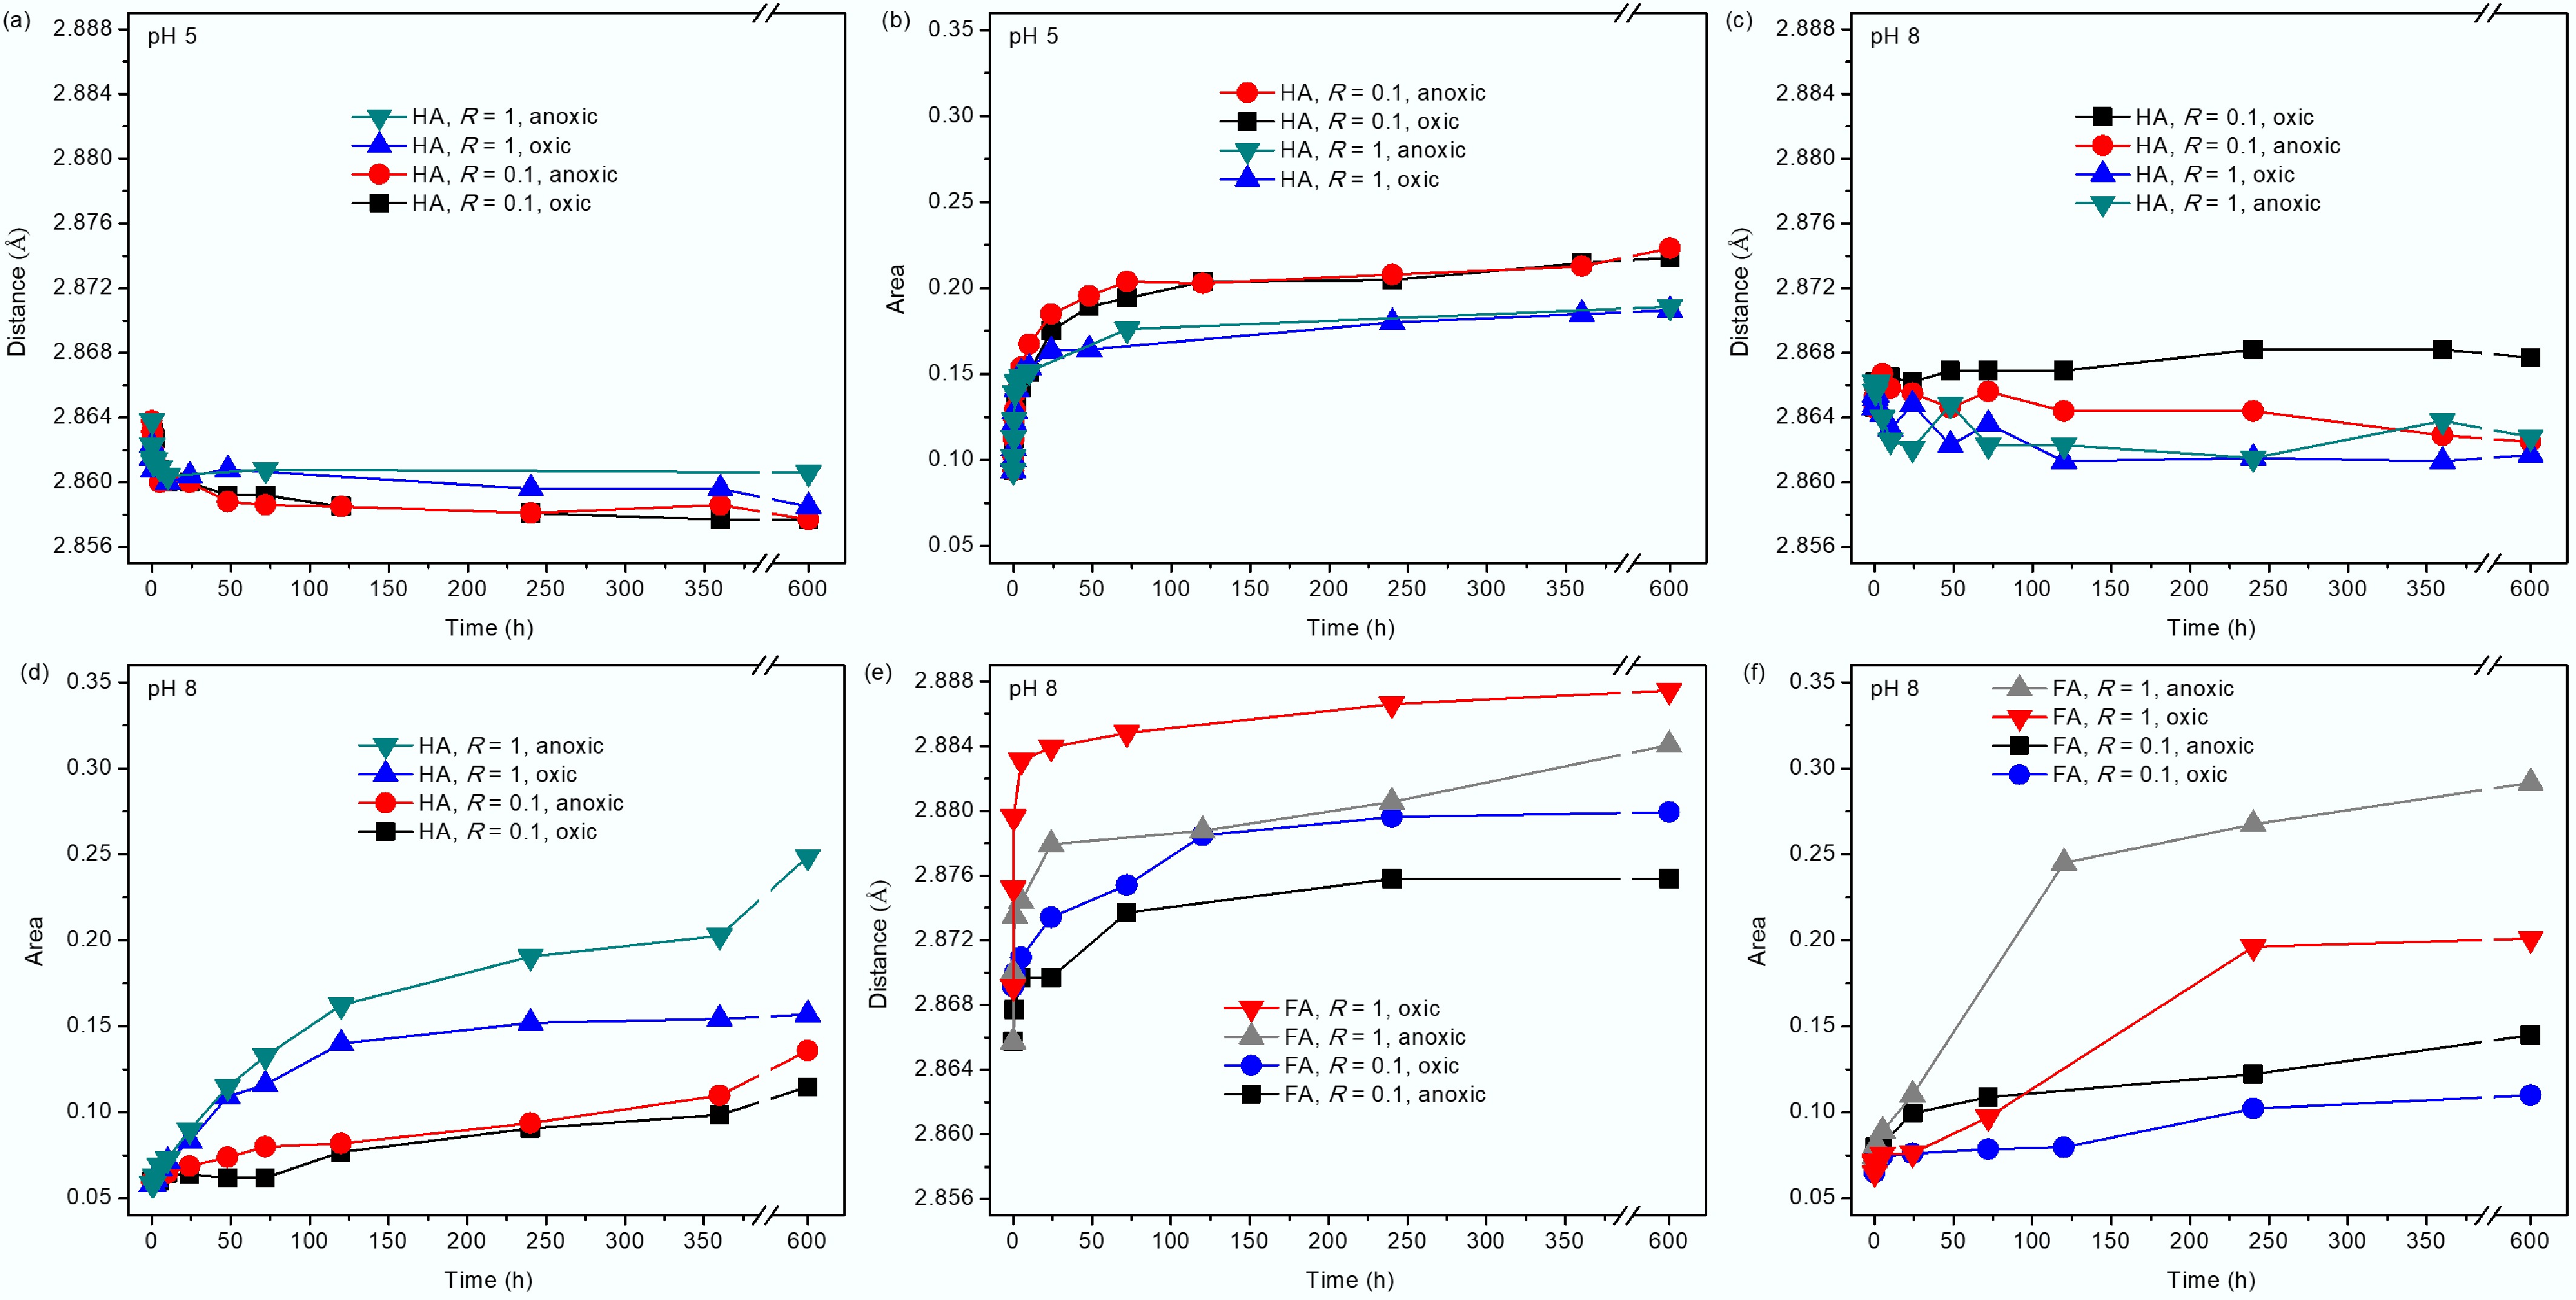
Figure 4.
(a), (c), (e) The MnL–MnL distance, and (b) (d), (f) the area of the MnL–MnIL peak at ~5.3 Å derived from PDF for δ-MnO2 reacted with HA or FA at pH 5 and 8 with R = 0.1 and 1. The results for the FA systems under anoxic conditions were reported in Wang et al.[12].
-
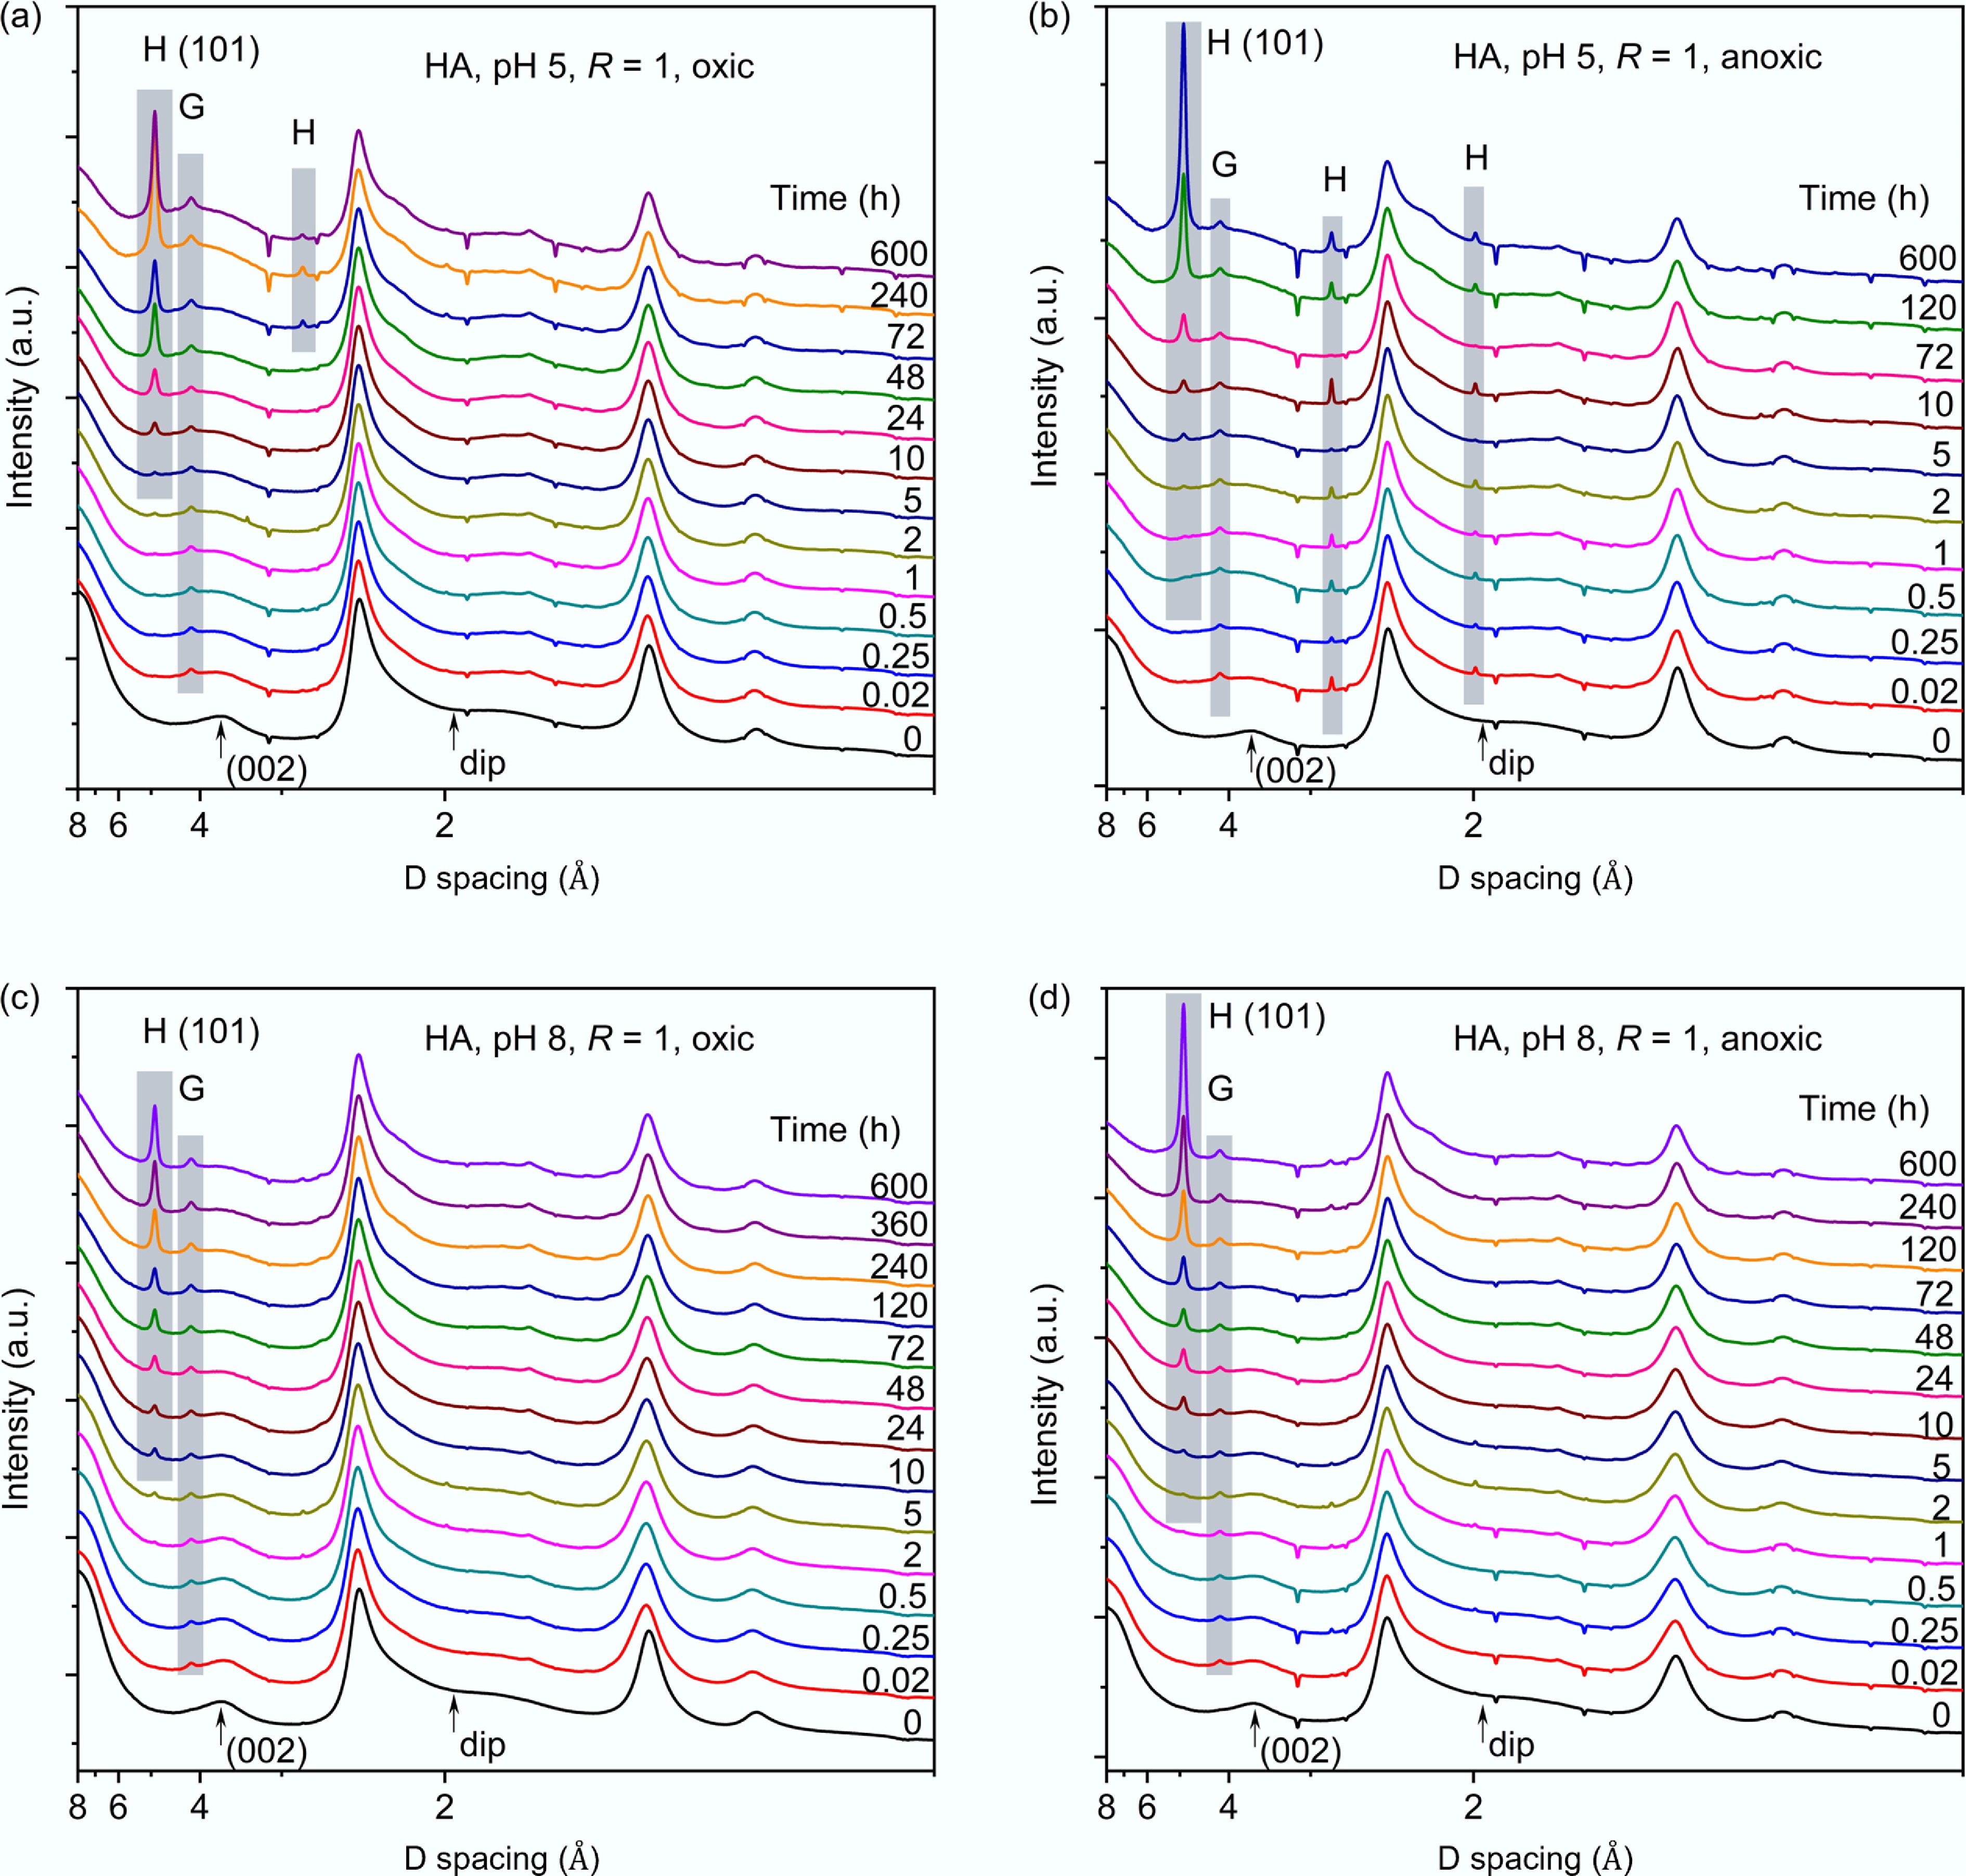
Figure 5.
Synchrotron-based XRD patterns of δ-MnO2 reacted with humic acid (HA) at (a), (b) pH 5 and (c), (d) pH 8 with R = 1. Labels H and G represent hausmannite and groutite, respectively. Note that the inverse peaks in the patterns were caused by subtracted by ceria (CeO2) standard signal remaining in the empty Kapton capillary.
-
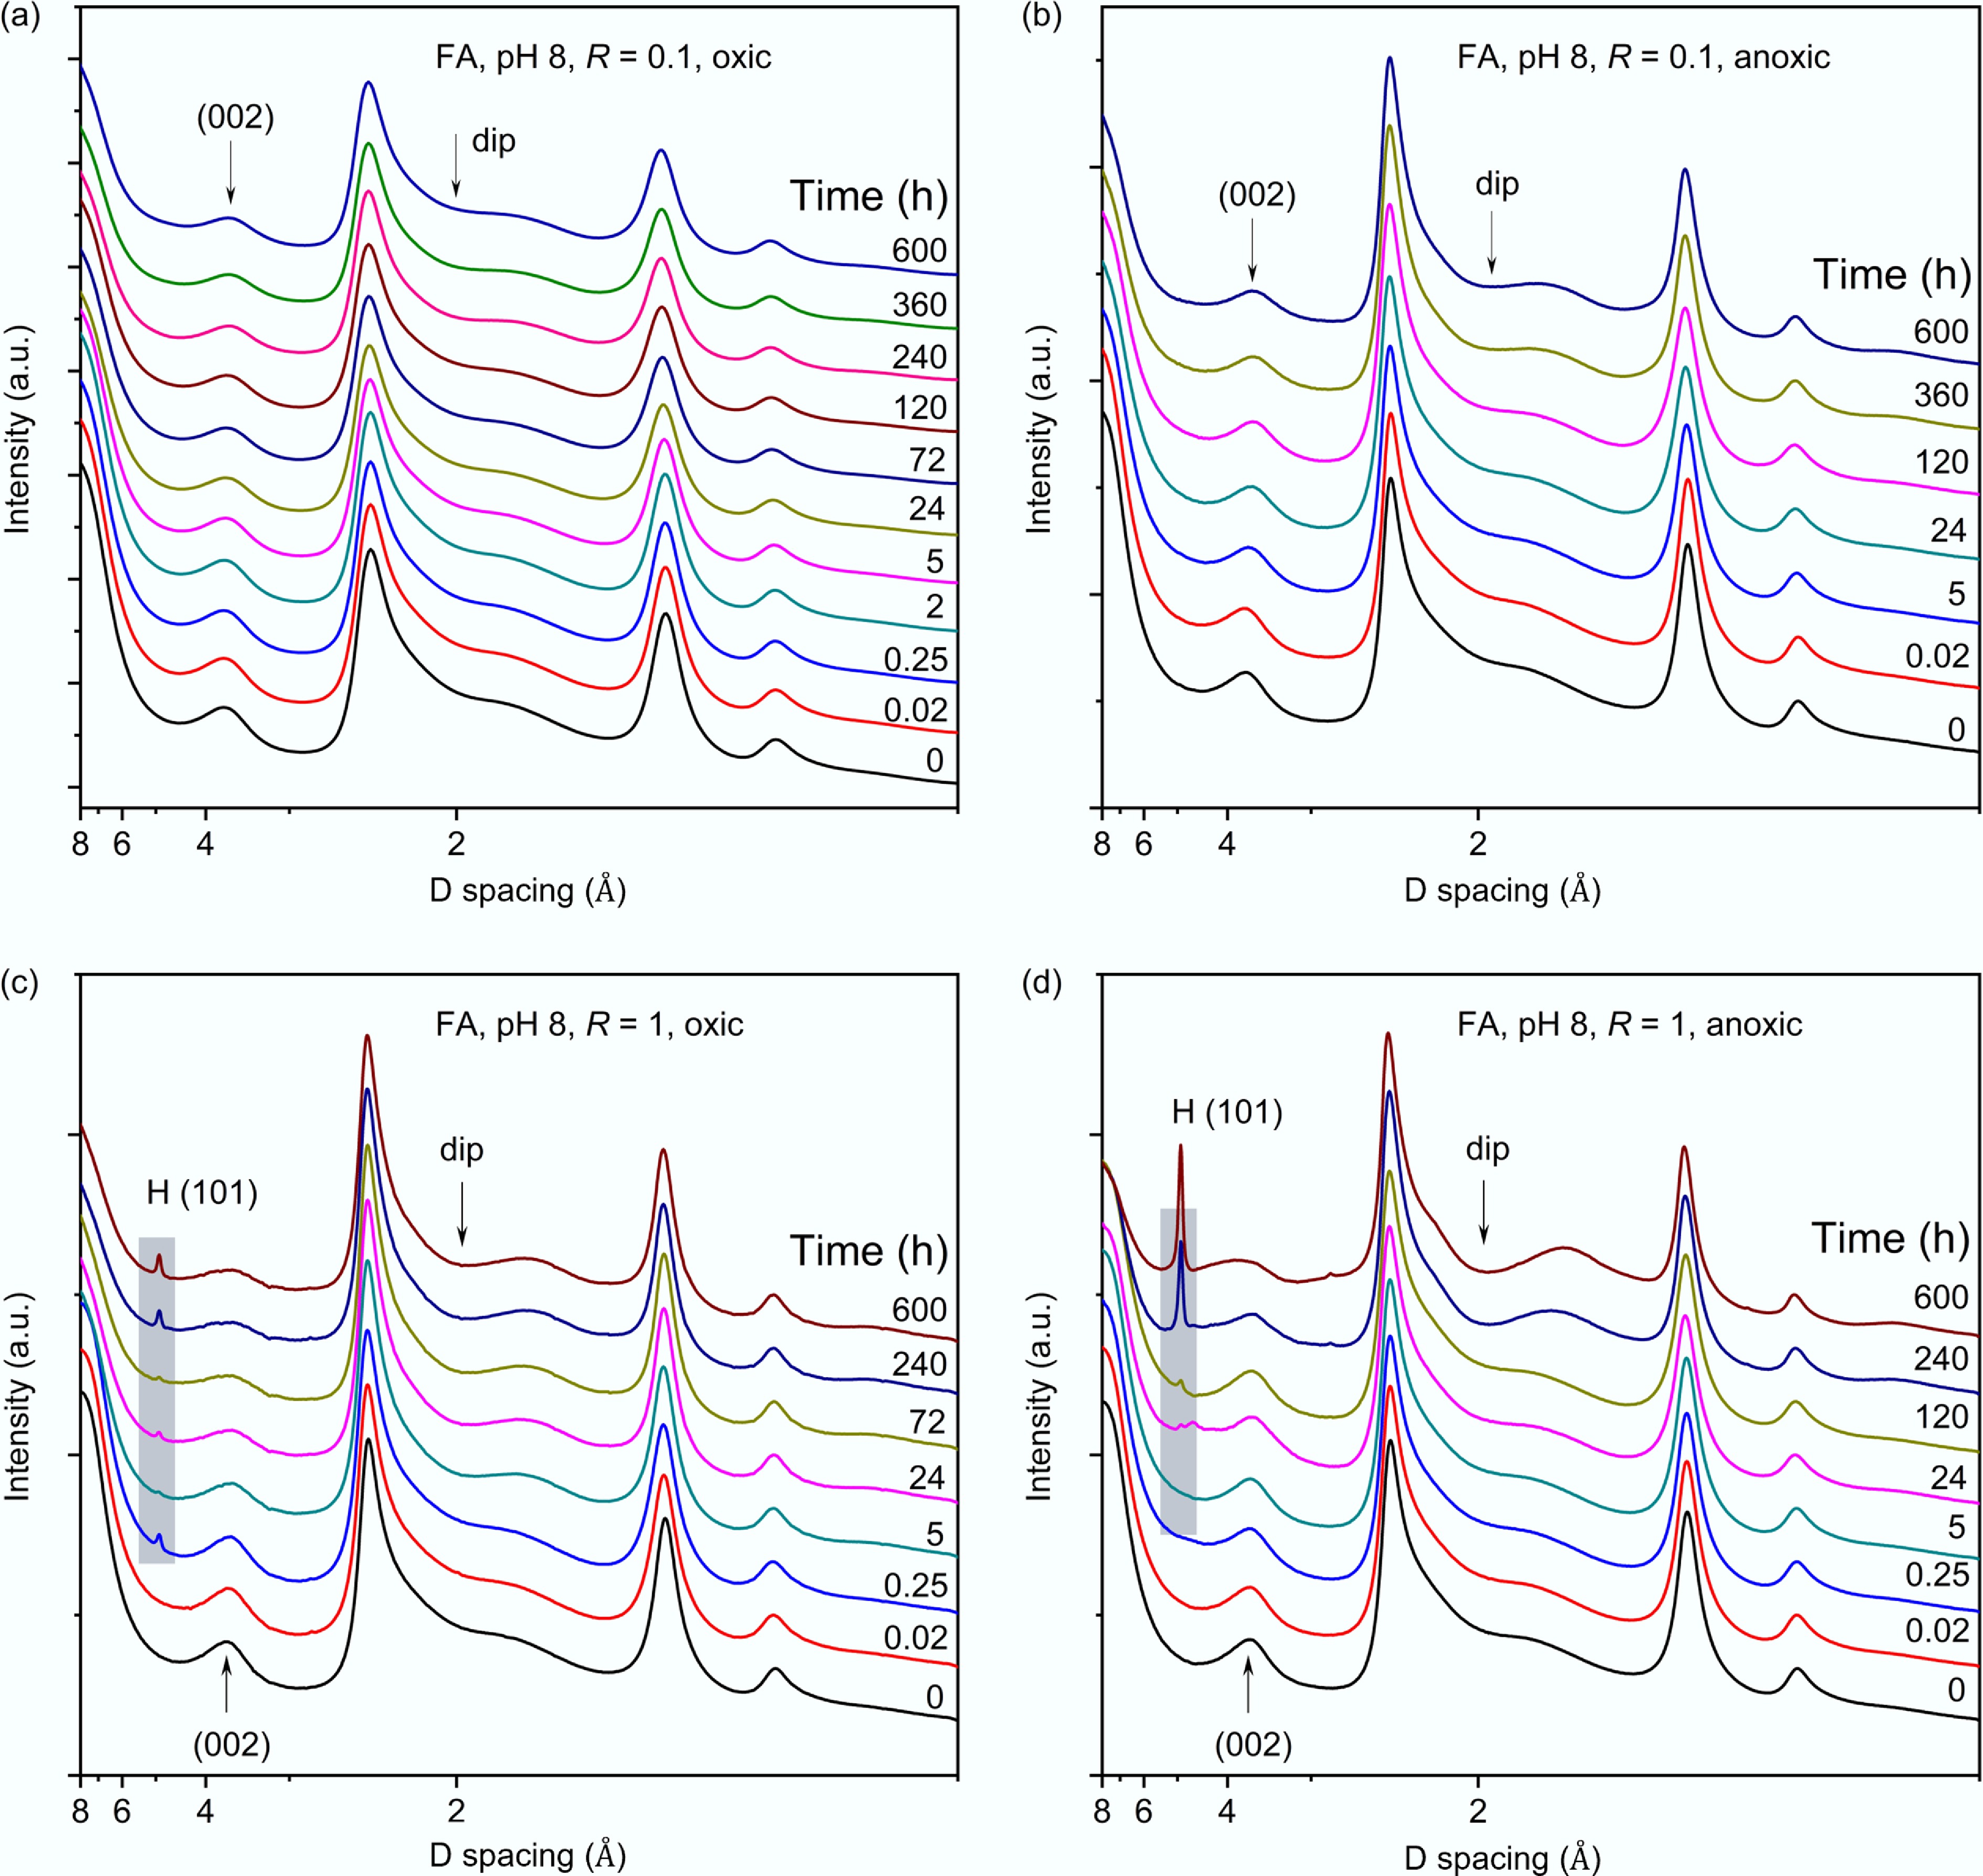
Figure 6.
Synchrotron-based XRD patterns of δ-MnO2 reacted with FA at (a), (b) pH 8 with R = 0.1, or (c), (d) R = 1, under oxic or anoxic conditions. The arrow and the label H indicate the position of the dip and the characteristic peak of hausmannite, respectively. Data for anoxic conditions were adopted from Wang et al.[12].
-
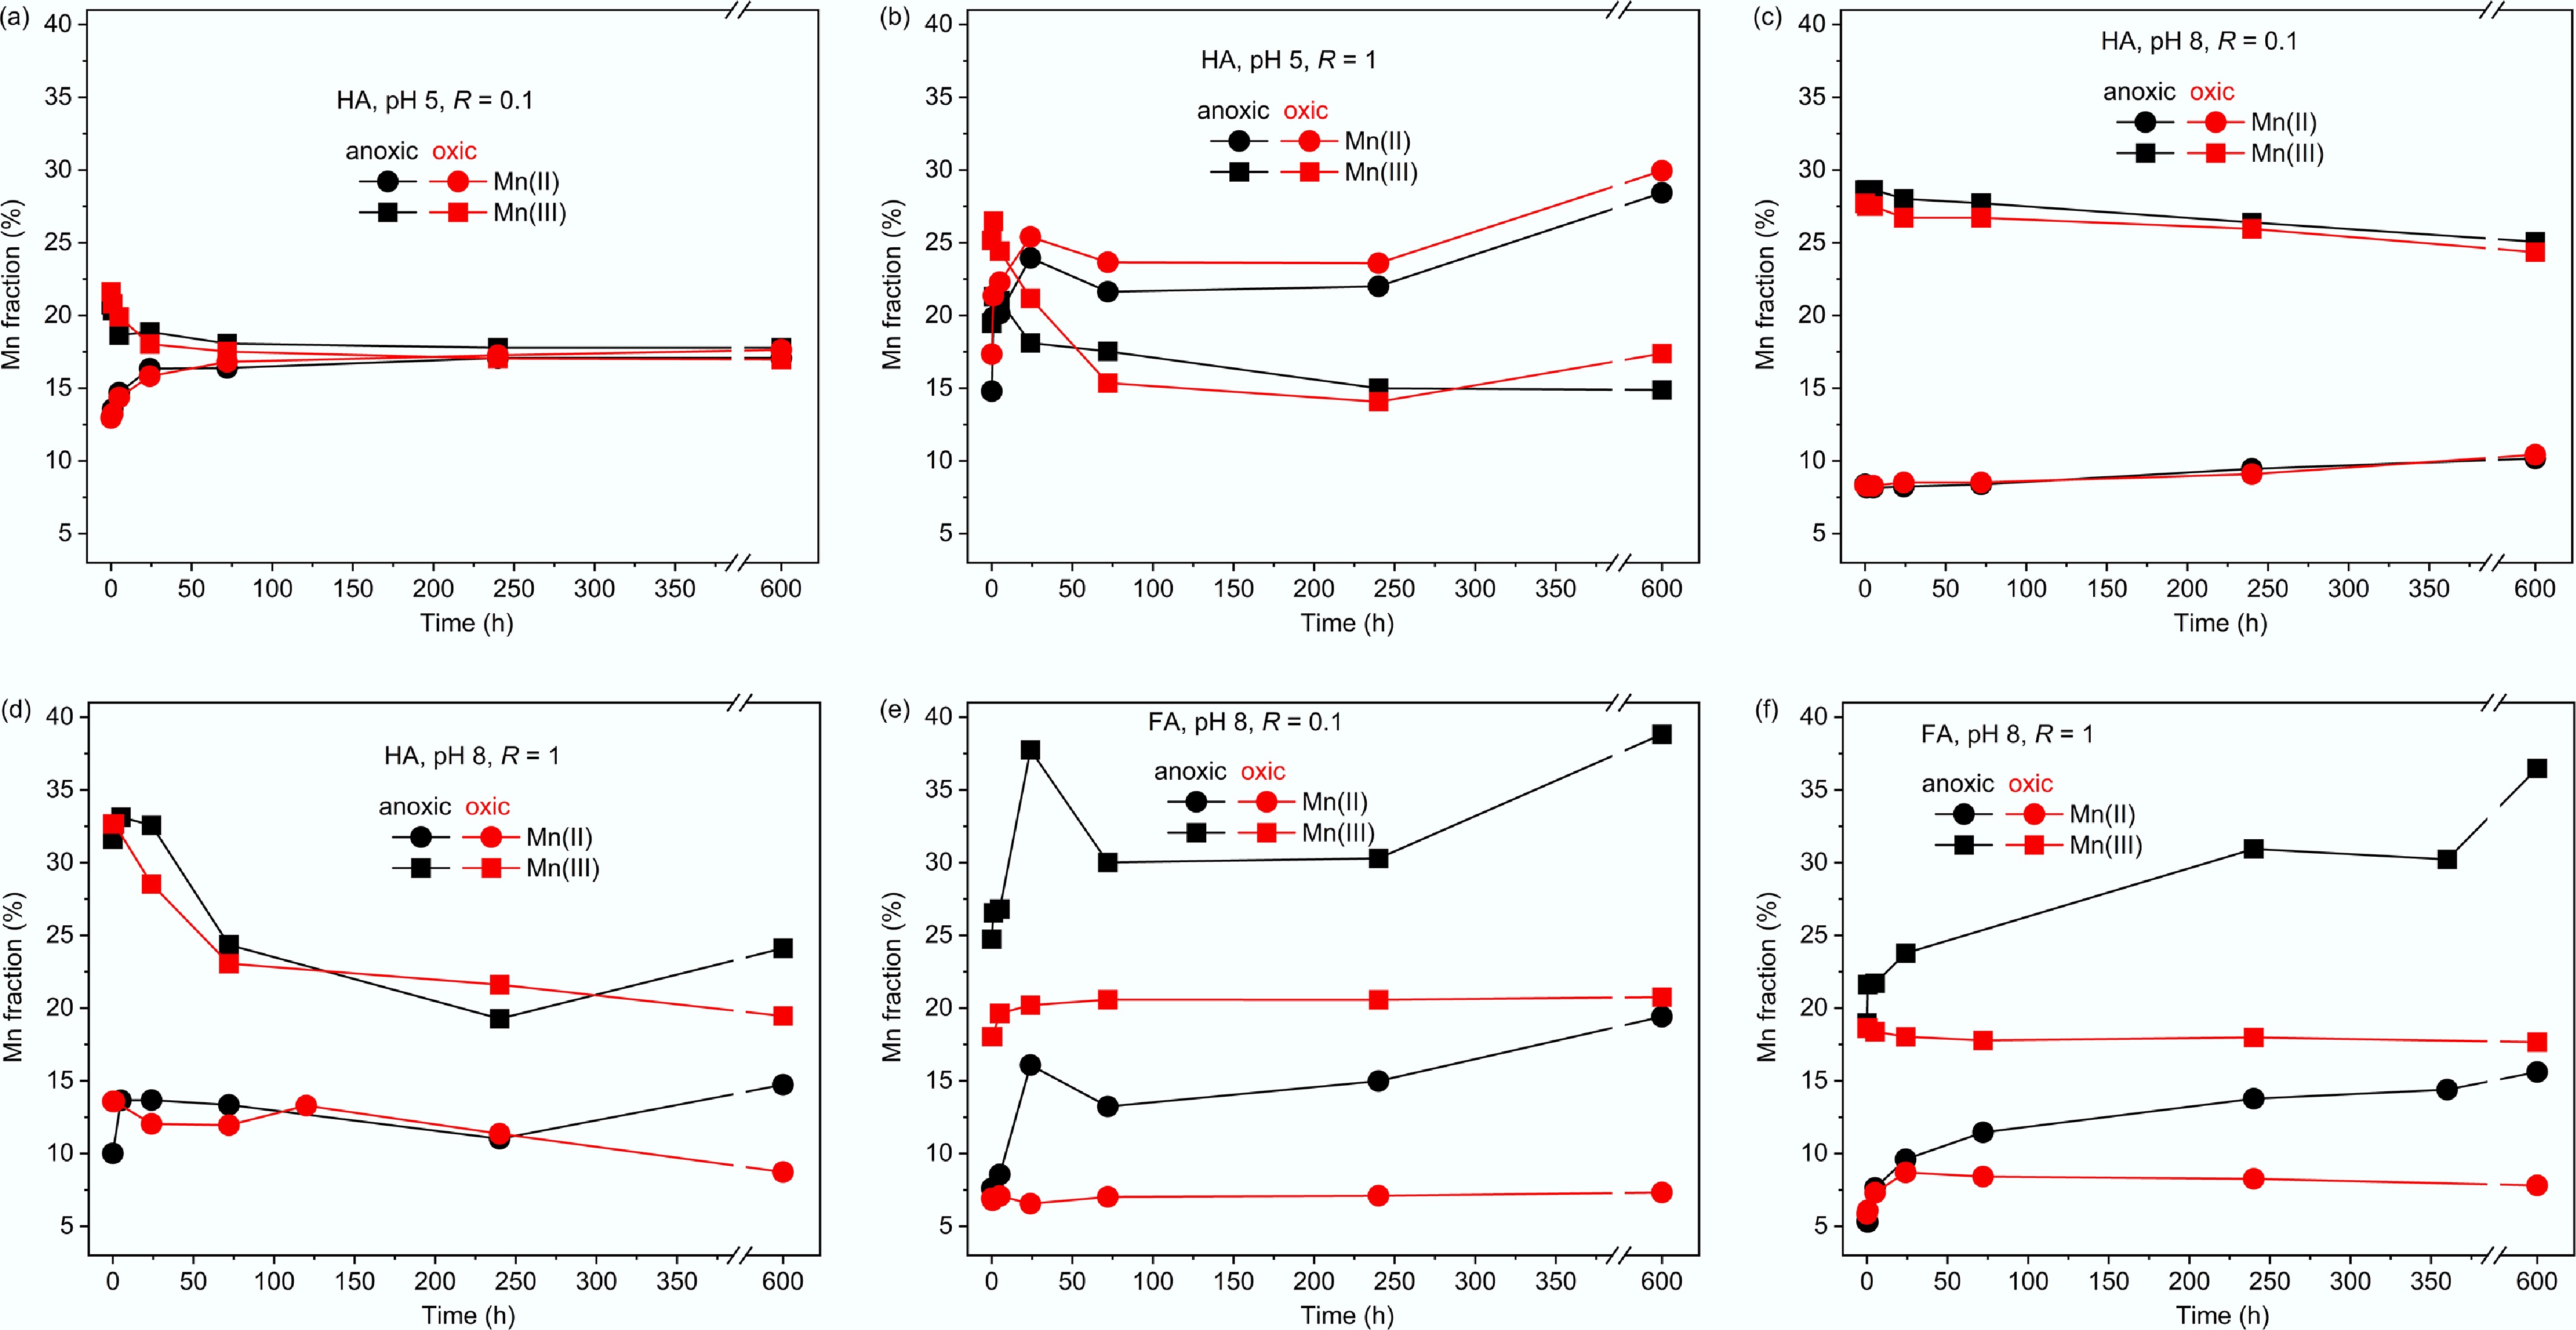
Figure 7.
Mn K-edge XANES LCF-estimated molar fractions of Mn(II) and Mn(III) in δ-MnO2 reacted with DOM at pH 5 and 8 with (a), (c), (e) R = 0.1 or (b), (d), (f) R = 1 under oxic or anoxic conditions. The molar fraction of Mn(IV) is omitted for clarity of Mn(II) and Mn(III) changes. Refer to Supplementary Fig. S4 for LCF analysis.
Figures
(7)
Tables
(0)