-
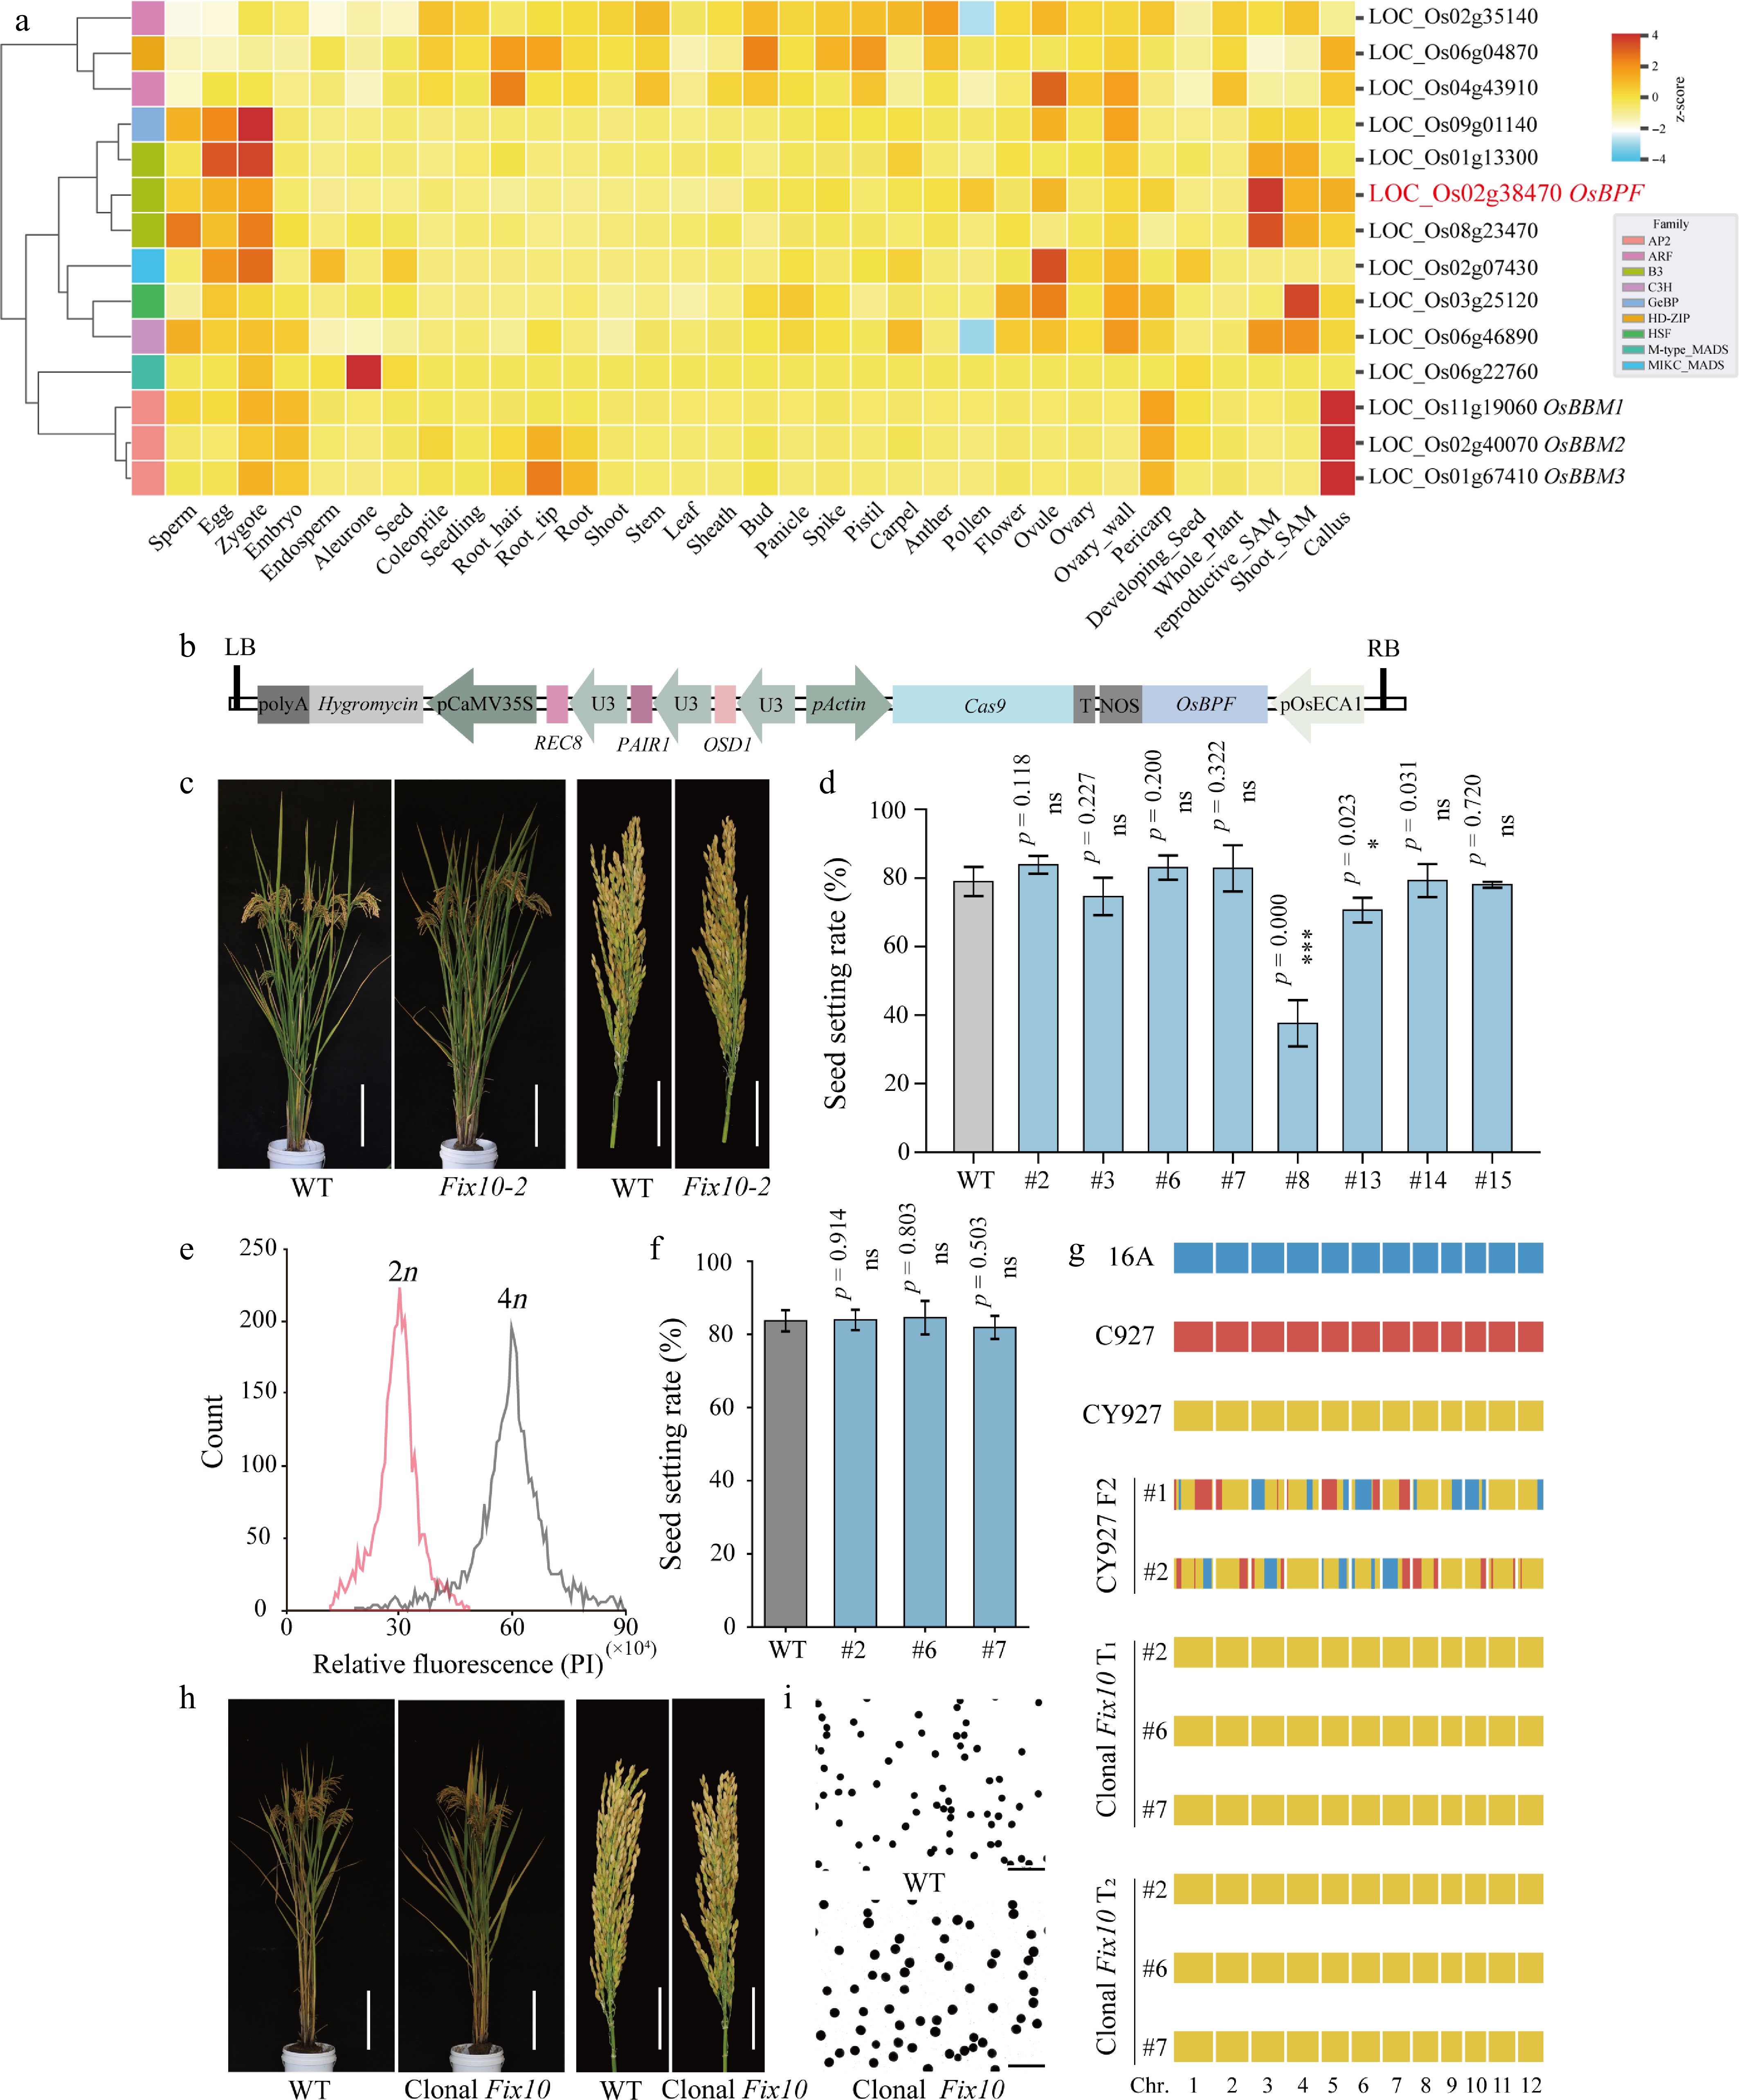
Figure 1.
OsBPF enables high-fertility synthetic apomixis in hybrid rice. (a) Heatmap of 14 zygote-enriched transcription factors across various rice tissues. The Z-score indicates the relative expression level; "Family" indicates the transcription factor family. (b) Diagram of the vector design integrating MiMe with the ectopic expression of OsBPF. (c) Plant morphology and panicles of wild-type (WT) and Fix10. Scale bars, 20 cm for plants, 5 cm for panicles. (d) Seed-setting rate of Fix10 plants (T0). Each bar represents an individual plant; three panicles per plant were measured as technical replicates, and the mean value is shown. Bars show the mean ± standard deviation (SD) (n = 3). For T0 events, independent two-sample Student's t-tests are used only as exploratory event-level comparisons to identify well-performing lines, not as formal population-level inference. * p < 0.05; *** p < 0.001; ns, not significant. (e) Flow cytometry analysis of ploidy levels in the offspring of Fix10. Red peaks: 2C diploid (WT and clonal progeny); black peaks: 4C tetraploid (nonclonal progeny). PI, propidium iodide. (f) Seed-setting rate of Fix10 plants (T1). Each bar represents an individual T1 plant; three panicles per plant were measured as technical replicates, and the mean value is shown. Bars show the mean ± SD (n = 3). For T1 events, independent two-sample Student's t-tests were used; ns, not significant. (g) Whole-genome sequencing of hybrid rice CY927, its parents 16A and C927, F2 progeny, and clonal Fix10 plants (T1 and T2 generations). Blue, 16A alleles; red, C927 alleles; yellow, heterozygous alleles across the 12 chromosomes. (h) Comparison of the plant morphology and panicles of WT and clonal Fix10 plants. Scale bars, 20 cm for plants and 5 cm for panicle. (i) Comparison of pollen viability between WT and Fix10 revealed via iodine staining. Scale bars, 200 µm.
Figures
(1)
Tables
(0)