-
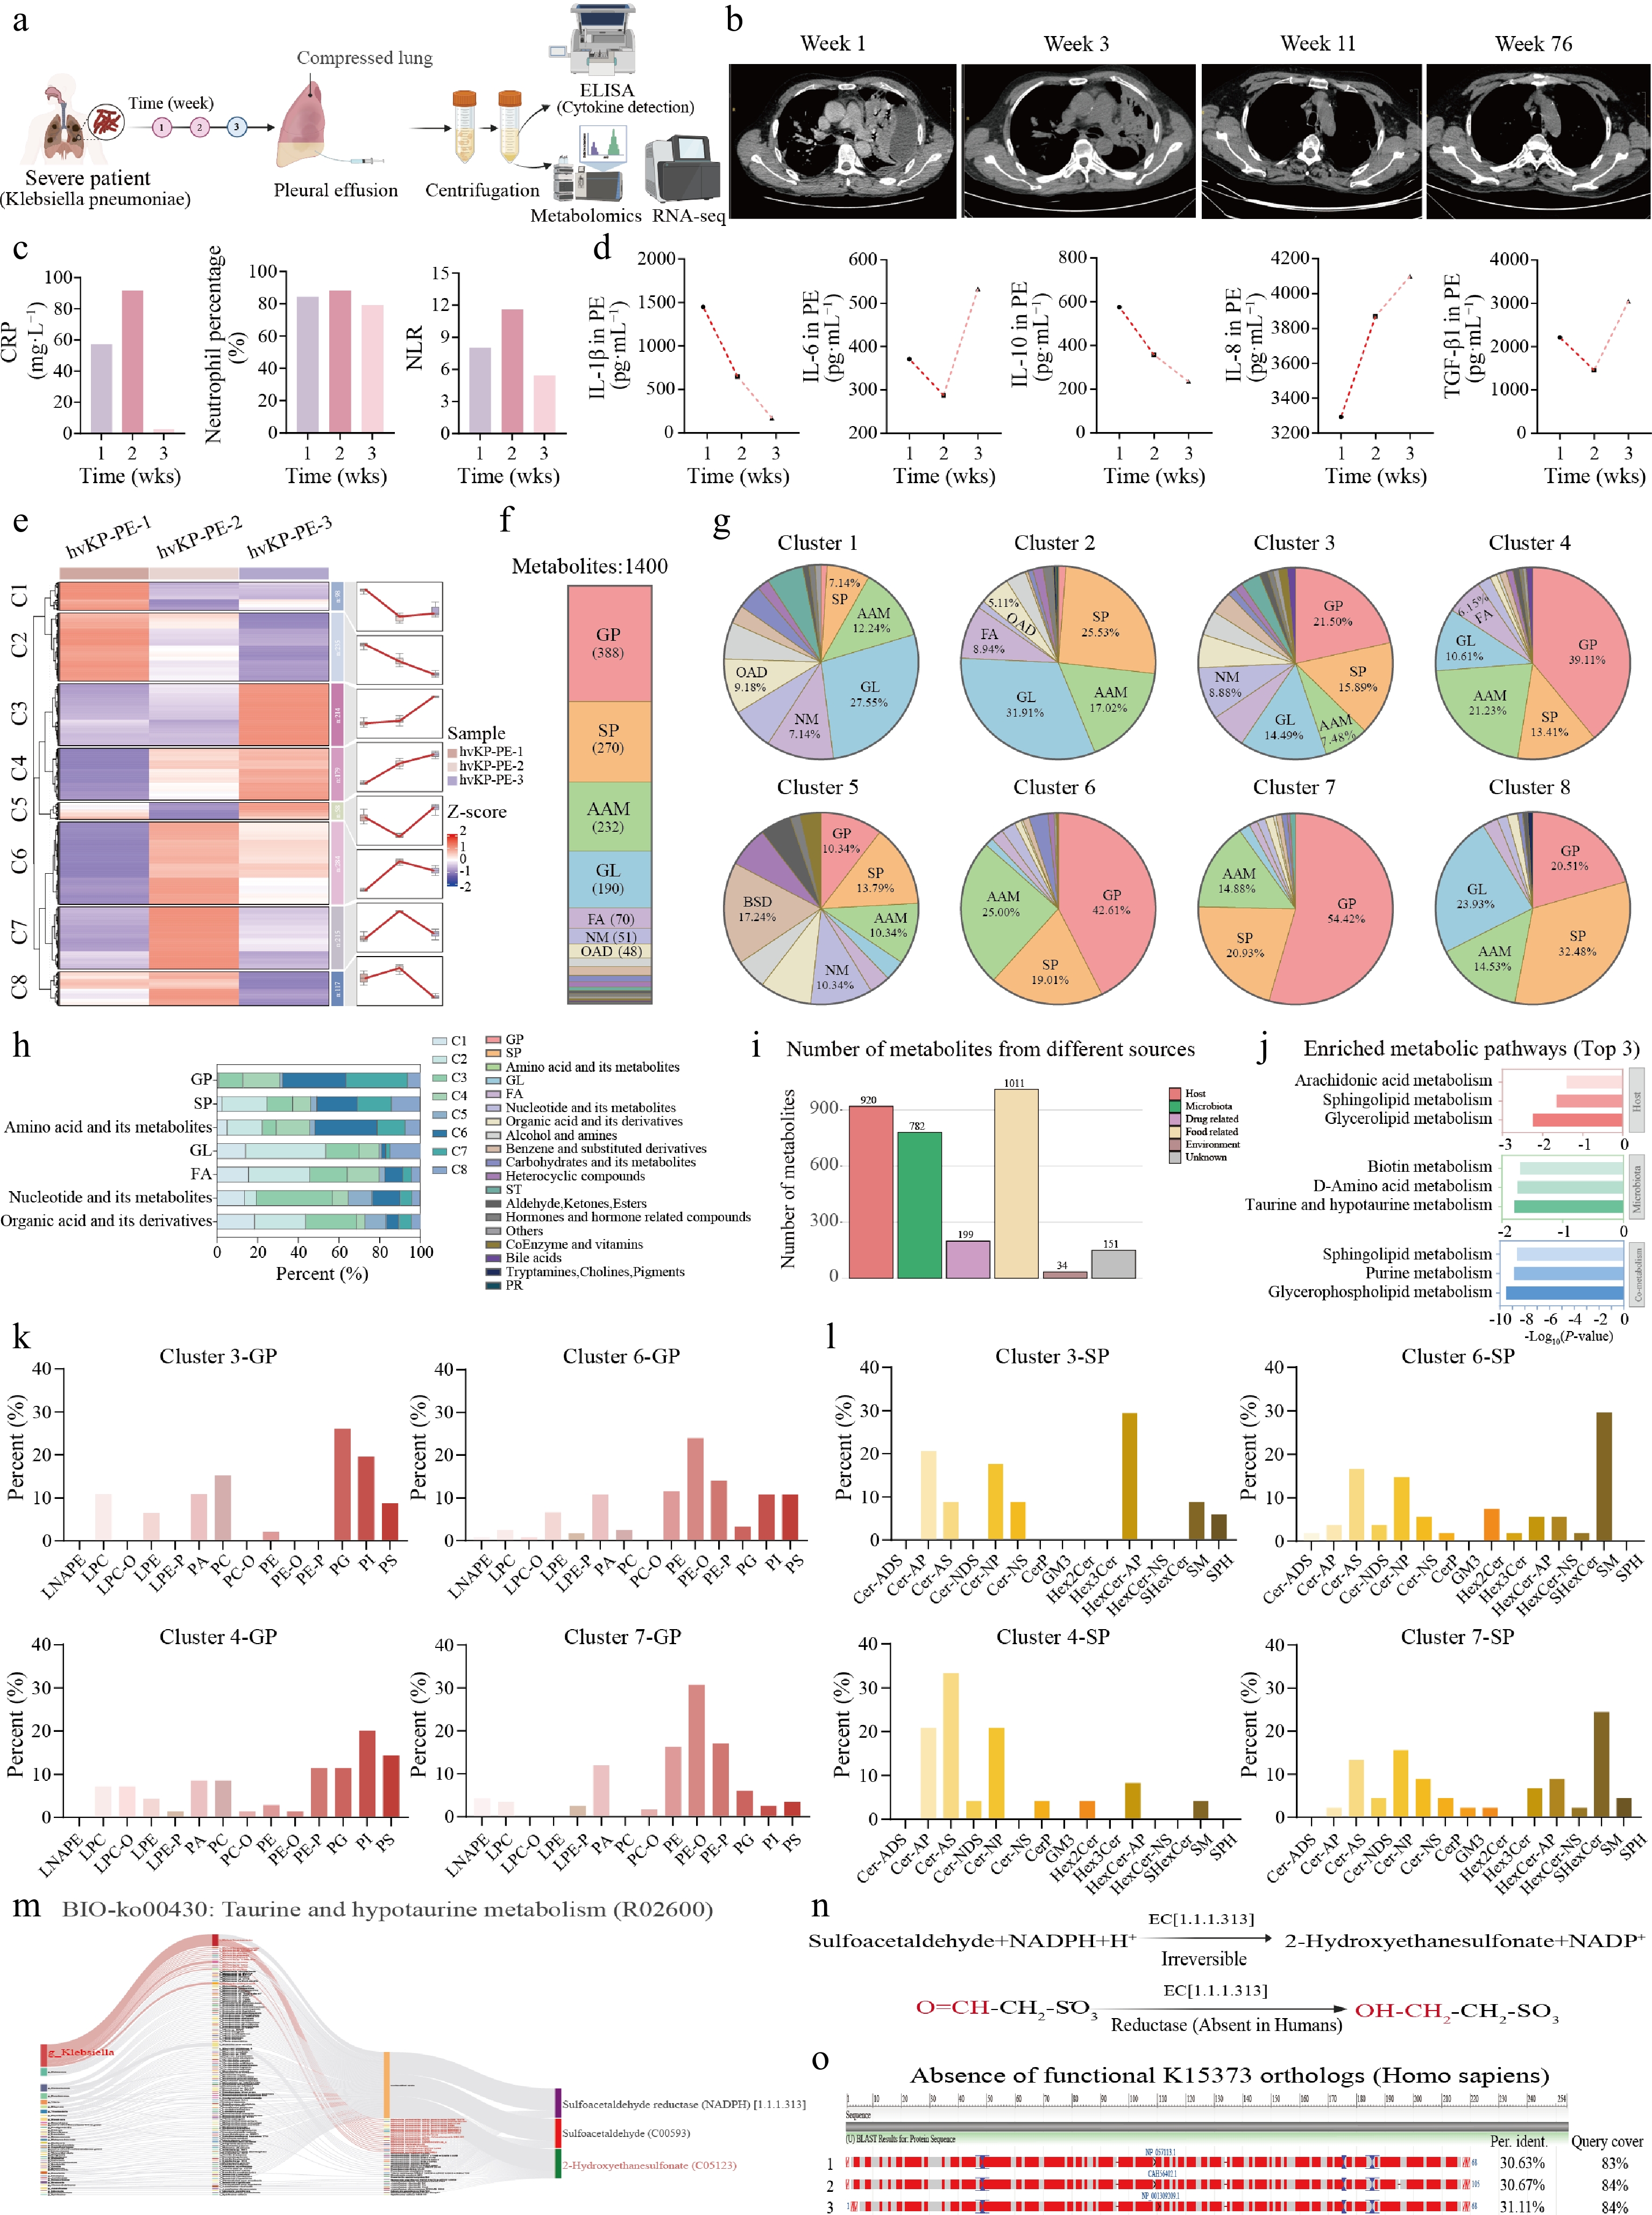
Figure 1.
Longitudinal untargeted metabolomic profiling identifies taurine-driven host-microbiota co-metabolism as a hallmark signature of Klebsiella pneumoniae empyema. (a) Schematic overview of the study design and analytical workflow. (b) Representative chest CT scans at weeks 1, 3, 11, and 76. (c) Temporal profiles of CRP, neutrophil percentage, and NLR. (d) ELISA quantification of five cytokines (IL-1β, IL-6, IL-10, IL-8, TGF-β1) in pleural fluid across three time points. (e) K-means clustering heatmap of differential metabolites partitioned into eight temporal clusters (C1–C8), with centroid trajectory line plots. (f) Superclass composition of all identified metabolites. (g) Pie charts of superclass composition within each cluster (clusters 1−8). (h) Stacked bar chart of cluster contribution to each superclass. (i) MetOrigin-based assignment of metabolites by biological source. (j) KEGG pathway enrichment analysis (Top 3) stratified by metabolite source. Subclass composition within selected temporal clusters: (k) glycerophospholipid (GP) subclasses; and (l) sphingolipid (SP) subclasses. (m) KEGG pathway map (map00430) of taurine and hypotaurine metabolism. (n) Catalytic reaction of bacterial sulfoacetaldehyde reductase. (o) BLASTp alignment demonstrating the absence of functional K15373 orthologs in the human genome.
-
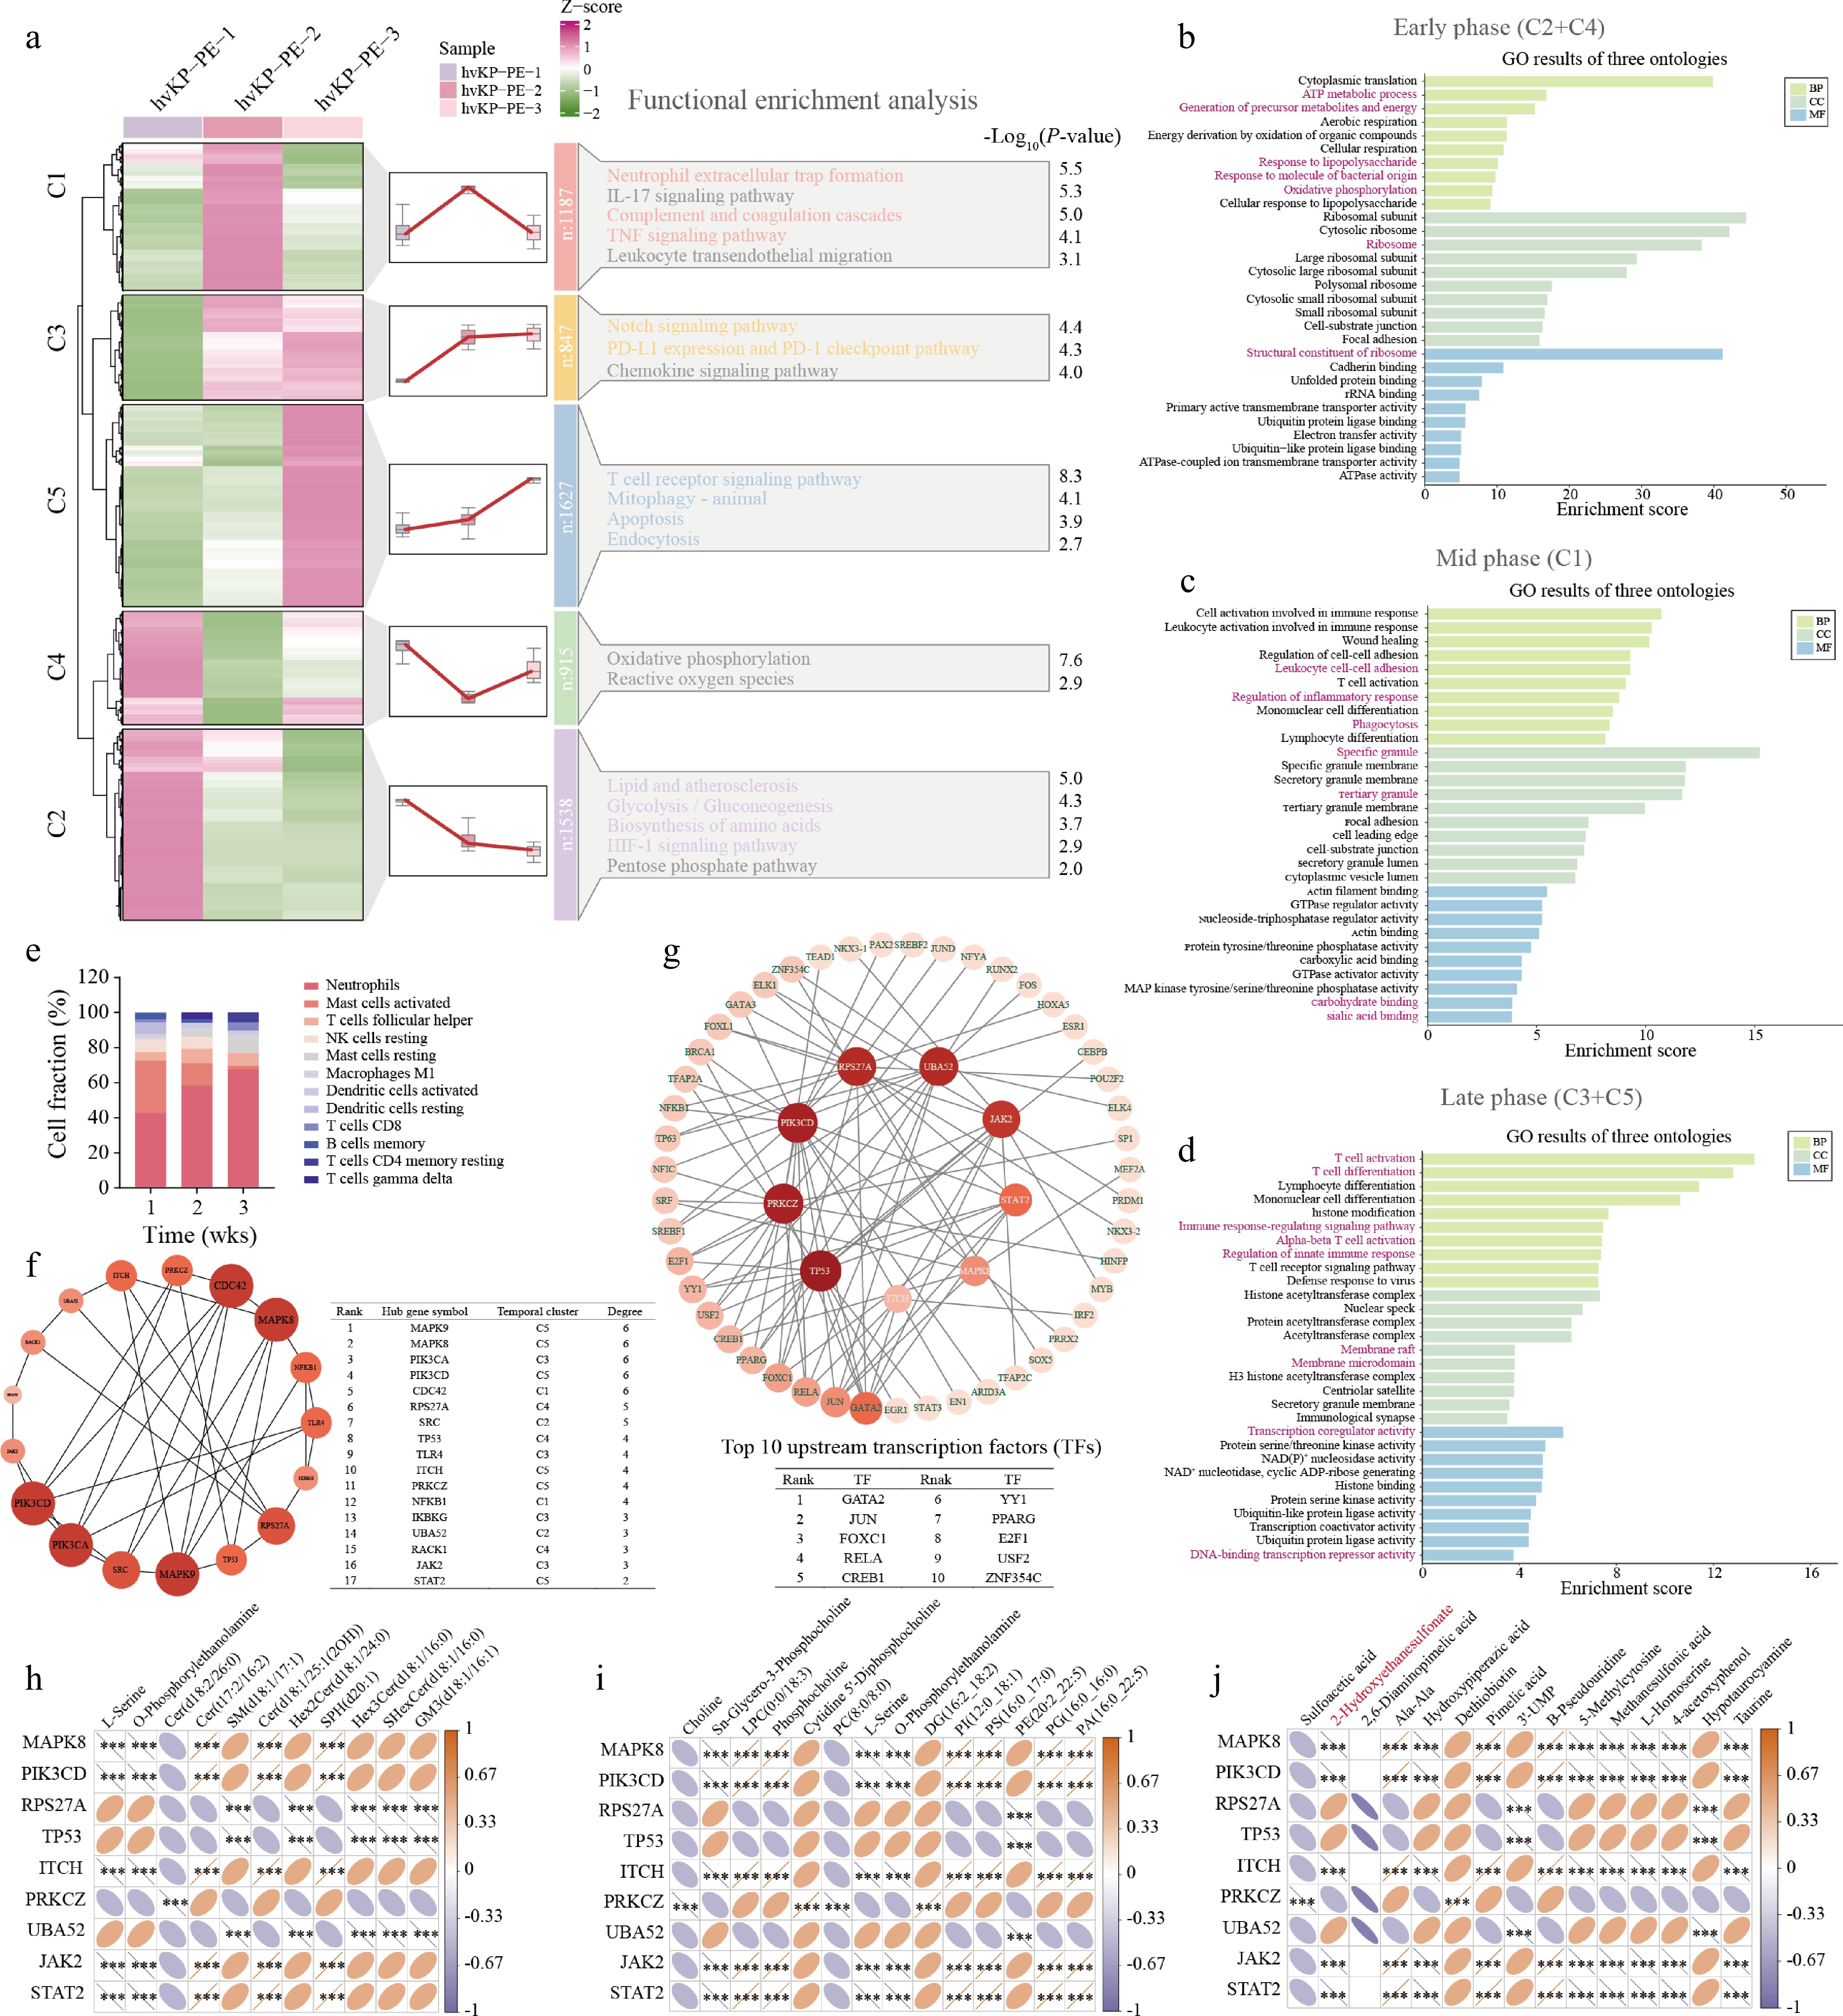
Figure 2.
Transcriptomic dynamics in the empyema microenvironment identify a nine-gene hub network driving inflammatory and metabolic remodeling. (a) Mfuzz temporal clustering heatmap displaying Z-score-normalized gene expression. Top 10 enriched gene ontology (GO) terms across biological process (BP), cellular component (CC), and molecular function (MF) categories for the (b) early phase (clusters C2 + C4), (c) mid phase (cluster C1), and (d) late phase (clusters C3 + C5). (e) Stacked bar chart depicting relative fractions of immune cell subpopulations inferred by CIBERSORTx across three time points. (f) PPI subnetwork diagram of phenotype-associated genes with an accompanying table listing top 17 hub genes ranked by betweenness centrality (degree threshold ≥ 2). (g) Upstream transcription factor (TF) regulatory network constructed via NetworkAnalyst, depicting predicted master regulators and their target hub genes. Spearman correlation matrices linking the expression of nine core hub genes with temporal abundances of (h) SPs, (i) GPs, and (j) microbiota/taurine-related metabolites. Color scales indicate positive (orange) and negative (blue) correlations. Statistical significance thresholds: P < 0.05; P < 0.01; P < 0.001.
-
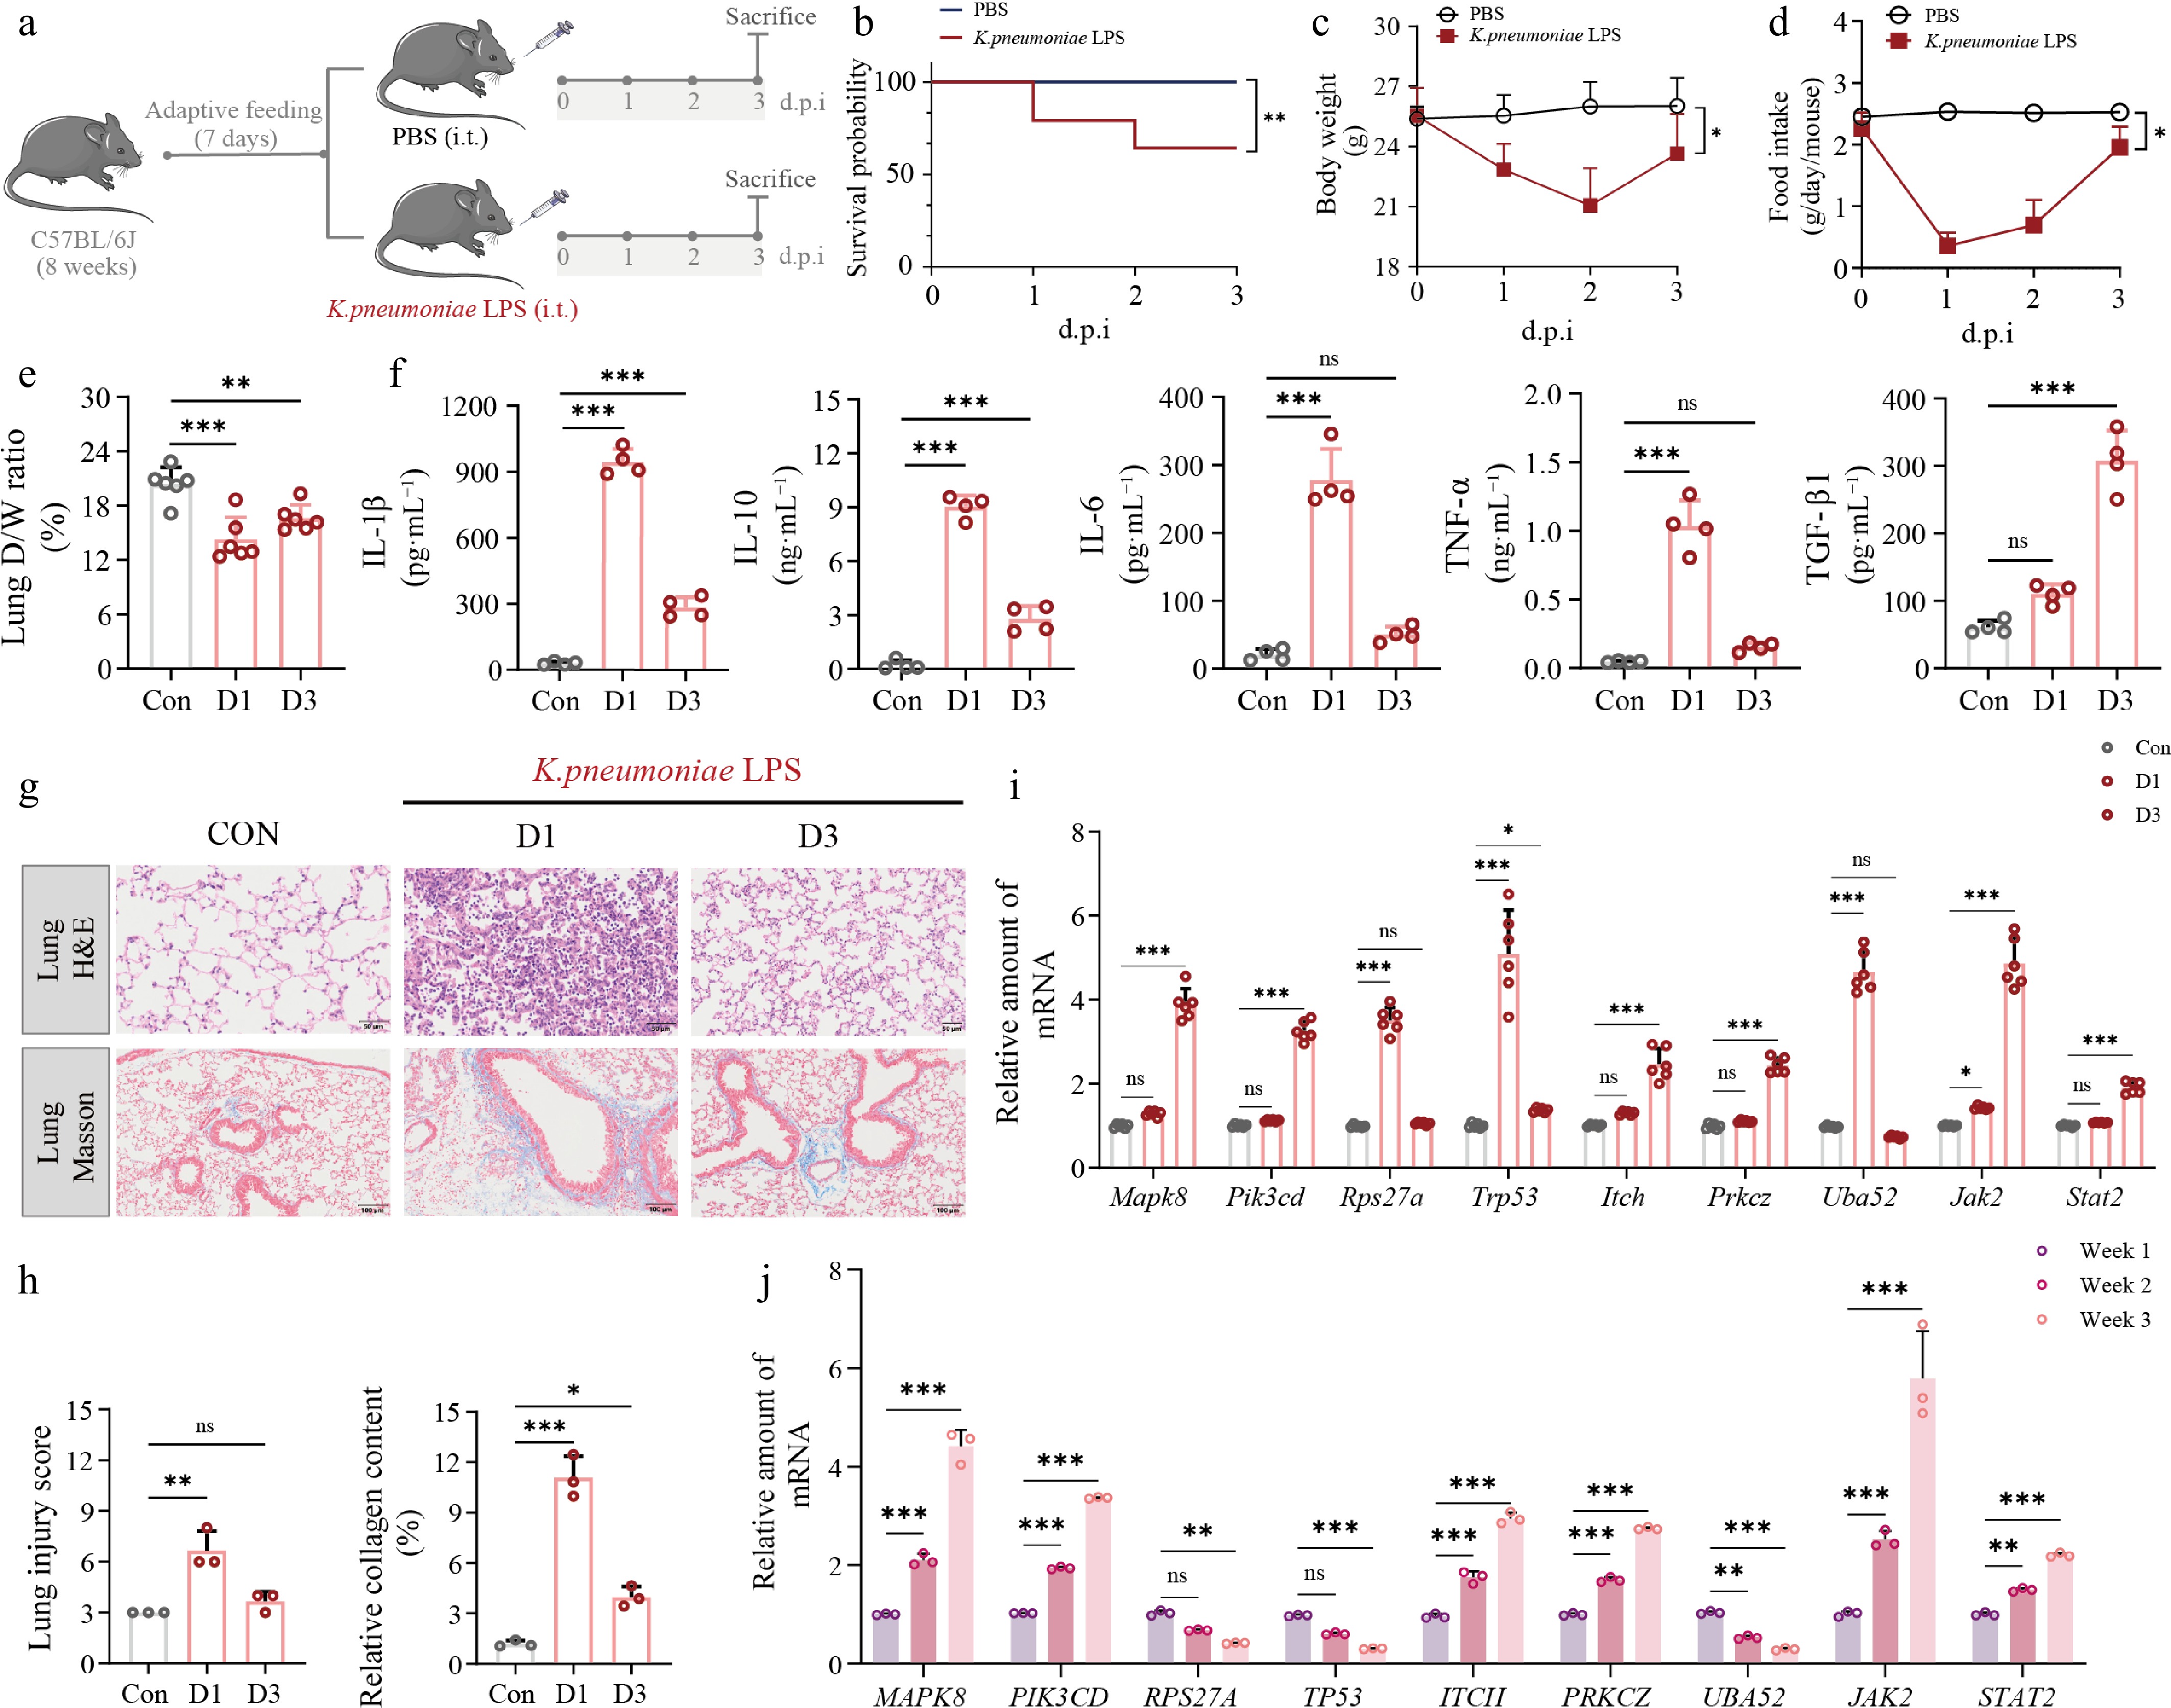
Figure 3.
In vivo characterization of K. pneumoniae LPS-induced severe pulmonary inflammation and experimental validation of hub gene dynamics. (a) Schematic diagram; (b) Kaplan–Meier survival curves; (c) body weight; (d) daily food intake over 3 d post-instillation; (e) lung dry/wet mass fraction (D/W%); (f) ELISA quantification of five cytokines (IL-1β, IL-10, IL-6, TNF-α, TGF-β1) in serum. (g), (h) Representative H&E (upper panel) and Masson trichrome (lower panel) images of lung tissue sections. Scale bars: 50 μm (H&E) and 100 μm (Masson). (i) RT-qPCR quantification of nine hub gene mRNA expression levels (Mapk8, Pik3cd, Rps27a, Trp53, Itch, Prkcz, Uba52, Jak2, Stat2) in mouse lung tissues across Control, day 1, and day 3 groups, n = 6. (j) Clinical RT-qPCR validation tracking mRNA expression dynamics of the corresponding human orthologs (MAPK8, PIK3CD, RPS27A, TP53, ITCH, PRKCZ, UBA52, JAK2, STAT2) in patient pleural fluid cells over the 3-week clinical course, n = 3. Data are presented as mean ± SD. Statistical significance: P < 0.05; P < 0.01; P < 0.001 vs Control; ns, not significant.
-
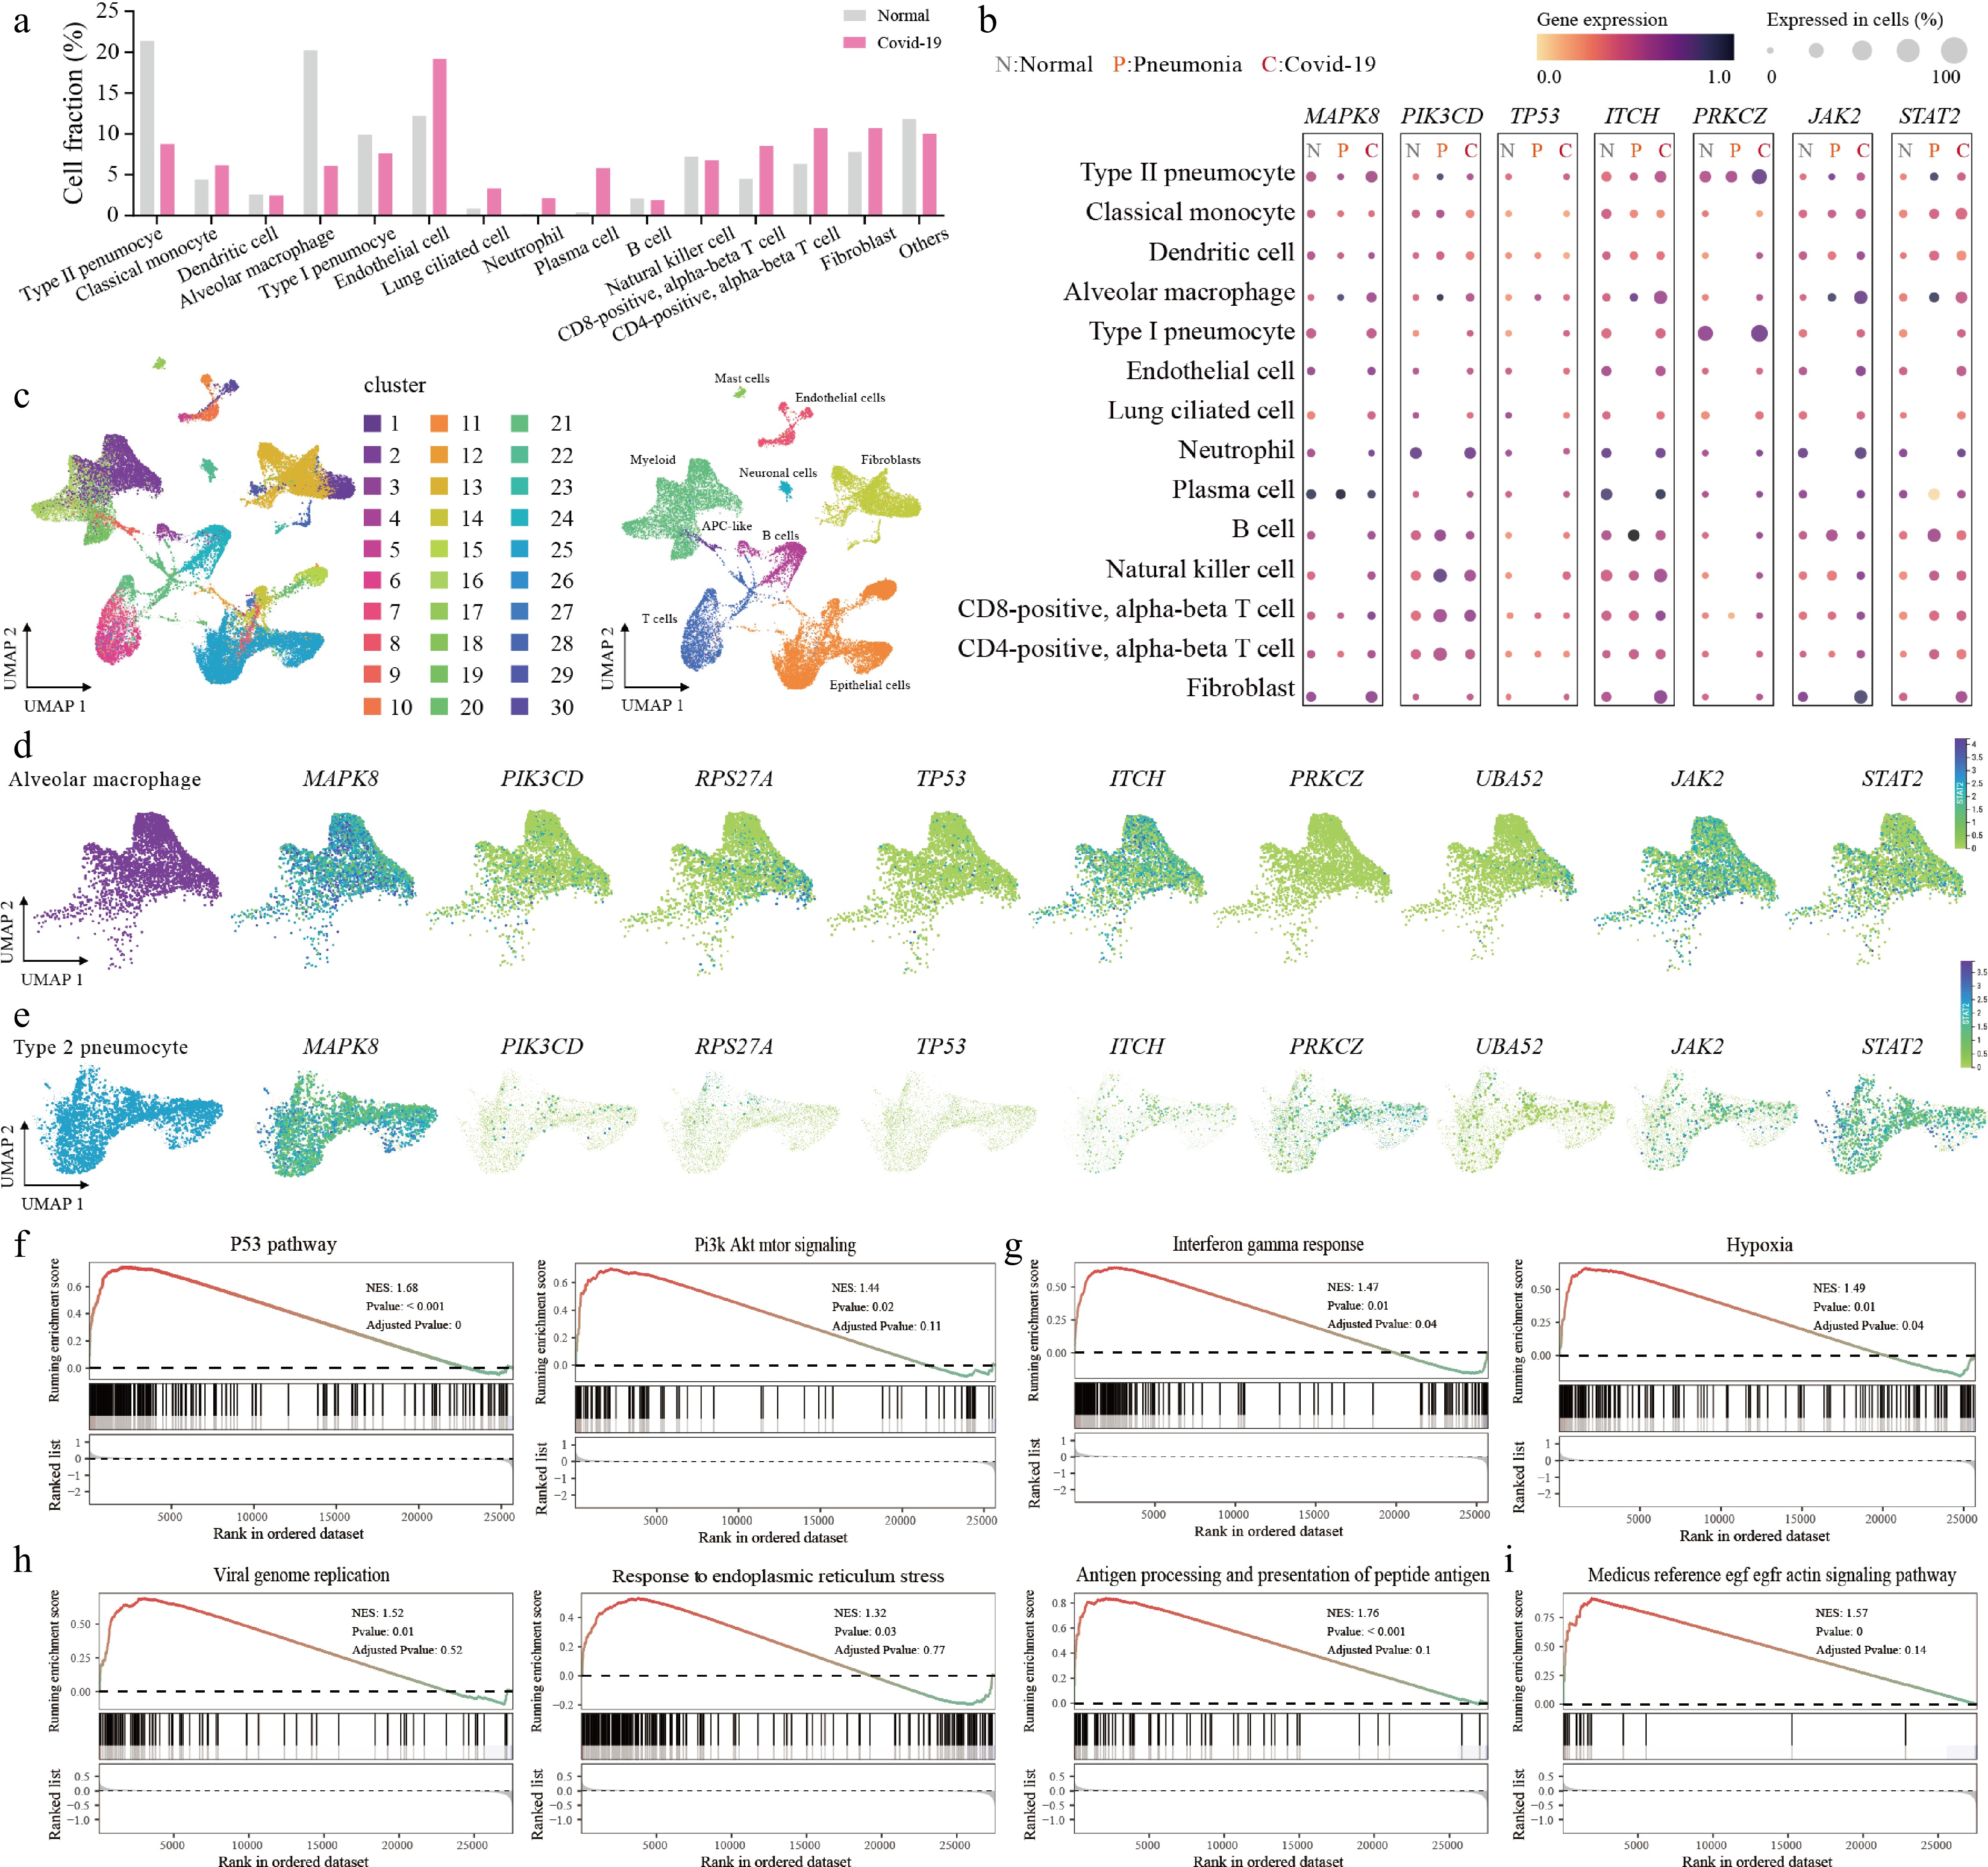
Figure 4.
Single-cell mapping unveils dual-compartment hub gene activation under severe pulmonary infectious stress. (a) Bar chart of relative cell fraction shifts across pulmonary cell populations between normal and severe infectious states. (b) Dot plot showing expression levels (color intensity) and detection frequencies (dot size) of seven regulatory hub genes across normal (N), pneumonia (P), and COVID-19 (C) conditions. (c) Global UMAP visualization displaying unbiased clustering (left) and annotated cell types (right). UMAP feature plots depicting the spatial distribution of all nine hub genes within (d) alveolar macrophages and (e) type II pneumocyte subpopulations. (f), (g) Hallmark GSEA for alveolar macrophages. (h), (i) GO biological process and KEGG pathway GSEA for type II pneumocytes.
-
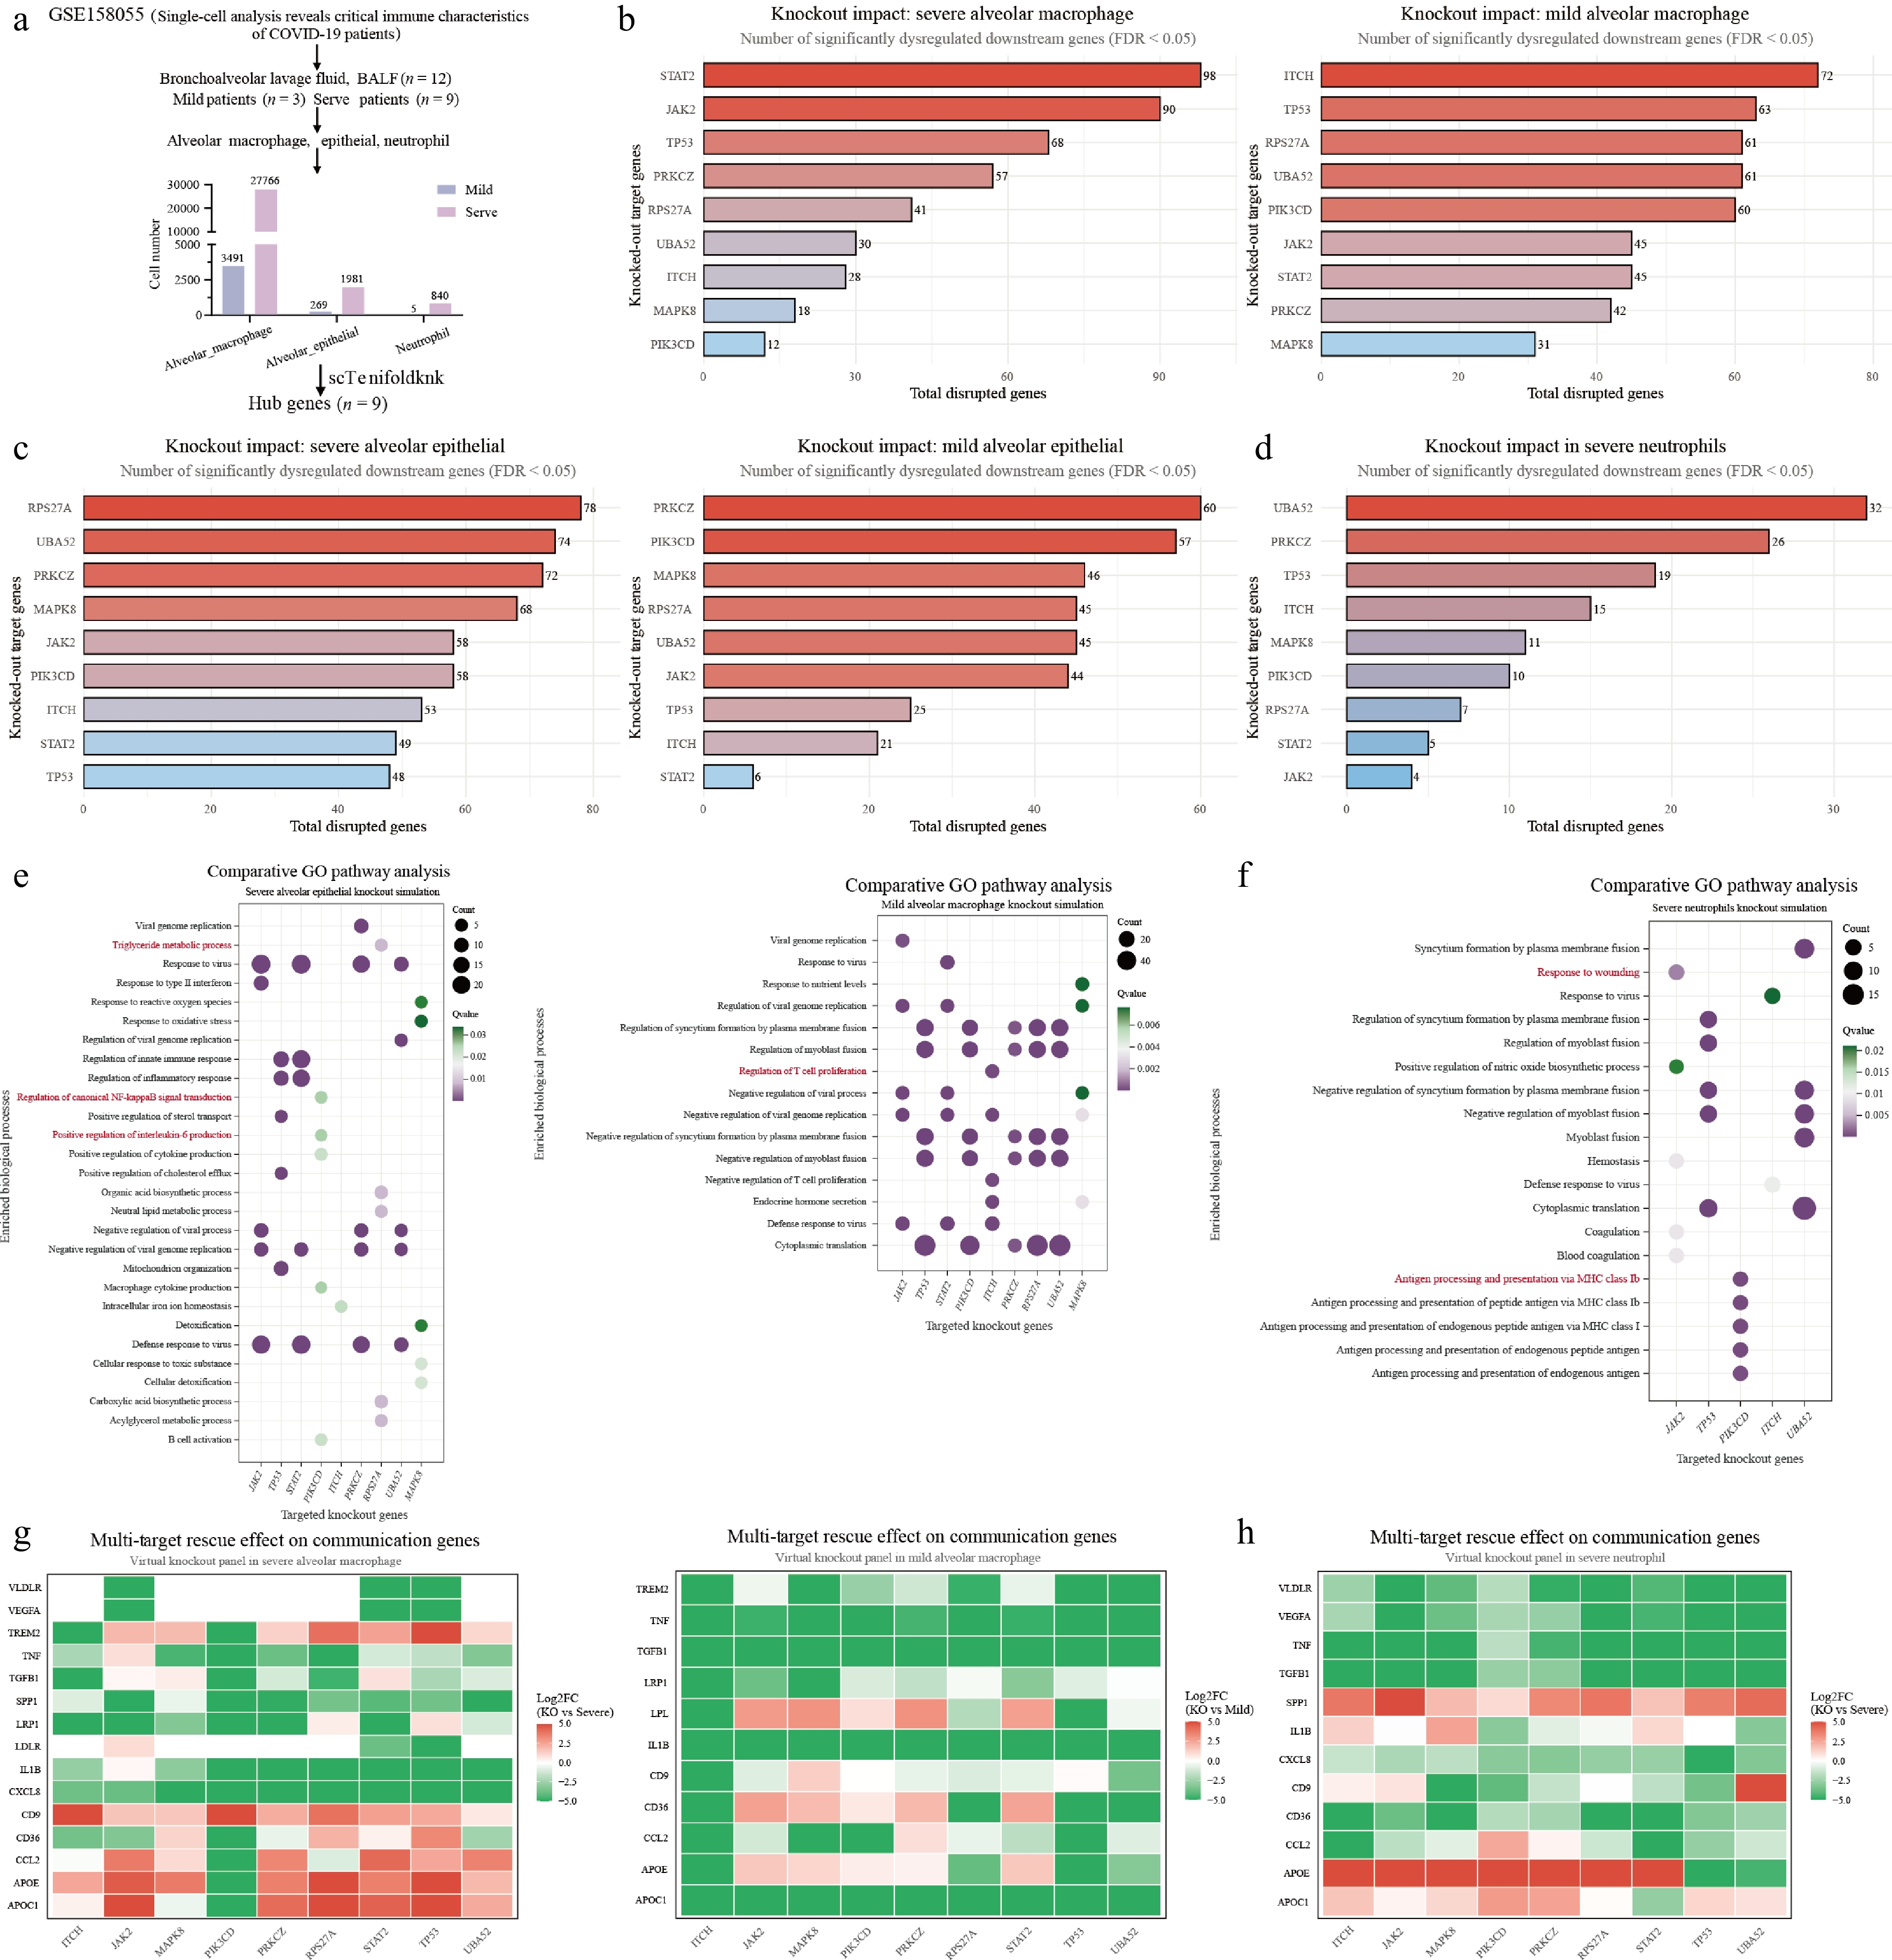
Figure 5.
In silico single-cell virtual knockout screening reveals the pathogenic essentiality and regulatory landscape of hub genes. (a) Schematic workflow of the virtual knockout (vKO) strategy. Bar plots quantifying global network disruption, defined as the number of significantly dysregulated downstream genes (FDR < 0.05), triggered by virtual deletion of individual hub genes across severe and mild (b) alveolar macrophages, (c) alveolar epithelial cells, and (d) severe neutrophils. (e), (f) Comparative gene ontology (GO) enrichment bubble plots detailing the functional landscape affected by vKO. Panel (e) displays distinct biological processes perturbed in severe alveolar epithelial cells (left) vs mild alveolar macrophages (right). (f) Illustrates the perturbed cascades in severe neutrophils. Intervention heatmaps display Log2 Fold Change (Log2FC) values of critical communication mediators and lipid-associated genes following targeted virtual knockout in (g) severe and mild alveolar macrophages and (h) severe neutrophils.
-
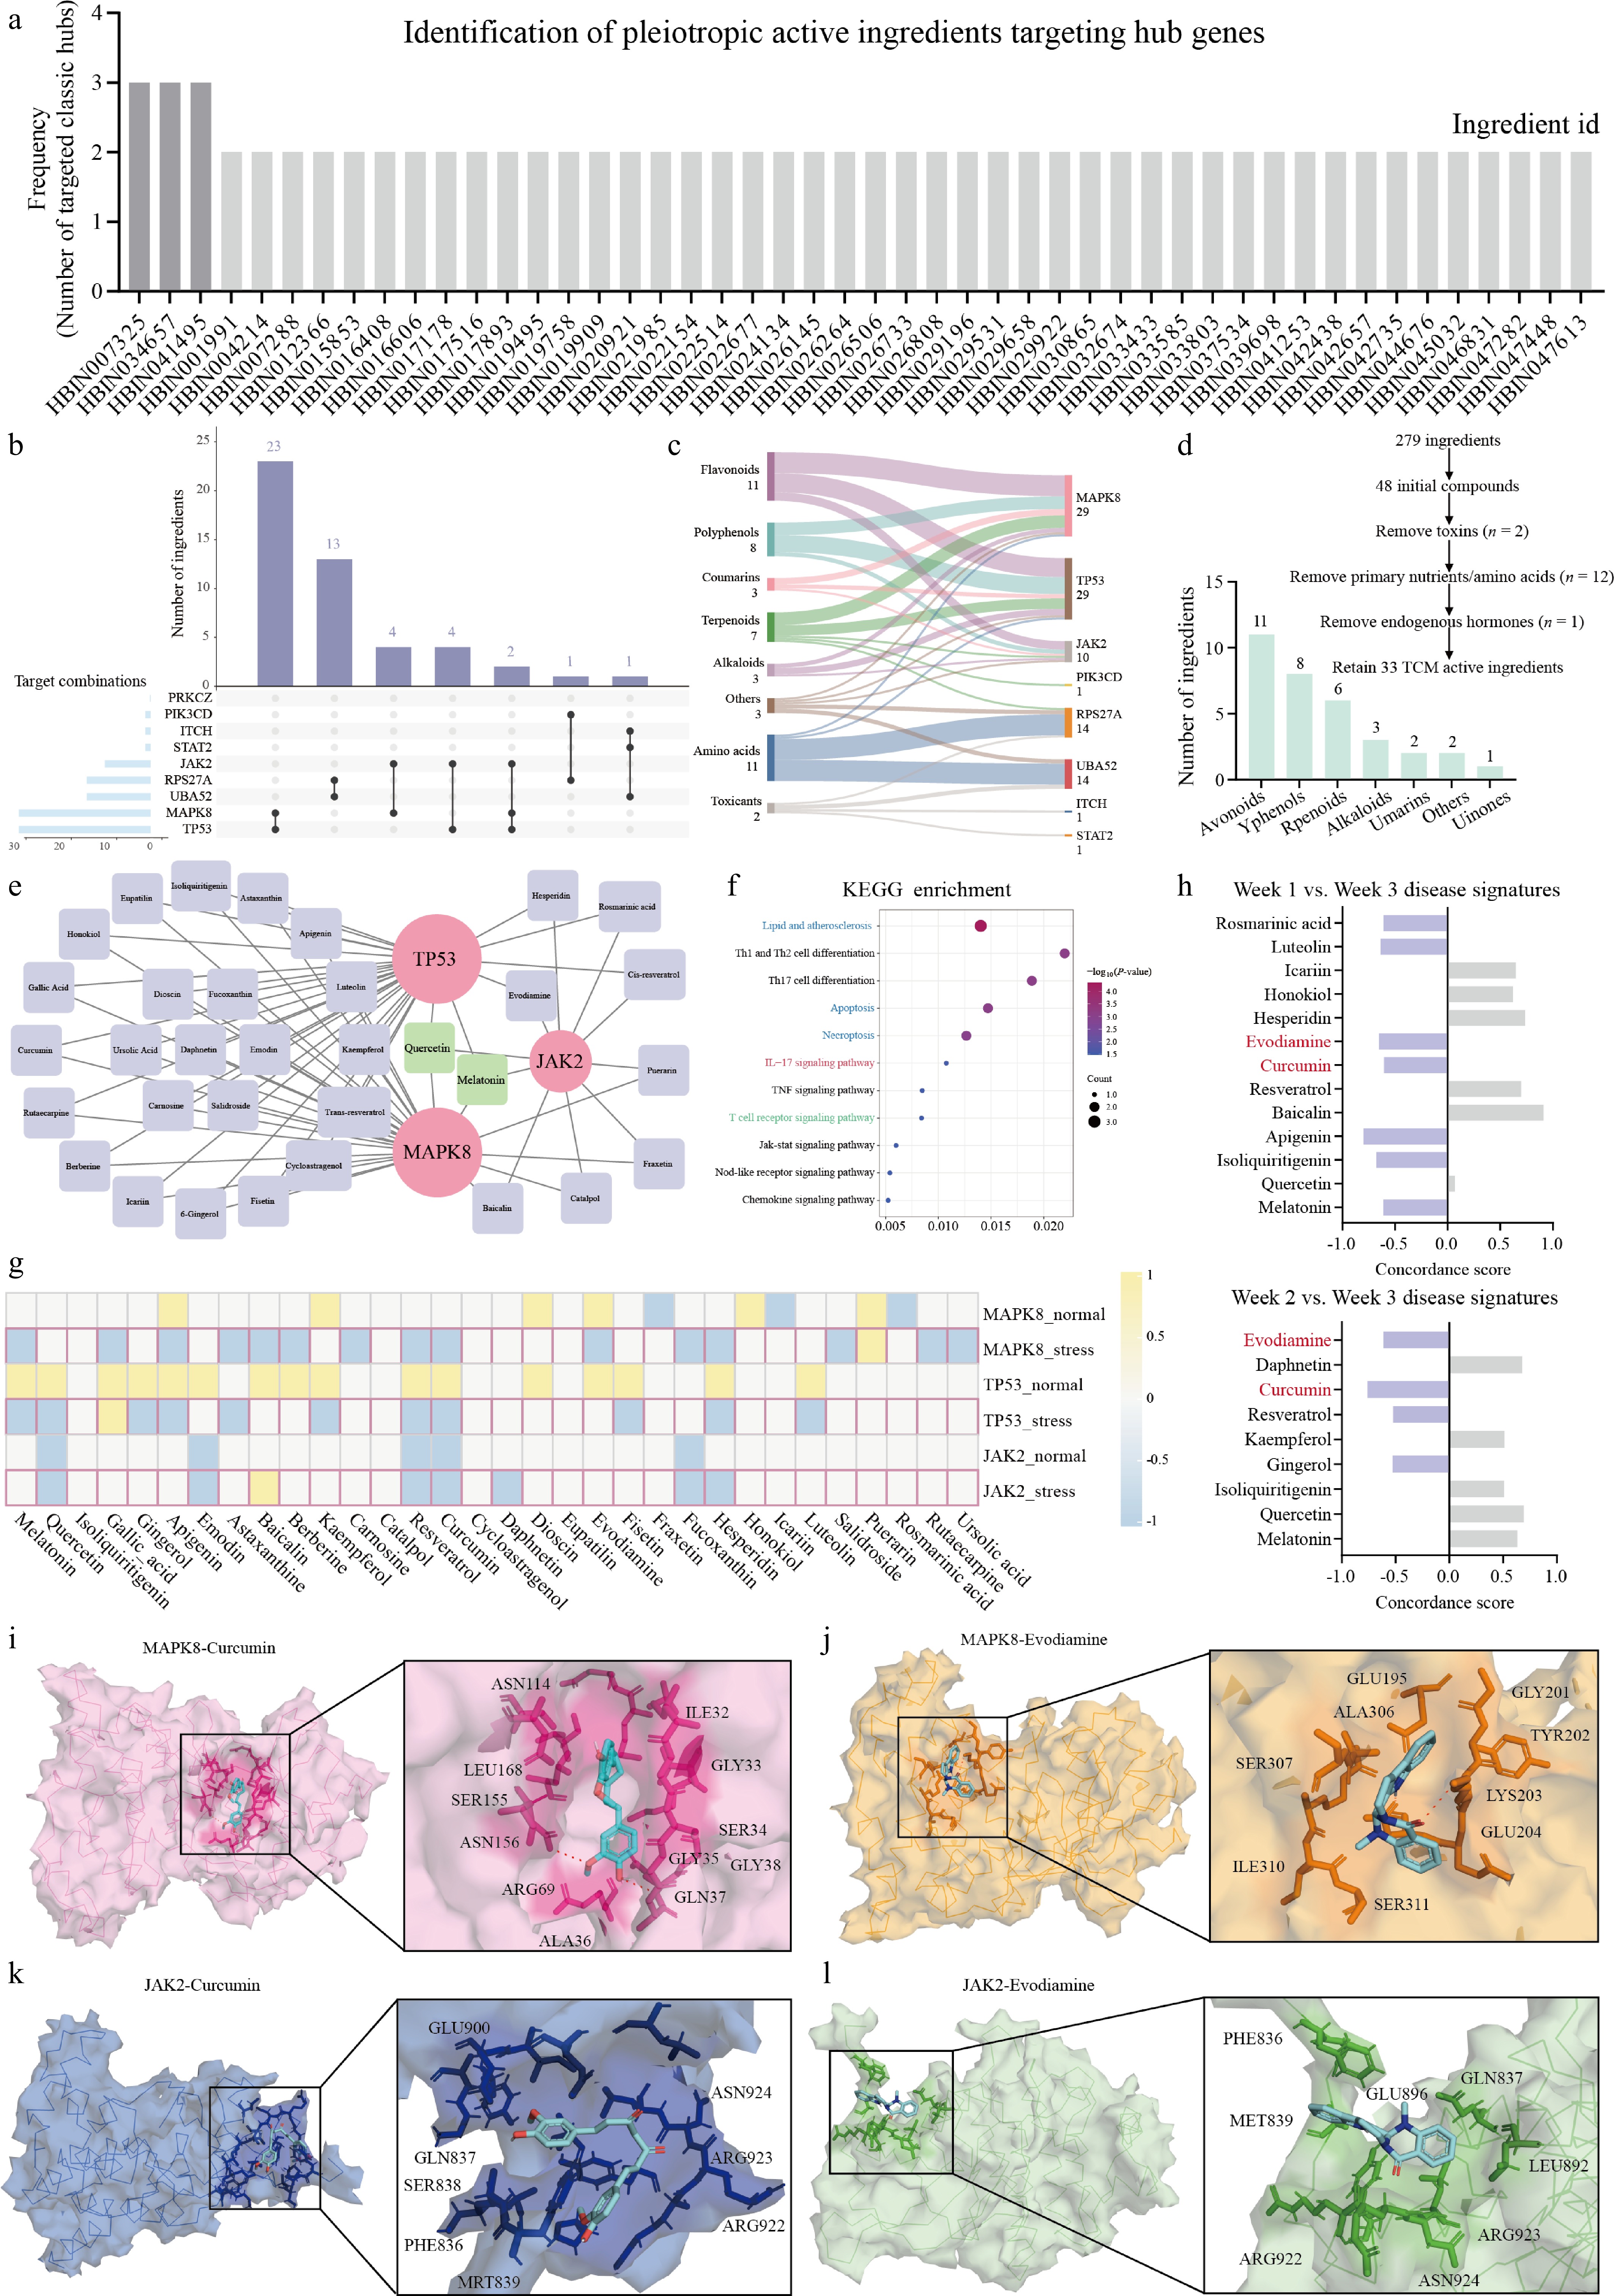
Figure 6.
Network pharmacology screening and molecular docking identify curcumin and evodiamine as candidate dual-targeting agents. (a) Frequency bar chart of TCM compounds from the HERB 2.0 database targeting host hub genes. (b) UpSet plot showing compound-target intersections. (c) Sankey diagram mapping chemical classes, ingredients, and targets. (d) Screening workflow and classification of 33 retained druggable TCM compounds into 7 chemical groups after removal of toxins and primary metabolites. (e) Bipartite Cytoscape network. (f) KEGG enrichment bubble plot of the 33 TCM compounds. (g) CTD-derived heatmap (−1: downregulation; +1: upregulation). (h) iLINCS L1000-based transcriptomic reversal analysis. Concordance Scores against Week 1 versus Week 3 (top) and Week 2 versus Week 3 (bottom) disease signatures. (i-l) Molecular docking simulations showing 3D binding surfaces and binding pocket orientations for the four ligand-receptor pairs: (i) curcumin-MAPK8, (j) evodiamine-MAPK8, (k) curcumin-JAK2, and (l) evodiamine-JAK2.
-
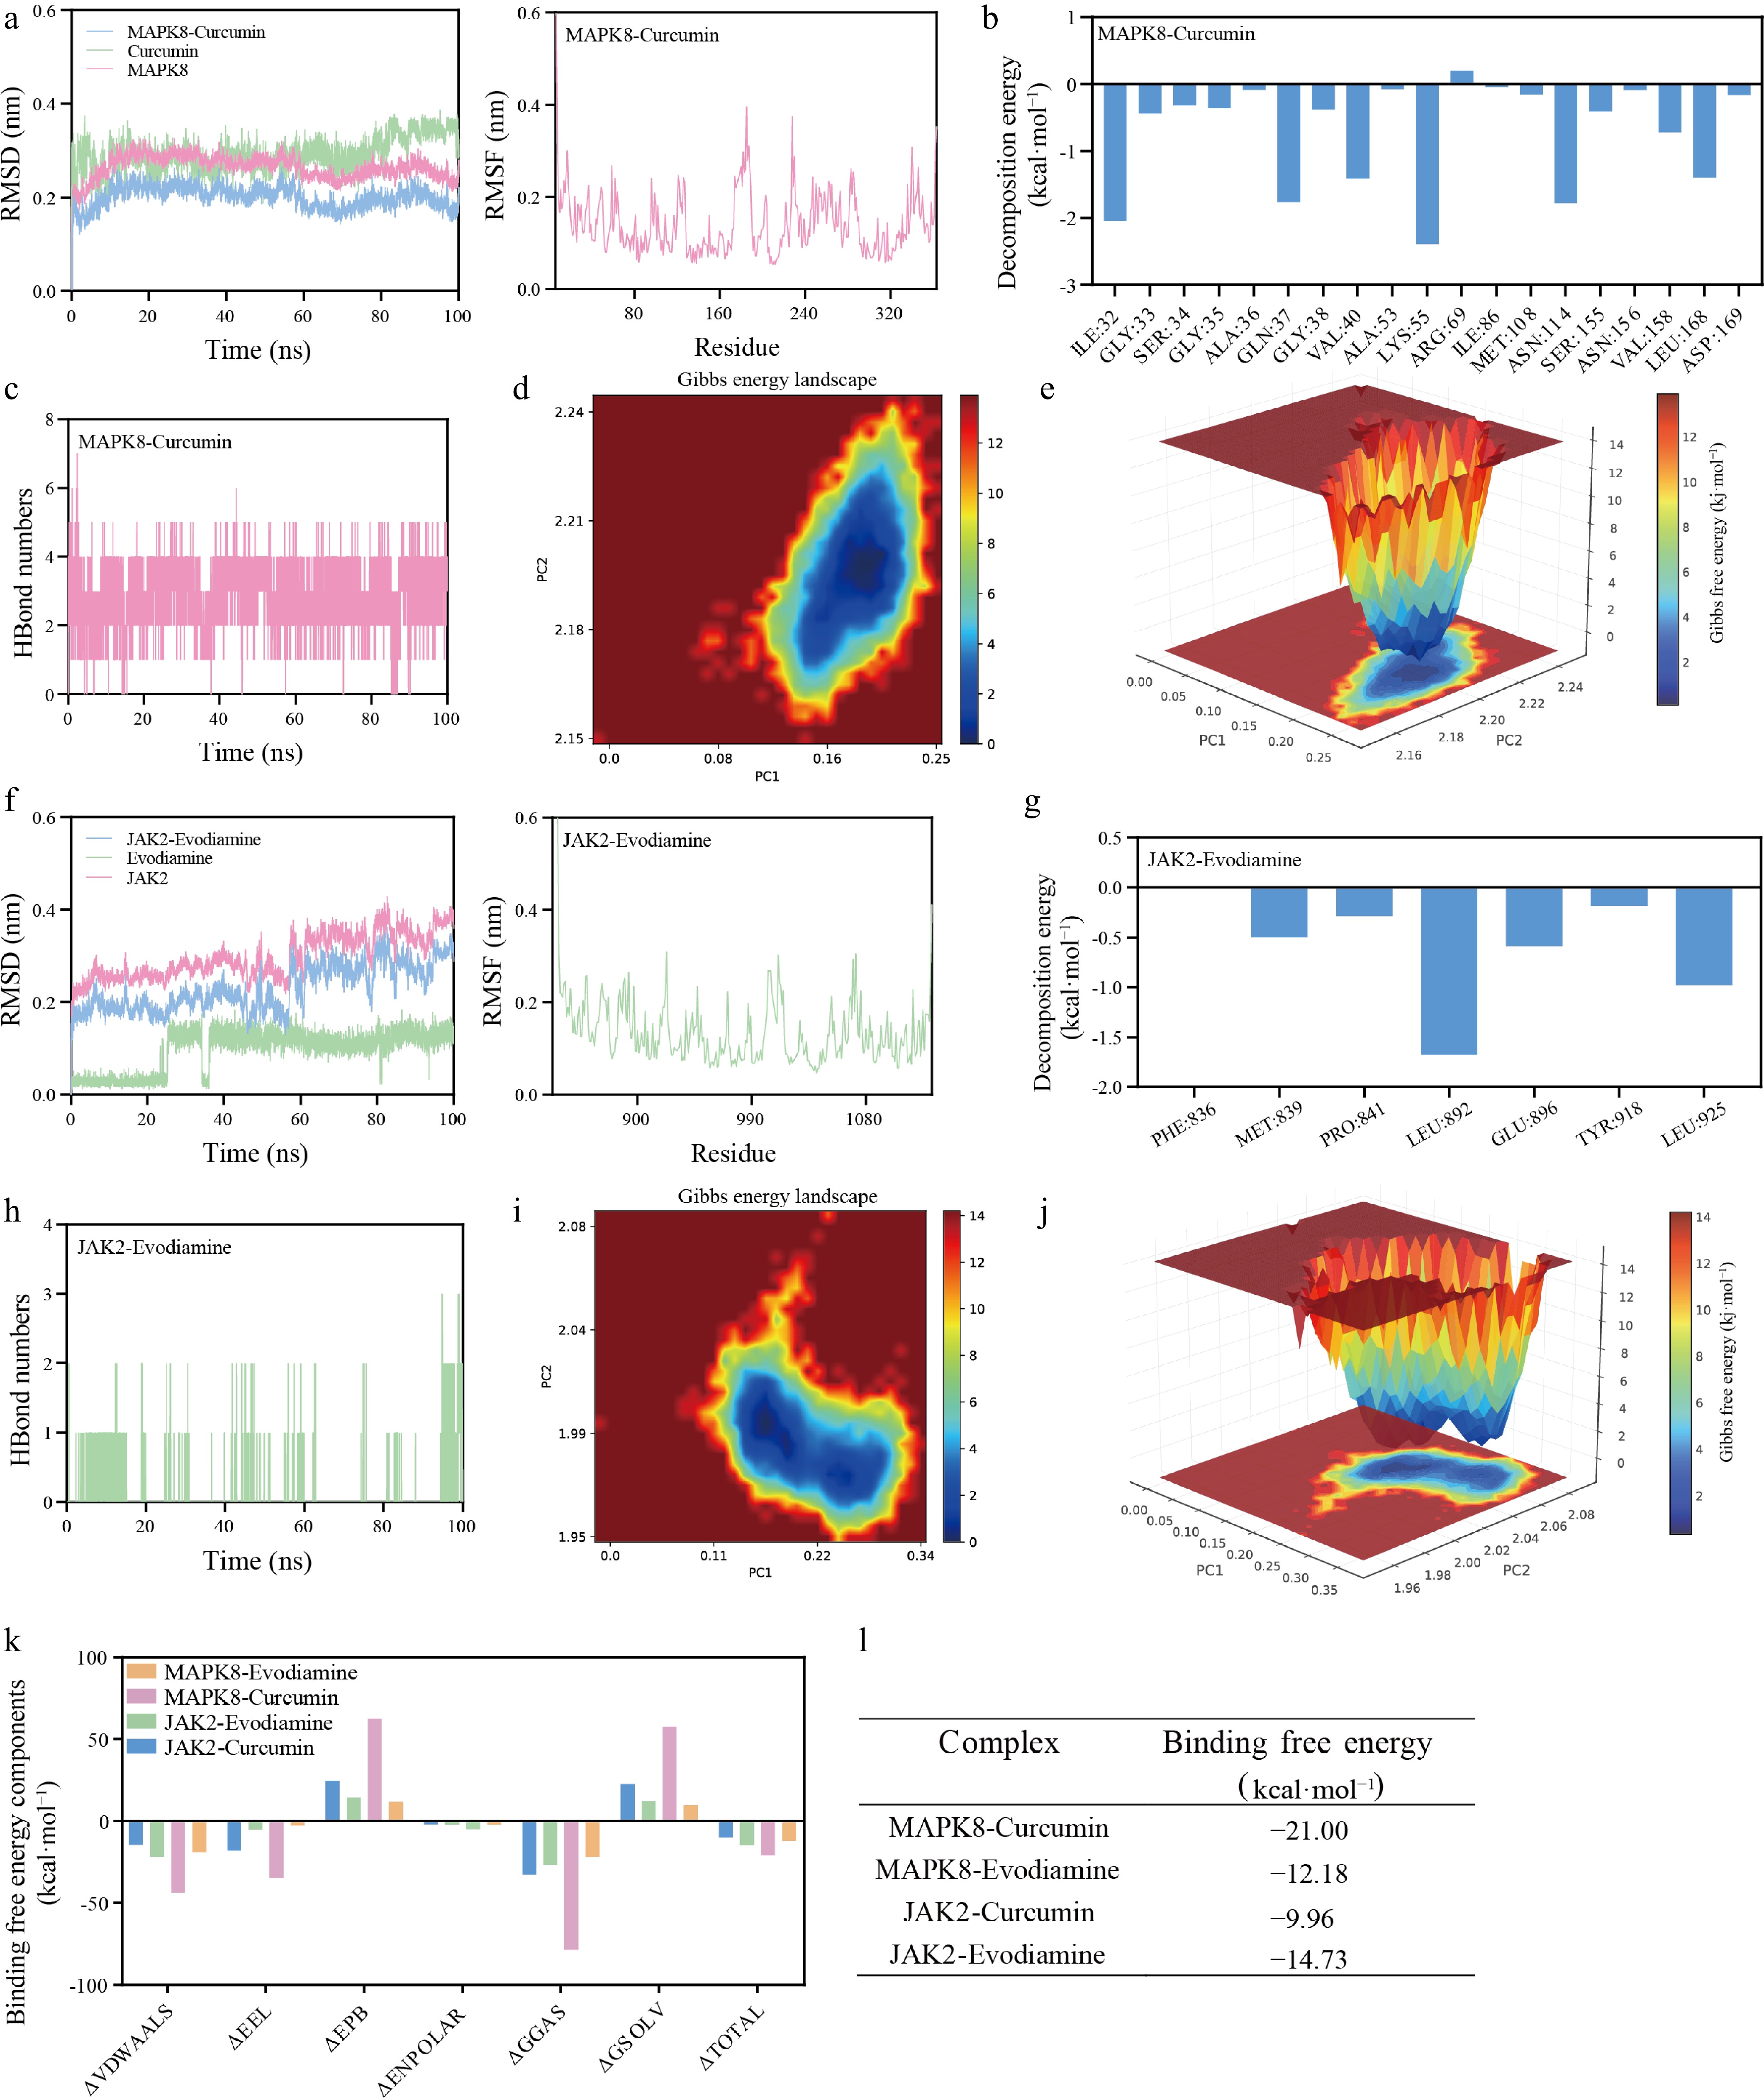
Figure 7.
Dynamic stability and thermodynamics of protein-ligand complexes via 100 ns molecular dynamics simulations. Trajectory metrics and energy landscape for the MAPK8-curcumin complex: (a) root-mean-square deviation (RMSD) profiles of the protein backbone (pink), ligand (green), and complex (blue). (b) Per-residue decomposition energy plot showing amino acids contributing to binding free energy. (c) Time evolution of intermolecular hydrogen bond numbers. (d) Two-dimensional Gibbs free energy landscape (FEL) along PC1 and PC2. (e) Three-dimensional FEL. Parallel MD trajectory analysis for the JAK2-evodiamine complex: (f) RMSD profile. (g) per-residue decomposition energy showing key binding residues. (h) Hydrogen bond trajectory. (i) 2D FEL. (j) 3D FEL. (k) MM/PBSA binding free energy components (van der Waals, electrostatic, polar solvation, non-polar solvation) for all four compound-target combinations. (l) Summary table of calculated total binding free energies (kcal·mol−1).
-
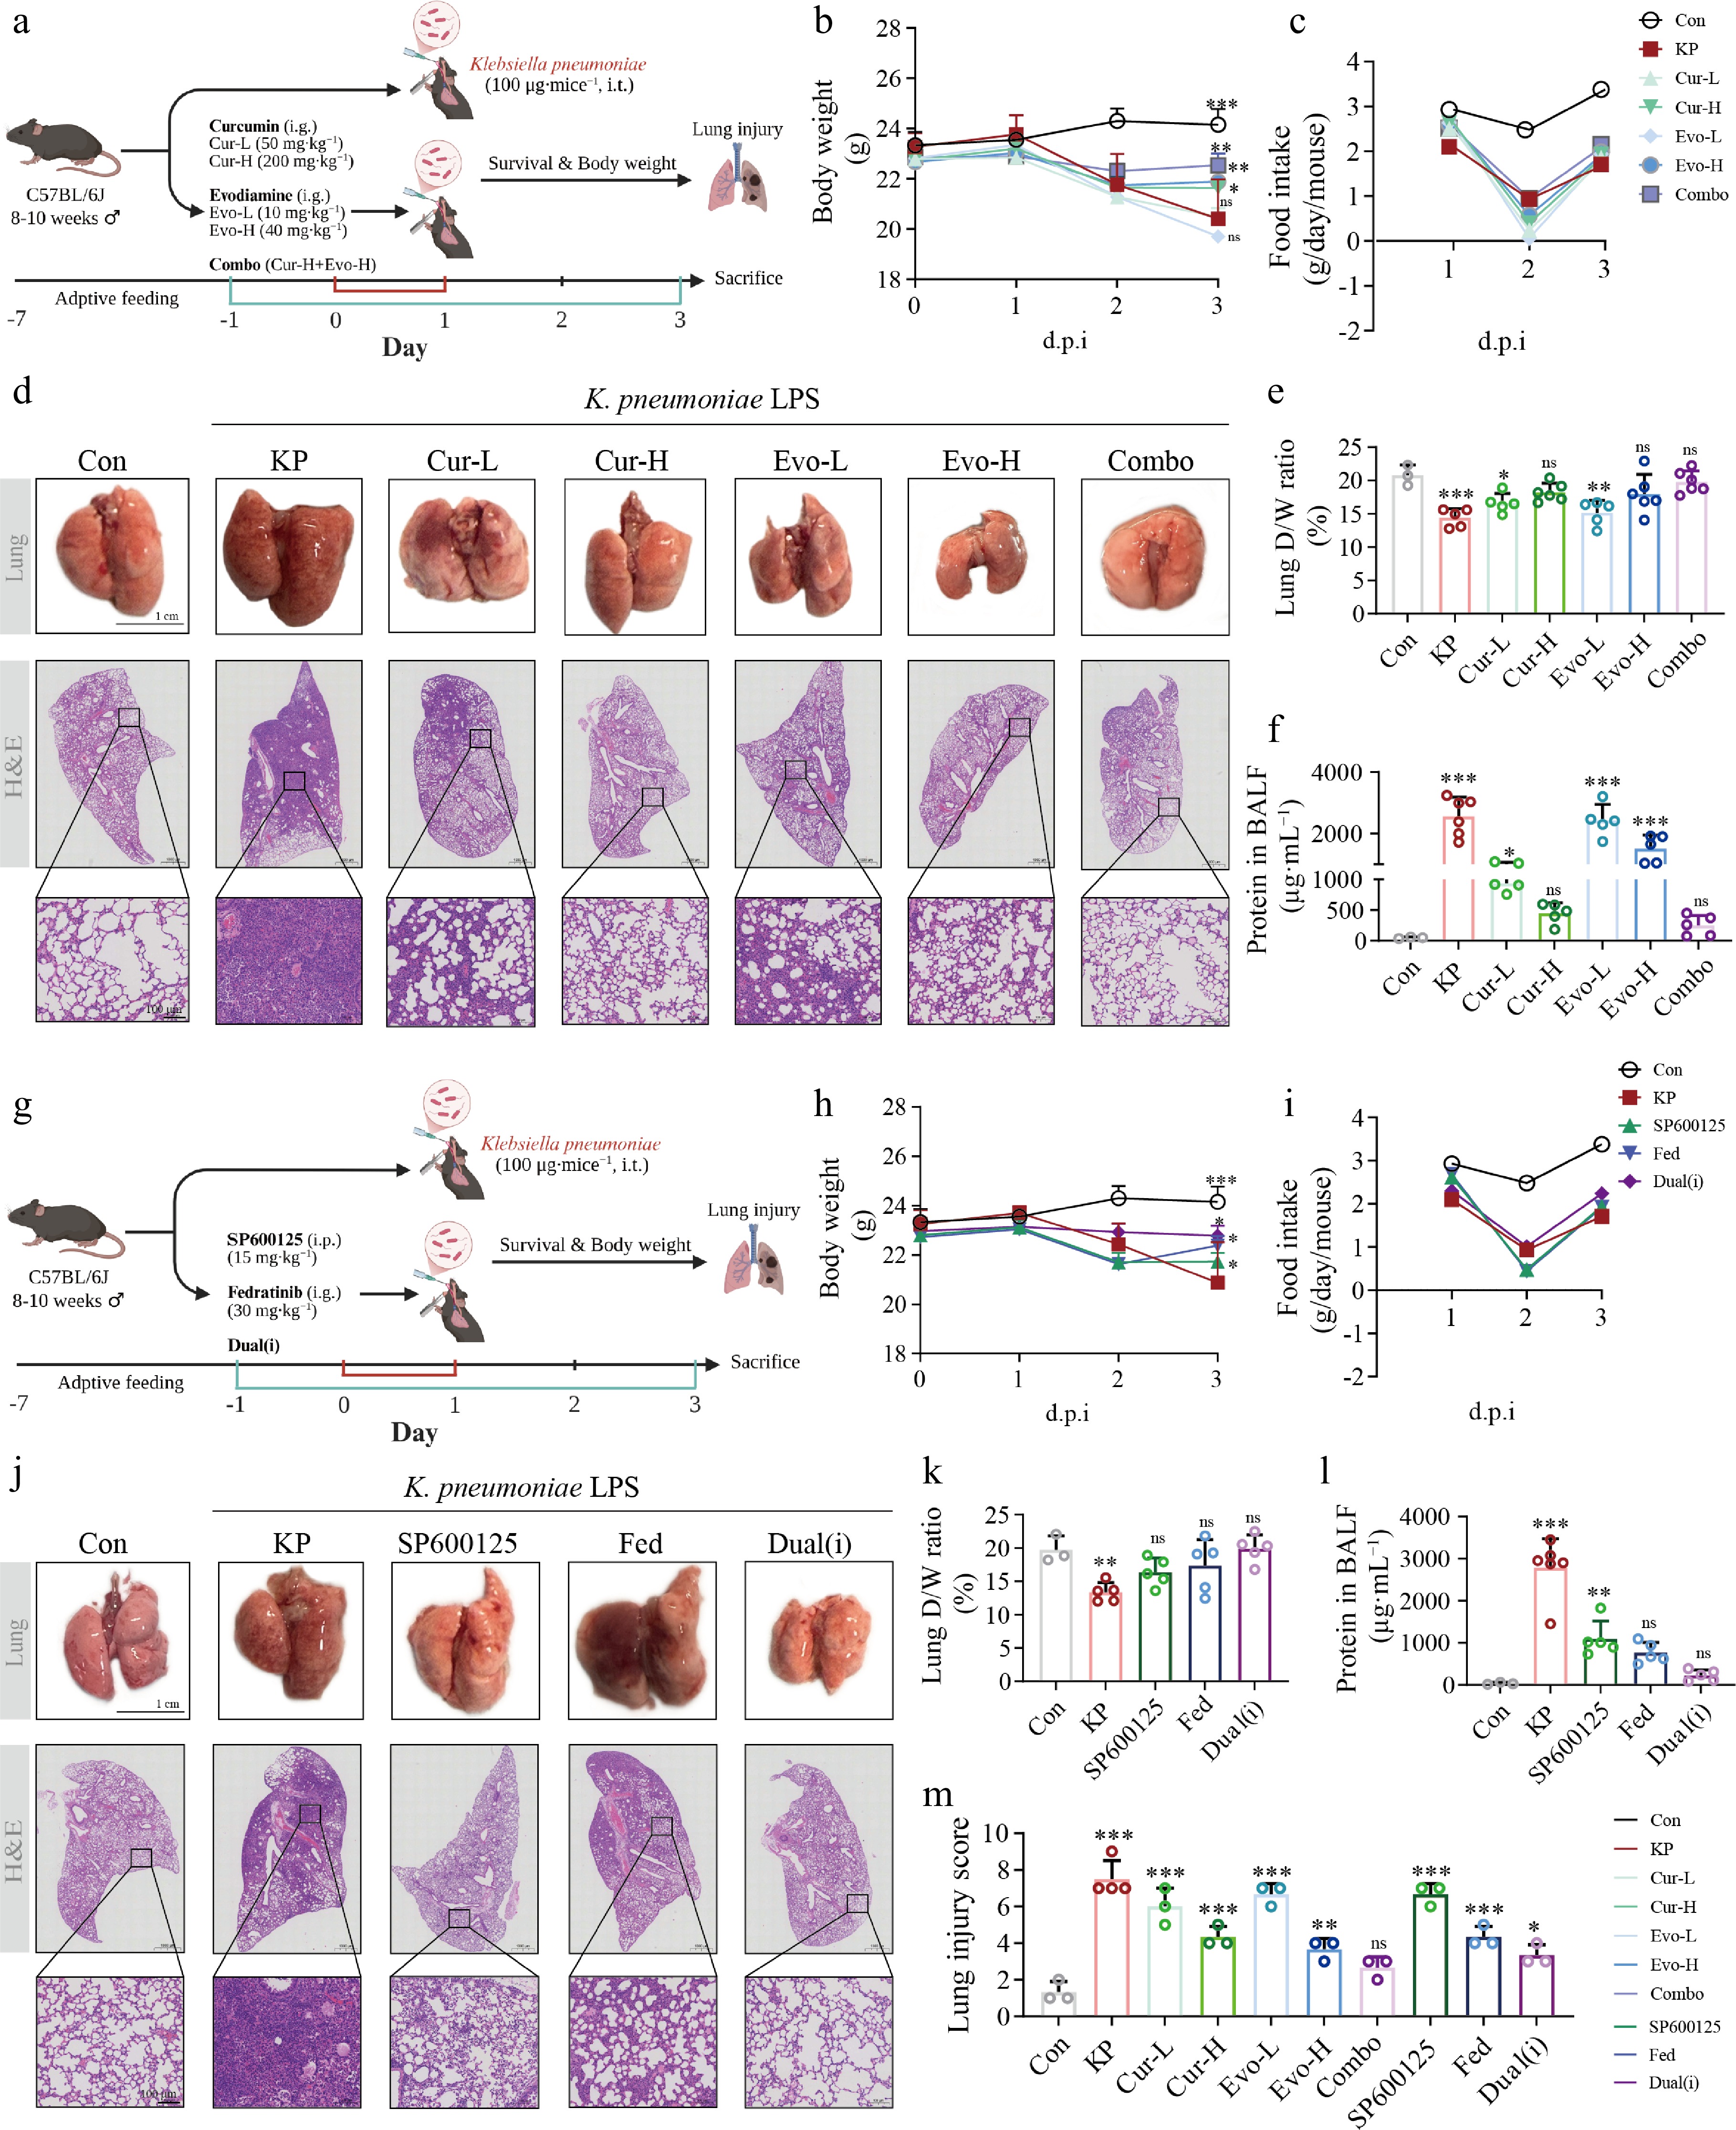
Figure 8.
Pharmacological evaluation of curcumin, evodiamine, and selective inhibitors in K. pneumoniae LPS-induced acute lung injury in mice. (a) Schematic of the natural product experimental protocol. (b) Body weight change curves for natural product treatment groups (mean ± SEM). (c) Food intake for natural product treatment groups (g/cage/d). (d) Representative H&E-stained lung sections from natural product treatment groups (scale bar = 100 μm). (e) Lung dry-to-wet weight ratio (%) for natural product treatment groups. (f) Total protein concentration in bronchoalveolar lavage fluid (BALF) from natural product treatment groups. (g) Schematic of the inhibitor experimental protocol. (h) Body weight change curves for inhibitor treatment groups (mean ± SEM). (i) Food intake for inhibitor treatment groups (g/cage/d). (j) Representative H&E-stained lung sections from inhibitor treatment groups (scale bar = 100 μm). (k) Lung dry-to-wet weight ratio (%) for inhibitor treatment groups. (l) BALF total protein concentration for inhibitor treatment groups. (m) Lung injury score (0−10 scale, blinded assessment). C57BL/6J mice were randomly assigned to groups. The natural product experiment comprised seven groups: vehicle control (Control, n = 4), Kp-LPS challenge (Model, n = 12), low-dose curcumin (Cur-L, 50 mg·kg−1, n = 5), high-dose curcumin (Cur-H, 200 mg·kg−1, n = 6), low-dose evodiamine (Evo-L, 10 mg·kg−1, n = 5), high-dose evodiamine (Evo-H, 40 mg·kg−1, n = 6), and combination therapy (Combo, Cur-H + Evo-H, n = 10). The inhibitor experiment comprised five groups: Control, Model, the MAPK8 inhibitor SP600125 (15 mg·kg−1, i.p., n = 5), the JAK2 inhibitor fedratinib (30 mg·kg−1, i.g., n = 5), and dual inhibitor combination (Dual-i, n = 5). Drugs were administered once daily via oral gavage; Klebsiella pneumoniae-derived LPS (100 μg/mouse) was delivered by intratracheal instillation. Mice were sacrificed at the day 3 endpoint. Data are presented as mean ± SEM. * P < 0.05, ** P < 0.01, *** P < 0.001 vs Control; ns, not significant. Body weight and food intake were analyzed by two-way repeated-measures ANOVA; all other parameters were analyzed by one-way ANOVA followed by Tukey's post hoc test.
-
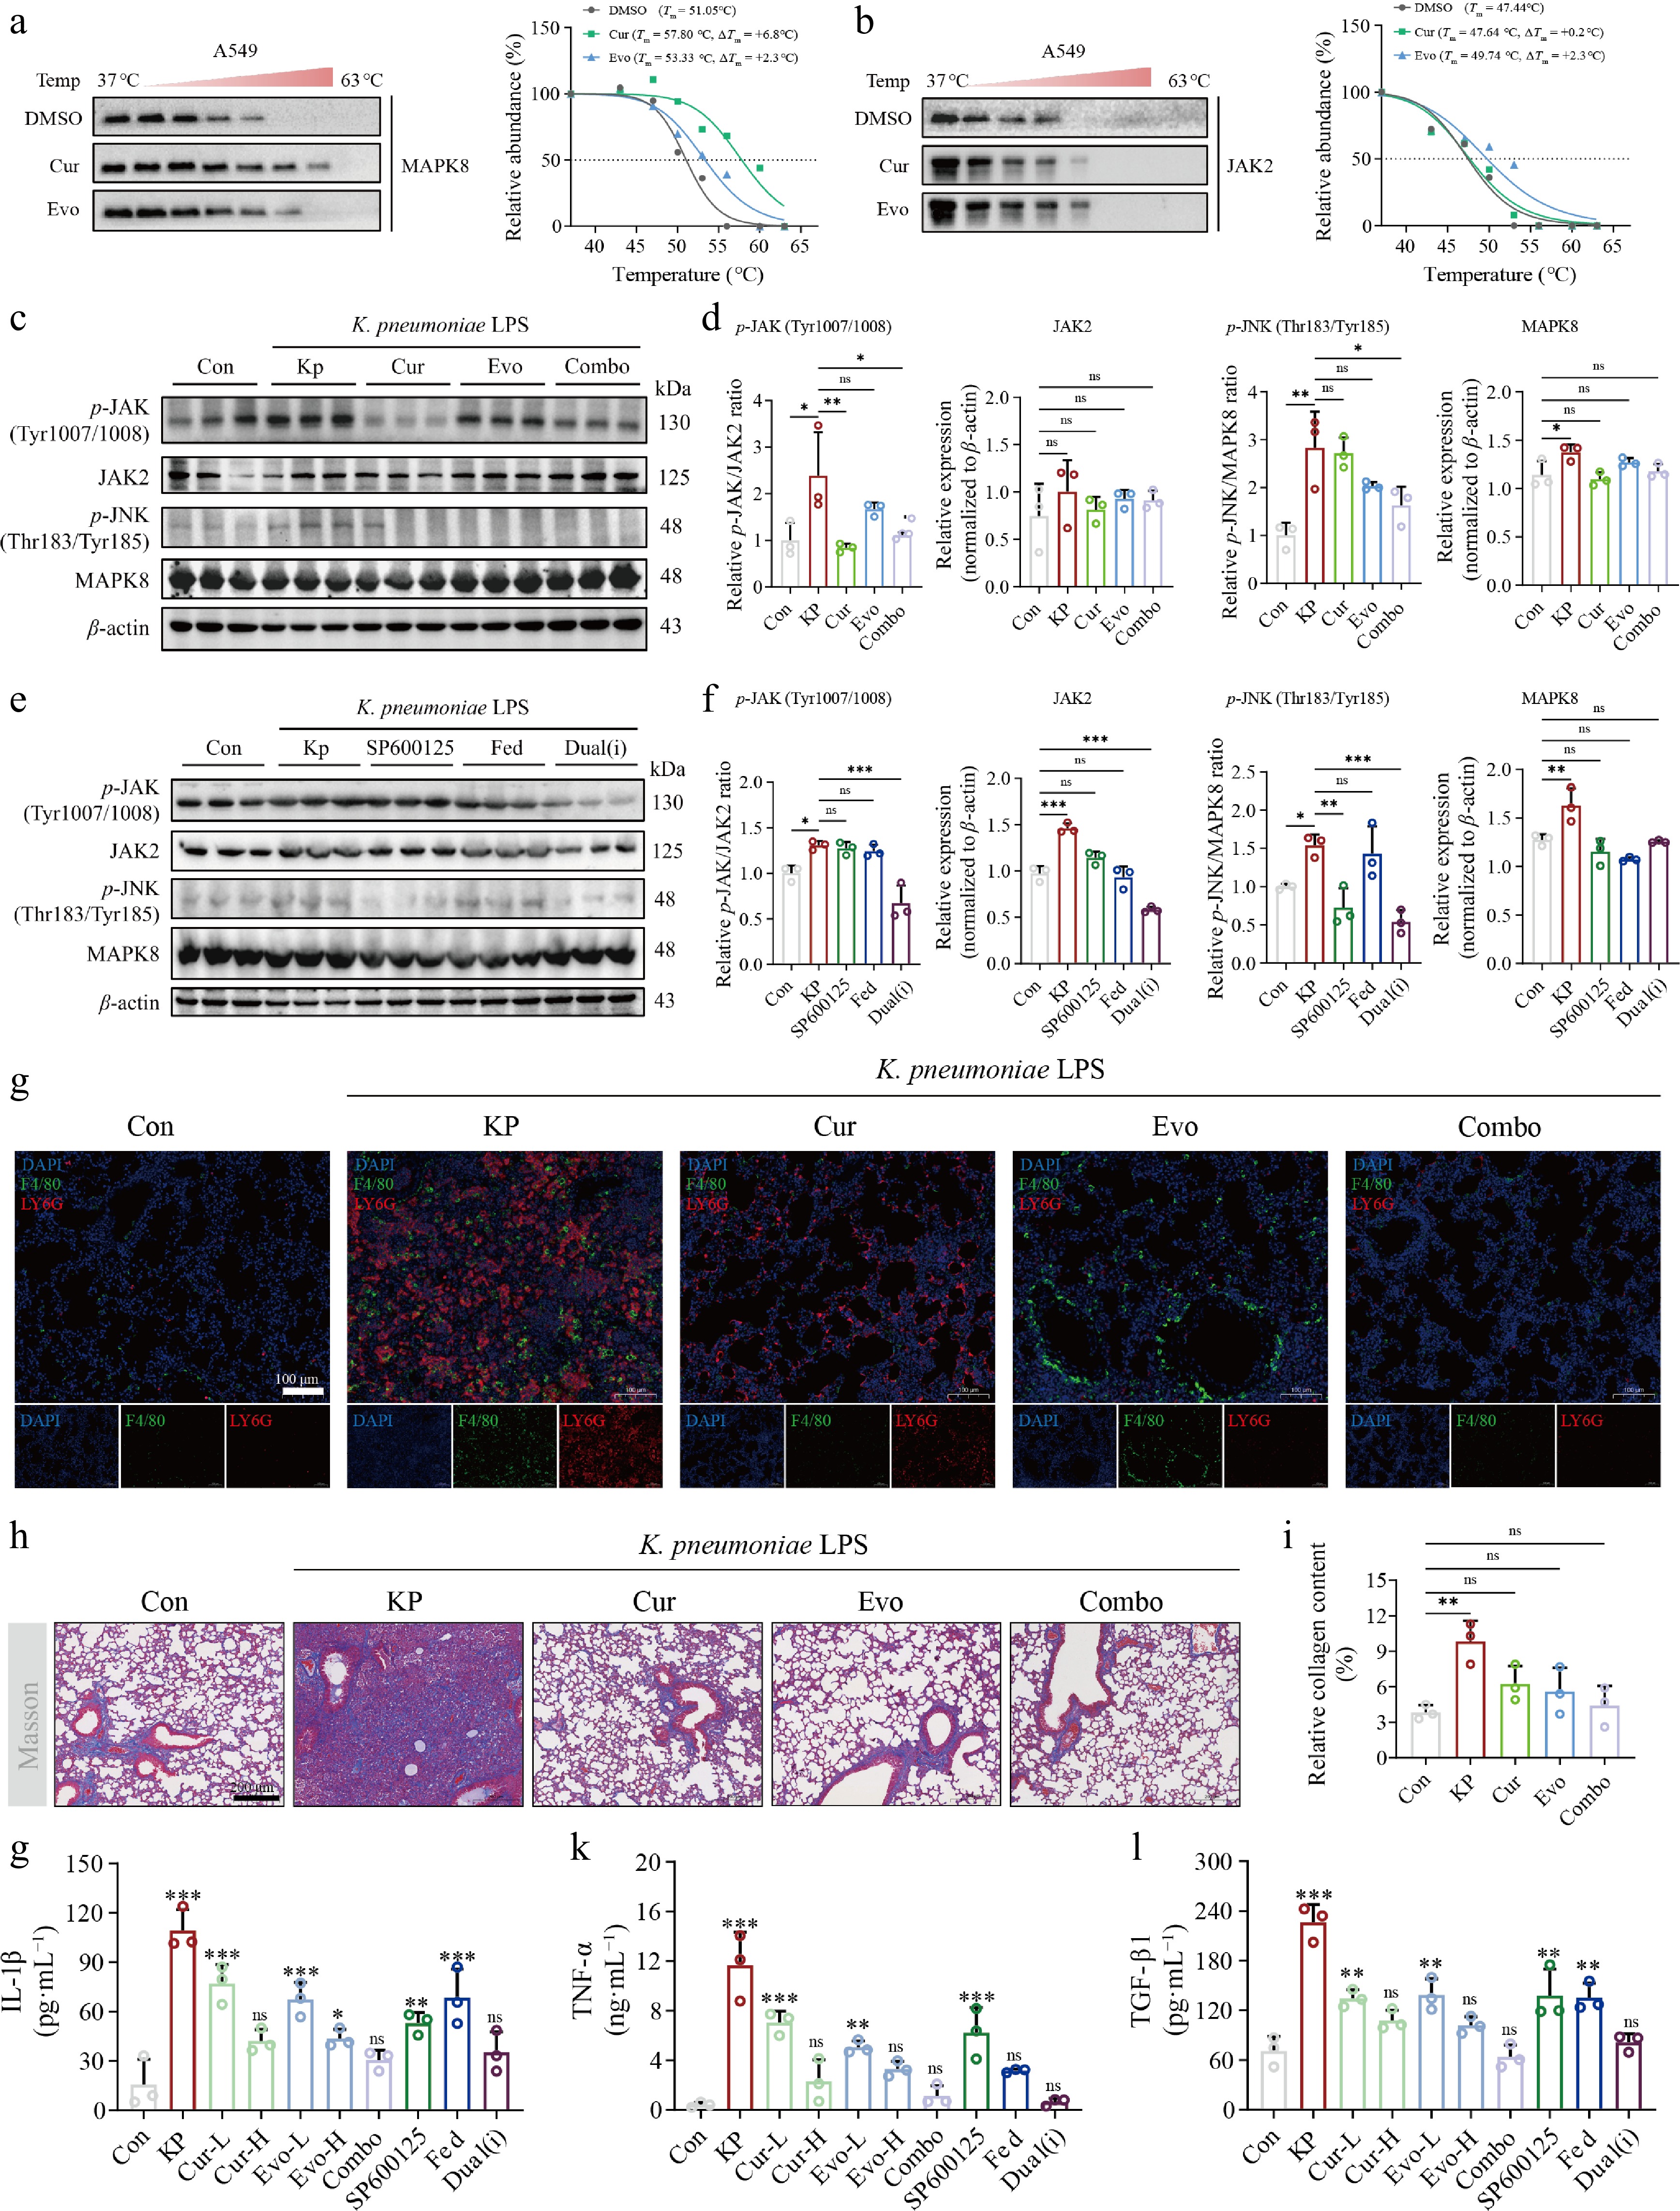
Figure 9.
Target engagement and in vivo signaling pathway modulation of curcumin and evodiamine in K. pneumoniae LPS-induced ALI. (a) CETSA of MAPK8 in A549 cells treated with DMSO, curcumin (40 μmol·L−1), or evodiamine (40 μmol·L−1); (b) CETSA of JAK2 under the same conditions. Soluble protein was normalized to the 37 °C value and fitted to a four-parameter logistic model; the dotted line indicates 50% soluble protein. (c) Representative western blot images of p-JAK (Tyr1007/1008), JAK2, p-JNK (Thr183/Tyr185), and MAPK8 in lung tissues from natural product-treated groups, with β-actin as the loading control. (d) Densitometric quantification of (c). Phospho-to-total protein ratios (p-JAK/JAK2 and p-JNK/MAPK8) were normalized to the Control group, with drug-treated groups compared against the Model group; total JAK2 and MAPK8 expression was normalized to β-actin and expressed relative to the Control group. (e) Representative western blot images of p-JAK (Tyr1007/1008), JAK2, p-JNK (Thr183/Tyr185), and MAPK8 in lung tissues from inhibitor-treated groups, with β-actin as the loading control. (f) Densitometric quantification of (e). Phospho-to-total protein ratios (p-JAK/JAK2 and p-JNK/MAPK8) were normalized to the Control group, with inhibitor-treated groups compared against the Model group; total JAK2 and MAPK8 expression was normalized to β-actin and expressed relative to the Control group. (g) Representative immunofluorescence images of F4/80 (green, macrophages) and Ly6G (red, neutrophils) dual staining in lung tissue (scale bar = 100 μm), with DAPI (blue) counterstaining nuclei. (h) Quantification of collagen area (%) by Masson's trichrome staining. (i) Representative Masson's trichrome-stained sections for each group (scale bar = 200 μm). (j)–(l) Serum levels of IL-1β, TNF-α, and TGF-β1 measured by ELISA. Data are presented as mean ± SEM. * P < 0.05, ** P < 0.01, *** P < 0.001 vs Control; ns, not significant. One-way ANOVA followed by Tukey's post hoc test.
Figures
(9)
Tables
(0)