-
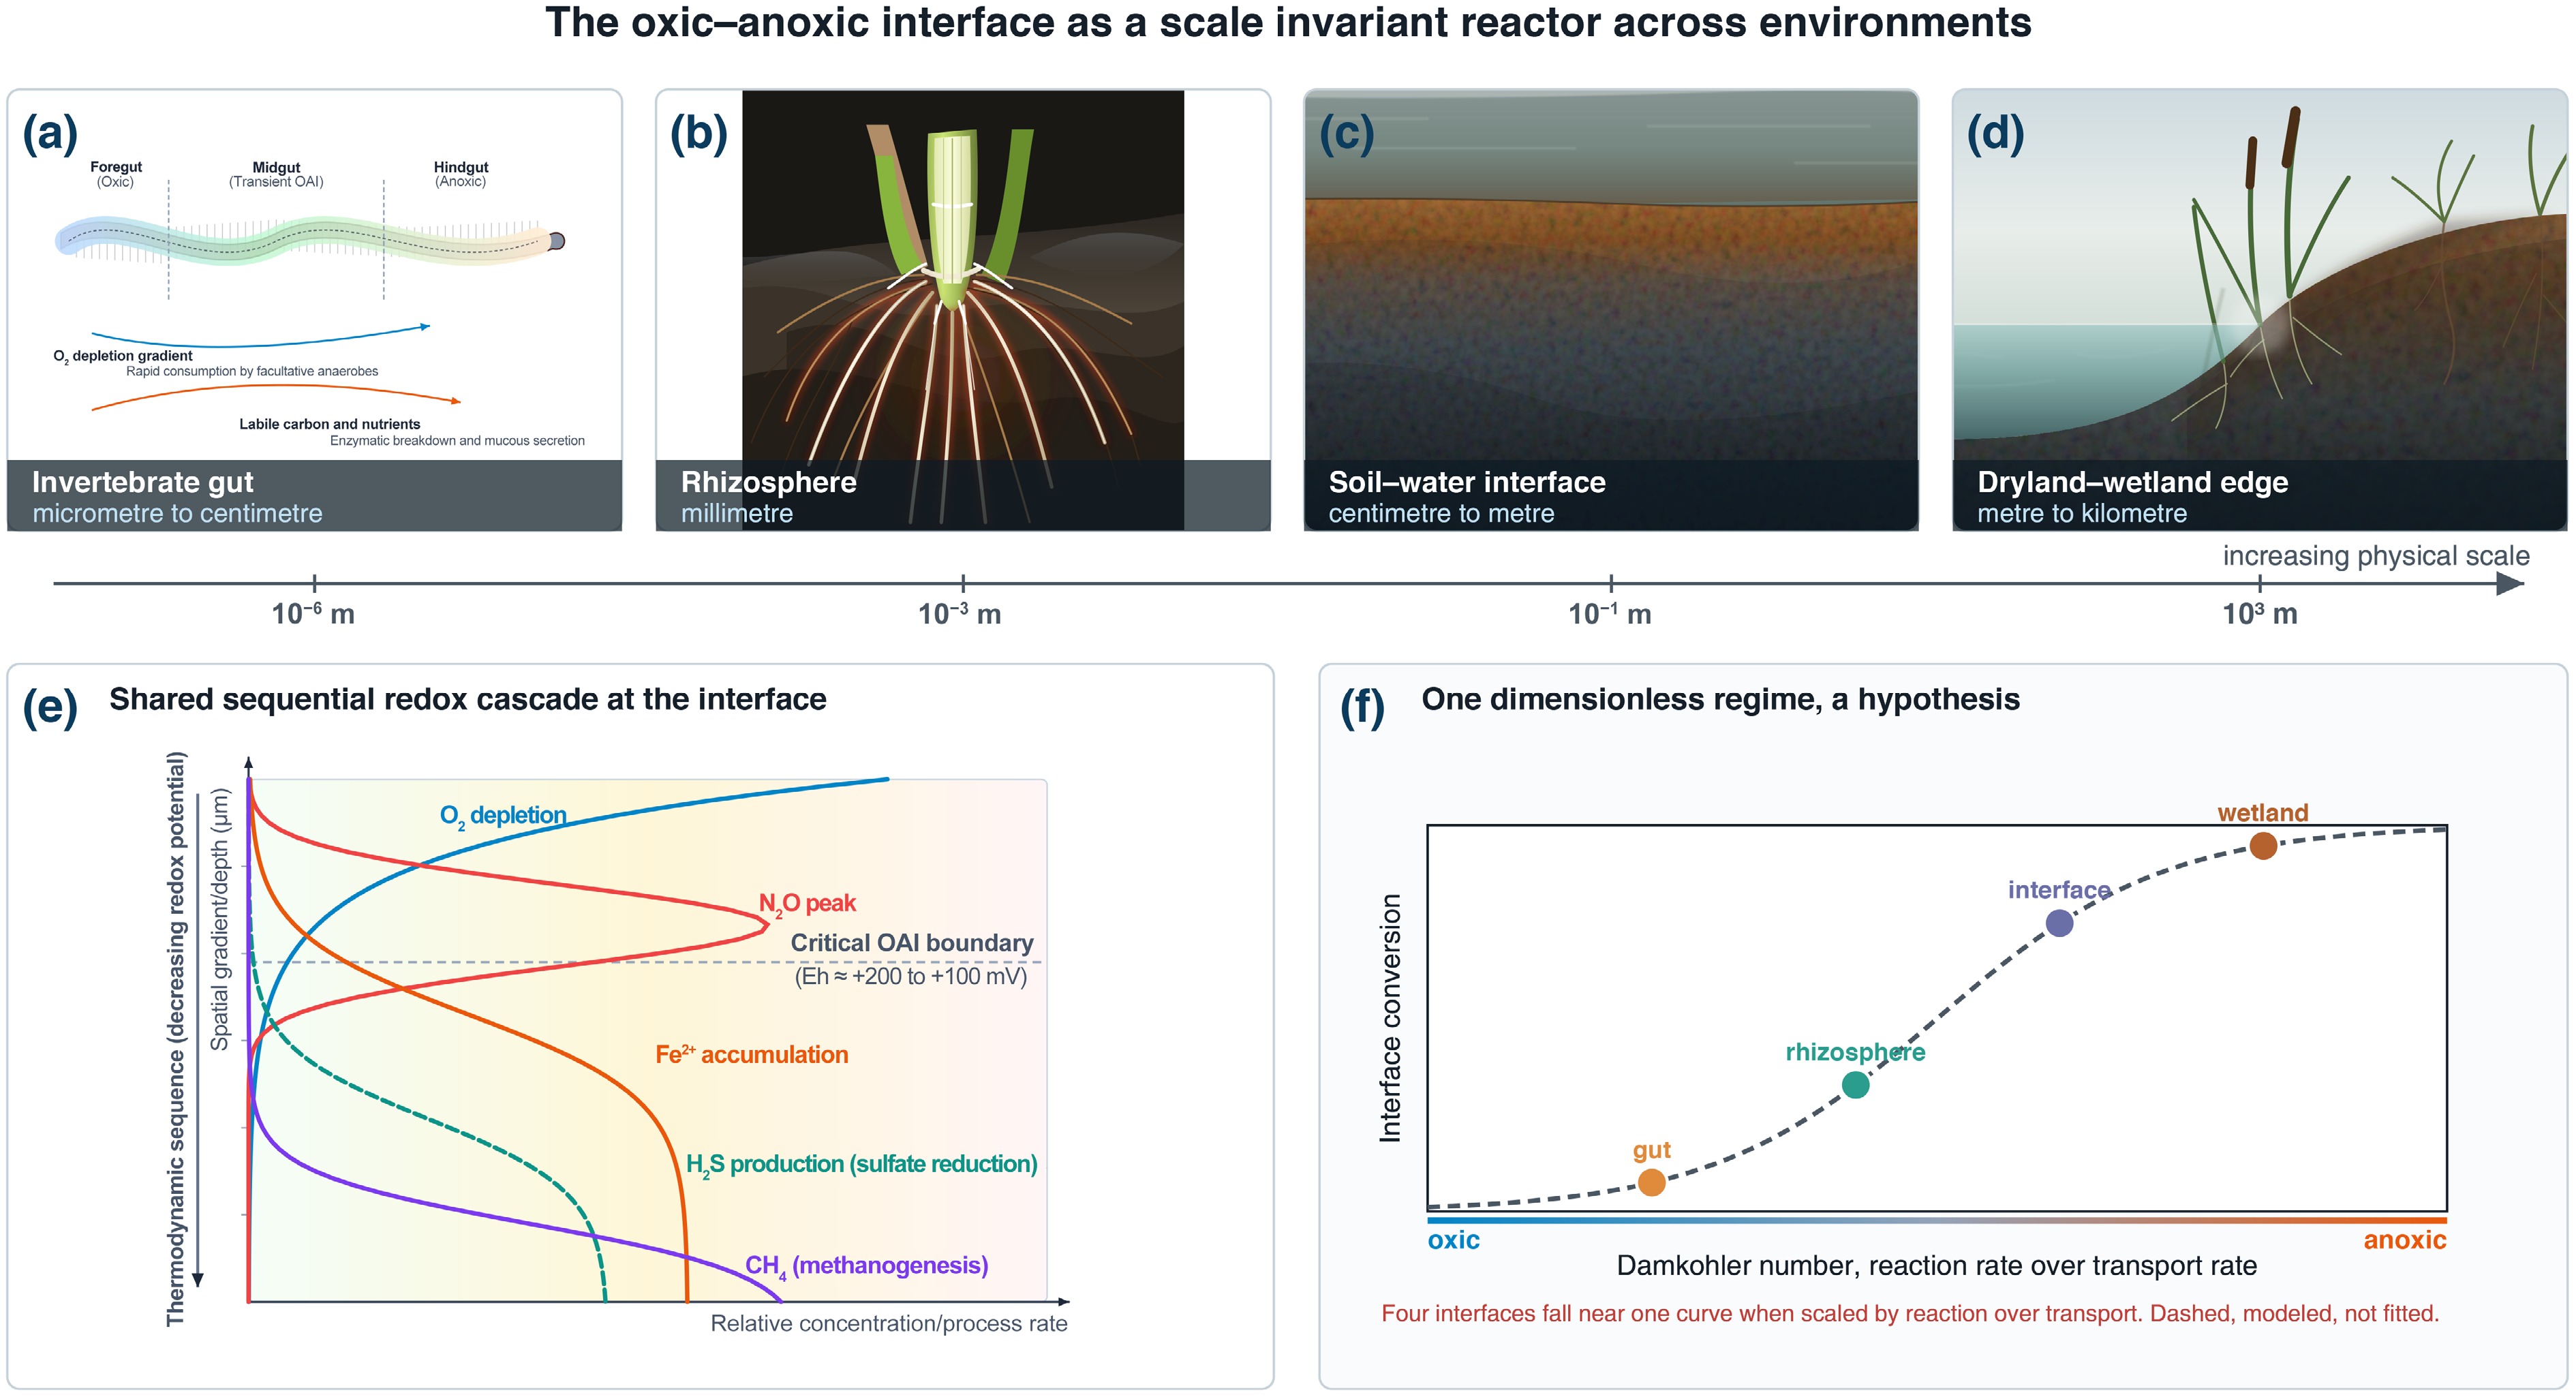
Figure 1.
The oxic–anoxic interface as a reactor across biological and environmental systems. Steep oxygen gradients and sequential redox reactions emerge across diverse oxic–anoxic interfaces despite large differences in physical scale. (a)–(d) Four representative interfaces spanning multiple spatial scales: the invertebrate gut (µm to cm), the rhizosphere (mm), the soil–water interface (cm to m), and the dryland–wetland boundary (m to km). (e) A shared redox sequence across the interface, with oxygen depletion followed by nitrate reduction, iron reduction, sulfate reduction, and methanogenesis. (f) The four interfaces are compared using a dimensionless reaction-to-transport ratio, a conceptual scaling hypothesis. Despite spanning several orders of magnitude in size, they are hypothesized to converge on a similar region in dimensionless space. The dashed curve only represents a conceptual scaling hypothesis rather than an empirical fit.
-
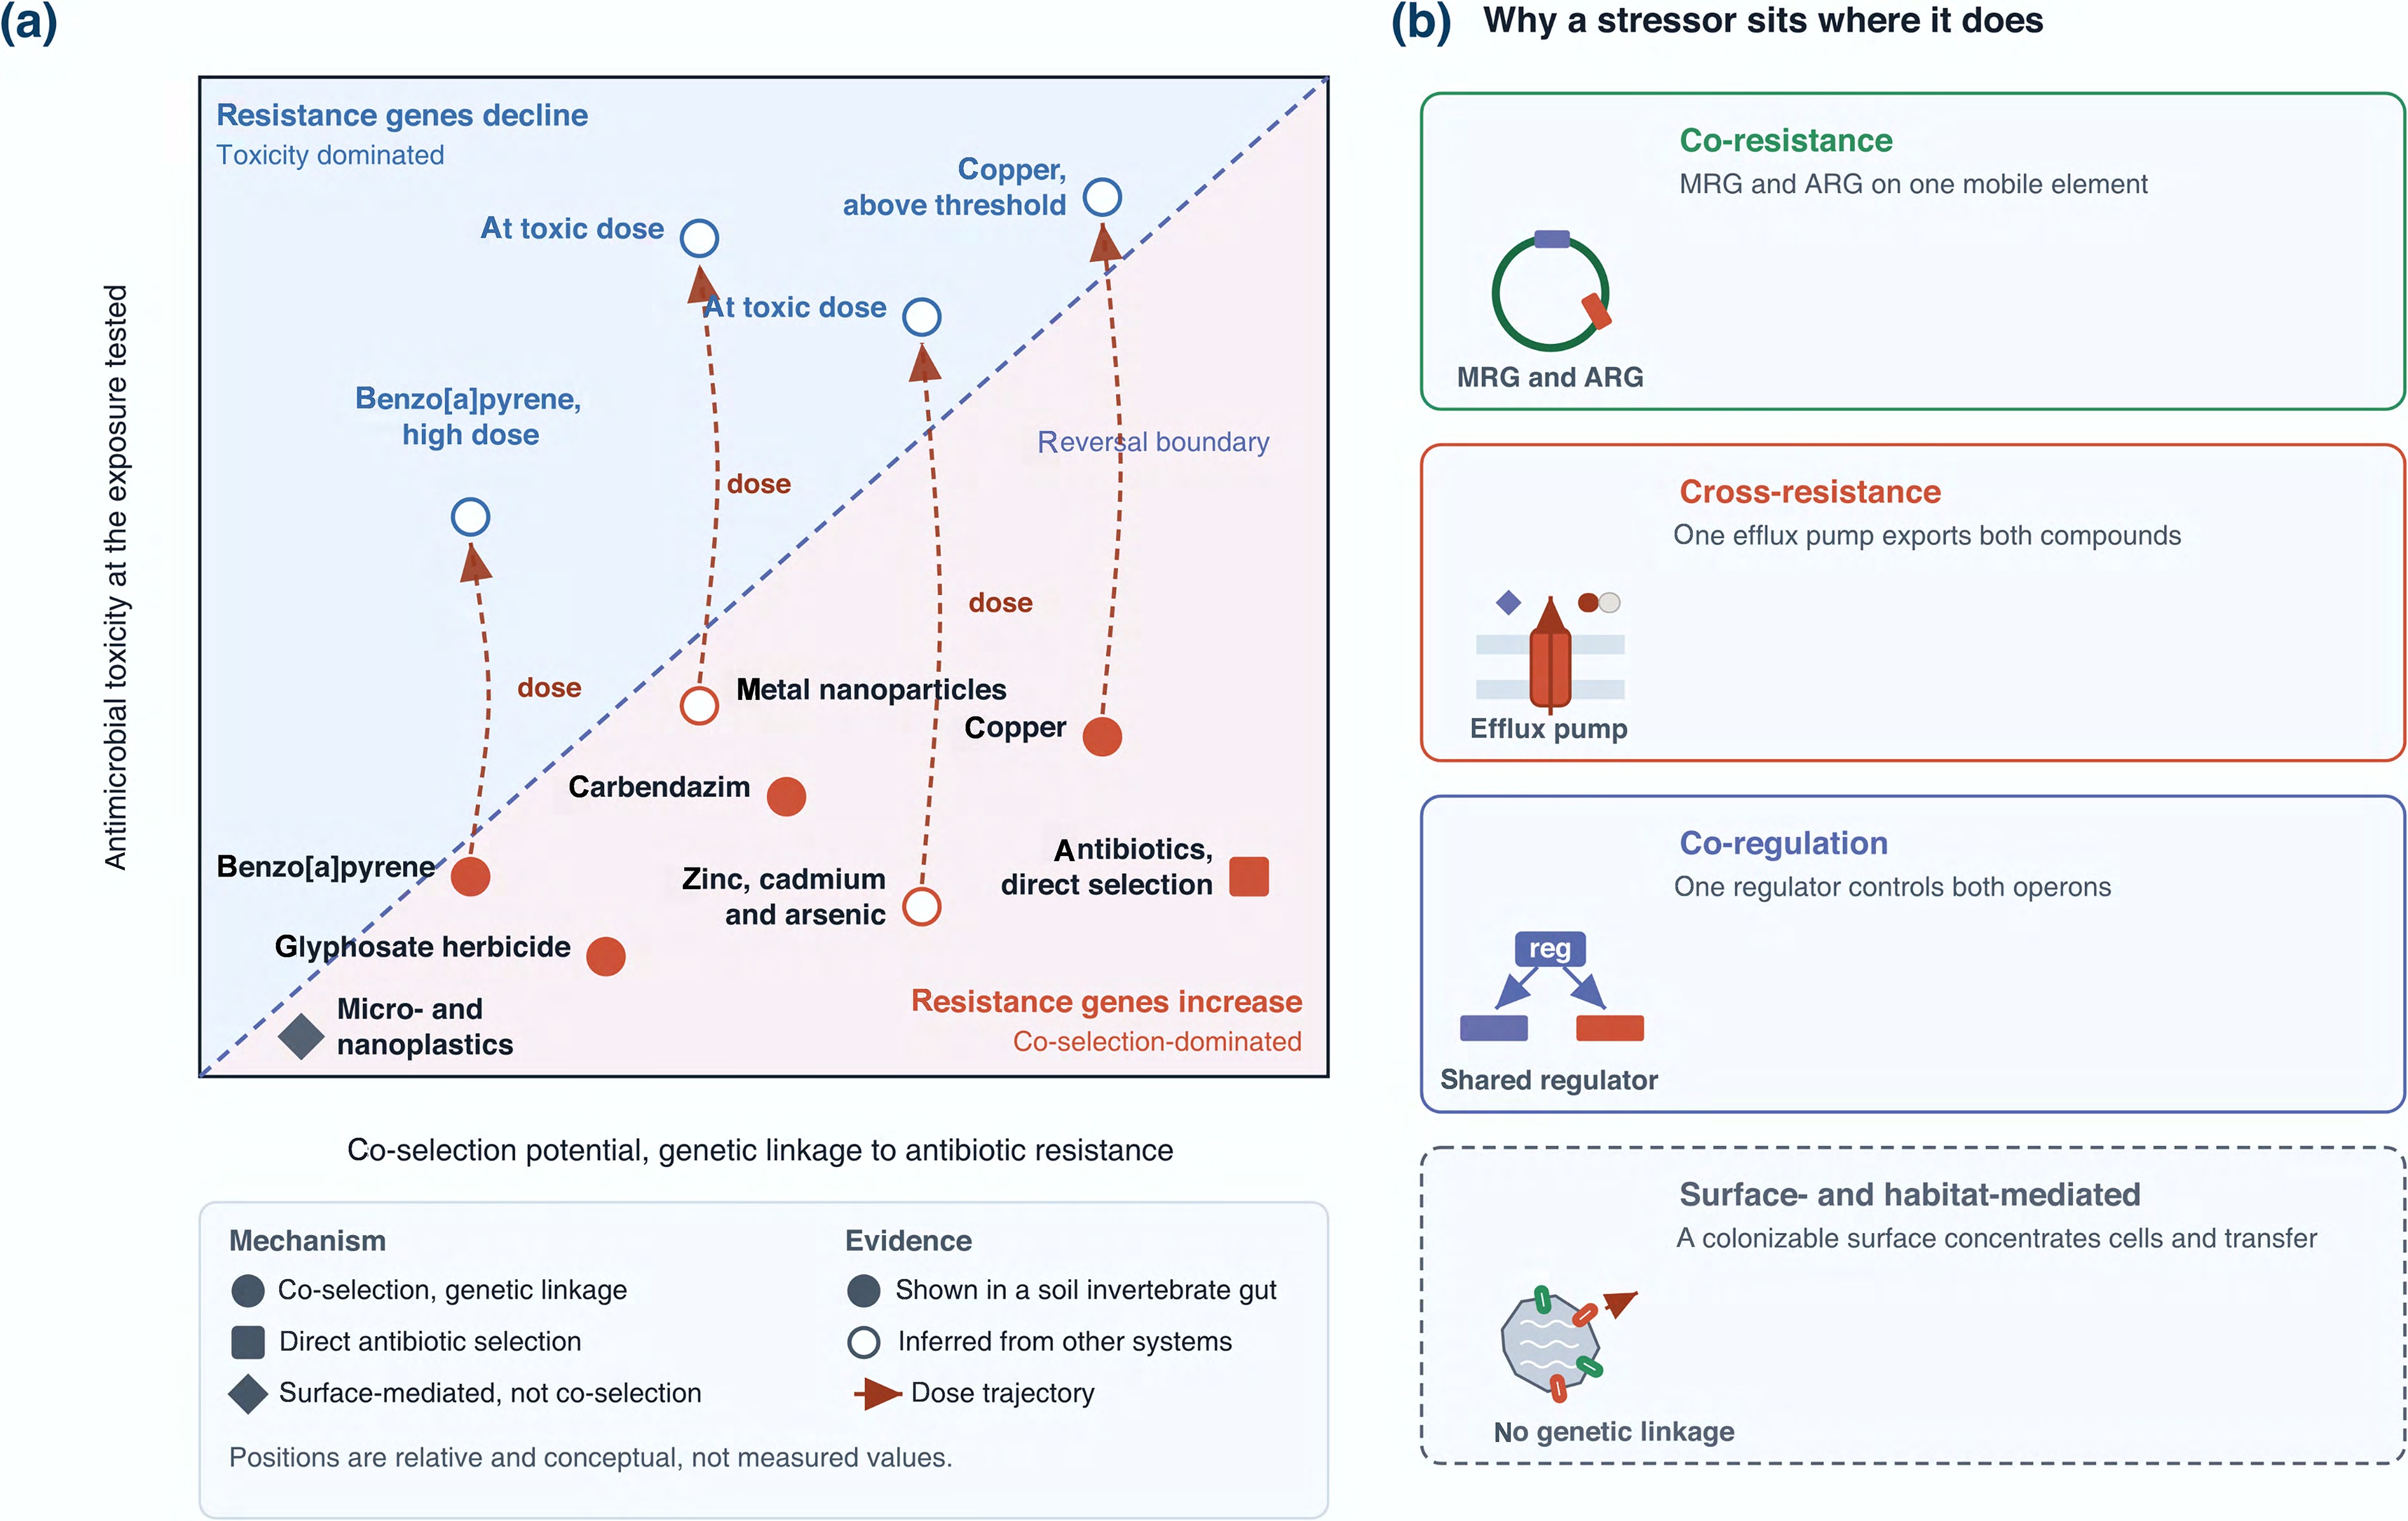
Figure 2.
Resolving contradiction domain one using a toxicity-to-co-selection framework. Representative stressors are positioned according to their antimicrobial toxicity and co-selection potential. (a) Toxicity-to-co-selection landscape described above. Silver is placed toward the toxicity-dominated region under the tested conditions, where ARG abundance can be predicted to decline. Carbendazim, sublethal metal(loid)s, and plastic particles occupy the co-selection-dominated region, where ARG abundance can be predicted to increase. The dashed boundary illustrates the conceptual transition at which increasing exposure shifts the dominant process from co-selection to toxicity. (b) Four molecular mechanisms that can place a stressor in the co-selection-dominated region: co-resistance through a shared mobile element, cross-resistance through a shared efflux pump, co-regulation through a shared regulator, and surface- or habitat-mediated co-occurrence without genetic linkage, together with the evidential basis, shown in a soil invertebrate gut or inferred from other systems, for each stressor position. Positions in both panels are relative and conceptual rather than measured coordinates.
-
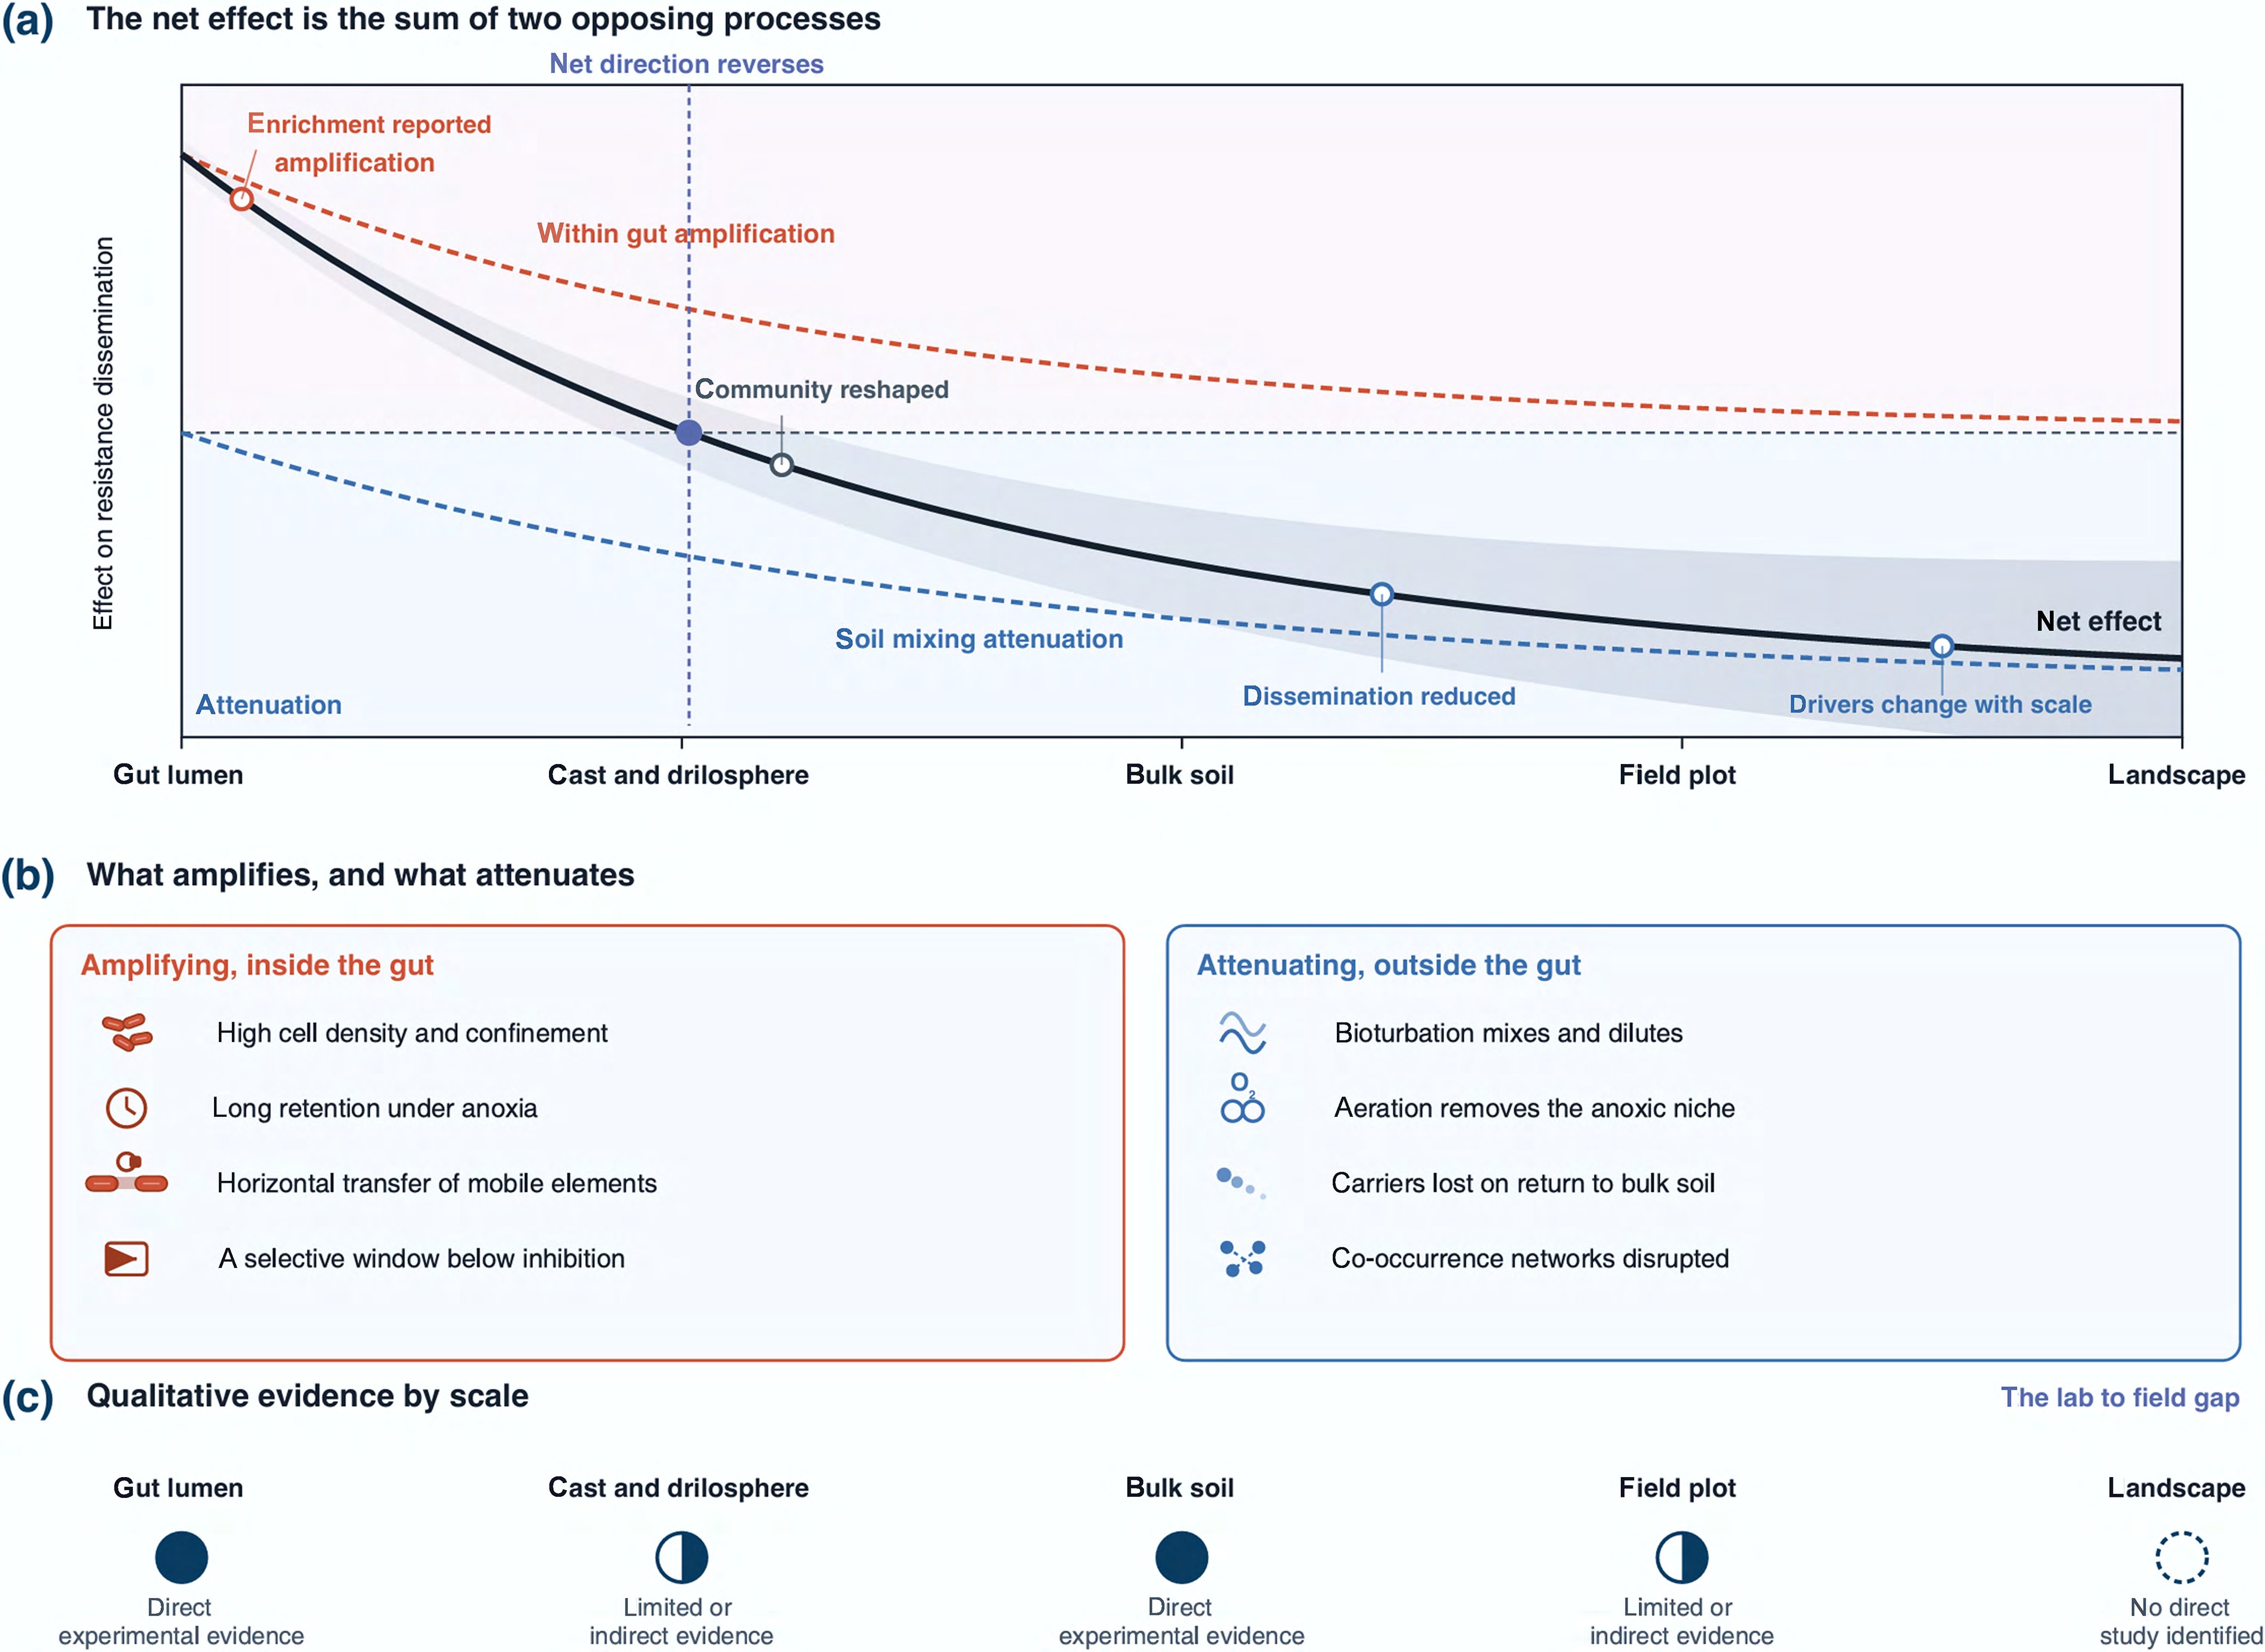
Figure 3.
Scale-dependent amplification and attenuation of resistance dissemination. (a) Plotting the net effect as the sum of an amplifying process inside the gut and an attenuating process outside the gut across this spatial axis. The horizontal axis represents spatial scales ranging from the gut lumen to the landscape. Within-gut concentration and horizontal transfer amplify resistance dissemination locally, whereas bioturbation and soil mixing attenuate dissemination at larger scales. The dashed curve illustrates the conceptual transition where the net outcome can be predicted to shift from amplification to attenuation. (b) Specific mechanisms that amplify resistance dissemination inside the gut and that attenuate it outside the gut. (c) Scale-by-scale summary of whether direct experimental evidence, indirect or limited evidence, or no identified study currently supports the curve shown in (a), which is the evidential gap discussed in the main text.
-
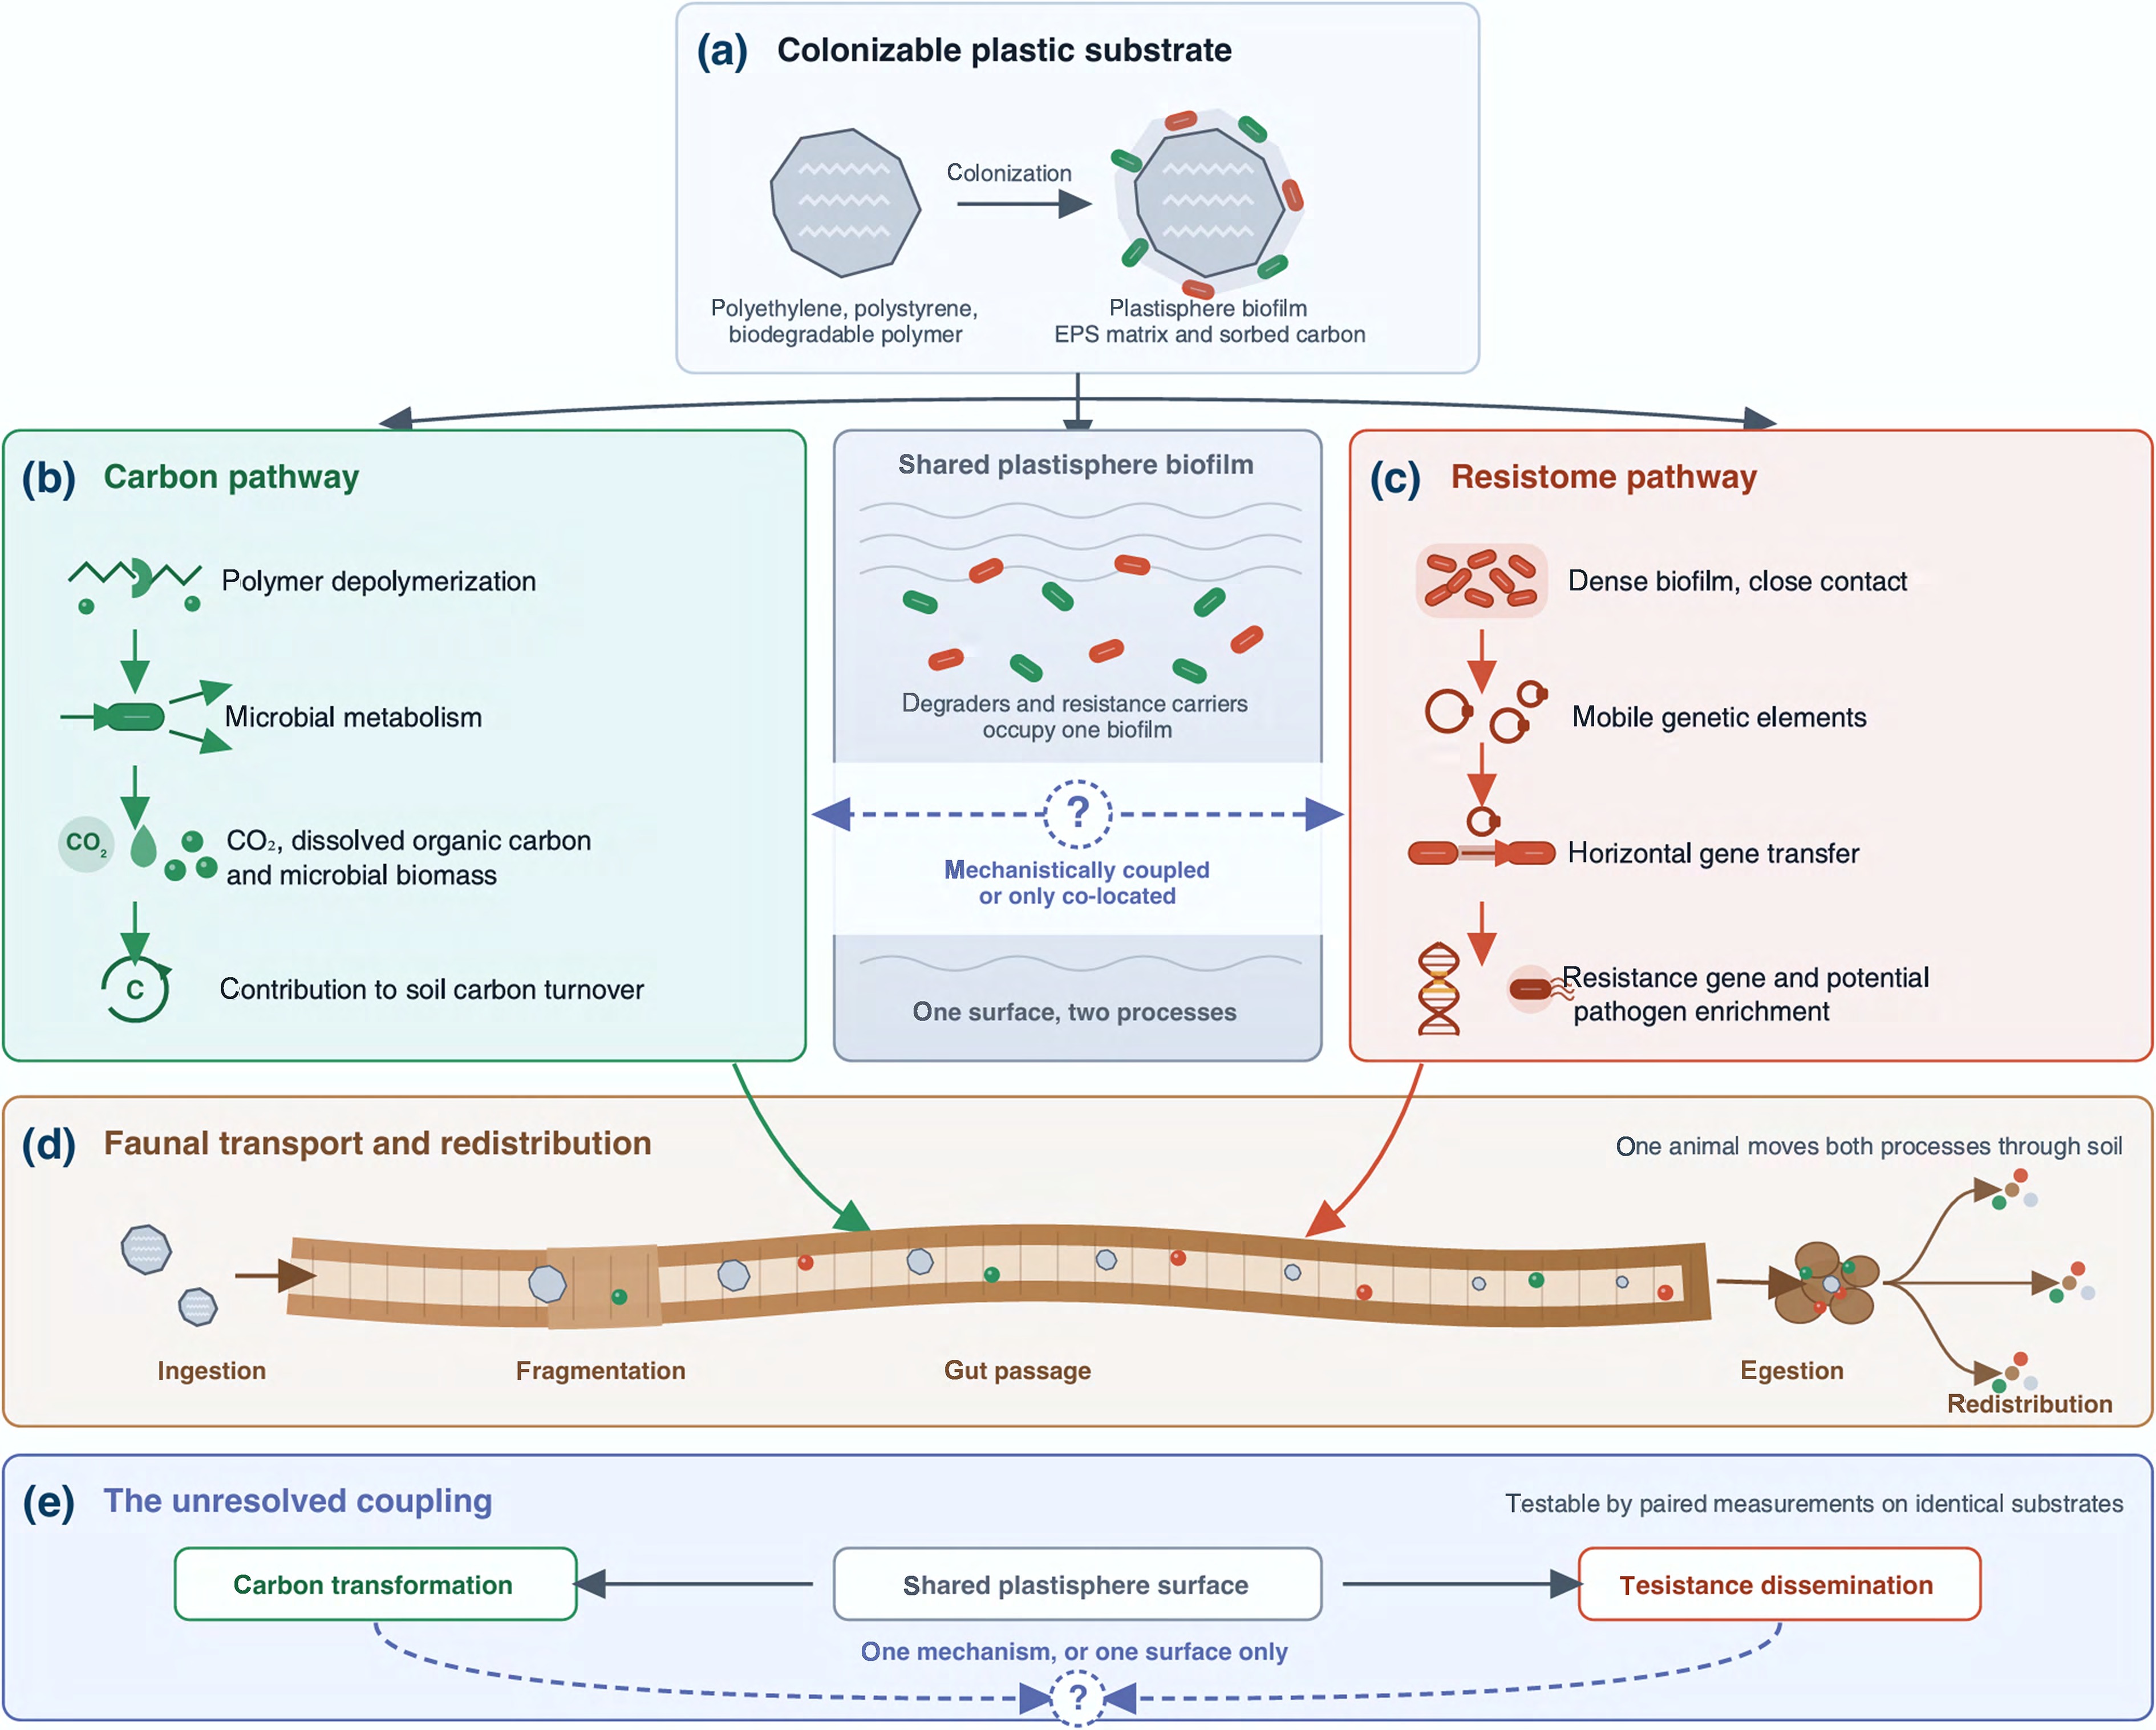
Figure 4.
The plastisphere as a mobile biogeochemical reactor. (a) A plastic particle presents a carbon-associated surface that can be colonized by a distinct biofilm held in an EPS matrix. (b) The carbon pathway, in which polymer depolymerization and microbial metabolism release carbon dioxide, dissolved organic carbon, and biomass, and contribute to soil carbon turnover. (c) The resistome pathway, in which a dense biofilm, mobile genetic elements, and HGT enrich ARGs and potential pathogens. The central column is the shared biofilm, where degraders and resistance carriers occupy one surface. (d) Soil fauna ingest, fragment, and redistribute the particles together with their associated microbiota, which carries both processes through soil. (e) The unresolved coupling. Whether carbon transformation and resistance dissemination arise from one mechanism or merely occur on one surface is drawn as a dashed link, and it remains an open and testable question.
-
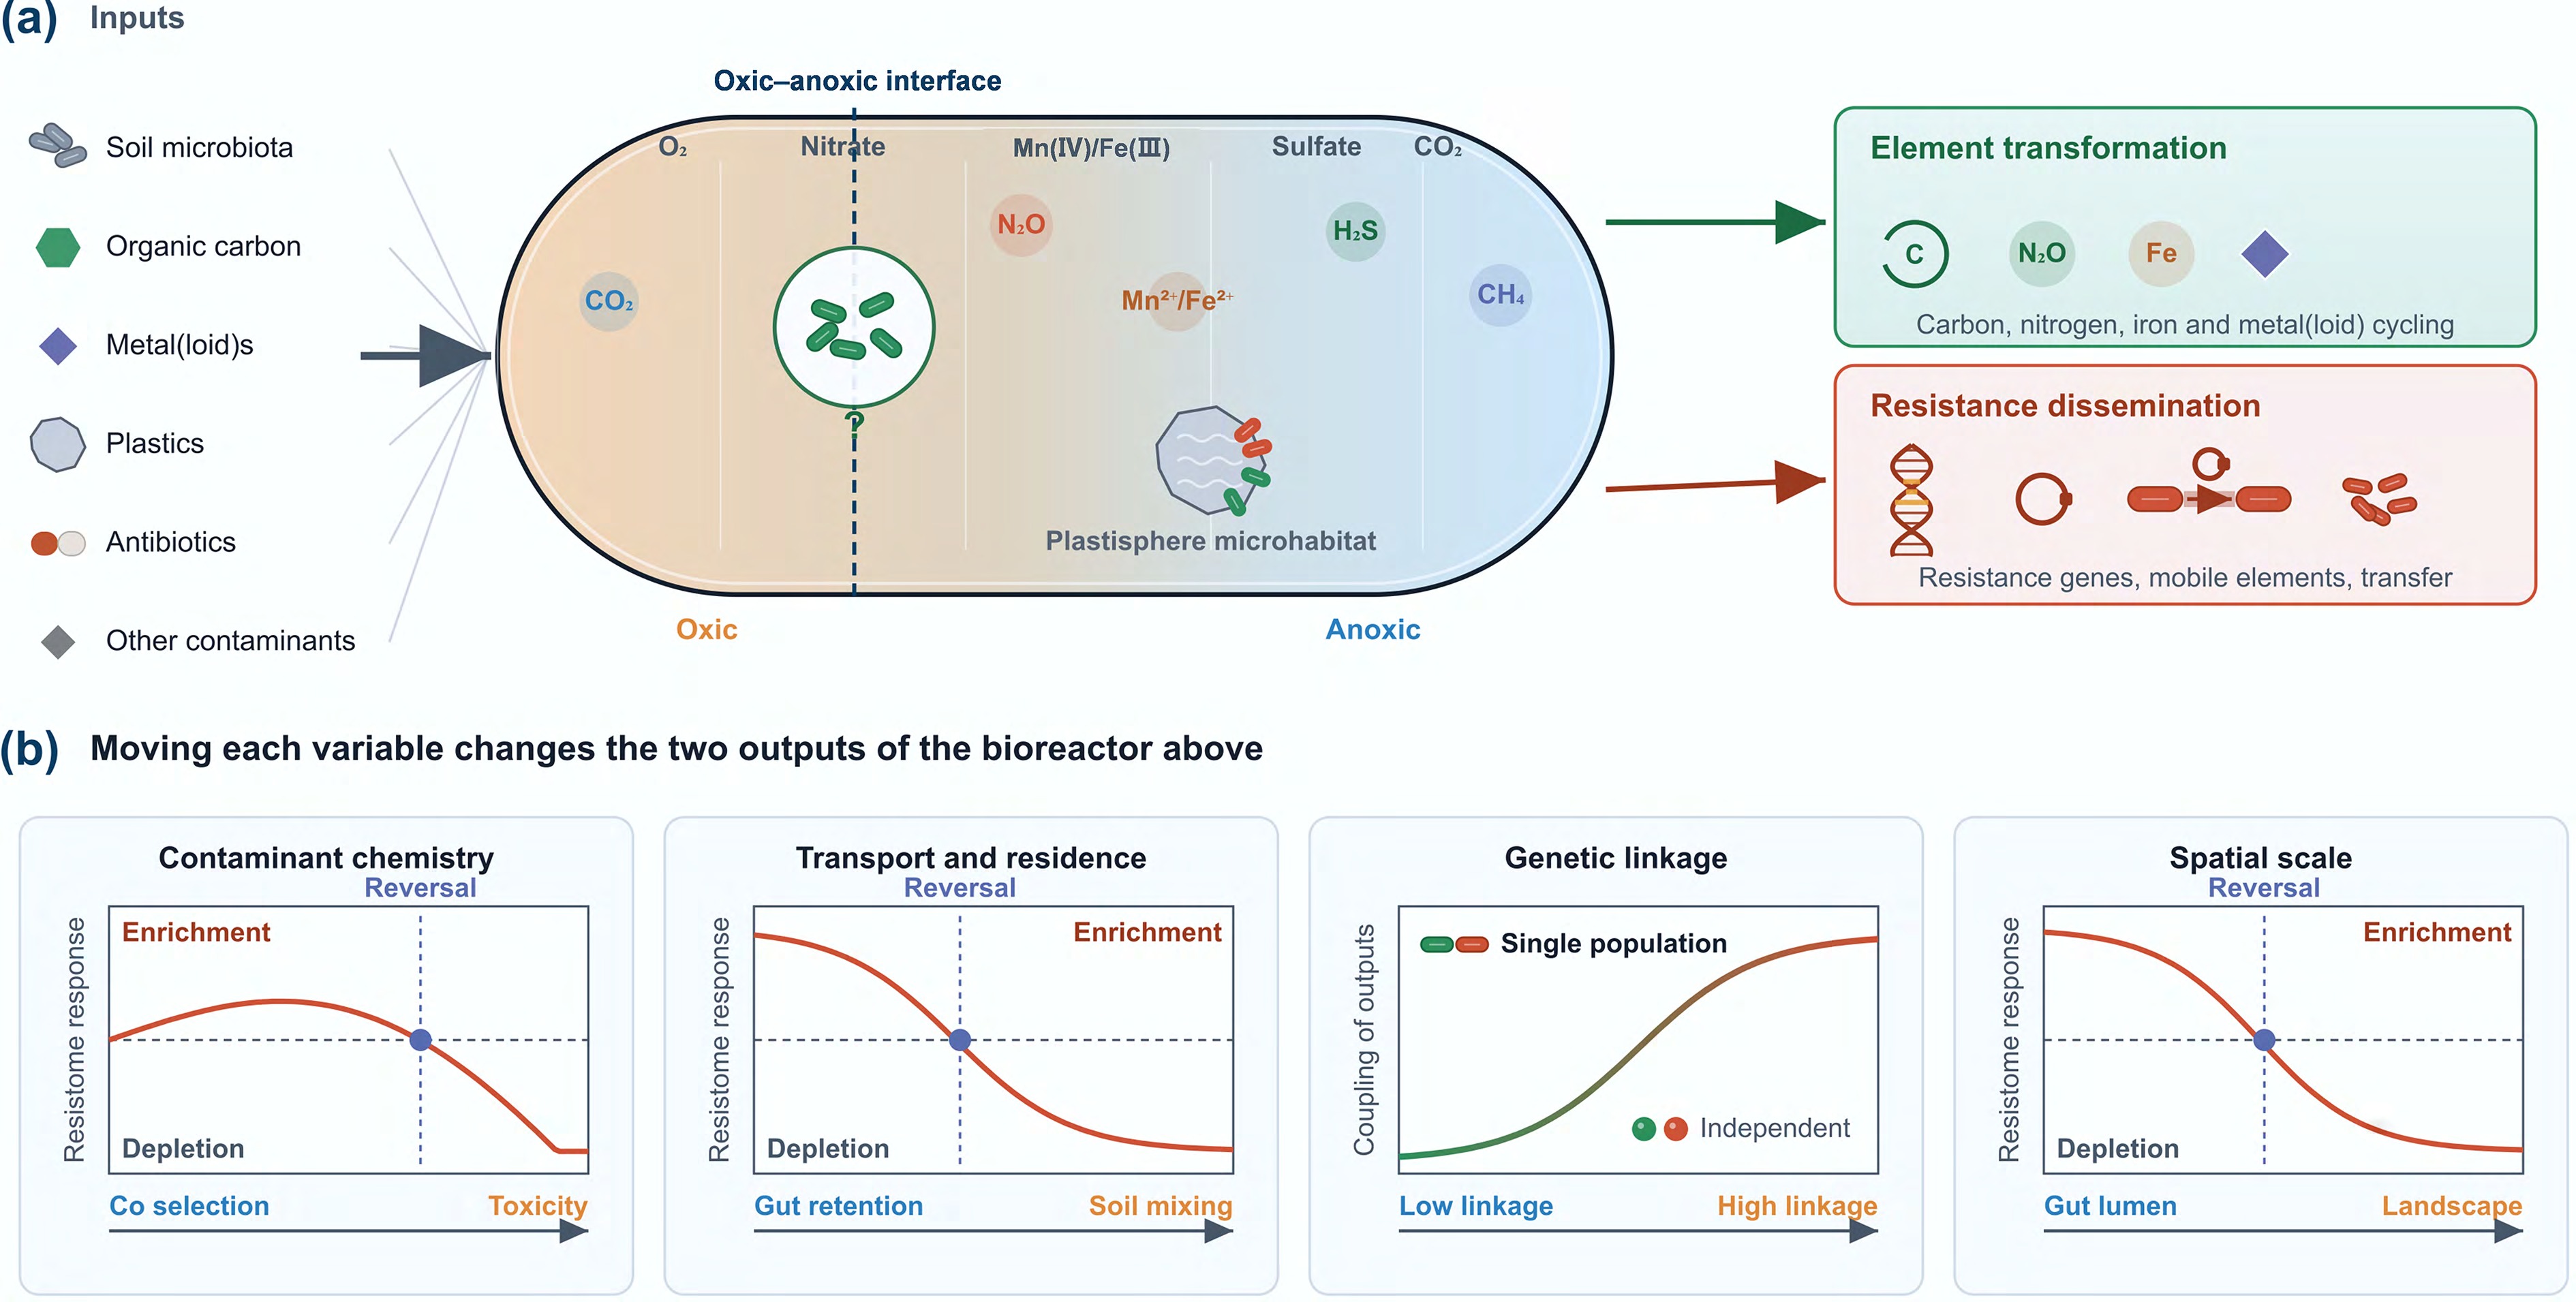
Figure 5.
The soil invertebrate gut as a coupled bioreactor. The transient oxic–anoxic interface created during gut passage functions as a shared physicochemical control that simultaneously regulates biogeochemical transformations and the microbial processes that shape resistome dynamics. (a) Ingested soil microbiota, organic carbon, metal(loid)s, plastics, and other contaminants enter the gut, where a steep redox gradient can promote sequential electron-accepting reactions. The denitrifying guild can be shown as an illustrative shared functional node, one of several candidate guilds, linking two coupled outputs: element transformation and resistance dissemination. (b) Four variables influence how the coupled reactor can be expressed: contaminant chemistry (toxicity vs co-selection), the balance between gut retention and soil mixing, genetic linkage between functional guilds and resistance determinants, and the spatial scale over which individual gut interfaces are integrated. Together, these variables explain the direction and magnitude of coupled ecological outcomes.
-
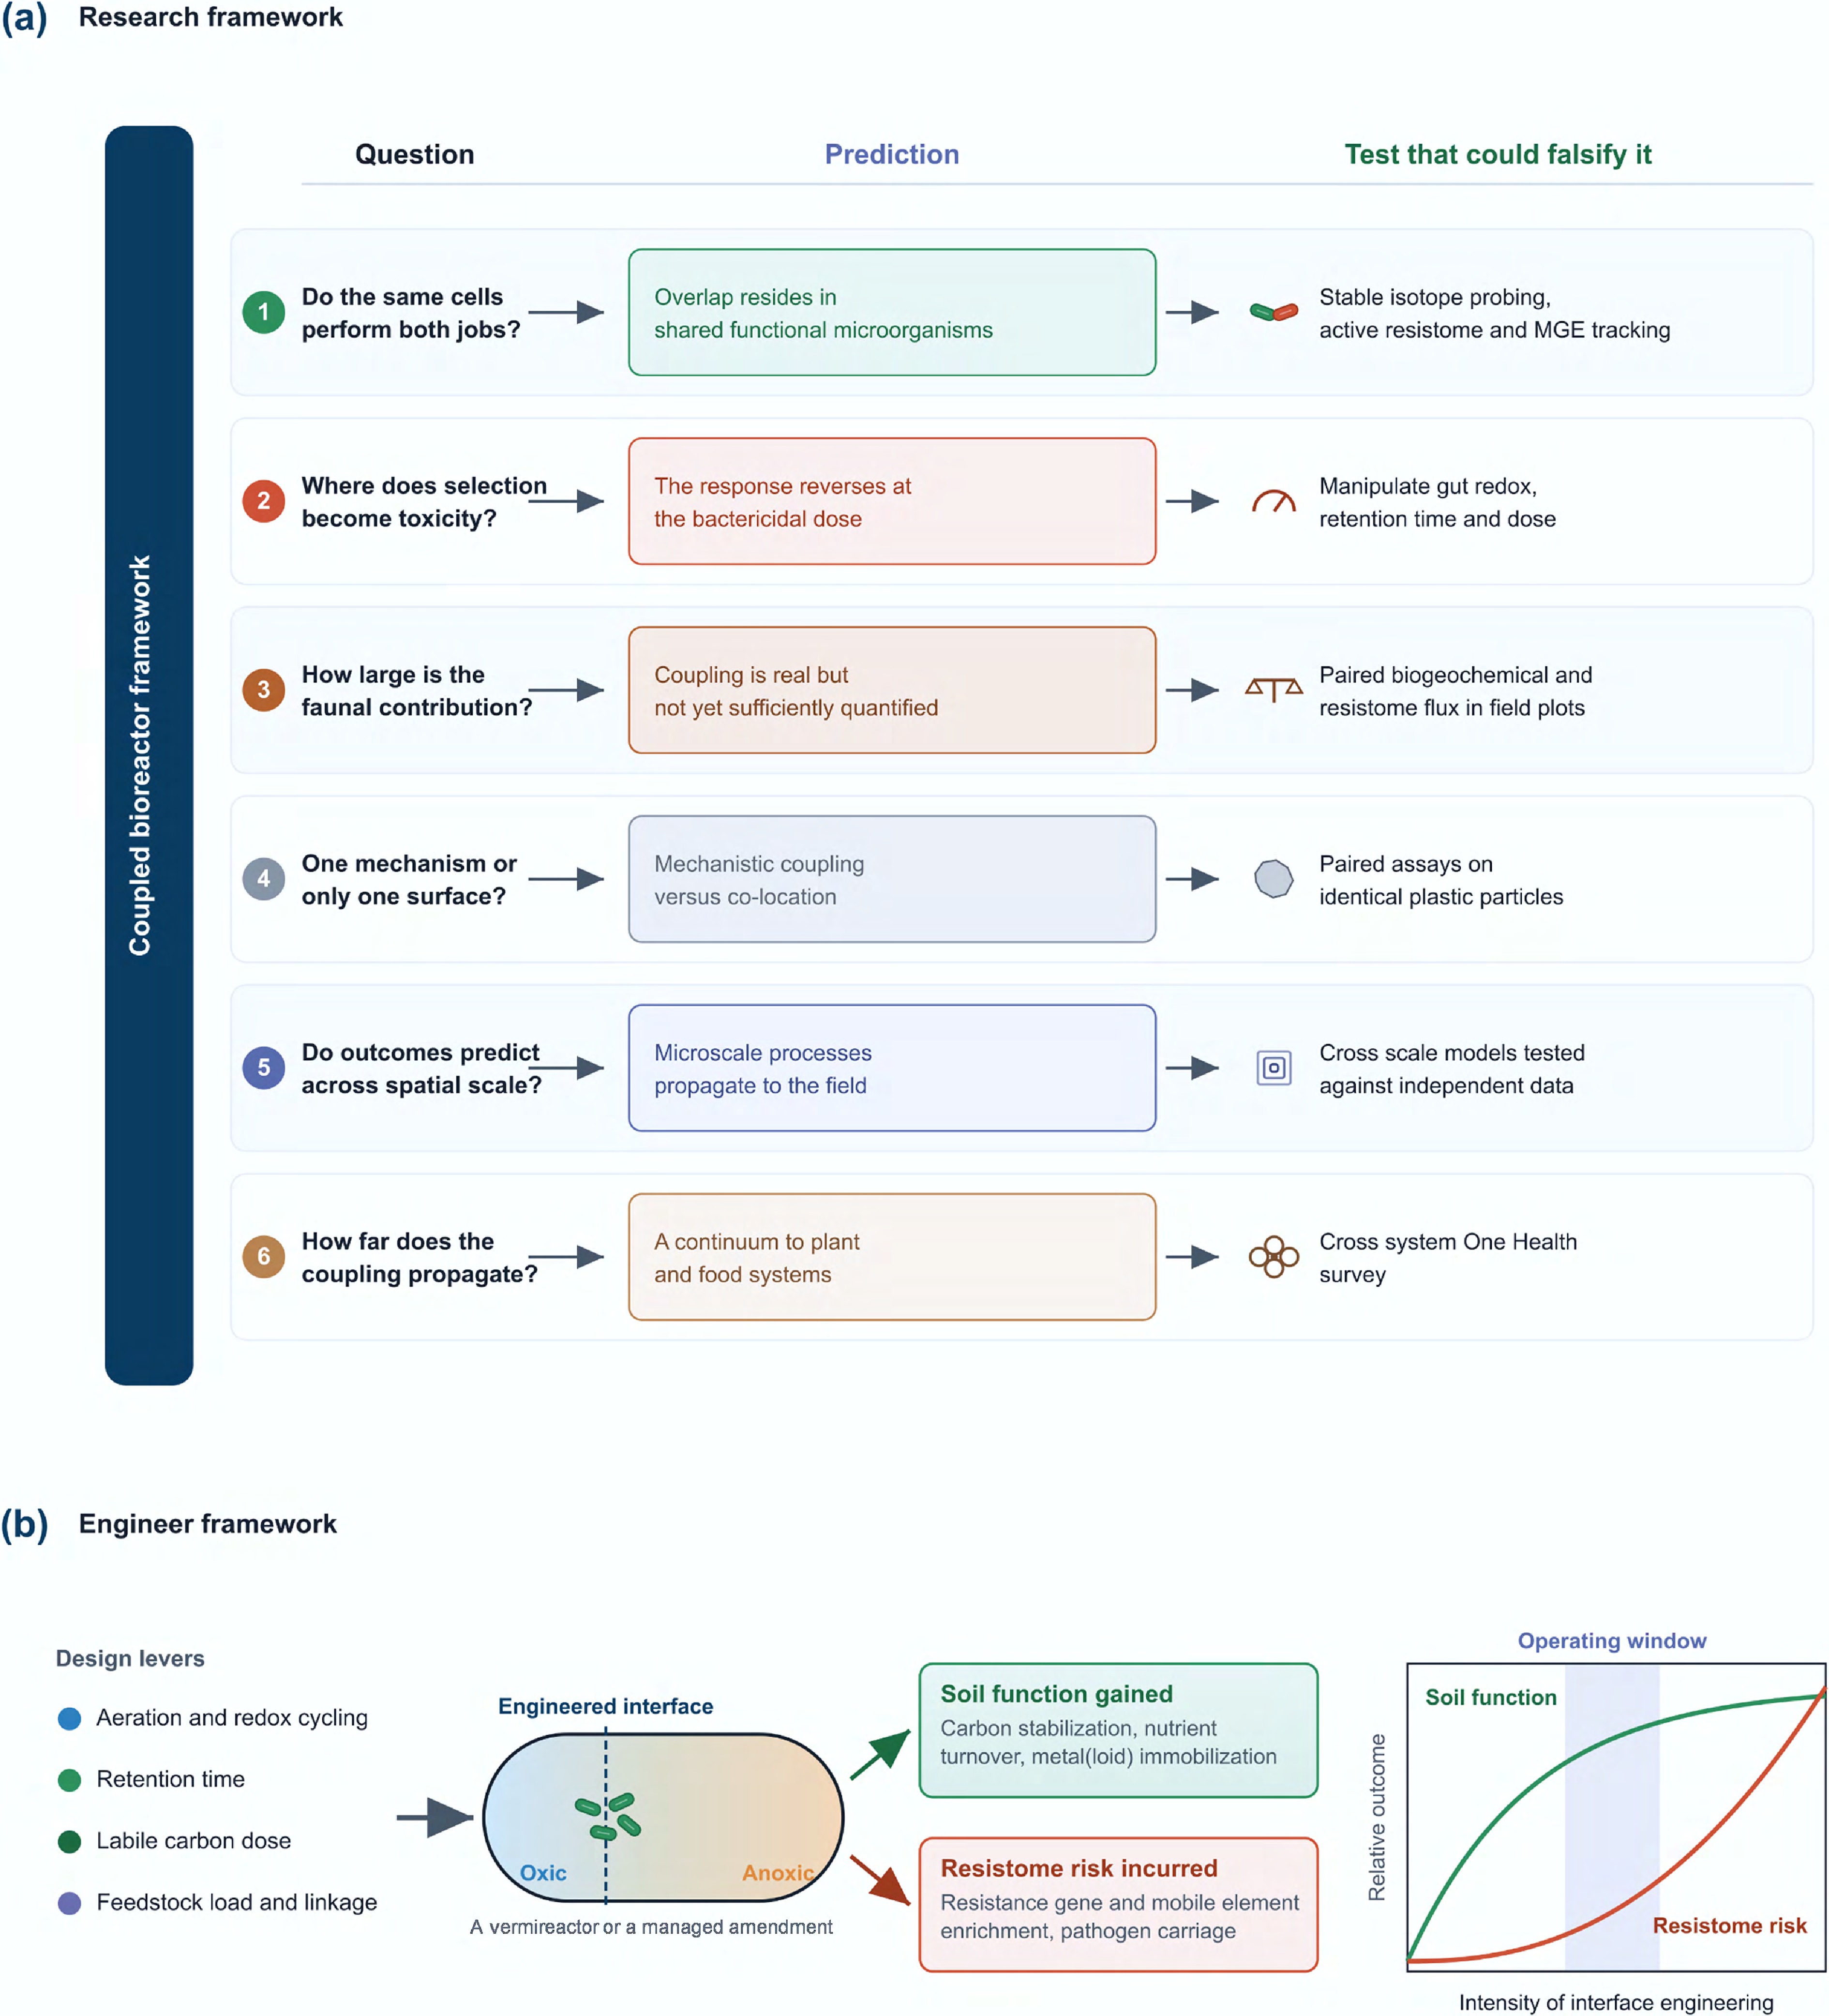
Figure 6.
From testable predictions to an engineering constraint. (a) Each prediction of the coupled reactor framework is placed beside the question it answers and the experiment that could falsify it, spanning function-resolved measurement, the transition from co-selection to toxicity, field-scale mass balance, the plastisphere mechanism, cross-scale modeling, and One Health integration. (b) The same coupling constrains any attempt to engineer the interface deliberately. Design levers such as aeration and redox cycling, retention time, labile carbon dose, and feedstock composition act on one engineered oxic–anoxic interface, which yields a gain in soil function and a resistome risk at the same time. Because benefit saturates while risk accelerates, the framework predicts an operating window in which the coupling remains favorable. This trade-off can be a prediction of the framework rather than a demonstrated result; no such reactor has been built or tested, and the prediction is falsifiable, since soil function raised without opening the selective window would show the coupling to be weaker than claimed.
-
Box 1 Why abundance alone does not indicate resistance risk Most evidence for contaminant effects on the gut resistome comes from measurements of ARG abundance. Such measurements provide valuable ecological information but should not be interpreted as direct evidence of increased resistance risk, defined here as a combined increase in ARG abundance, ARG mobility and the host range of ARG carriers. What abundance measurements show. Quantitative molecular surveys[20]. They establish whether resistance determinants become more or less common within a microbial community. What abundance measurements cannot show. Gene abundance alone does not demonstrate expression, horizontal transfer, association with pathogens or functional activity. Likewise, co-occurrence between MRGs and ARGs can be consistent with co-selection but does not prove it, because genomic linkage, shared hosts and shared environmental drivers can produce the same pattern[86,87]. What additional evidence is needed. Demonstrating increased resistance risk requires function-resolved evidence, including host attribution, physical linkage to MGEs and, where possible, direct evidence of HGT[72,90]. Interpretation. Throughout this review, enrichment and depletion refer to changes in ARG abundance unless functional evidence is available. Co-selection can be interpreted as a plausible mechanism supported by current evidence but requiring direct confirmation, and HGT can be considered supported only when evidence goes beyond ARG co-occurrence. Resistome risk, a term used later in this Review, denotes the combined increase in ARG abundance, ARG mobility and the host range of ARG carriers. This distinction between abundance and risk is maintained throughout the three contradiction domains that follow. Unless stated otherwise, enrichment and depletion in these domains refer to changes in ARG abundance rather than to demonstrated changes in mobility or host range.
Figures
(6)
Tables
(1)