-
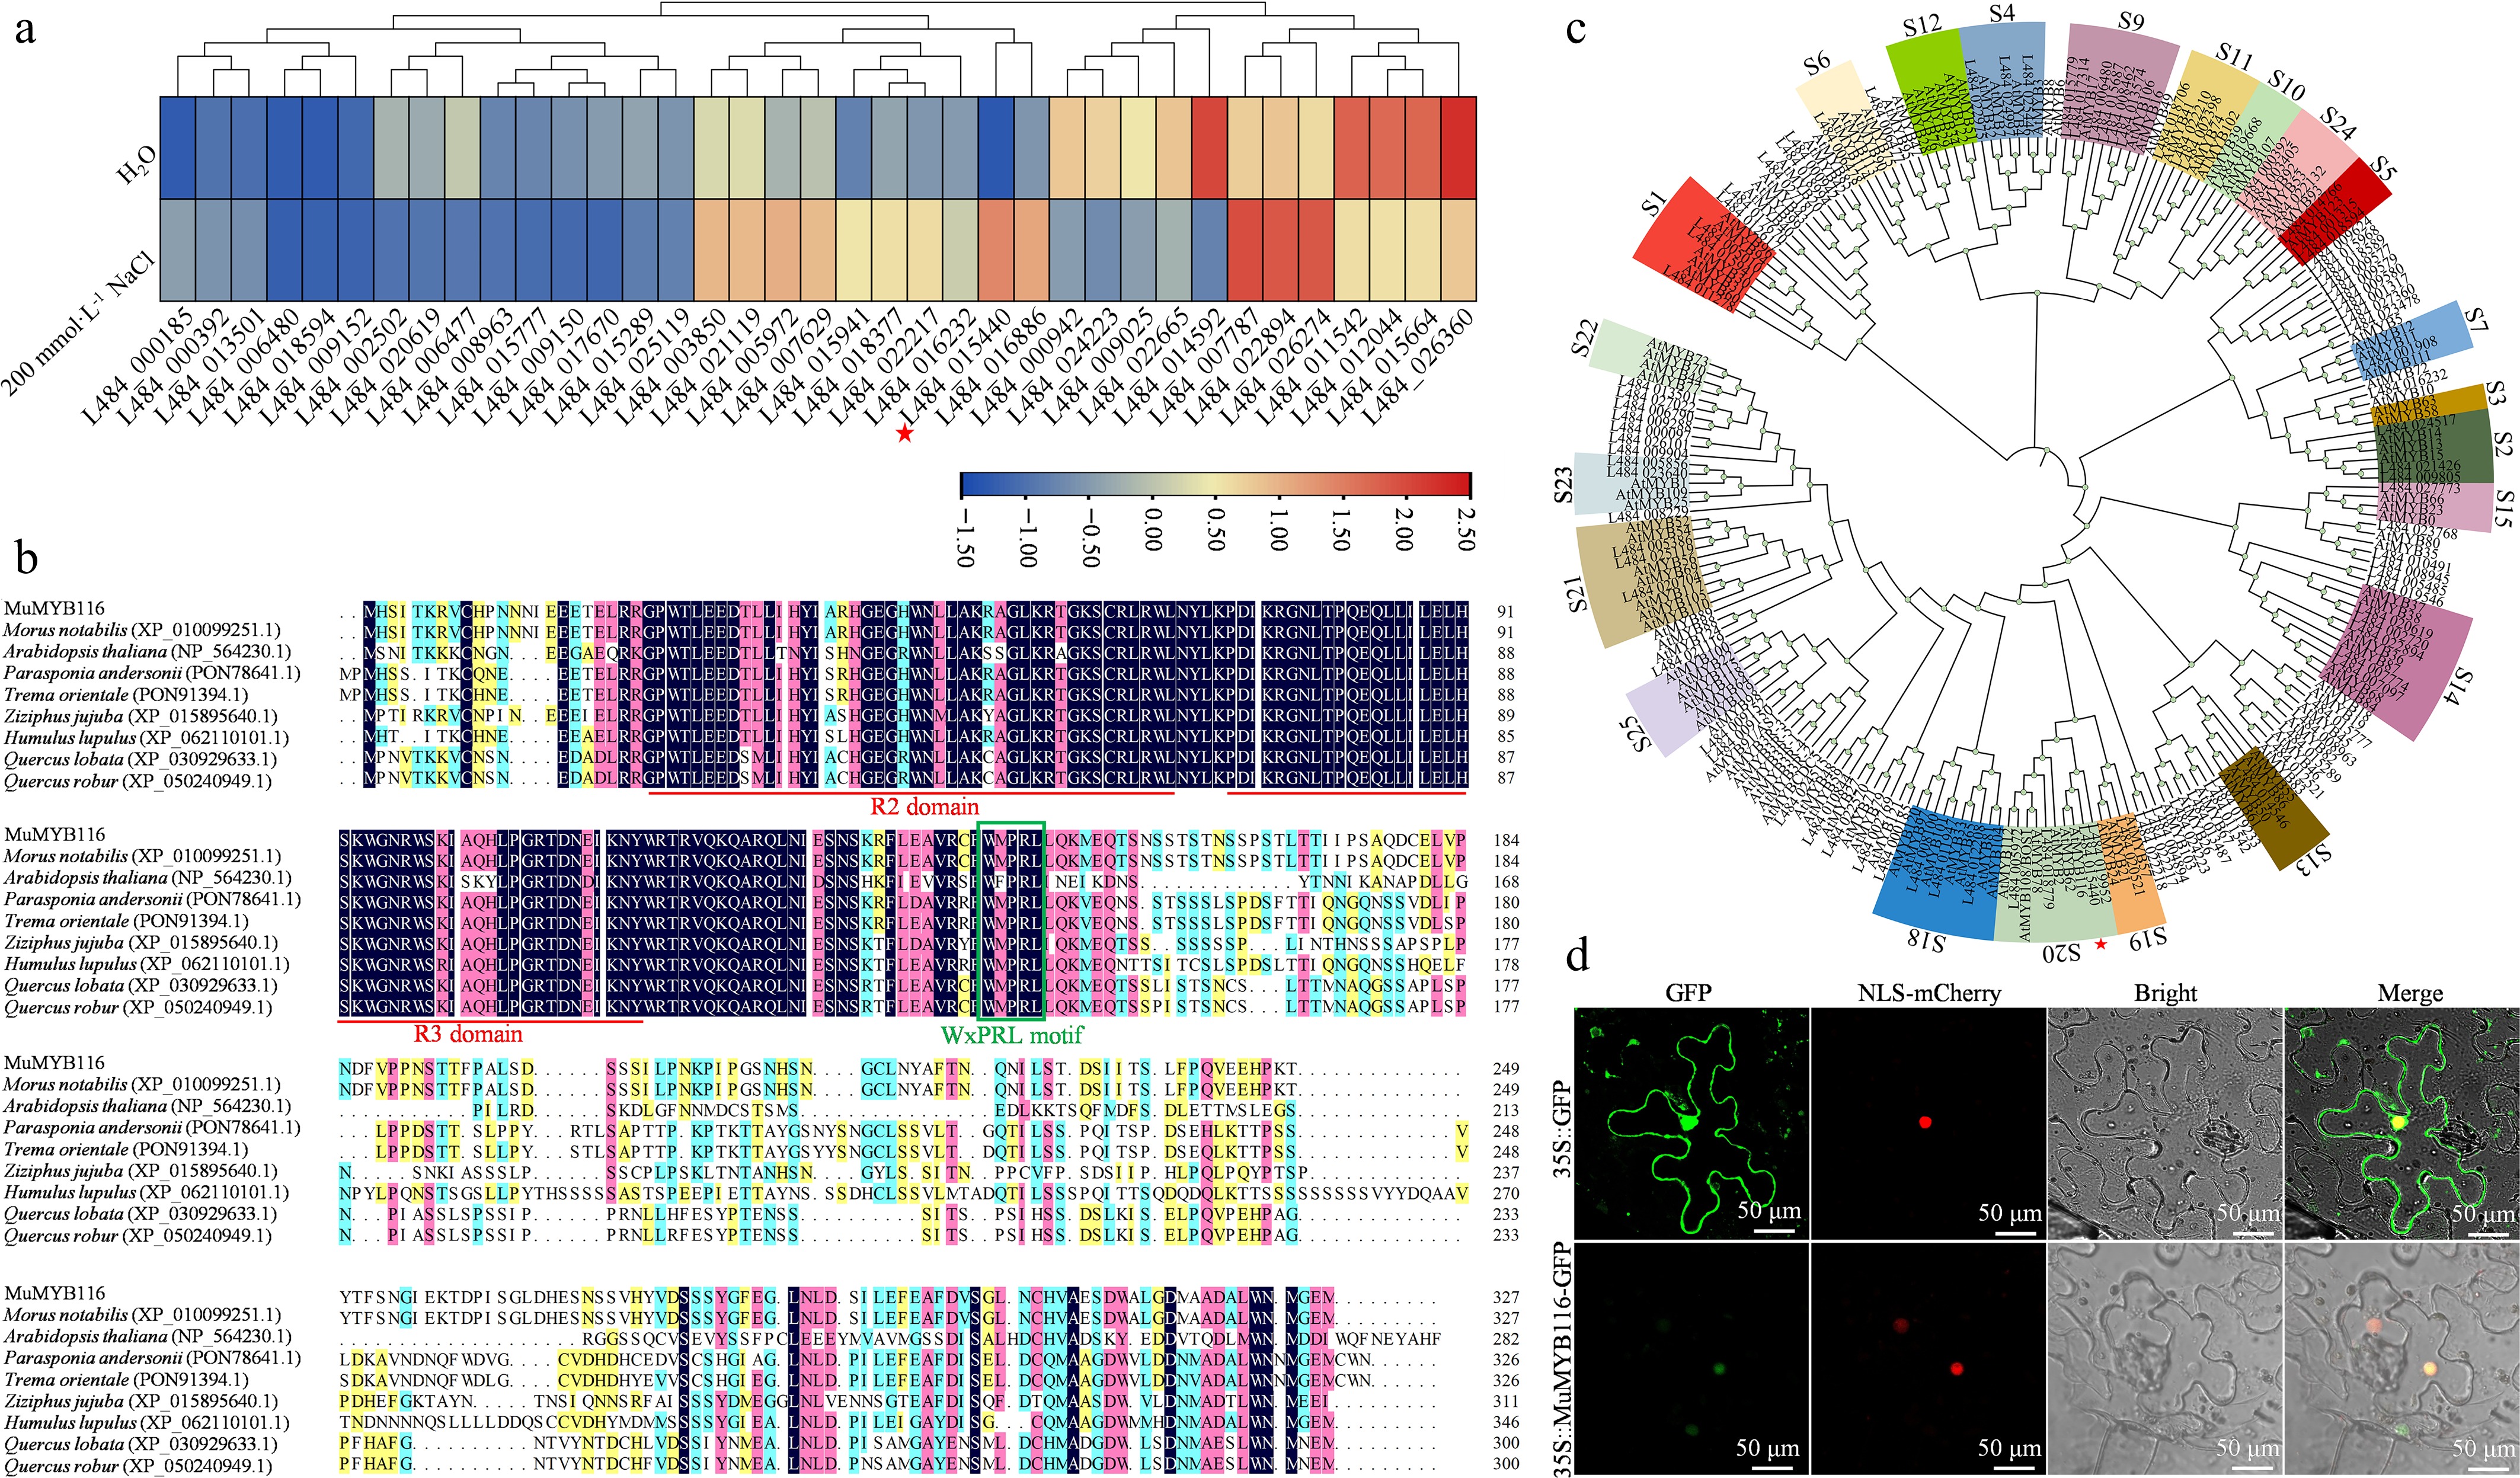
Figure 1.
Identification and phylogenetic analysis of MuMYB116 in mulberry. (a) Heatmap of differentially expressed MYB genes in salt-treated mulberry roots based on transcriptome data (log2fold change > 1 or < −1, p < 0.05). Locus L484_015440 (annotated as MuMYB116) is marked with a red asterisk. (b) Multiple sequence alignment showing conserved R2 and R3 MYB domains and the S20 subgroup-specific WxPRL motif of MuMYB116 and homologous proteins. (c) Neighbor-joining phylogenetic tree of R2R3-MYB proteins from Arabidopsis and Morus notabilis constructed with 1,000 bootstrap replicates. MuMYB116 (marked with a red asterisk) clusters within the Arabidopsis S20 subgroup. (d) Subcellular localization of 35S::MuMYB116-GFP in Nicotiana benthamiana leaf epidermal cells. 35S::NLS-mCherry serves as the nuclear marker, and empty 35S::GFP is the negative control. Scale bar as indicated.
-
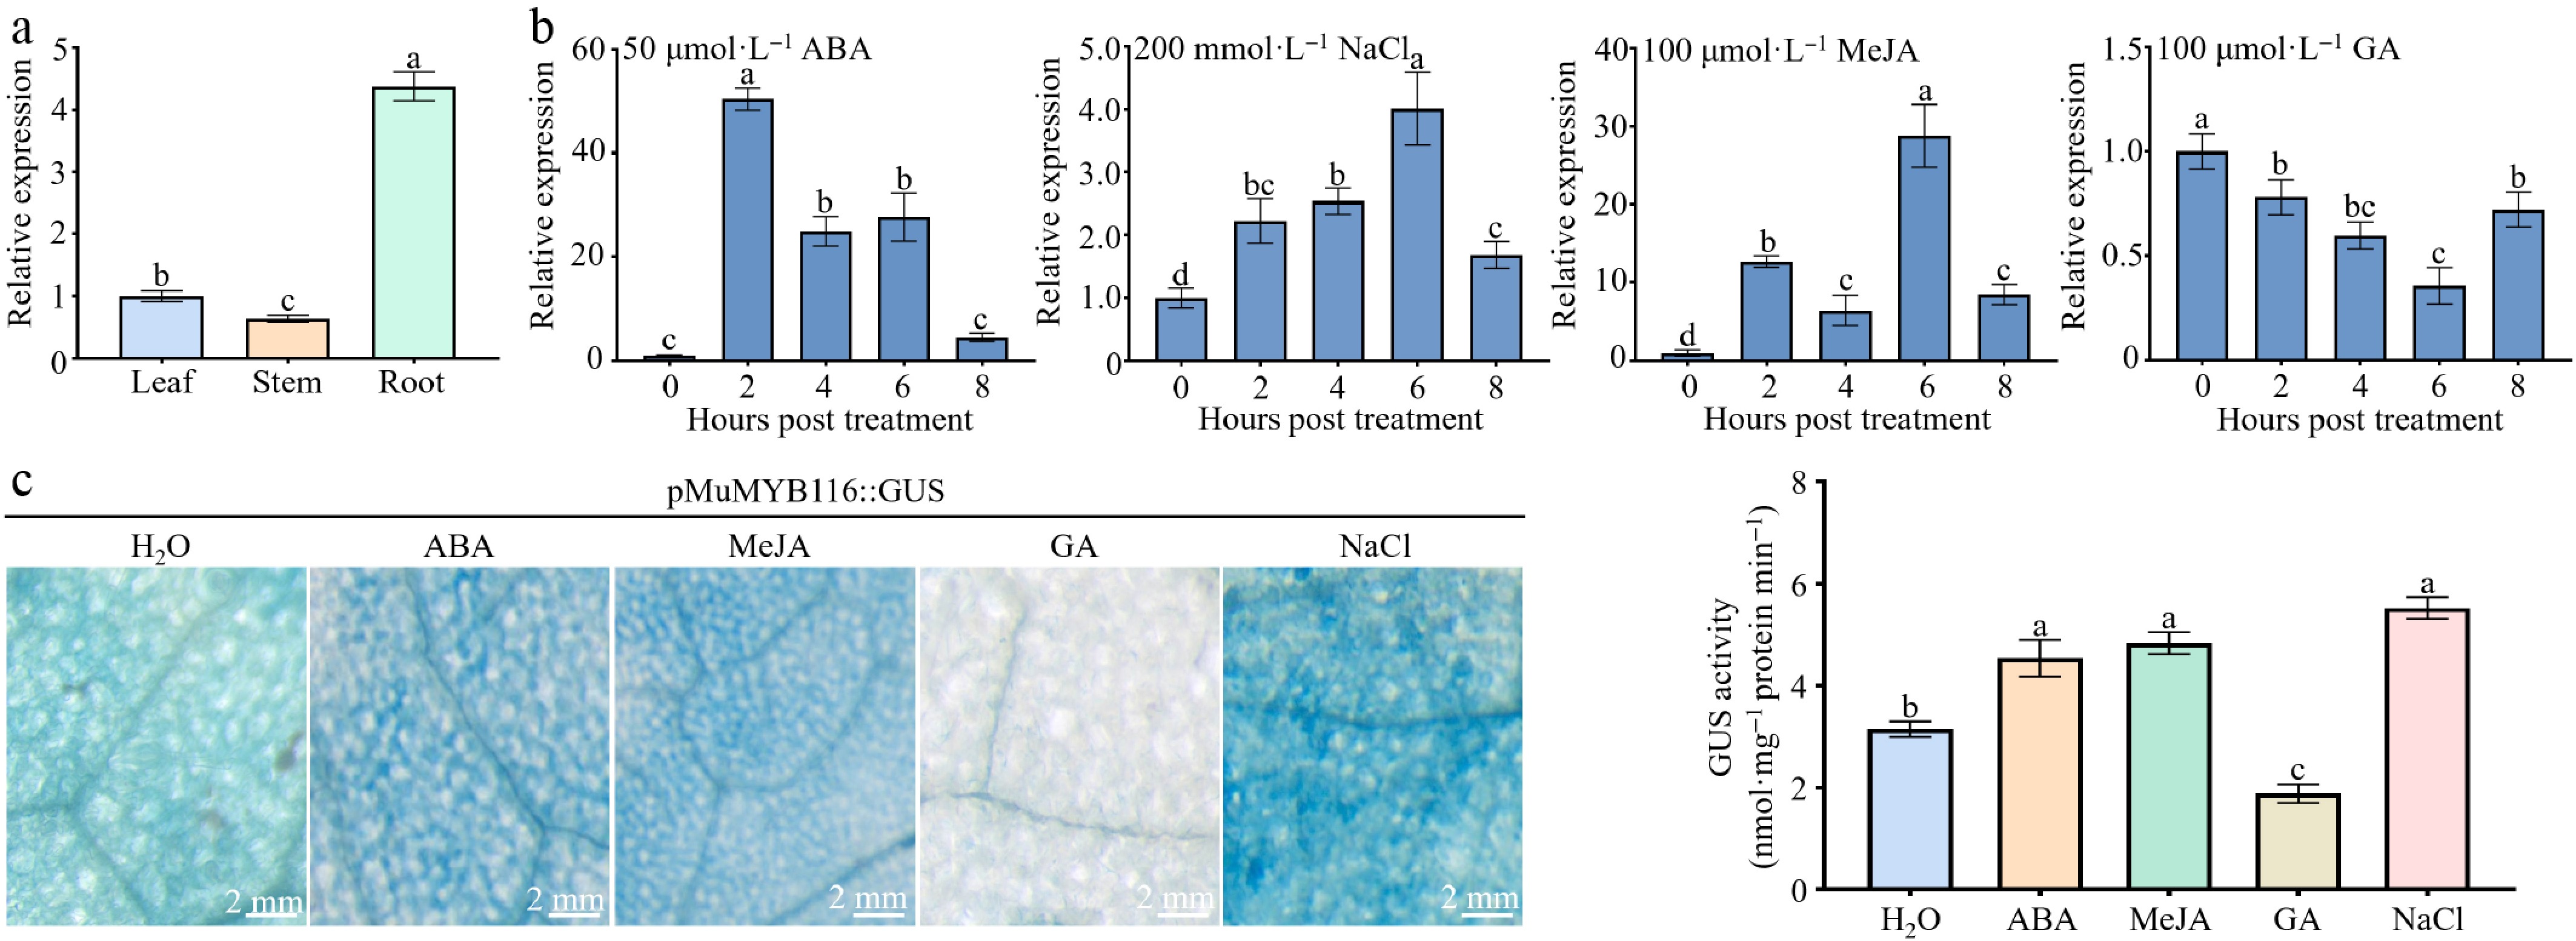
Figure 2.
Tissue- and stress-induced expression profiles of MuMYB116 and its promoter activity. (a) Tissue-specific expression of MuMYB116 in mulberry. (b) Dynamic transcriptional changes of MuMYB116 under hormone and salt treatments. Four-week-old mulberry seedlings were treated with 100 µmol·L−1 MeJA, 100 µmol·L−1 GA, 50 µmol·L−1 ABA, or 200 mmol·L−1 NaCl. (c) GUS histochemical staining and activity assay of the MuMYB116 promoter (pMuMYB116) in transiently transformed tobacco leaves under different treatments. Blue coloration indicates GUS activity driven by pMuMYB116. Data are presented as mean ± SD (n = 3 biological replicates). Different lowercase letters indicate significant differences (one-way ANOVA with Tukey's HSD test, p < 0.05).
-
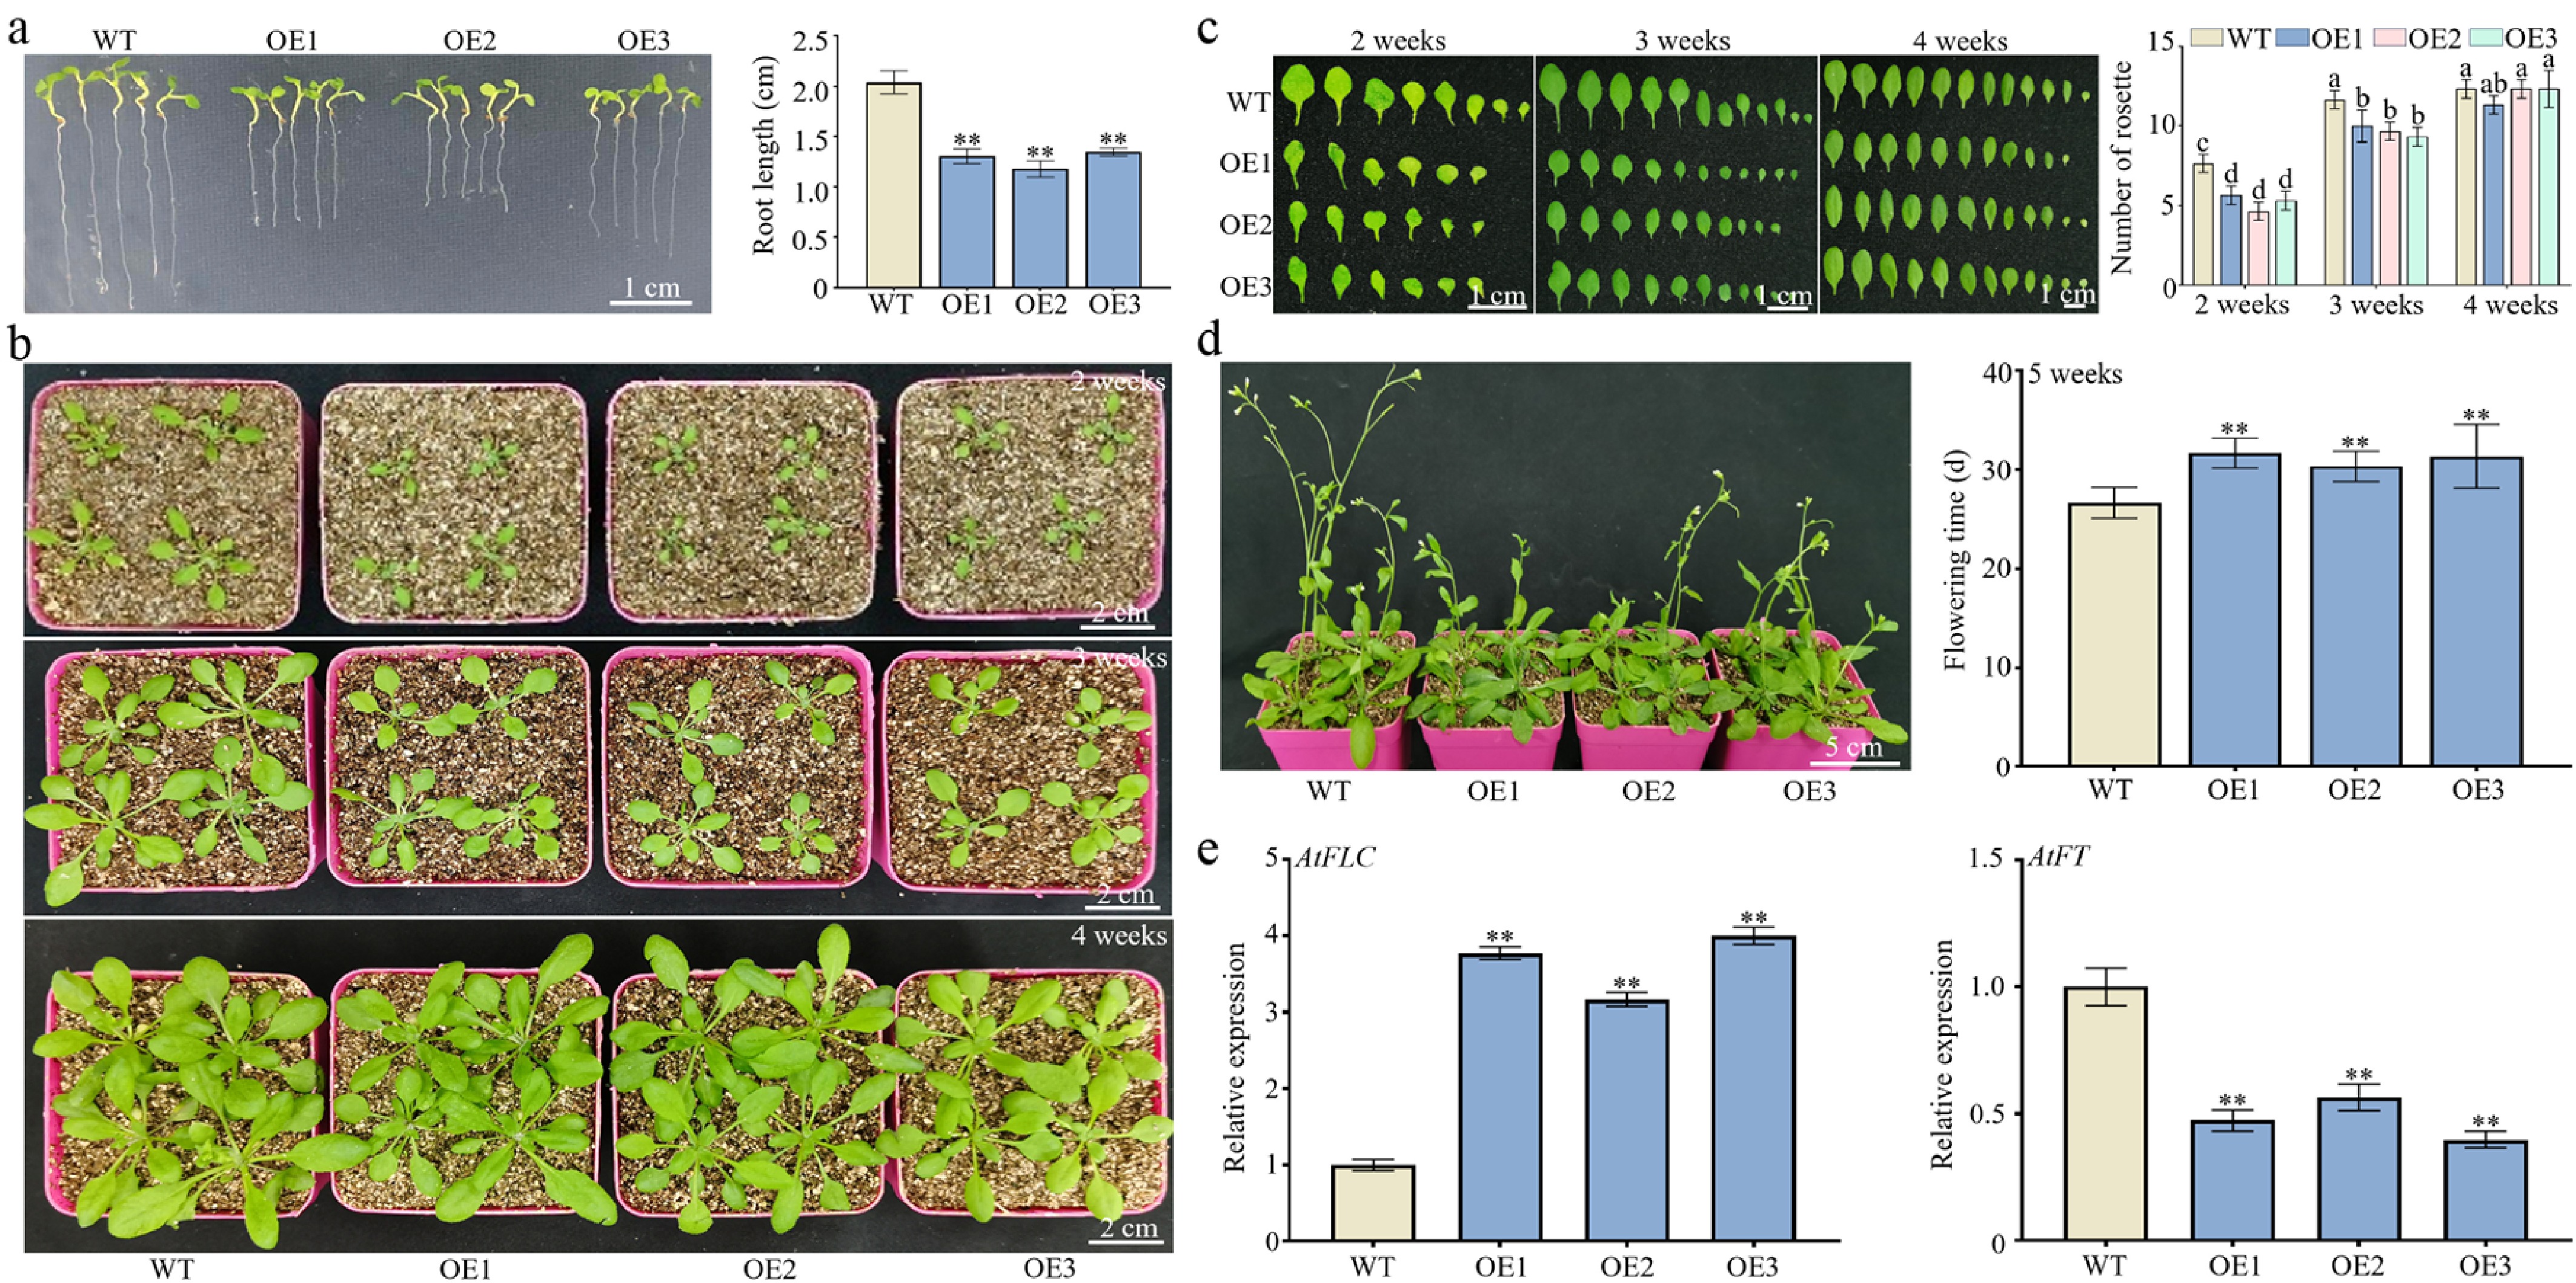
Figure 3.
Developmental phenotypes of MuMYB116-overexpressing and wild-type Arabidopsis under normal growth conditions. (a) Primary root lengths between 7-d-old wild-type (WT) and MuMYB116-overexpressing (OE) seedlings grown on 1/2 MS medium. Data are presented as mean ± SD (n = 15 biological replicates); ** p < 0.01 (Student's t-test). (b) Phenotypes of synchronized 2–4-week-old WT and OE Arabidopsis plants/seedlings. (c) Statistical quantification of rosette leaf number at 2, 3, and 4 weeks. Data are presented as mean ± SD (n = 15 biological replicates). Different lowercase letters indicate significant differences (one-way ANOVA with Tukey's HSD test, p < 0.05). (d) Bolting and flowering phenotypes of 5-week-old plants with quantified flowering time. Data are presented as mean ± SD (n = 15 biological replicates); ** p < 0.01 (Student's t-test). (e) Expression levels of AtFLC and AtFT genes. Data are presented as mean ± SD (n = 3 biological replicates); ** p < 0.01 (Student's t-test).
-
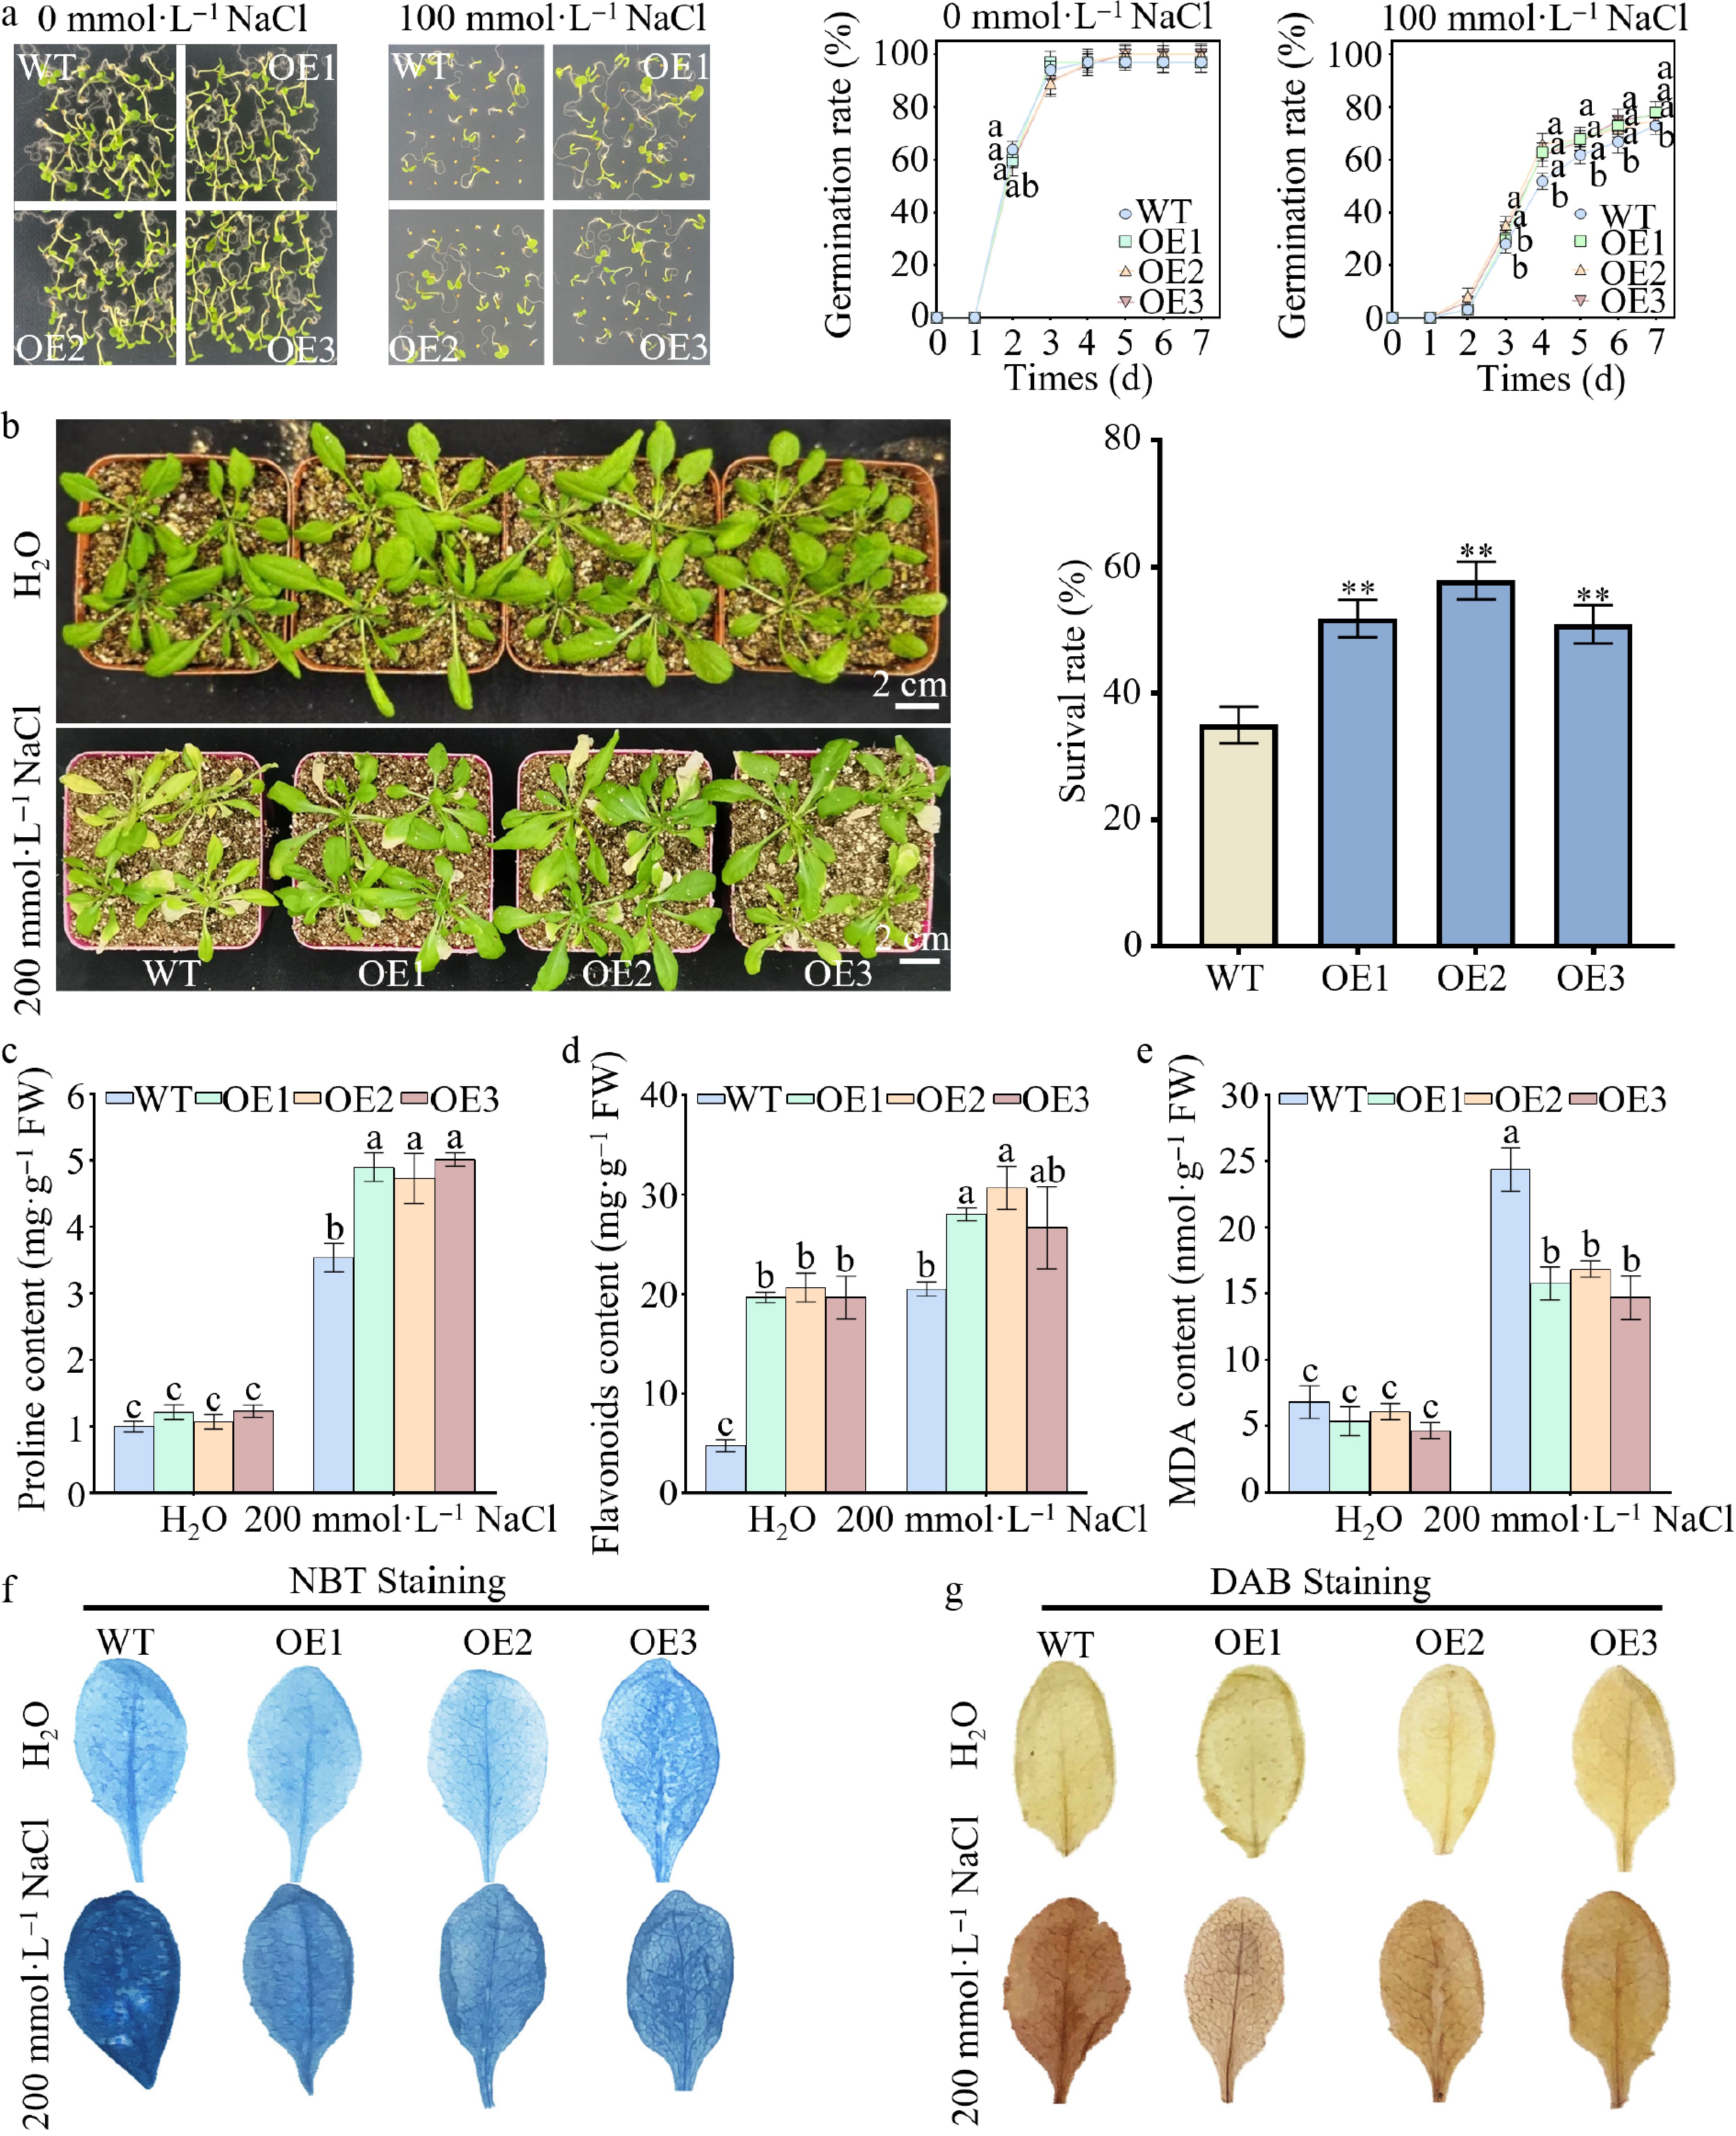
Figure 4.
Heterologous overexpression of MuMYB116 enhances salt tolerance in transgenic Arabidopsis. (a) Germination kinetics of WT and MuMYB116-overexpressing (OE) seeds on 1/2 MS medium supplemented with 0 and 100 mmol·L−1 NaCl within 7 d. Data are presented as mean ± SD (n = 3 independent biological replicates; each replicate consisted of 100 individual seeds). Different lowercase letters indicate significant differences (one-way ANOVA with Tukey's HSD test, p < 0.05). (b) Phenotypes and survival rates of 4-week-old WT and OE plants after 200 mmol·L−1 NaCl stress. Data are presented as mean ± SD (n = 3 independent biological replicates; each replicate consisted of 50 individual plants); ** p < 0.01 (Student's t-test). Quantification of (c) proline, (d) total flavonoid, and (e) MDA content in WT and OE leaves under control and salt-stress conditions. Data are presented as mean ± SD (n = 3 biological replicates). Different lowercase letters indicate significant differences (one-way ANOVA with Tukey's HSD test, p < 0.05). Accumulation of O2− and H2O2 was visualized by (f) nitroblue tetrazolium (NBT) staining and (g) 3,3'-diaminobenzidine (DAB) staining.
-
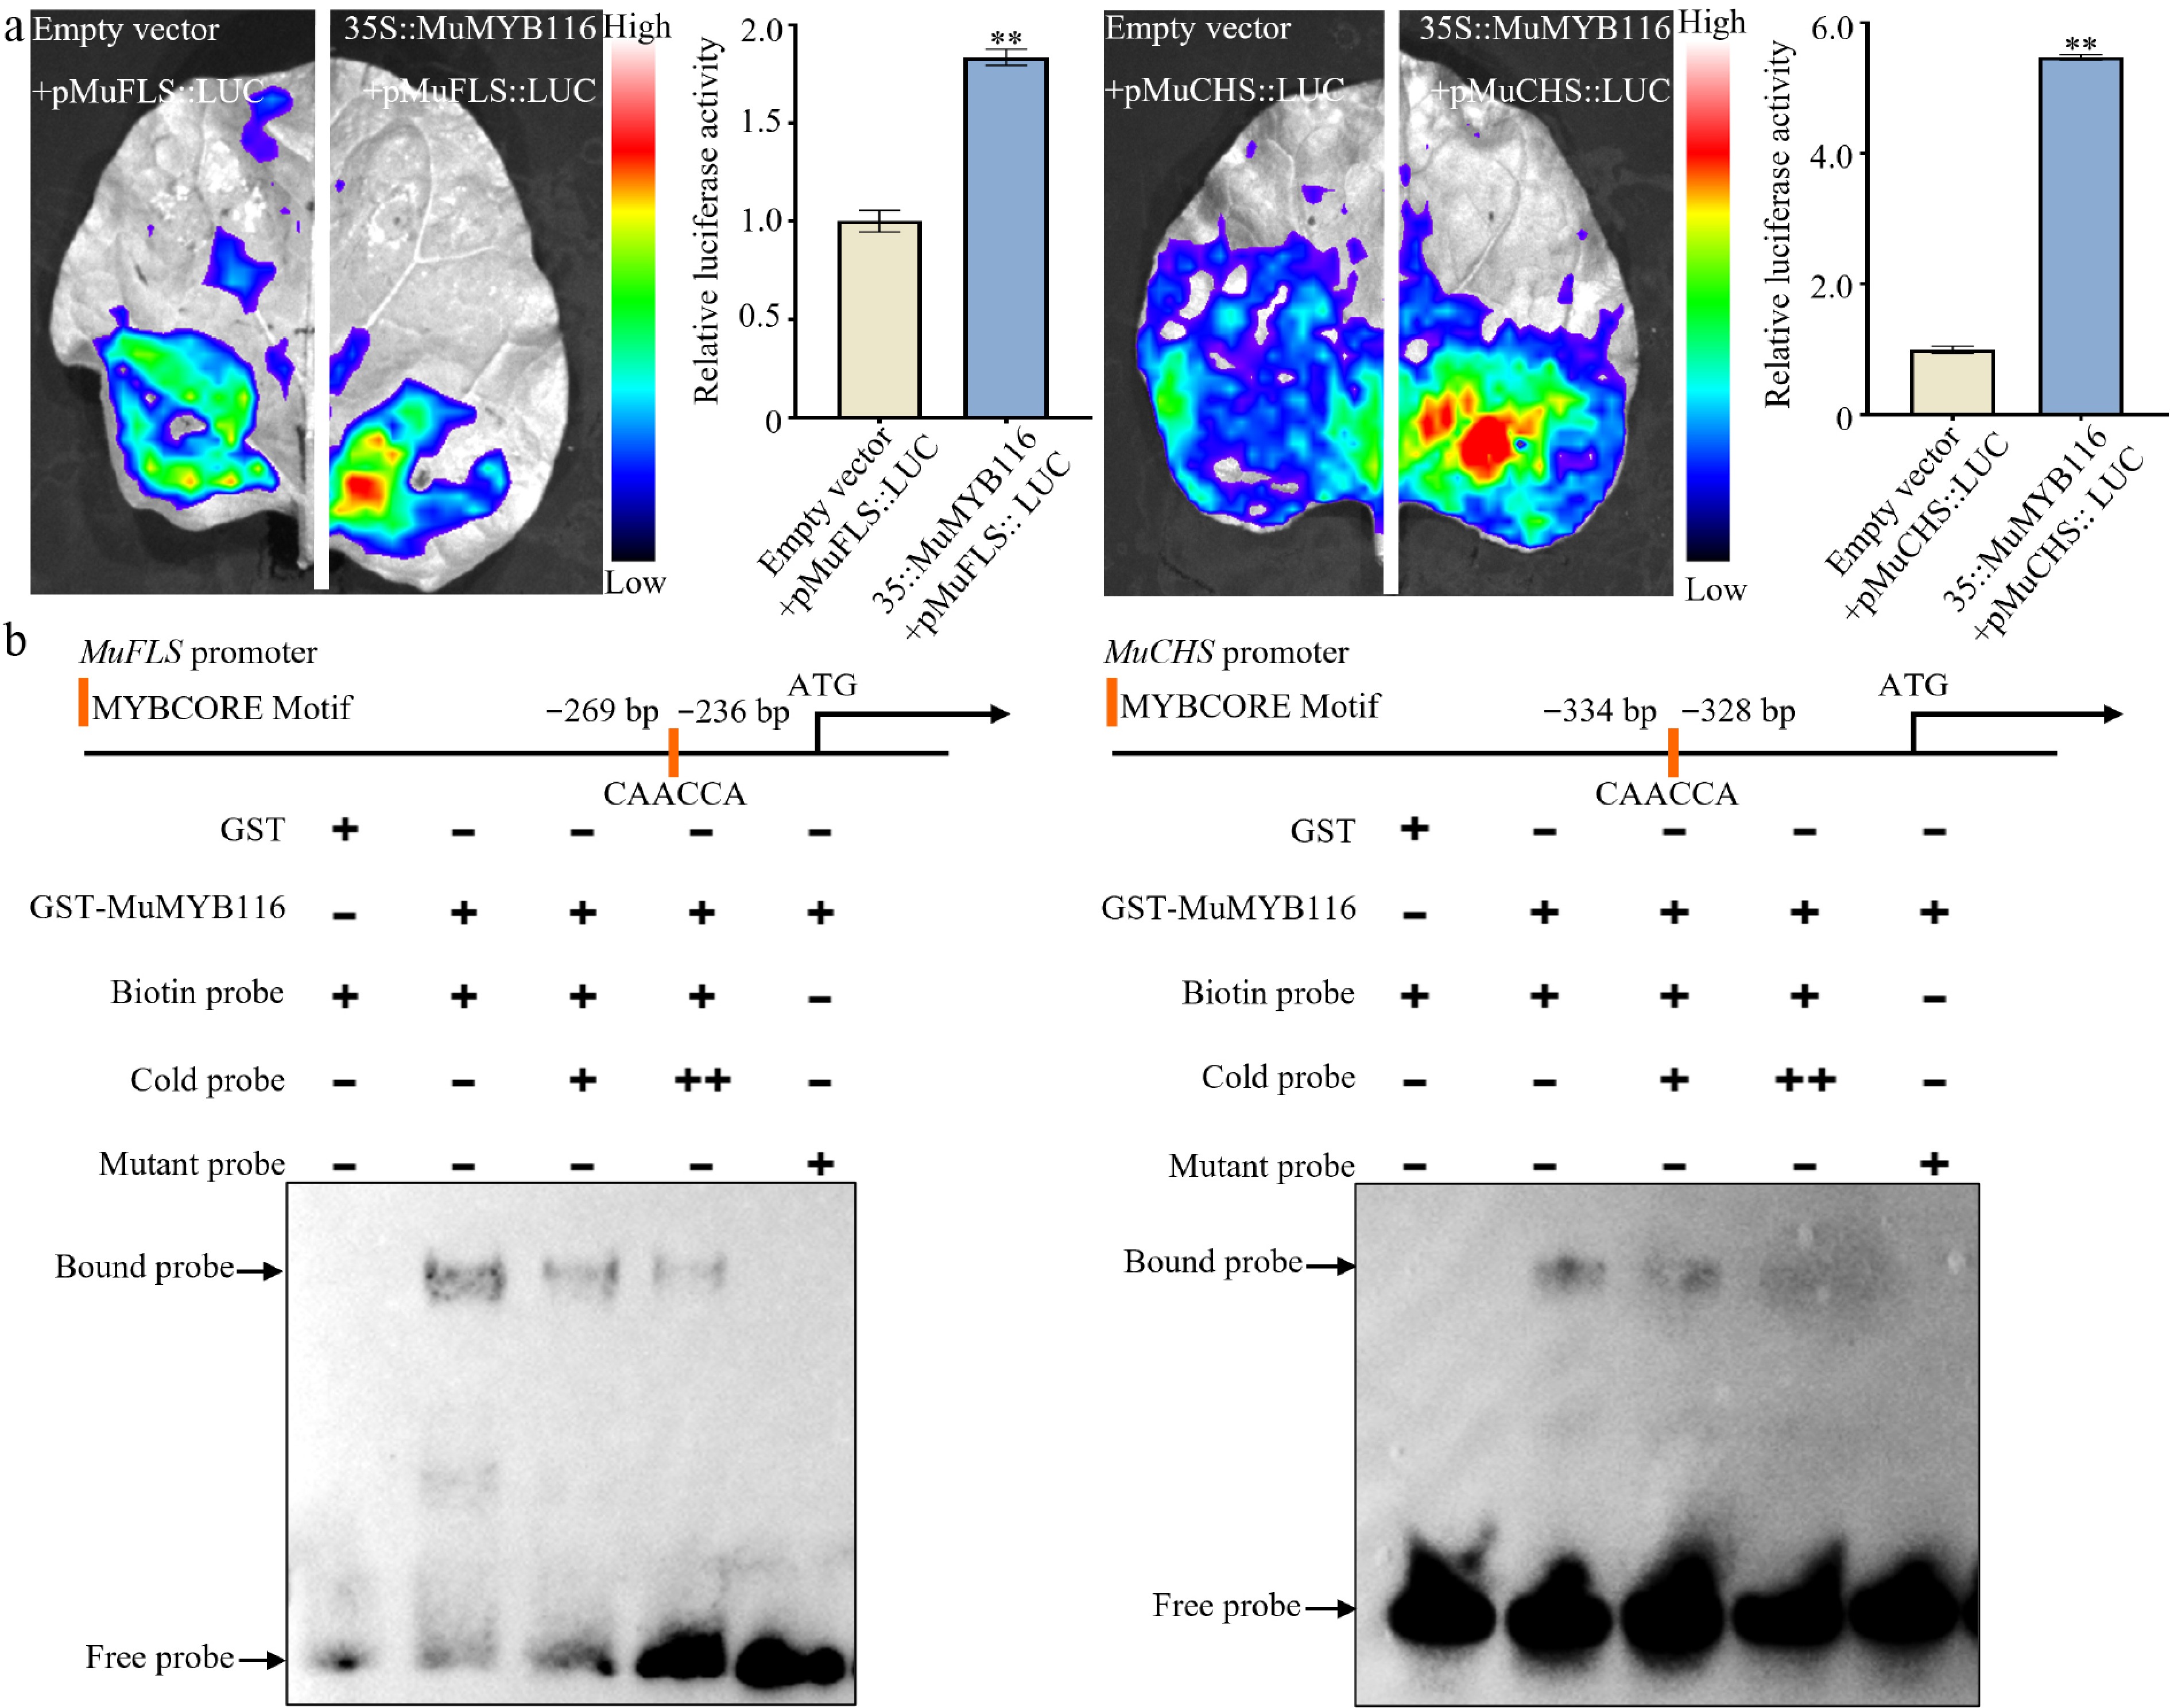
Figure 5.
MuMYB116 directly binds and activates the promoters of flavonoid biosynthetic genes MuFLS and MuCHS. (a) Dual-luciferase reporter assay showing transactivation of MuFLS and MuCHS promoters by MuMYB116. The effector plasmid (35S::MuMYB116) or empty vector (control) was co-infiltrated with reporter plasmids (pMuFLS::LUC or pMuCHS::LUC) into Nicotiana benthamiana leaves. LUC/REN ratios are shown. Data are presented as mean ± SD (n = 3 biological replicates). ** p < 0.01 (Student's t-test). (b) Electrophoretic mobility shift assay (EMSA) confirming direct binding of MuMYB116 to the MYBCORE motifs in the MuFLS and MuCHS promoters. Biotin-labeled probes containing the MYBCORE motifs were incubated with purified His-MuMYB116 protein or His alone (negative control). Unlabeled probes were used for competition assays. The shifted bands (indicated by arrows) indicate protein-DNA complexes.
-
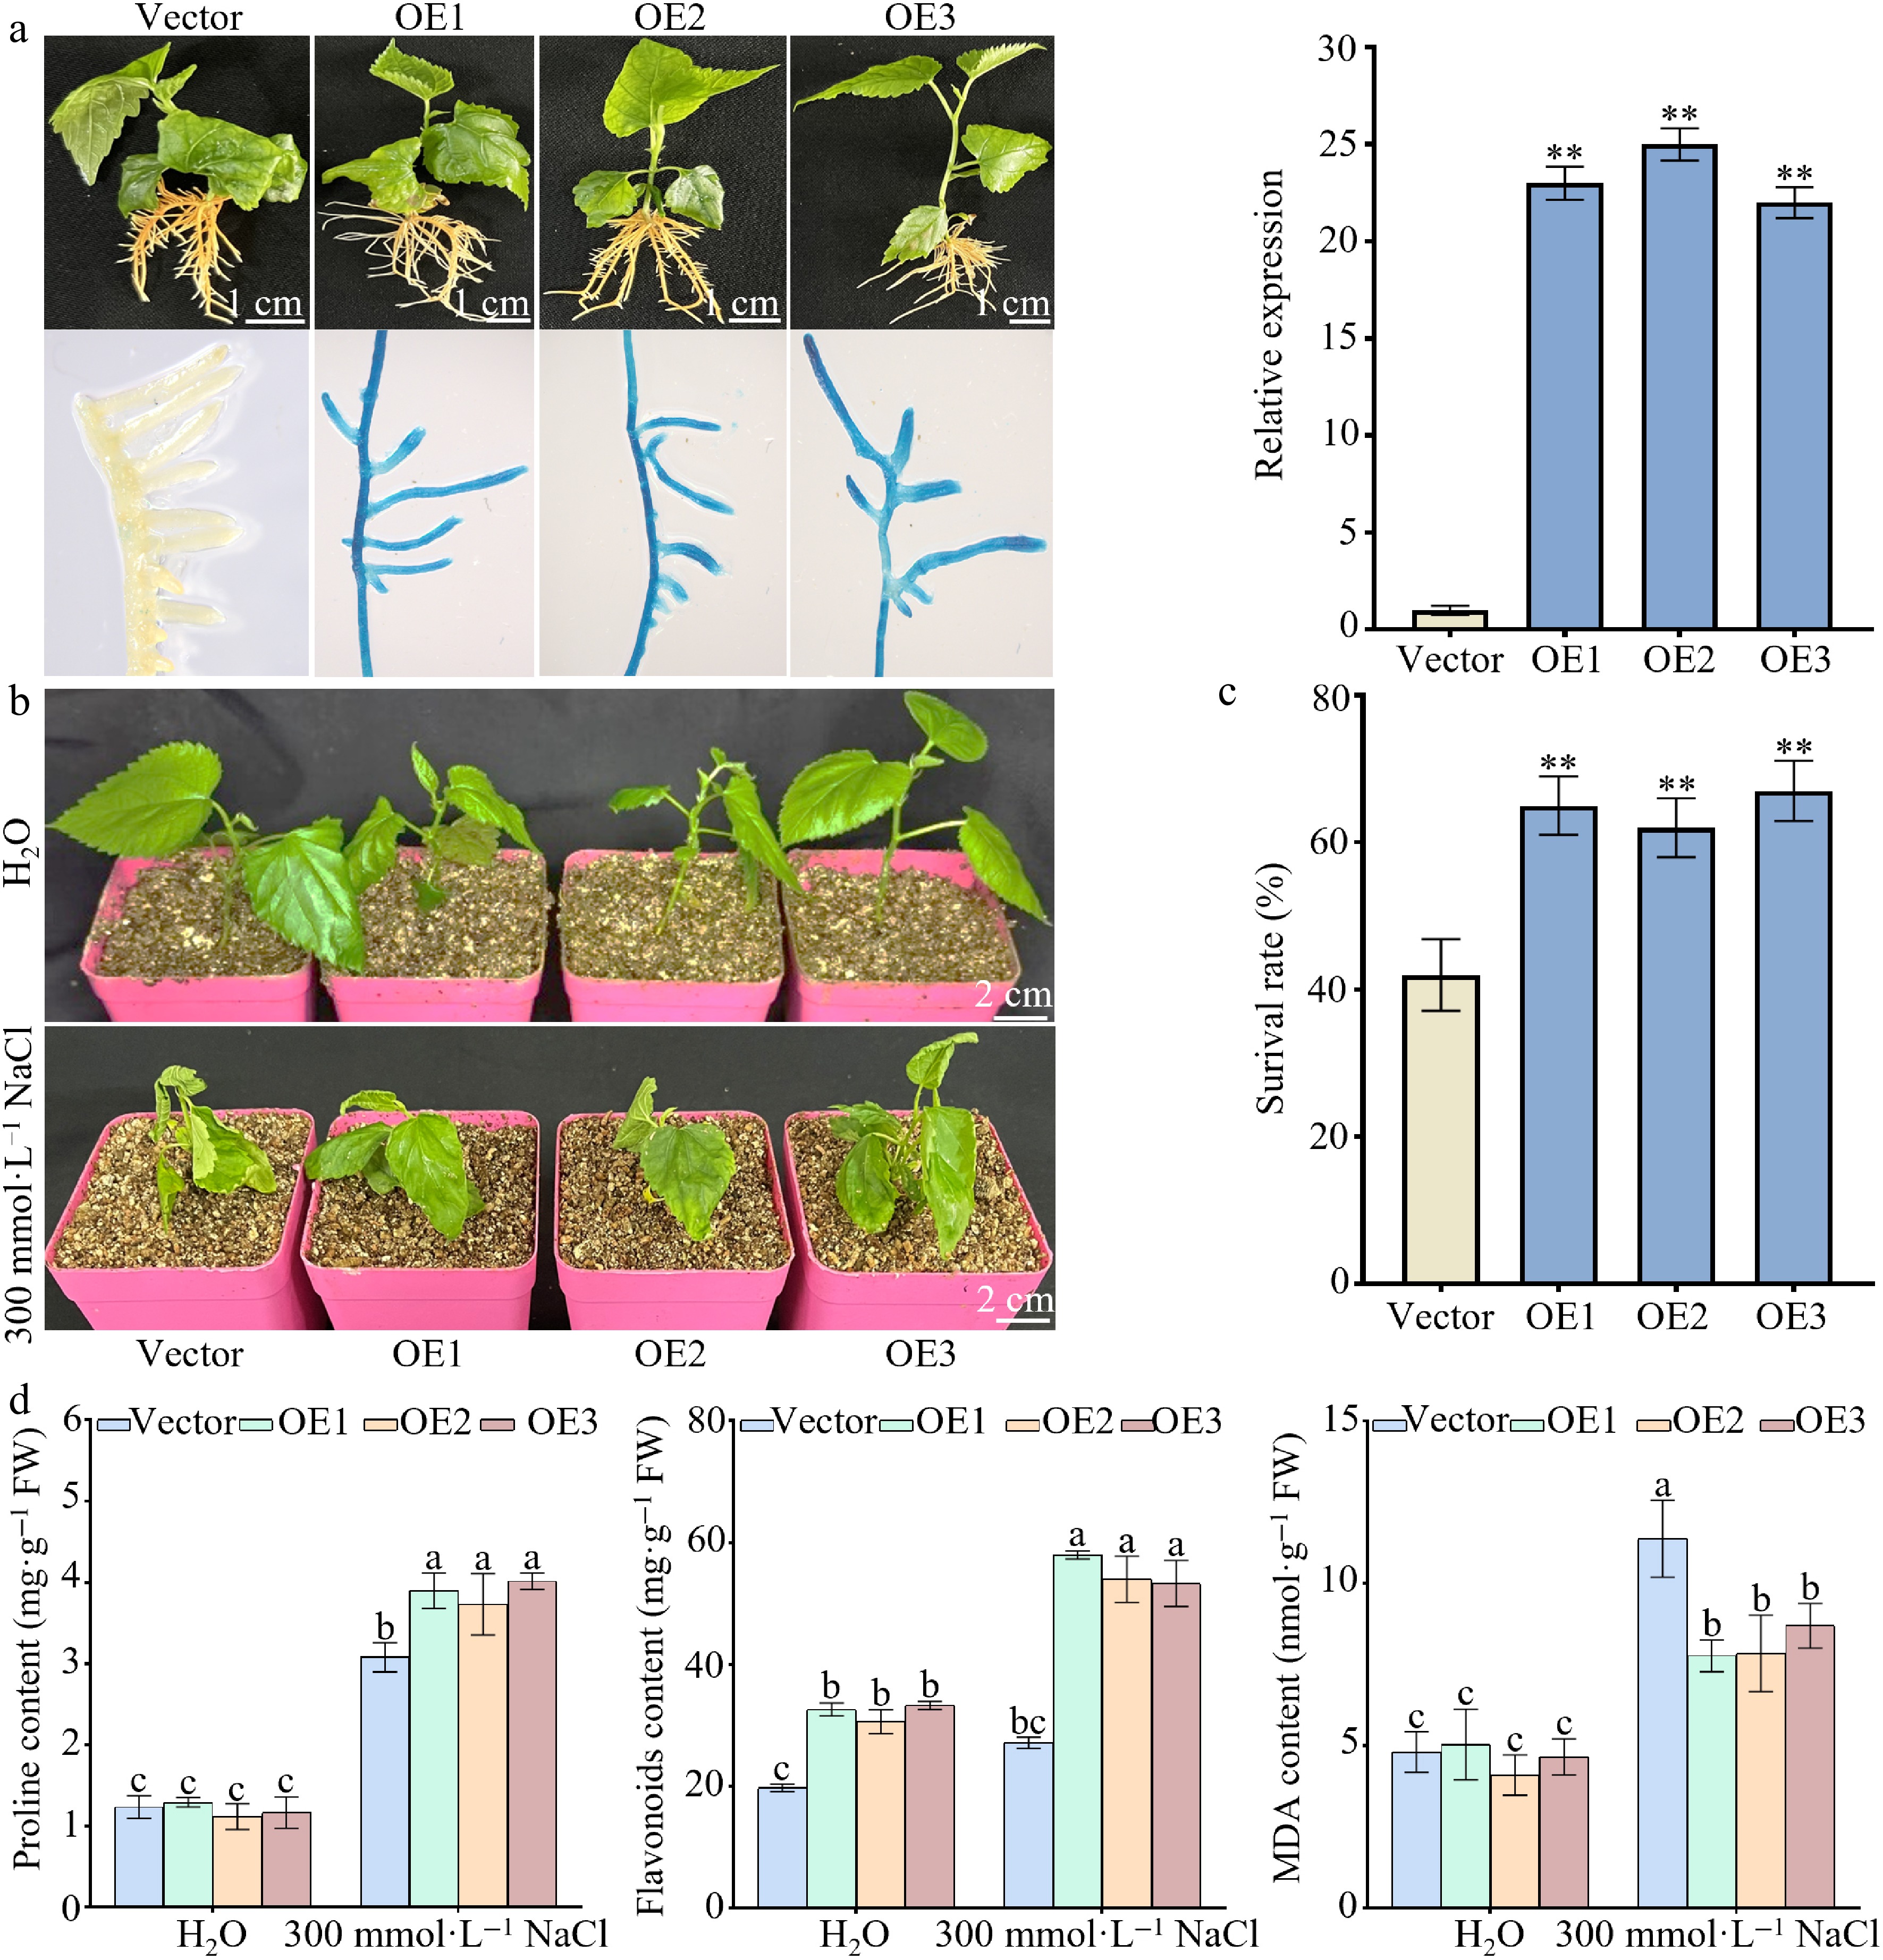
Figure 6.
Functional validation of MuMYB116 in salt tolerance using mulberry hairy roots. (a) Identification of transgenic hairy roots and relative expression levels of MuMYB116 in mulberry hairy roots transformed with an empty vector (Vector) or a MuMYB116 overexpression construct (OE). GUS staining indicates that MuMYB116 was successfully expressed in the hairy roots. Data are presented as mean ± SD (n = 3 biological replicates); ** p < 0.01 (Student's t-test). The scale bar value is 1 cm. (b) Phenotype of mulberry seedlings with transgenic hairy roots under 300 mmol·L−1 NaCl stress. (c) Survival rates of mulberry seedlings under 300 mmol·L−1 NaCl stress. Data are presented as mean ± SD (n = 3 independent biological replicates; each replicate consisted of 20 individual seedlings); ** p < 0.01 (Student's t-test). (d) Proline, flavonoid, and MDA content. Data are presented as mean ± SD (n = 3 biological replicates). Different lowercase letters indicate significant differences (one-way ANOVA with Tukey's HSD test, p < 0.05).
-
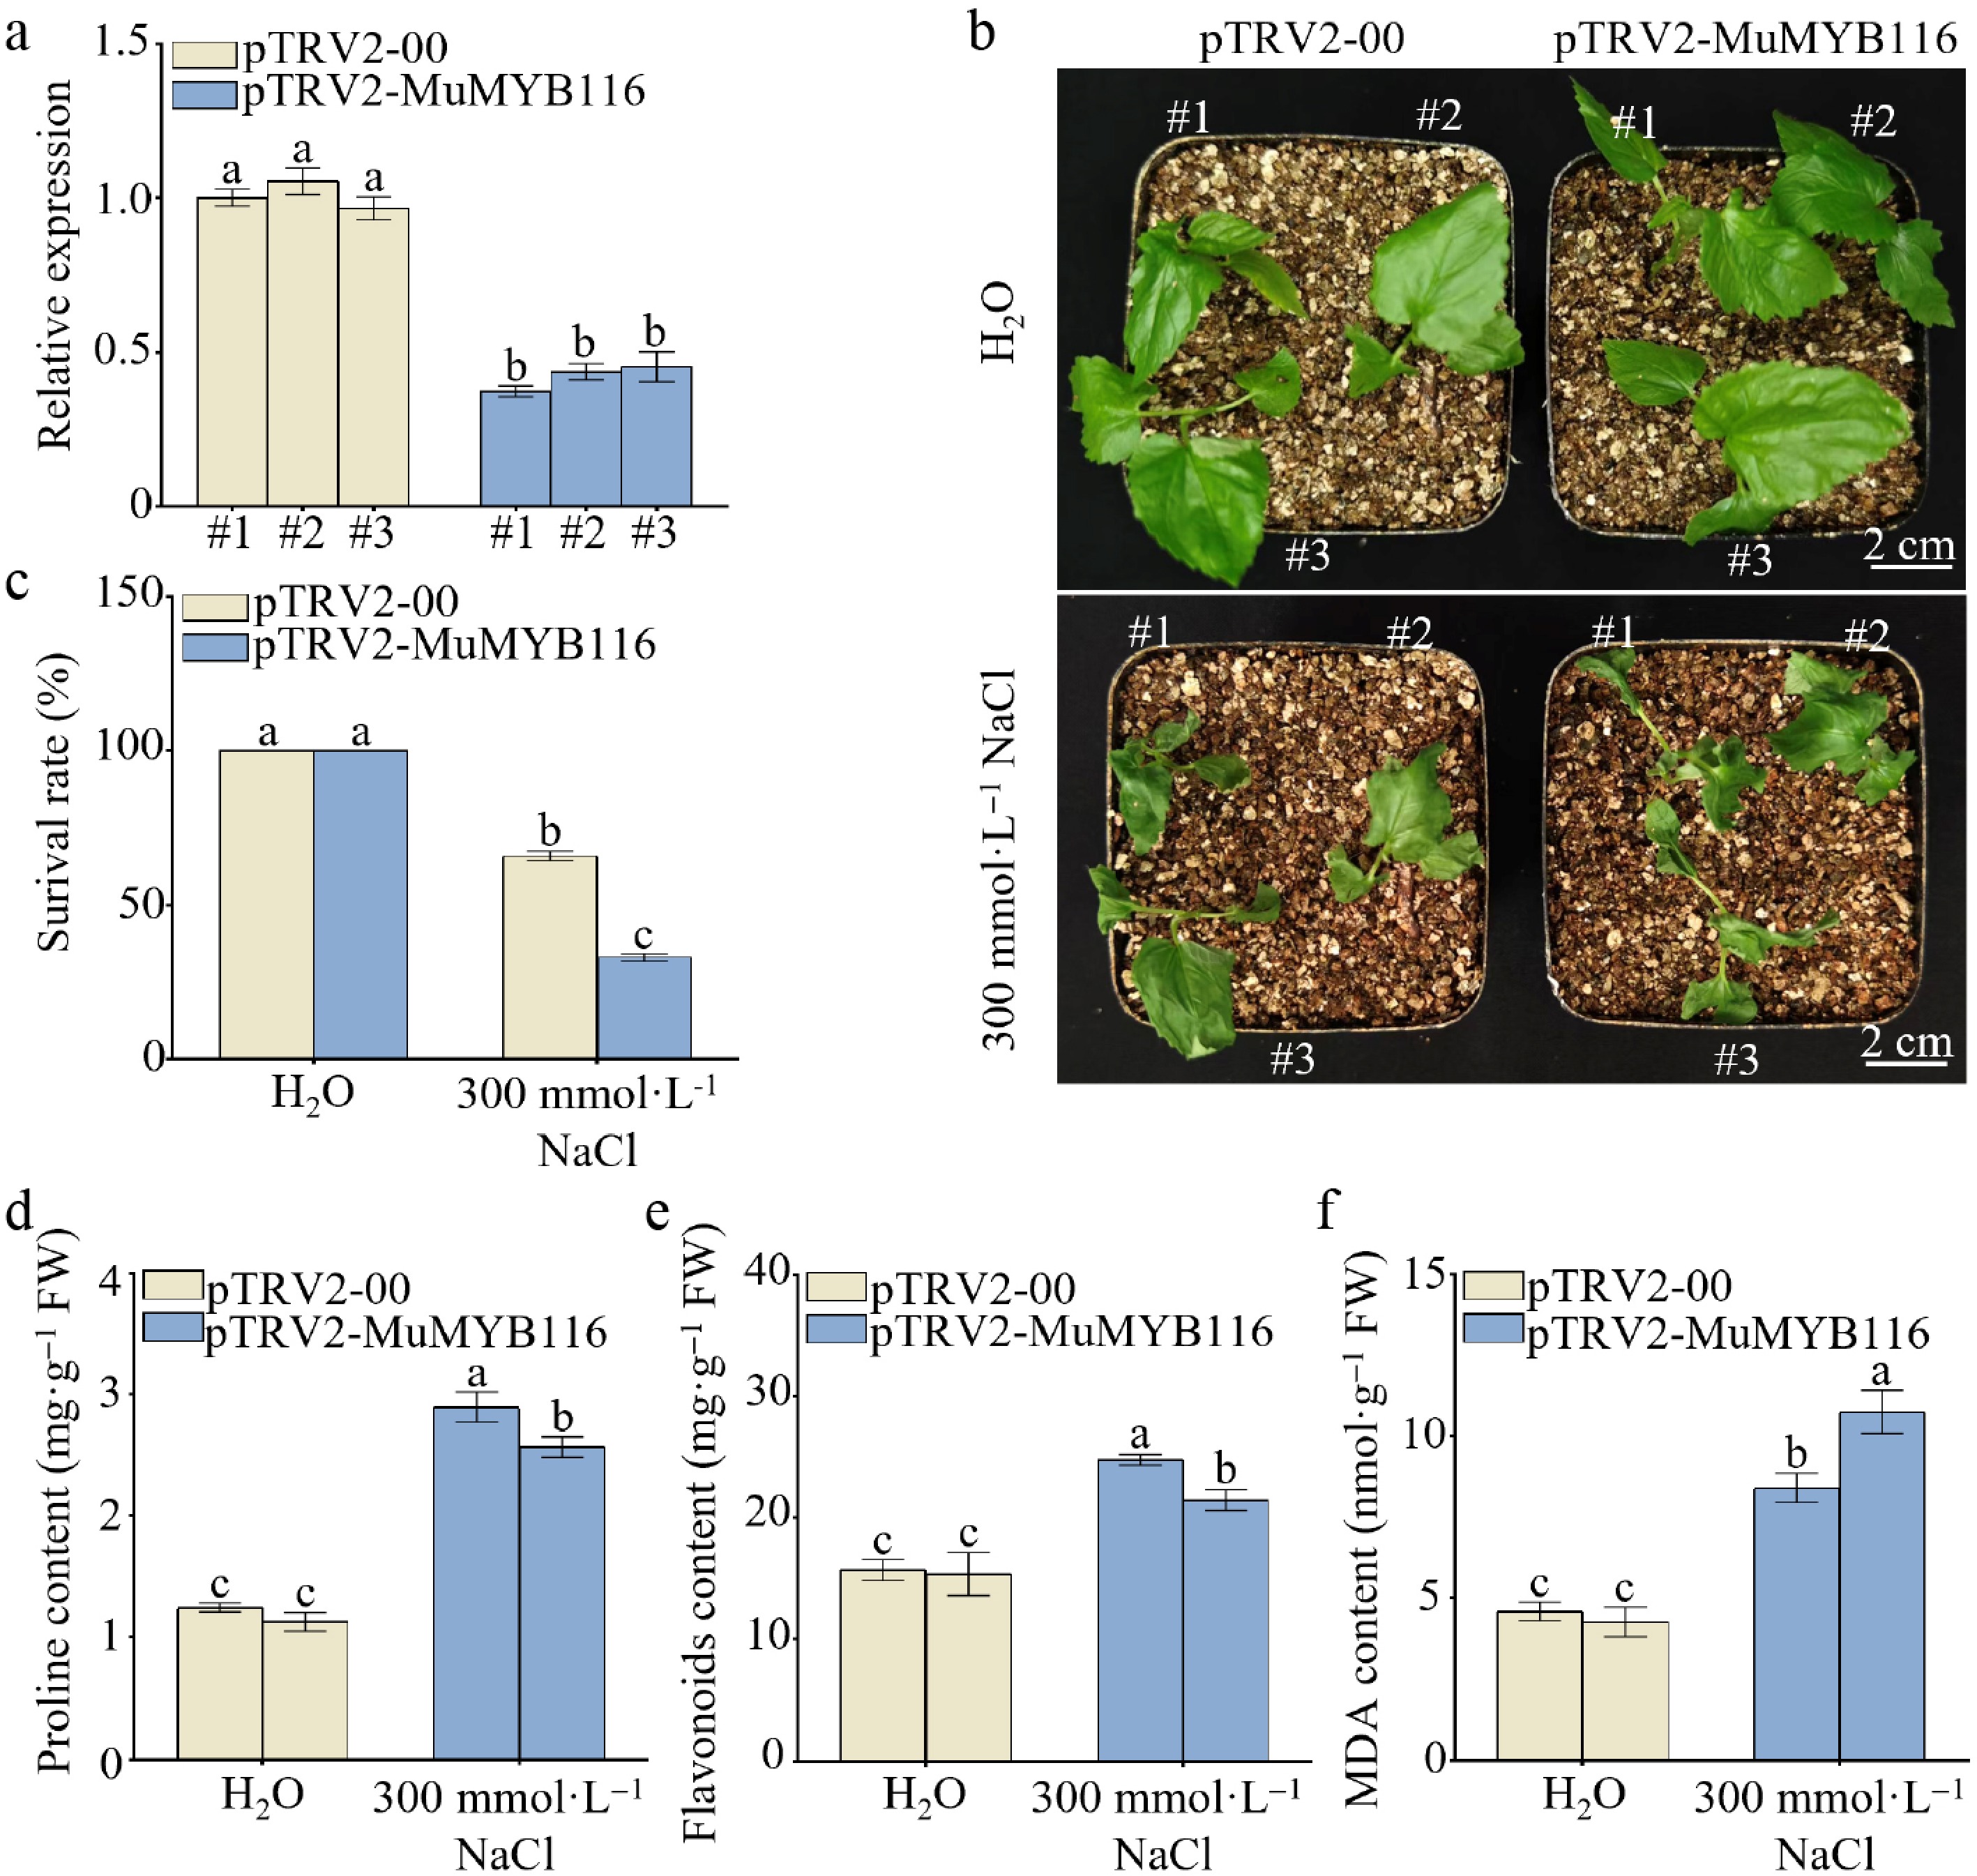
Figure 7.
VIGS-mediated silencing of MuMYB116 impairs salt tolerance in mulberry. (a) qRT-PCR analysis confirming the silencing efficiency of MuMYB116 in pTRV2-MuMYB116 seedlings compared with pTRV2-00 controls. Data are presented as mean ± SD (n = 3 biological replicates). (b) Phenotypes of pTRV2-00 (control) or pTRV2-MuMYB116 (silenced) mulberry seedlings under 0 or 300 mmol·L−1 NaCl stress for 7 d. (c) Survival rates of pTRV2-00 (control) or pTRV2-MuMYB116 (silenced) mulberry seedlings after 7 d of salt treatment. Data are presented as mean ± SD (n = 3 independent biological replicates; each replicate consisted of 20 individual seedlings). Physiological parameters of pTRV2-00 (control) or pTRV2-MuMYB116 (silenced) mulberry seedlings under salt stress: (d) proline, (e) flavonoid, and (f) MDA content. Data are presented as mean ± SD (n = 3 biological replicates). Different lowercase letters indicate significant differences (p < 0.05, one-way ANOVA with Tukey's HSD test).
-
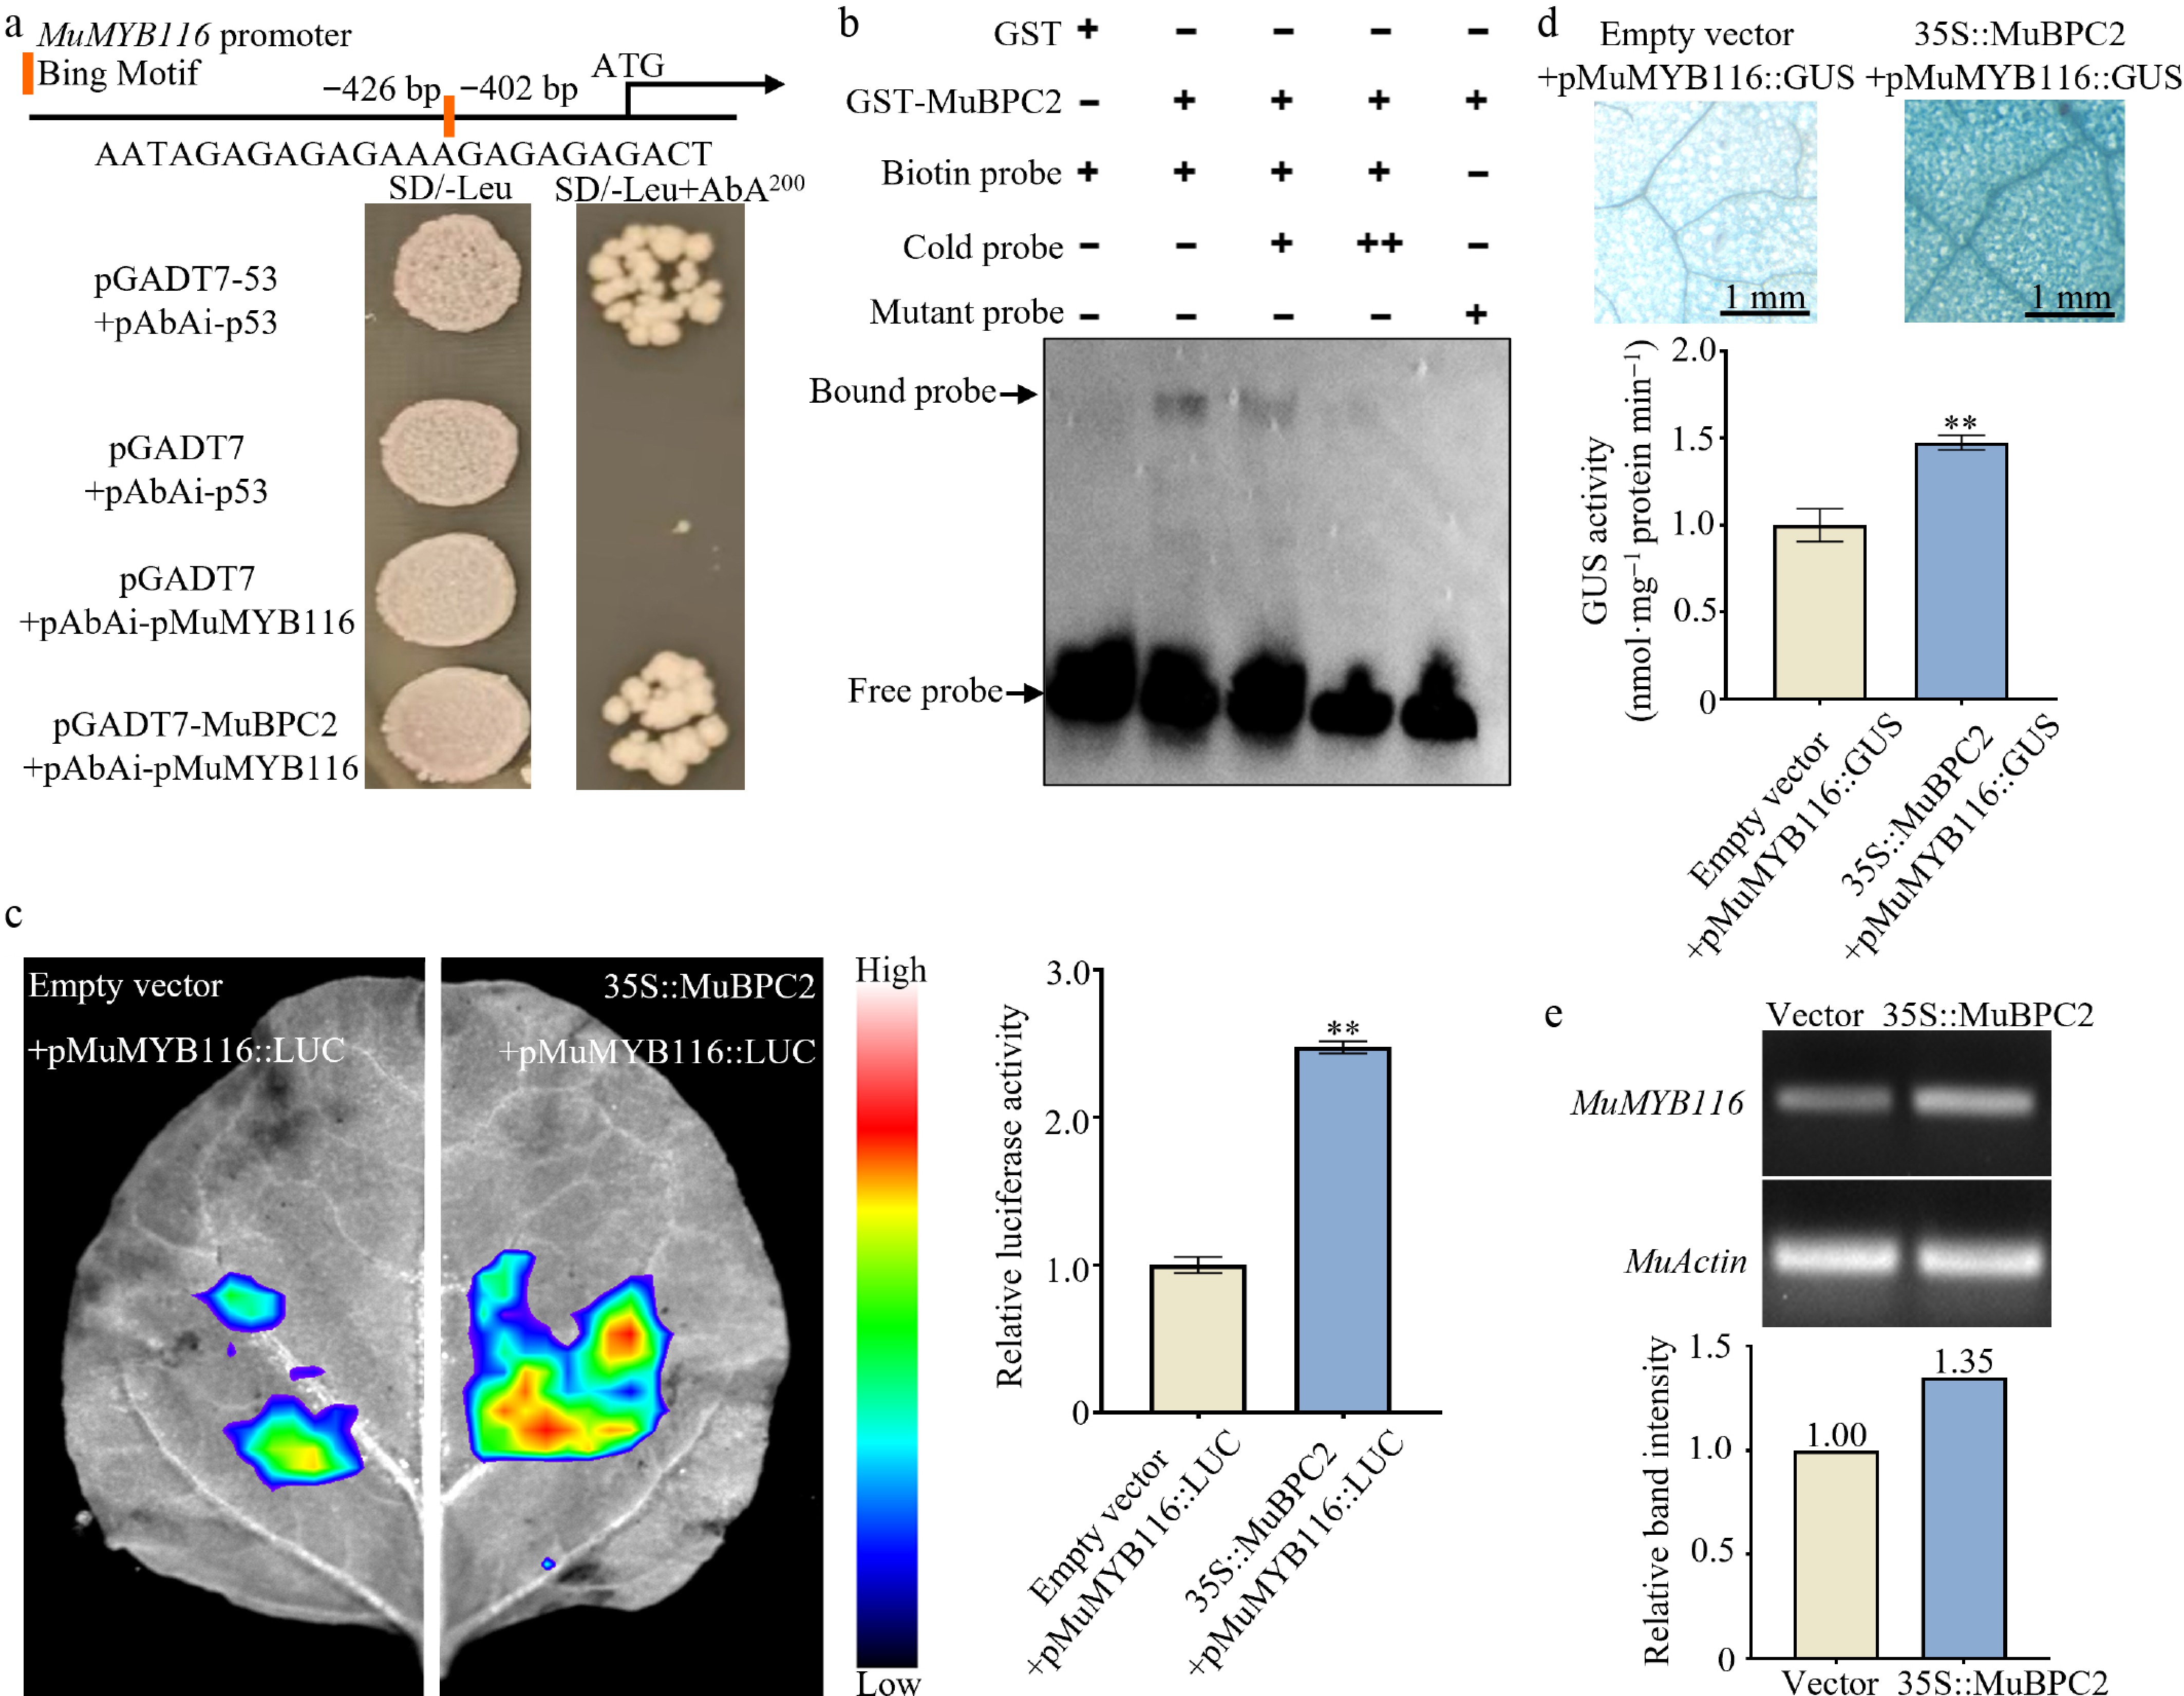
Figure 8.
MuBPC2 binds to the MuMYB116 promoter and enhances its transcriptional activity. (a) Yeast one-hybrid (Y1H) assay verifying the binding of MuBPC2 to the MuMYB116 promoter. Yeast strains carrying the pMuMYB116-bait and either the pGADT7-MuBPC2 or empty pGADT7 were grown on SD/-Leu medium with or without Aureobasidin A (AbA, 200 ng·mL−1). (b) EMSA confirming the direct binding of MuBPC2 to the MuMYB116 promoter. A biotin-labeled probe containing the MuBPC2-binding motif was incubated with GST-MuBPC2 fusion protein or GST alone (negative control). An unlabeled probe was used for competition assays. The shifted band (indicated by the arrow) indicates the protein–DNA complex. (c) Dual-luciferase reporter assay in Nicotiana benthamiana leaves. The effector plasmid (35S::MuBPC2) or empty vector (control) was co-infiltrated with the reporter plasmid (pMuMYB116::LUC). (d) GUS staining of N. benthamiana leaves co-infiltrated with the pMuMYB116::GUS reporter and either 35S::MuBPC2 or the vector control. (e) Semi-quantitative RT-PCR analysis showing the expression level of MuMYB116 in mulberry leaf transiently overexpressing MuBPC2 or empty vector (control). Data are presented as mean ± SD (n = 3 biological replicates); ** p < 0.001, (Student's t-test).
-
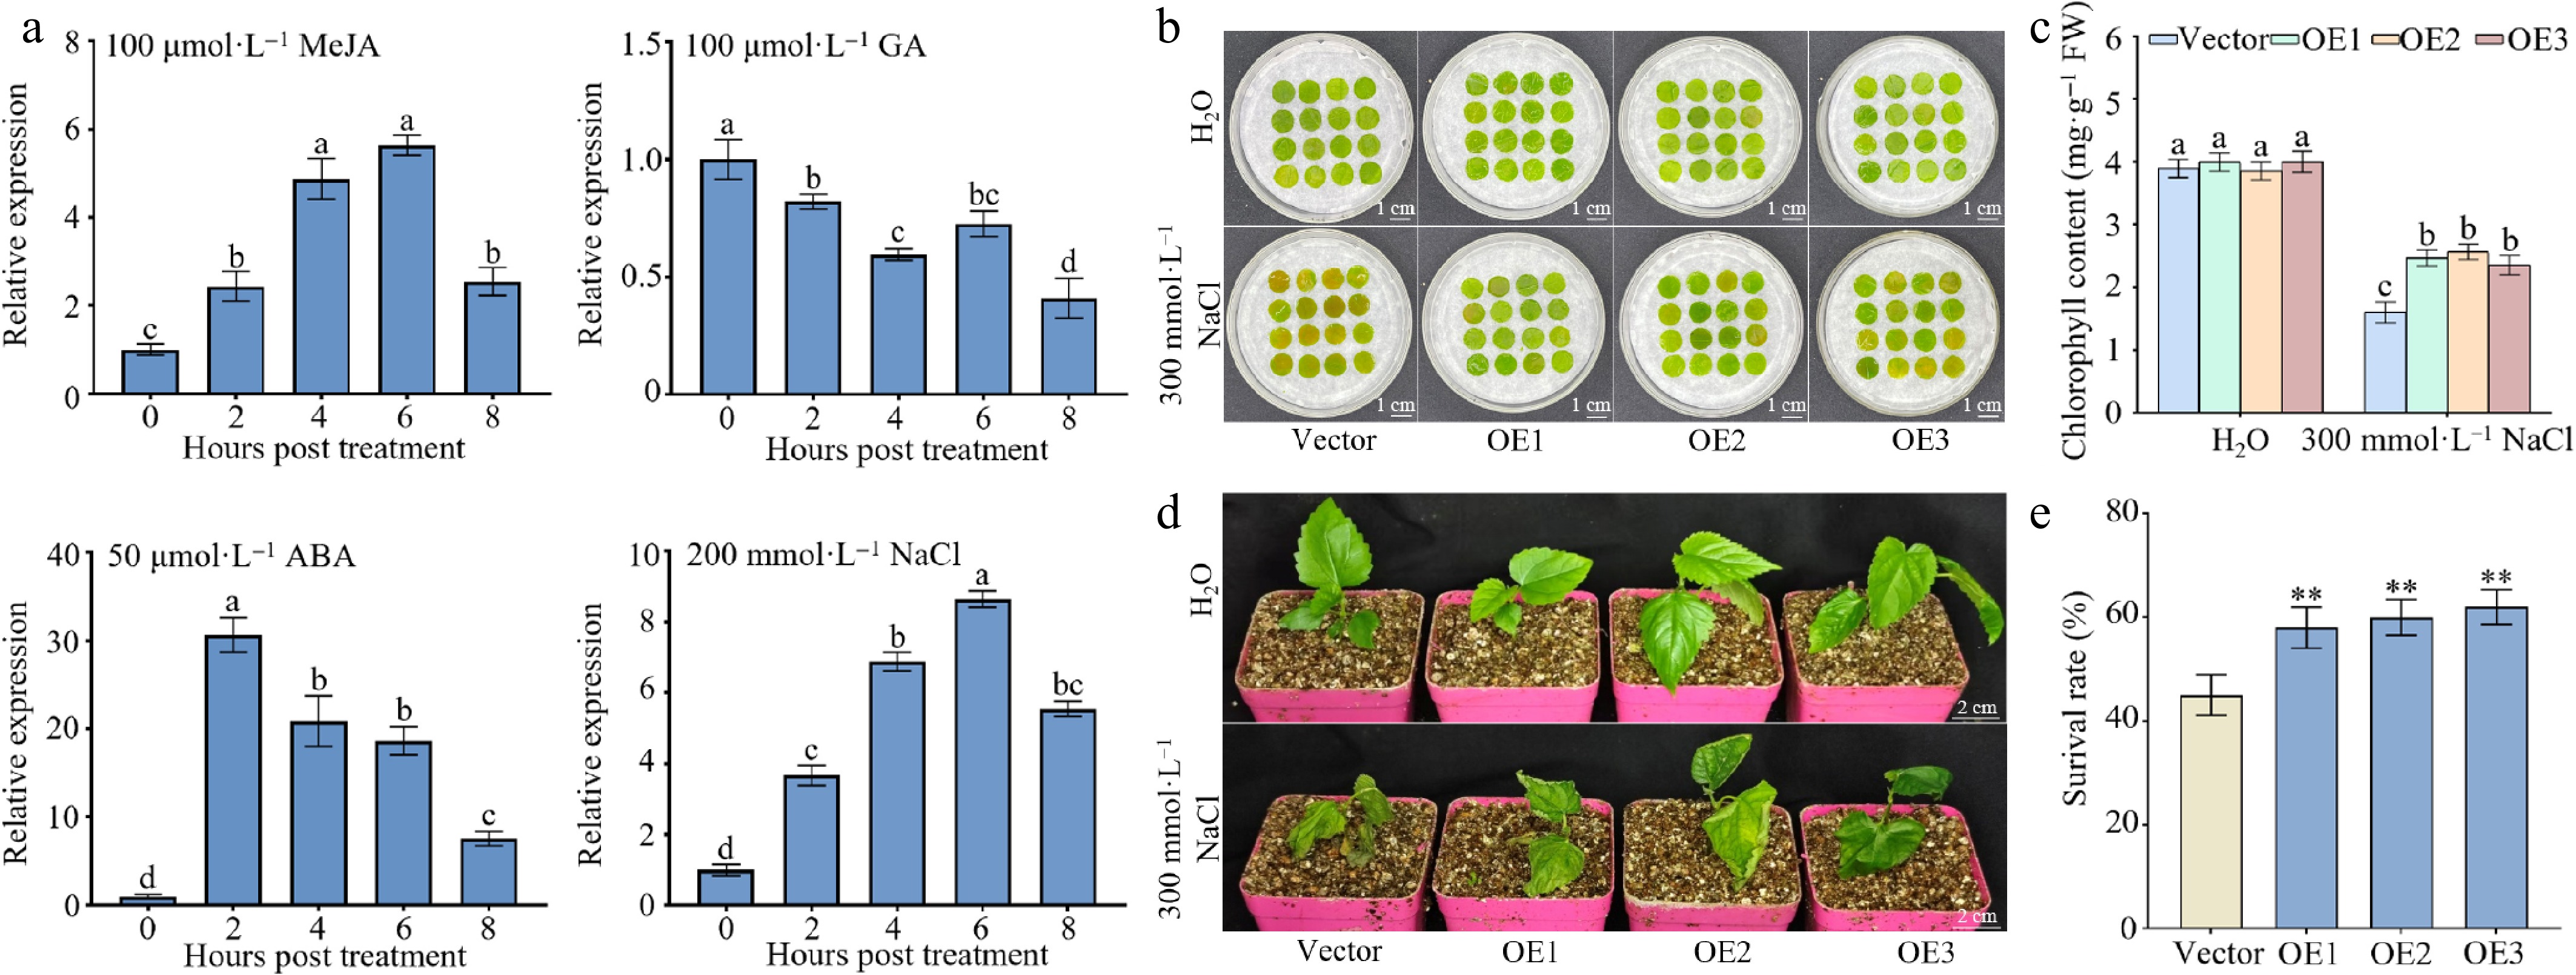
Figure 9.
Expression pattern and salt tolerance function of MuBPC2 in mulberry. (a) qRT-PCR analysis of dynamic changes in MuBPC2 transcription levels in mulberry seedlings in response to ABA, MeJA, GA, or NaCl treatments. Data are presented as mean ± SD (n = 3 biological replicates). Different lowercase letters indicate significant differences (p < 0.05, one-way ANOVA with Tukey's HSD test). (b) Phenotypes and (c) chlorophyll content of mulberry leaves transiently overexpressing MuBPC2 incubated with 0 or 300 mmol·L−1 NaCl solution. Data are presented as mean ± SD (n = 3 independent biological replicates; each replicate consisted of 15 individual leaf discs). Different lowercase letters indicate significant differences (p < 0.05, one-way ANOVA with Tukey's HSD test). (d) Phenotypes and (e) survival rates of mulberry seedlings with transgenic empty vector (Vector) or MuBPC2 (OE) hairy roots under 0 or 300 mmol·L−1 NaCl stress. Data are presented as mean ± SD (n = 3 independent biological replicates; each replicate consisted of 20 individual seedlings); ** p < 0.01 (Student's t-test).
-
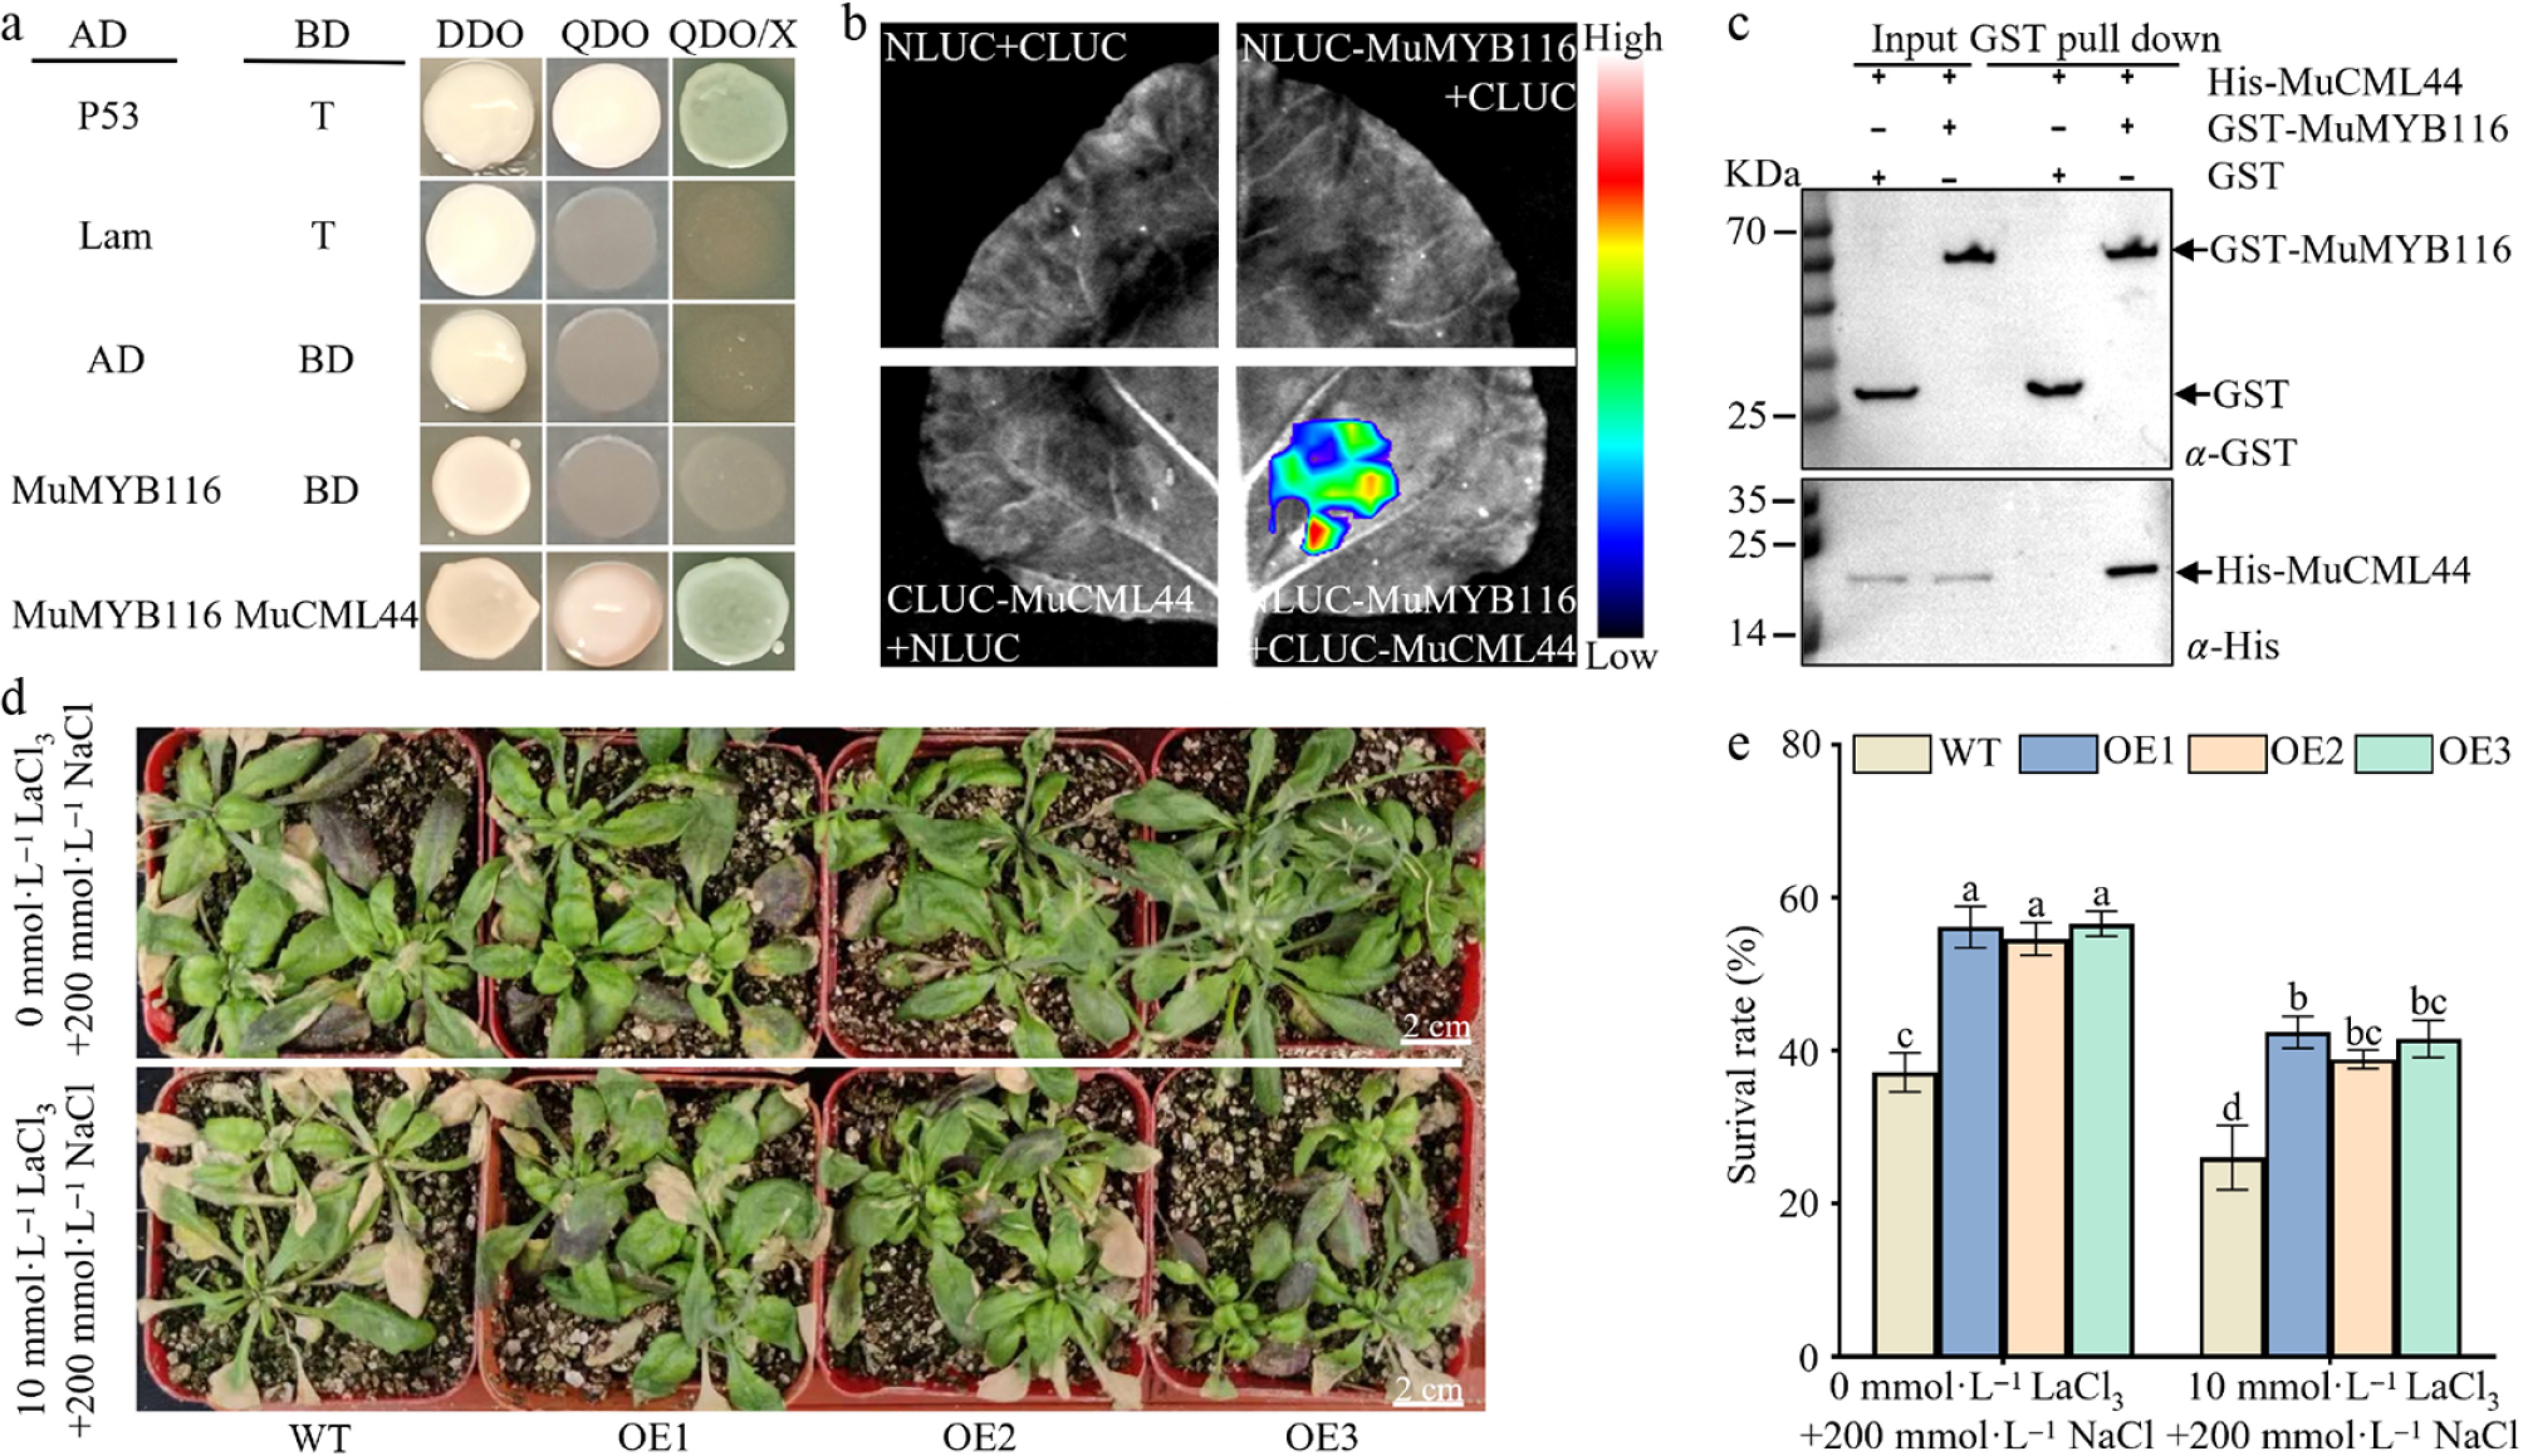
Figure 10.
Interaction between MuMYB116 and MuCML44 and involvement of Ca2+ signaling in MuMYB116-mediated salt tolerance. (a) Y2H assay confirming the interaction between MuMYB116 and MuCML44. Yeast cells co-transformed with BD-MuCML44 and AD-MuMYB116, or the indicated negative controls, were grown on synthetic dropout media: DDO (SD/-Trp/-Leu), QDO (SD/-Trp/-Leu/-Ade/-His), and QDO medium supplemented with X-α-gal. (b) LCI assay in Nicotiana benthamiana leaves. Strong luminescence indicates protein interaction. (c) In vitro pull-down assay confirming direct interaction between MuMYB116 and MuCML44. GST-MuMYB116 or GST alone was incubated with His-MuCML44. Bound proteins were analyzed by western blotting with anti-His (upper) and anti-GST (lower) antibodies. Input (10% of the total protein) is shown as a loading control. (d) Phenotypes of WT and MuMYB116-overexpressing (OE) Arabidopsis under 200 mmol·L−1 salt stress with or without 10 mmol·L−1 LaCl3 (Ca2+ inhibitor) treatment. (e) Survival rate of WT and OE Arabidopsis under different treatments. Data are presented as mean ± SD (n = 3 independent biological replicates; each replicate consisted of 50 individual plants). Different lowercase letters indicate significant differences (one-way ANOVA with Tukey's HSD test, p < 0.05).
-
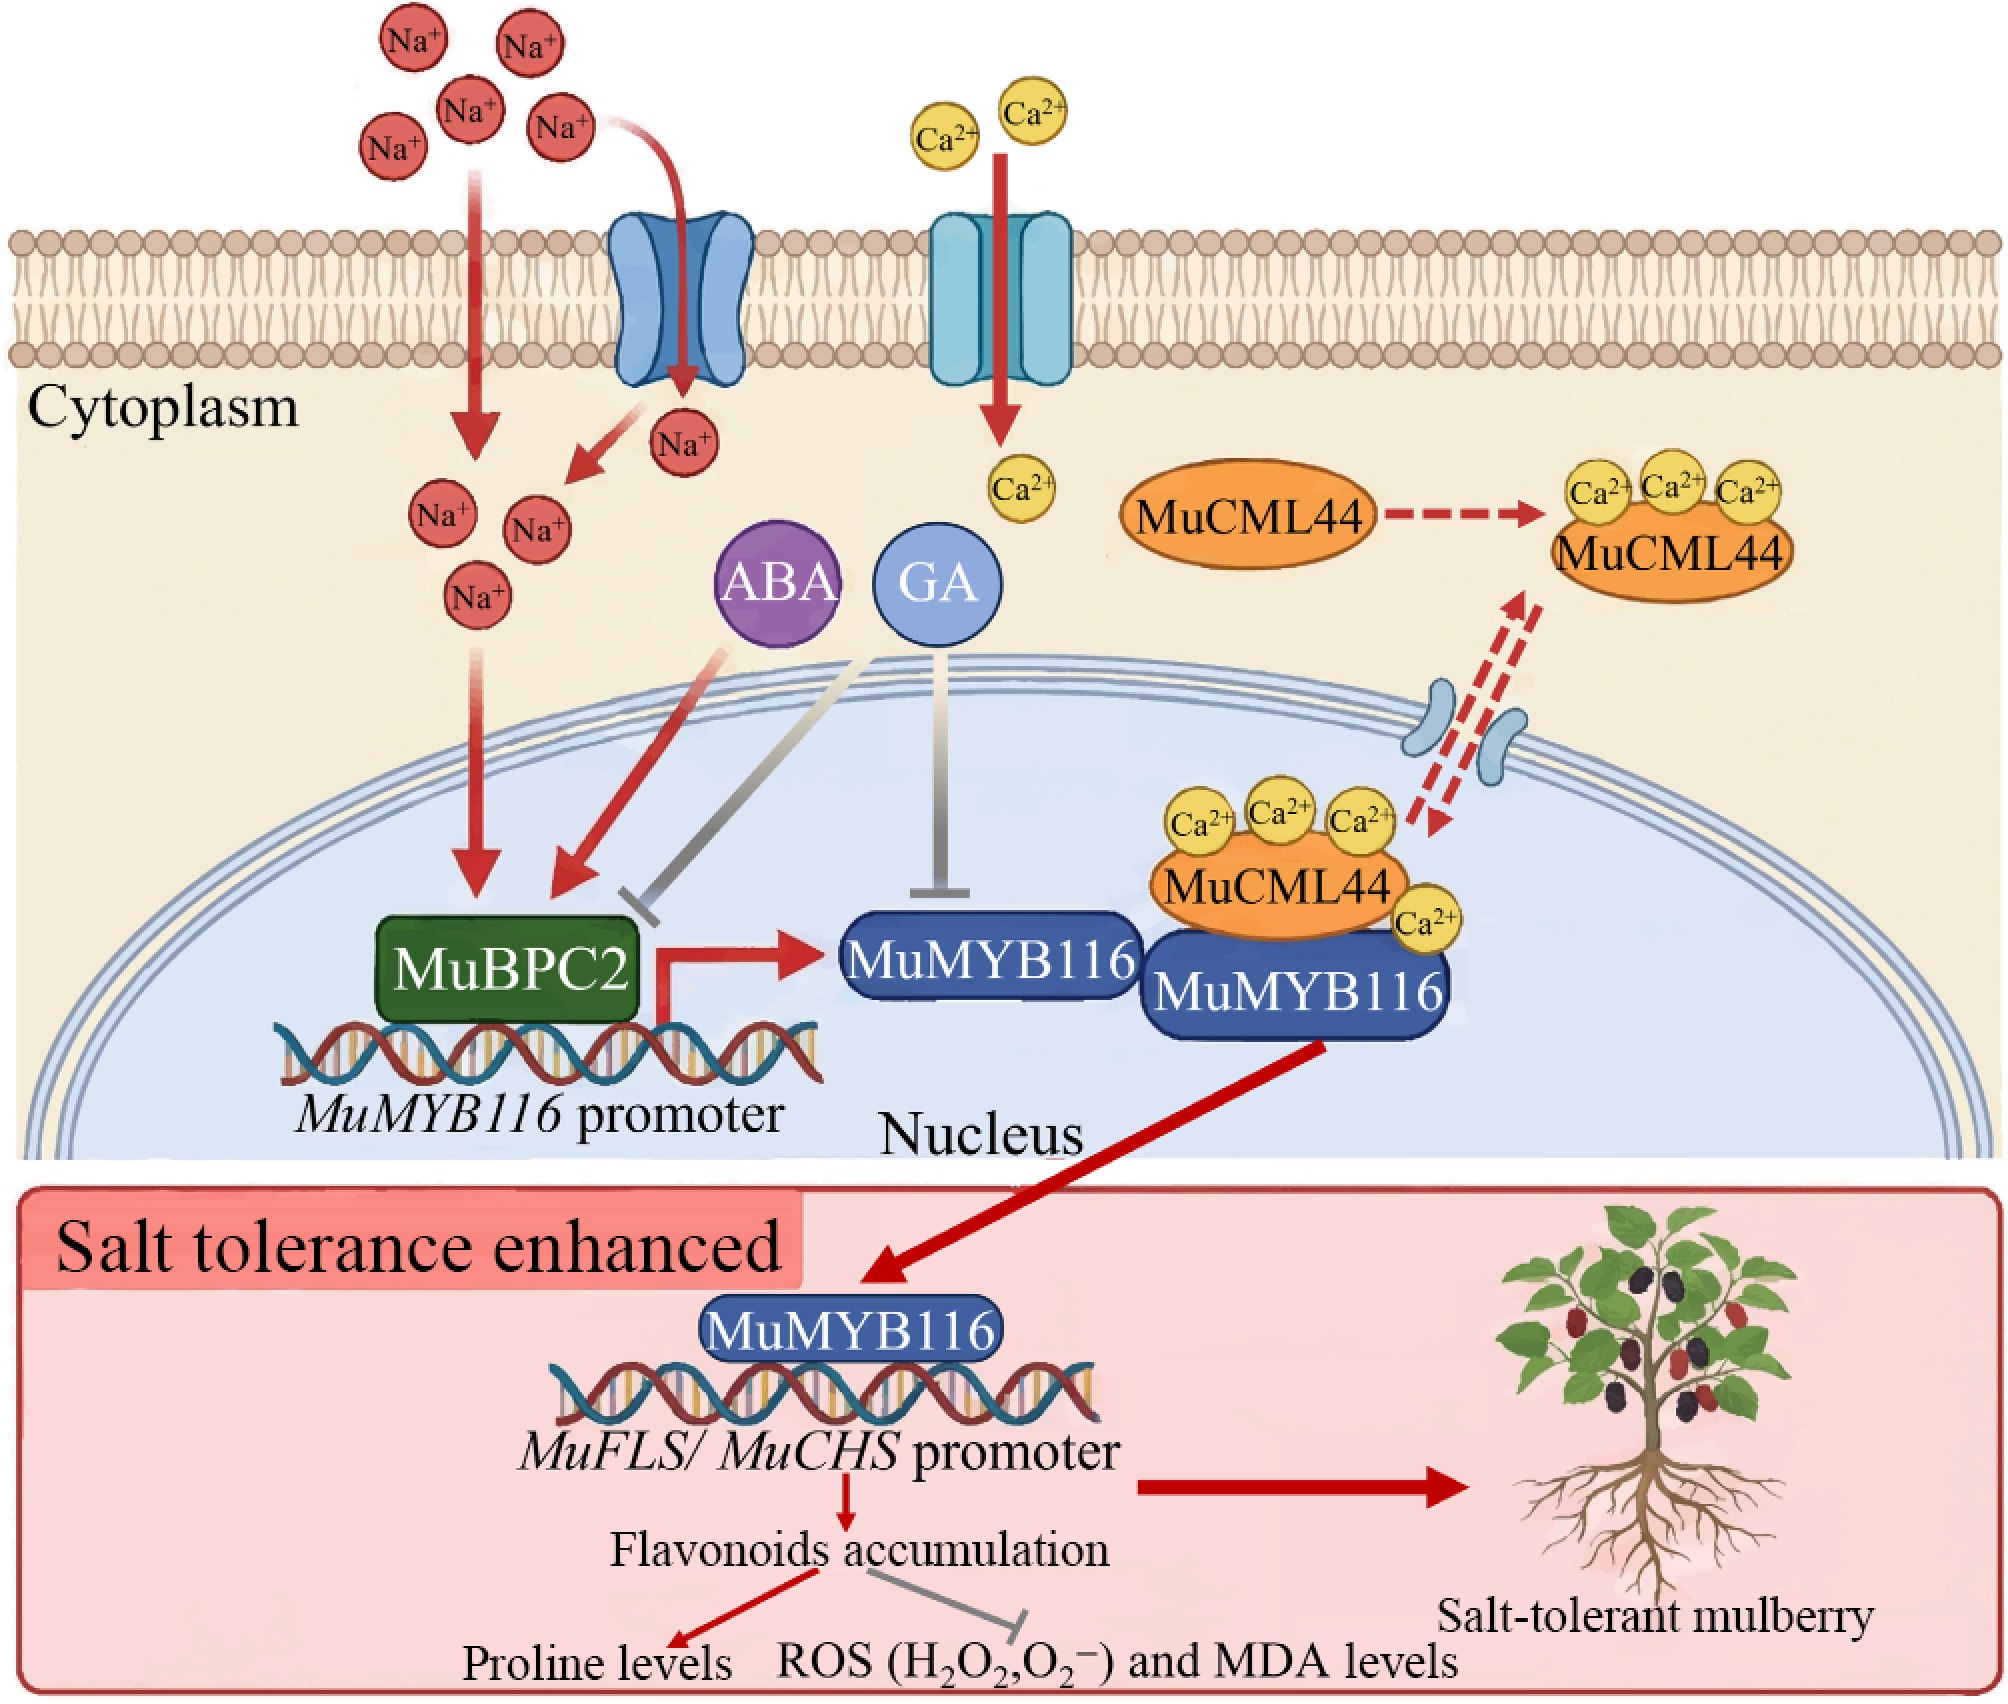
Figure 11.
Proposed working model of MuMYB116-mediated salt tolerance in mulberry. Salt stress induces MuBPC2 expression through ABA/MeJA signaling. MuBPC2 binds the MuMYB116 promoter and activates its transcription. Conversely, GA represses the transcription of both MuBPC2 and MuMYB116. Meanwhile, MuCML44, a Ca2+-binding protein, interacts with MuMYB116 and may link Ca2+ signaling to MuMYB116-mediated responses. The activated MuMYB116 then promotes flavonoid and proline accumulation, enhances antioxidant capacity, and reduces ROS and MDA levels, ultimately improving salt tolerance.
Figures
(11)
Tables
(0)