-
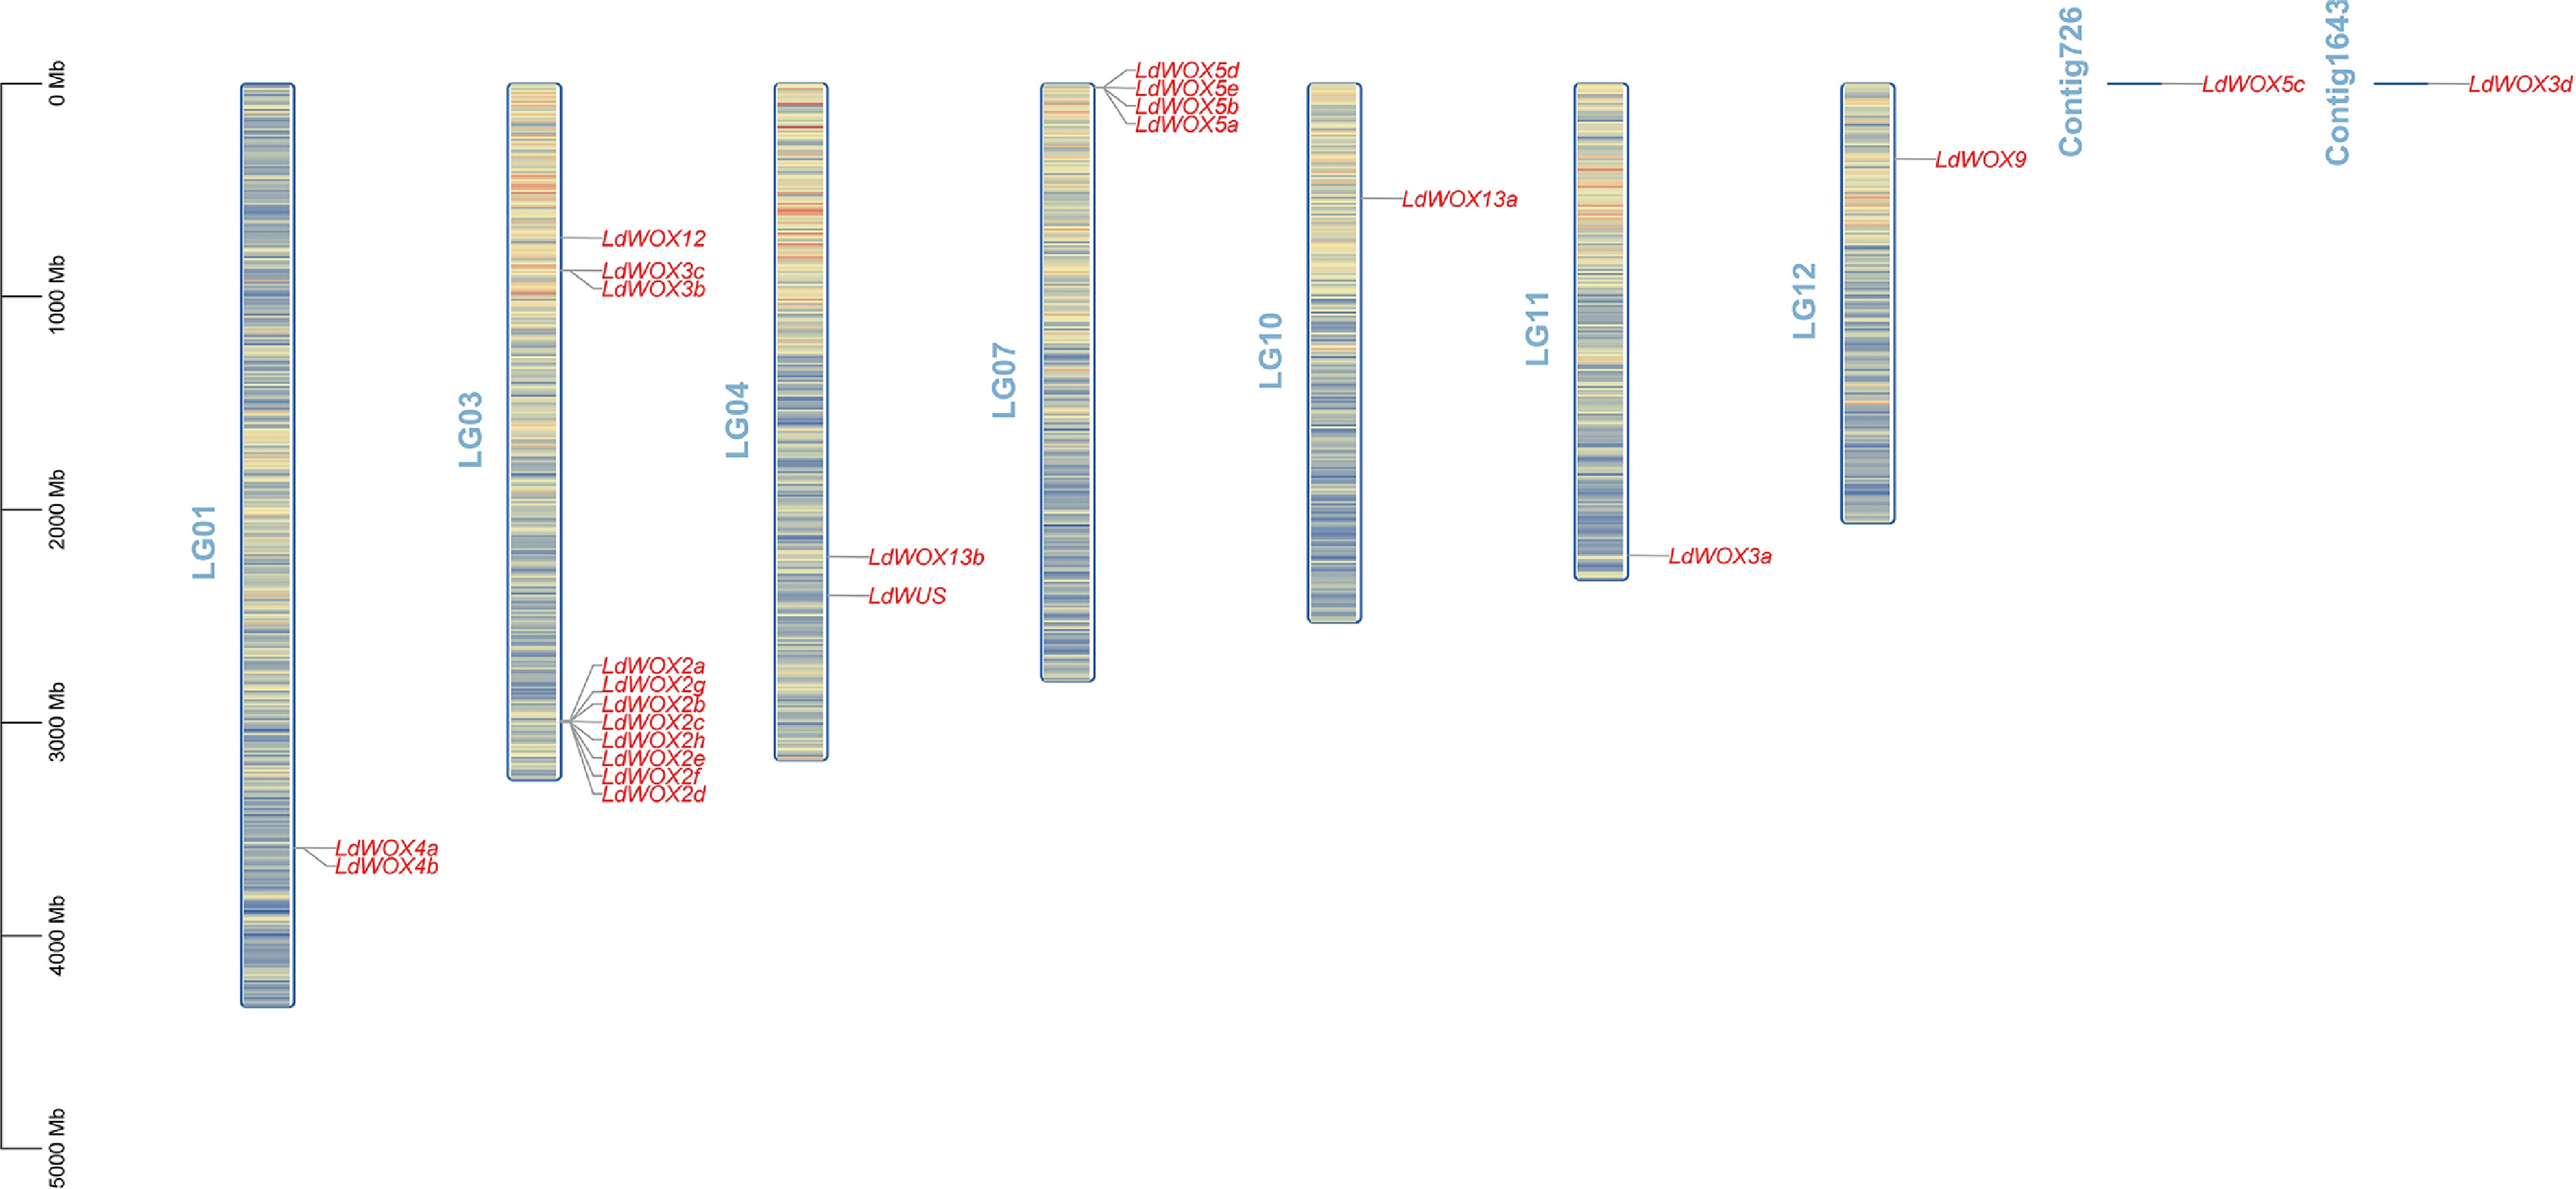
Figure 1.
Distribution of 24 LdWOX genes in the chromosomes of Lanzhou lily.
-
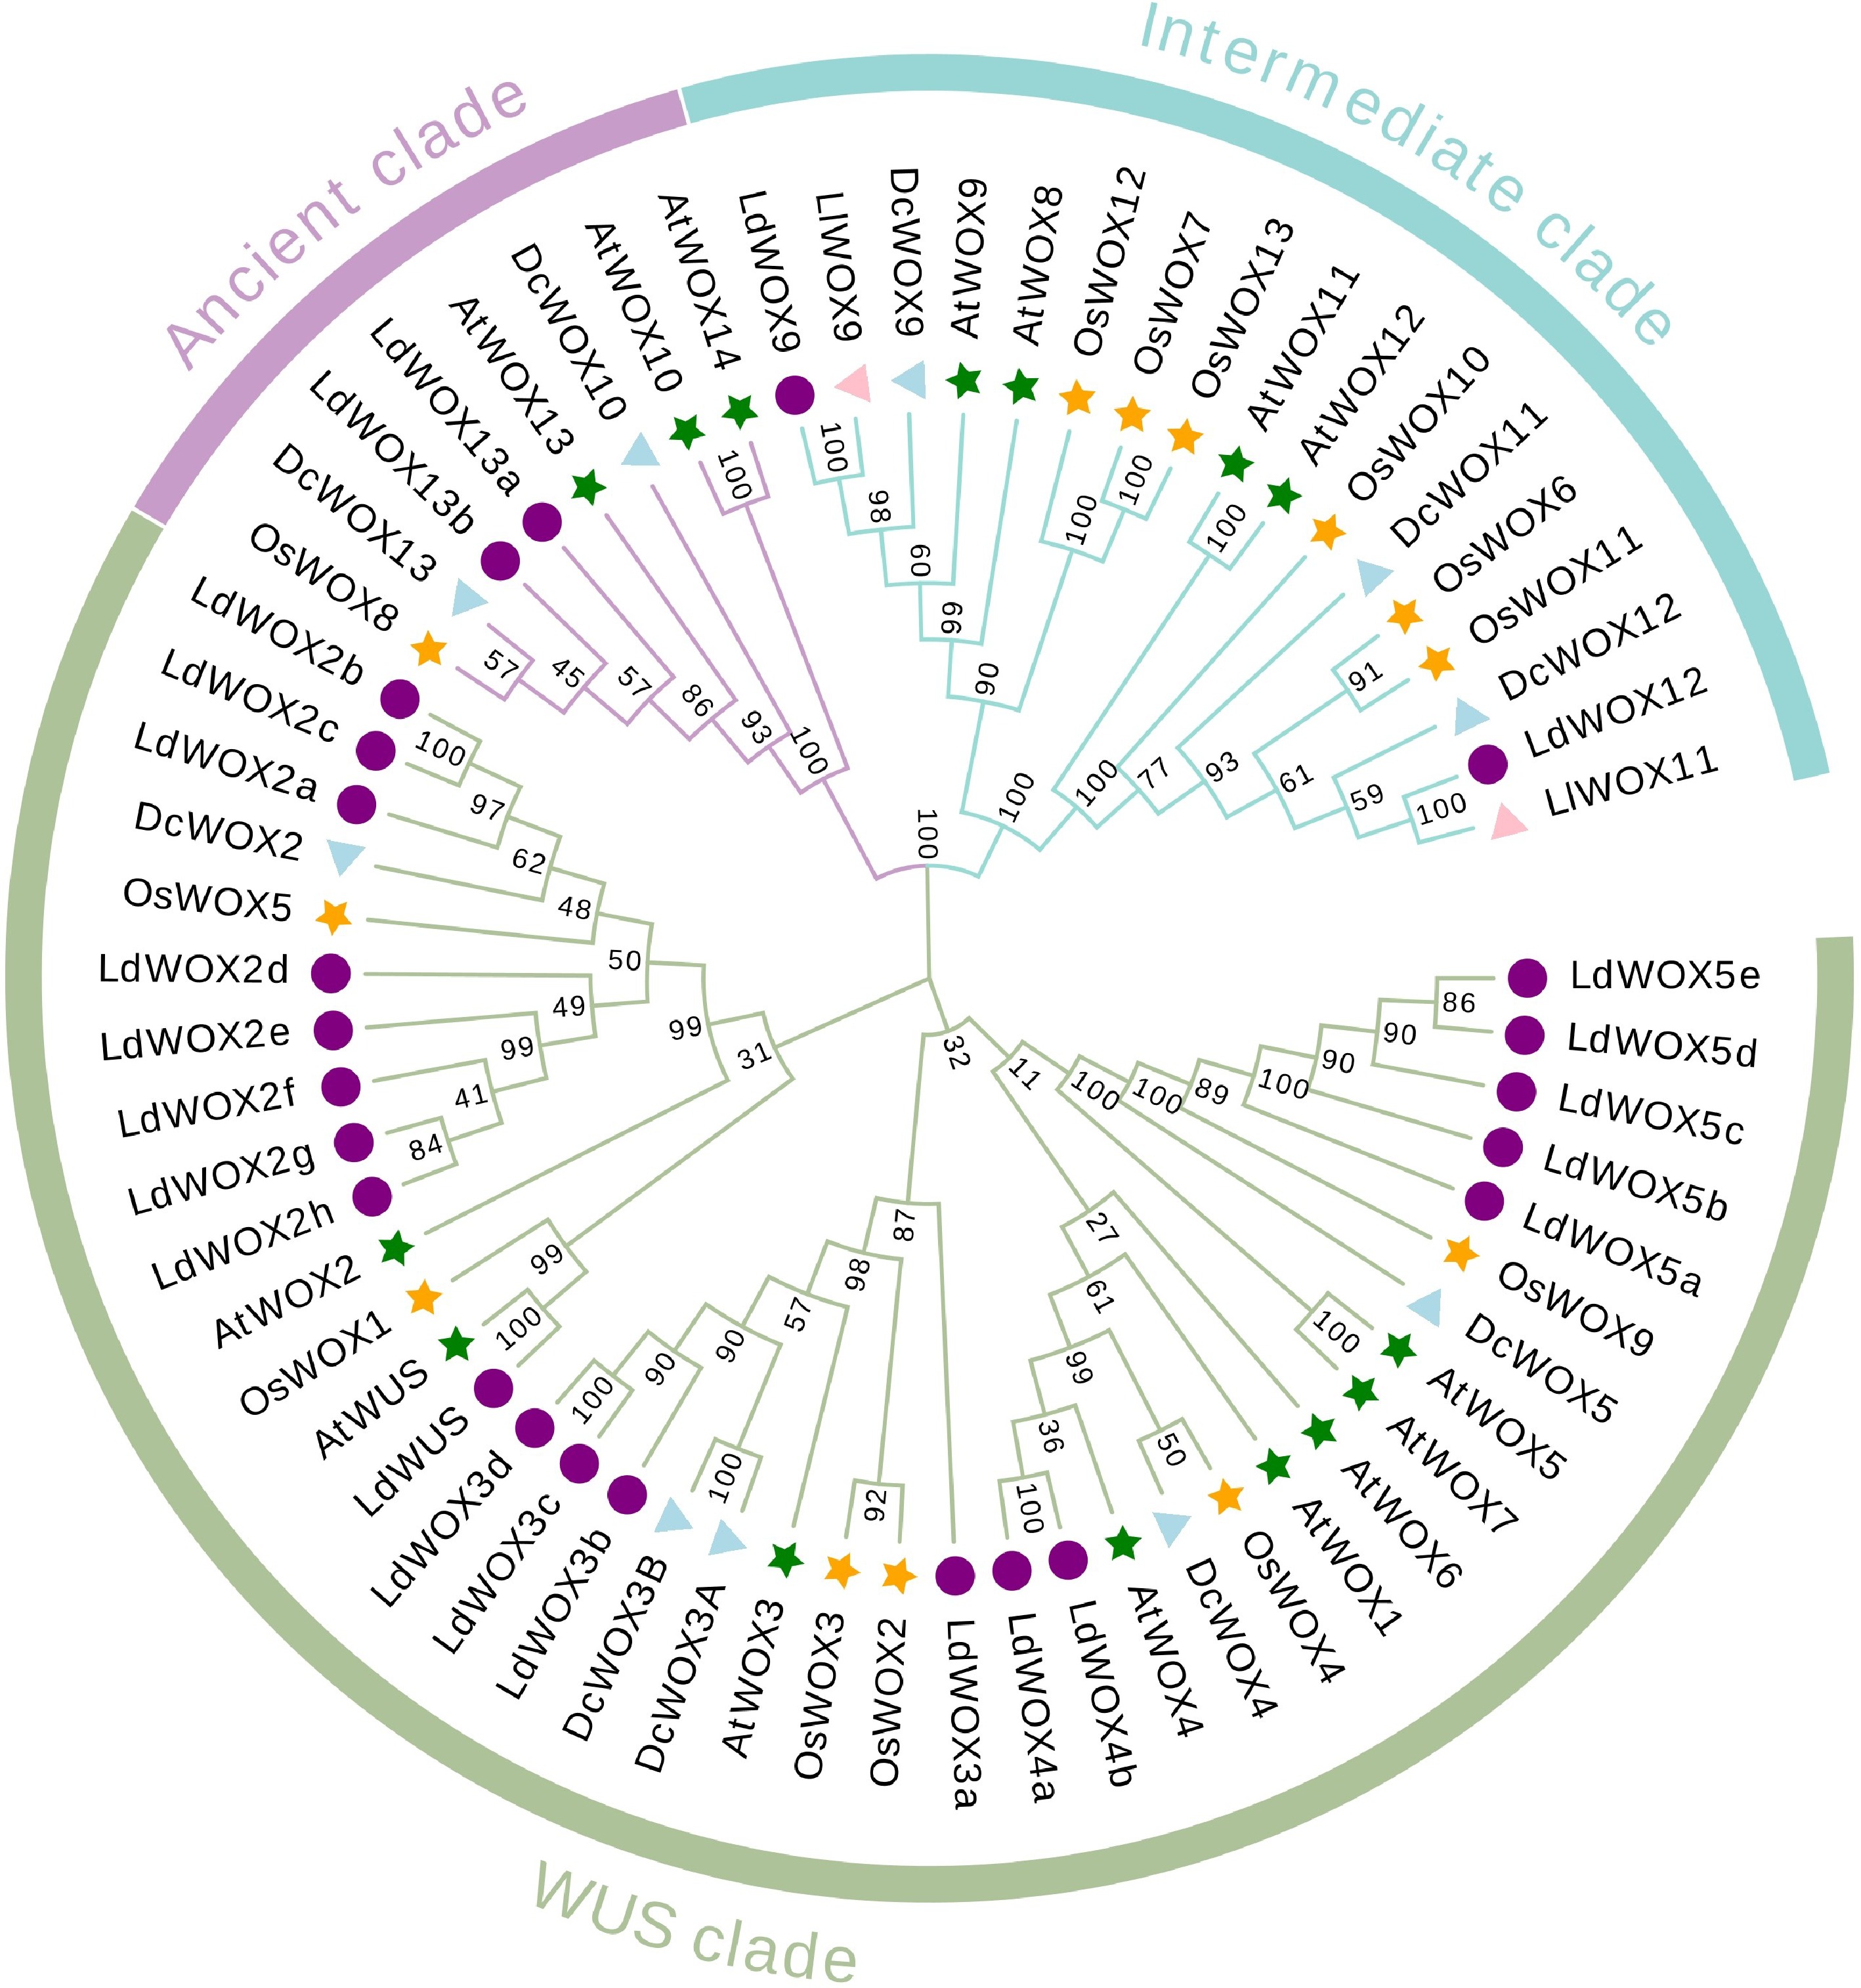
Figure 2.
Phylogenetic tree of WOX proteins. Complete members are shown for Lanzhou lily, A. thaliana, O. sativa, and D. catenatum; only partial members are shown for L. lancifolium. The LdWOXs, AtWOXs, OsWOXs, DcWOXs and LlWOXs are marked respectively with purple circles, green stars, orange stars, blue triangles, and pink triangles.
-
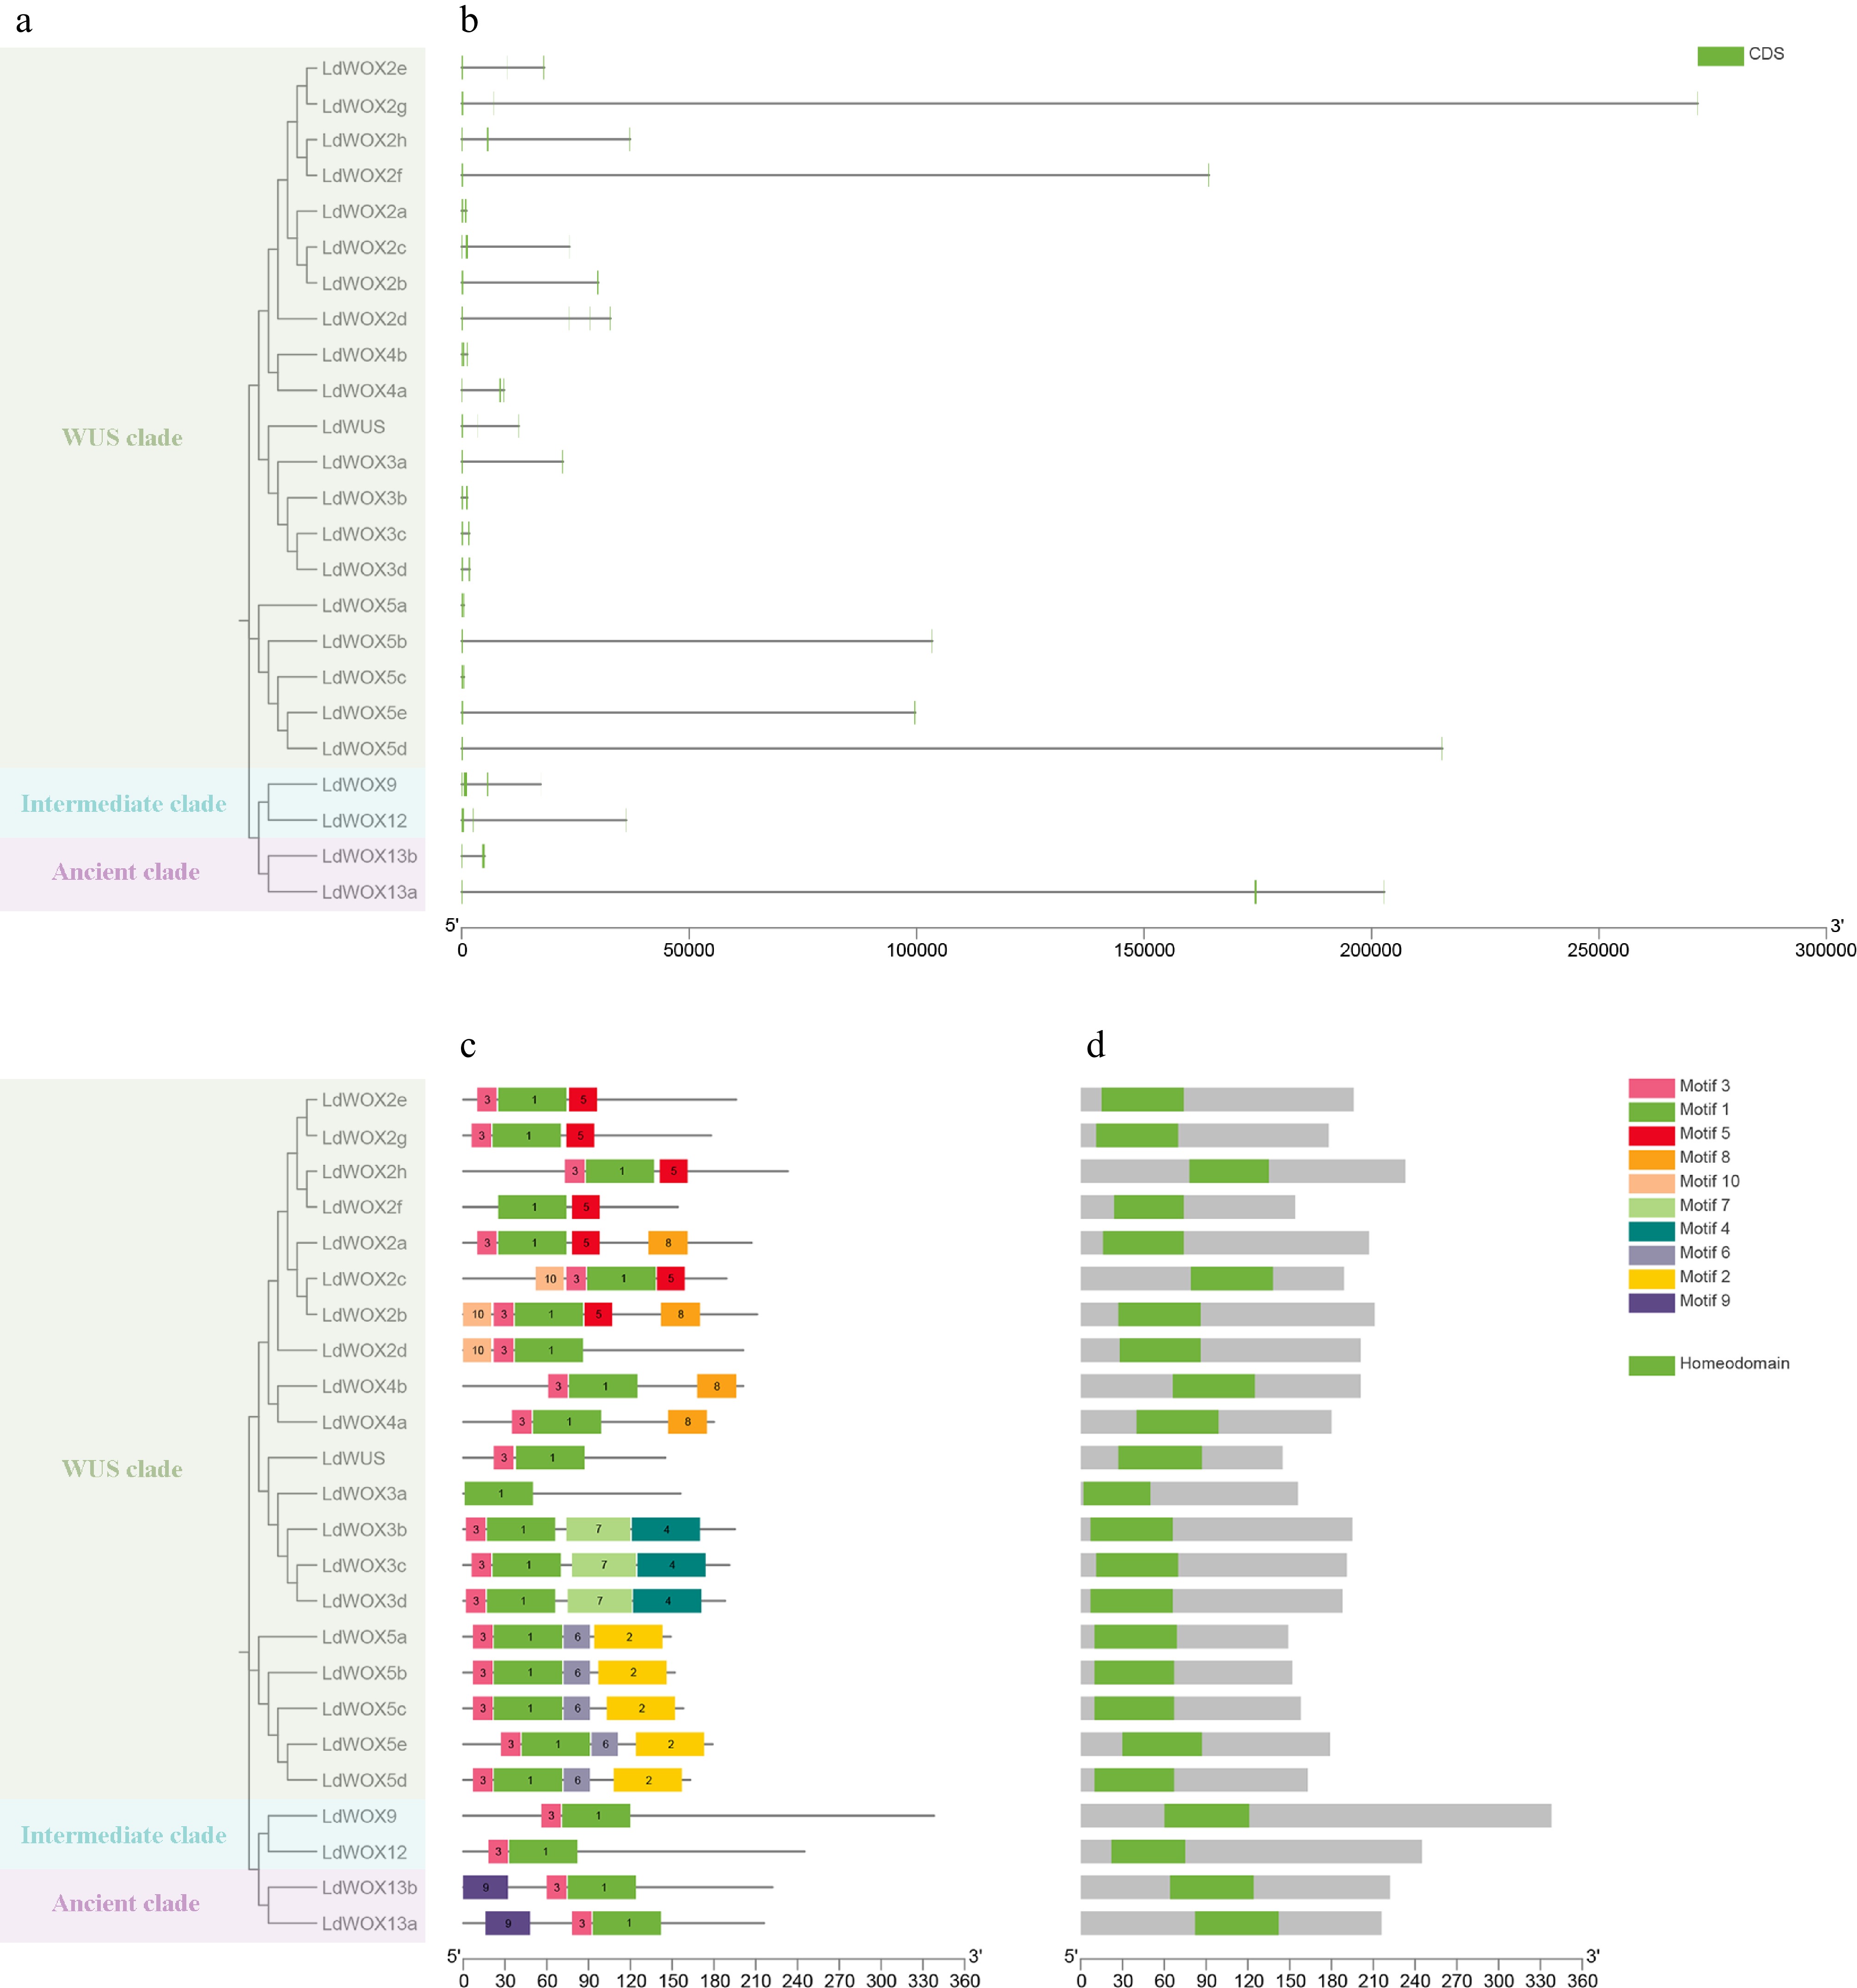
Figure 3.
Phylogenetic relationships, gene structures, conserved motifs, and conserved domains of the LdWOX family. (a) Phylogenetic tree and clade classification of the 24 LdWOX proteins. (b) Exon–intron structures of LdWOX genes. (c) Distribution of conserved motifs in LdWOX proteins. (d) Identification of homeodomains in LdWOX members.
-
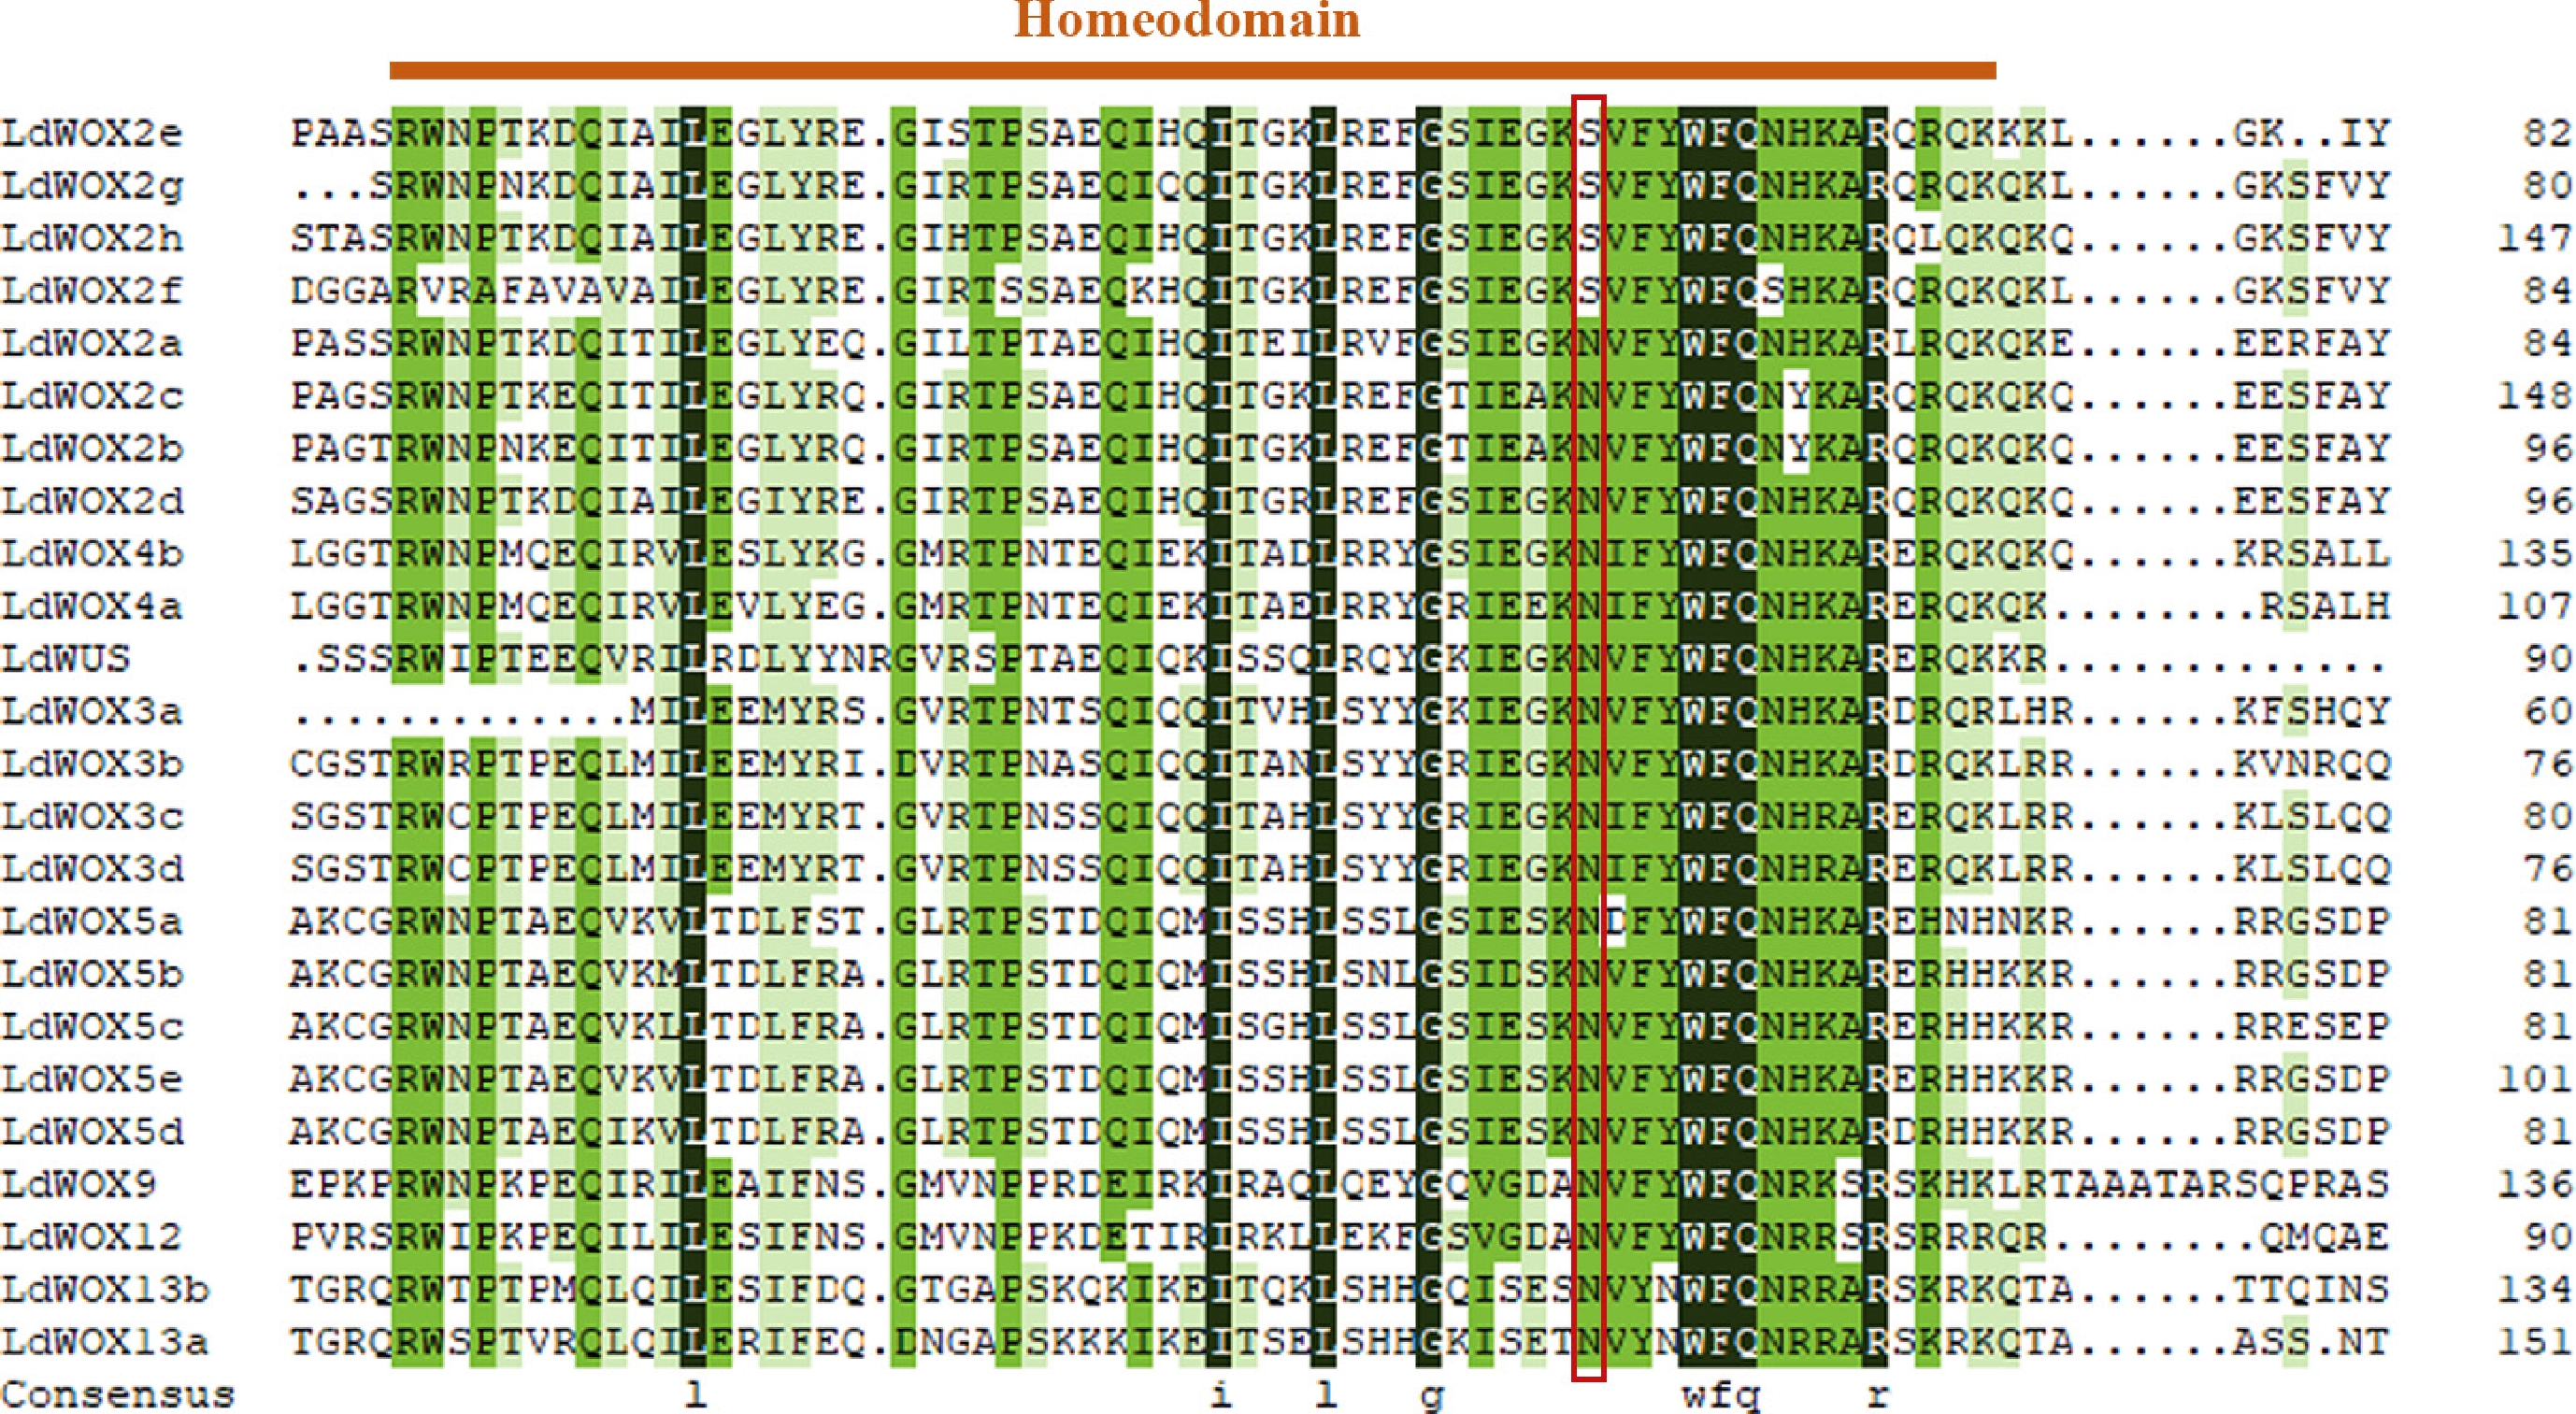
Figure 4.
Multiple sequence alignment of the homeodomains from 24 LdWOX proteins. The LdWOX members are arranged according to their phylogenetic relationships. The letters below the alignment denote the eight absolutely conserved amino acid residues. The red box highlights the variable residue site mentioned in the main text.
-
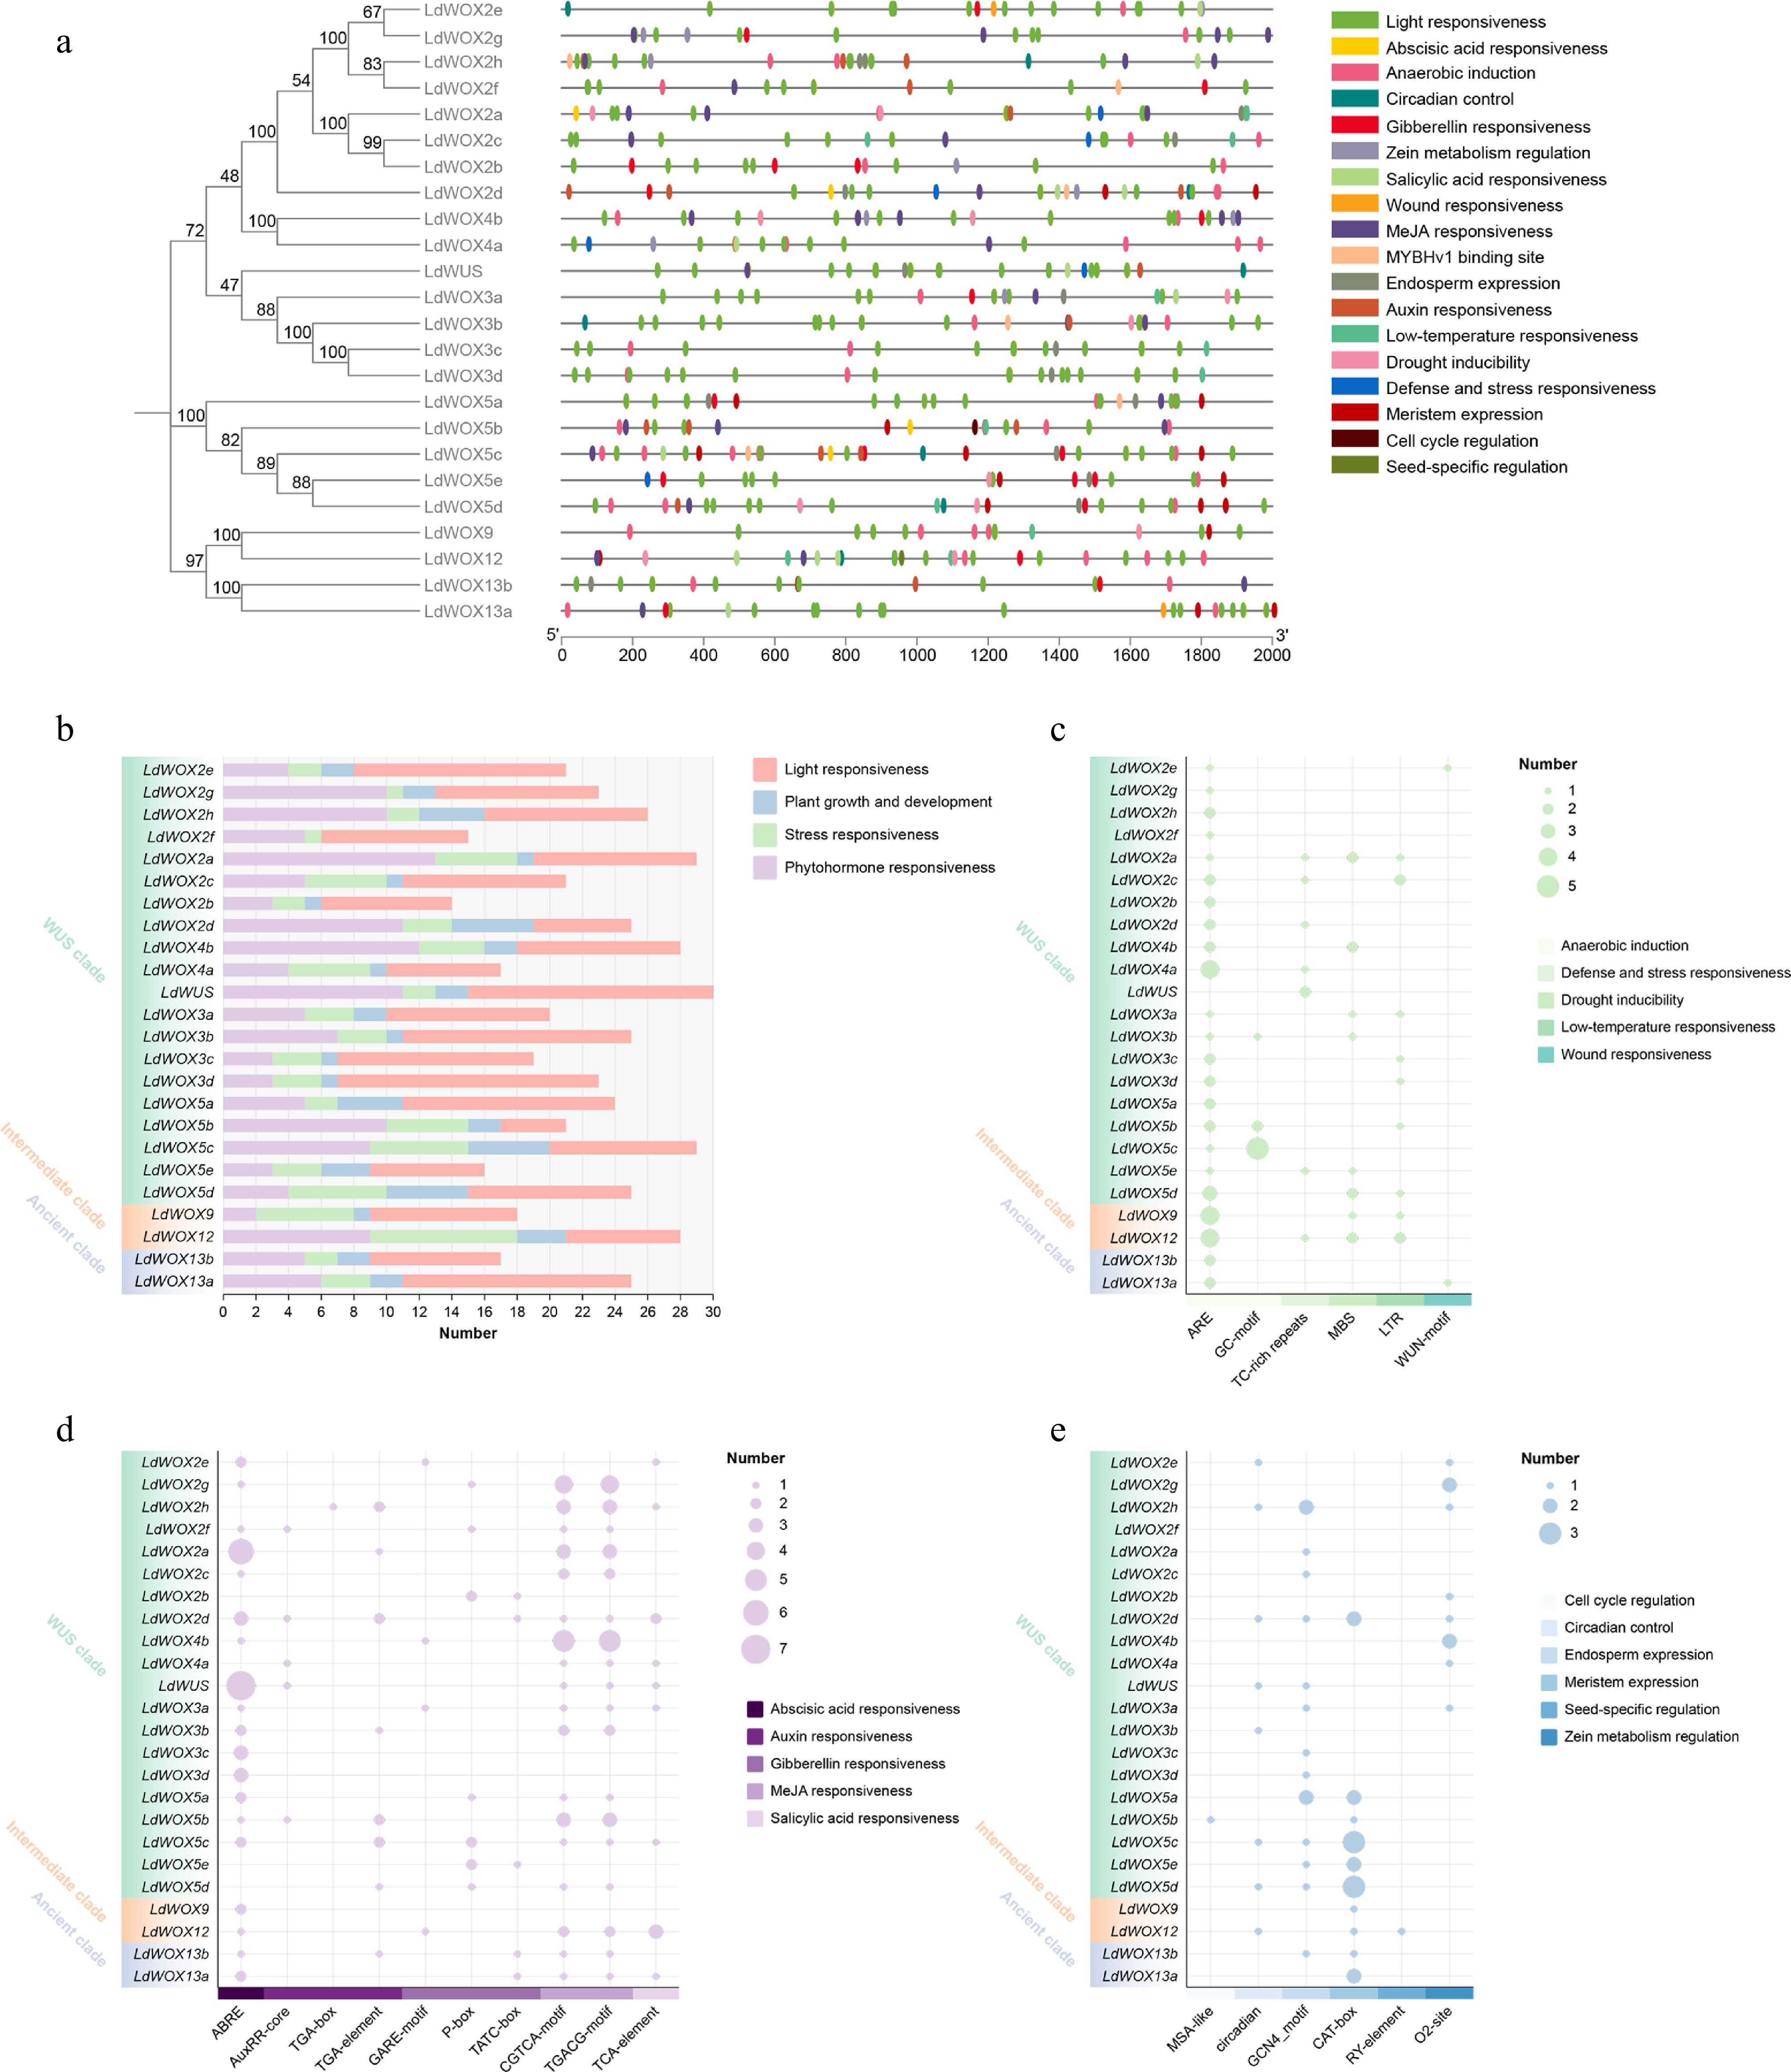
Figure 5.
Comprehensive analysis of cis-acting elements in the LdWOX promoters. (a) Distribution of cis-acting elements in the promoters. (b) Counts of the four major categories of cis-acting elements: Light responsiveness, plant growth and development, stress responsiveness, and phytohormone responsiveness. (c) Counts of stress-responsive cis-acting elements. (d) Counts of phytohormone-responsive cis-acting elements. (e) Counts of cis-acting elements related to plant growth and development.
-
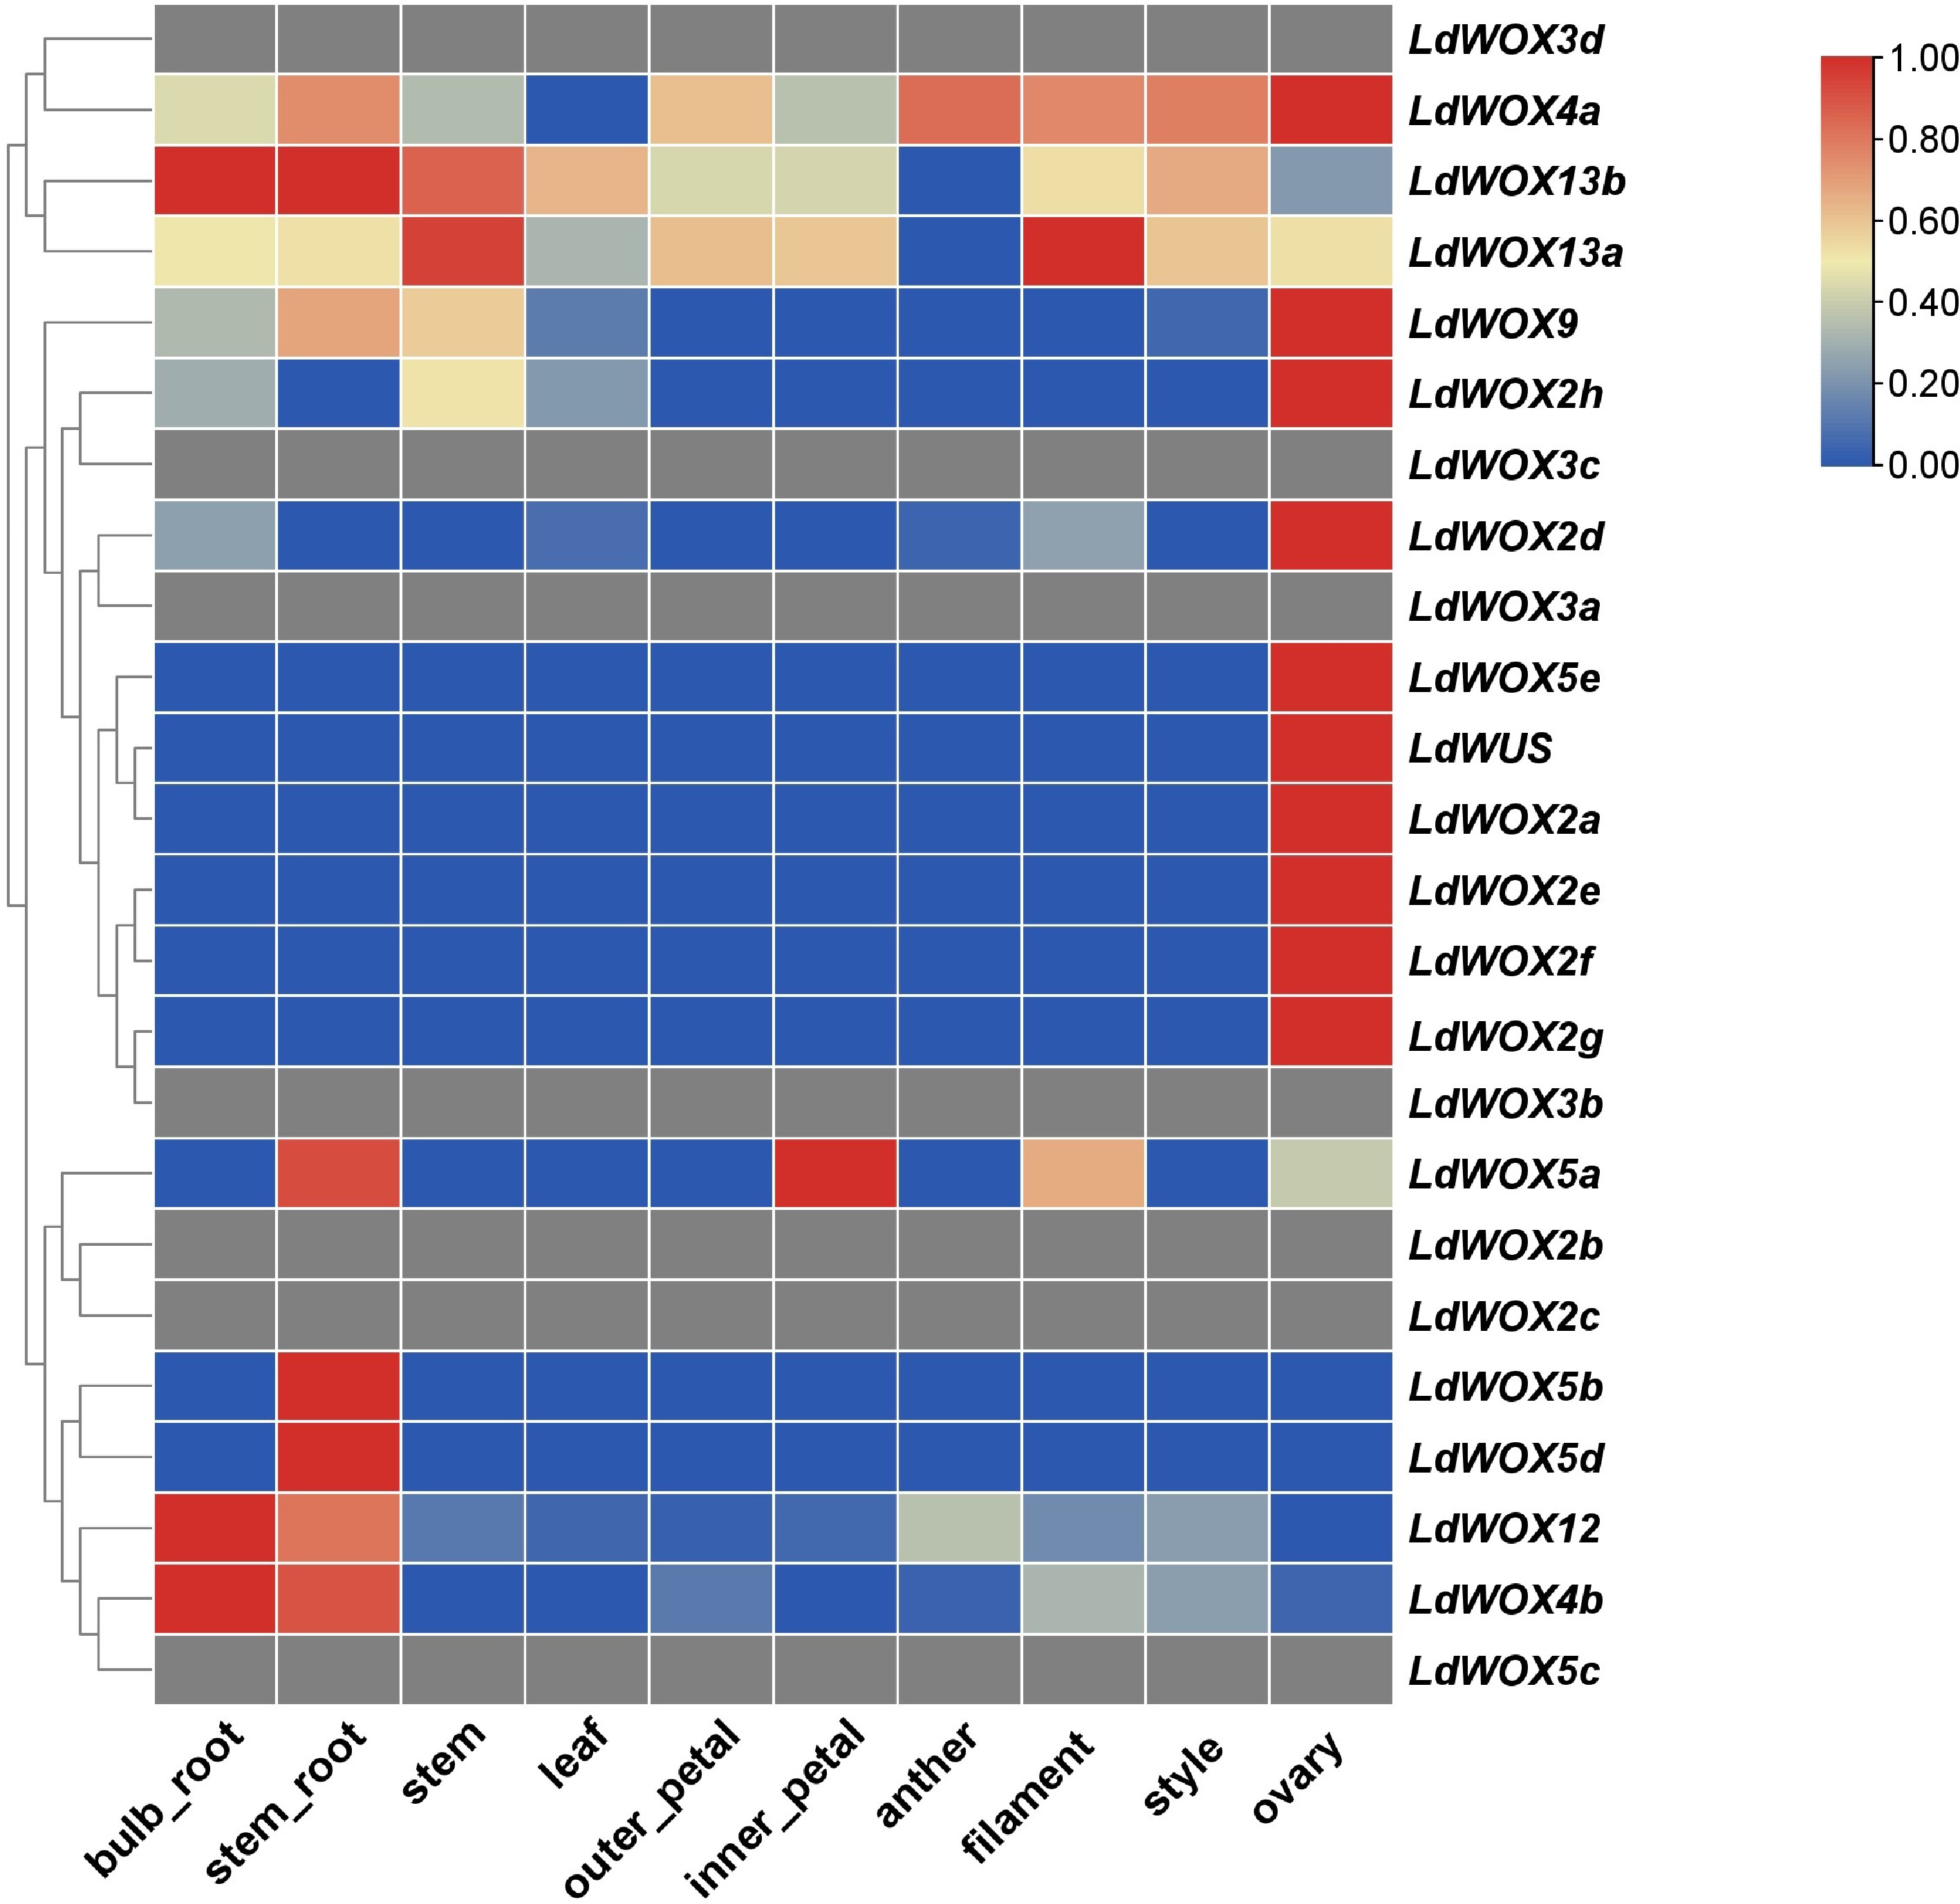
Figure 6.
Expression patterns of LdWOX family members in the 10 tissues of Lanzhou lily. The color scale represents row-normalized expression levels, where log2(x + 1)-transformed TPM values were linearly scaled to a 0–1 range for each gene.
-
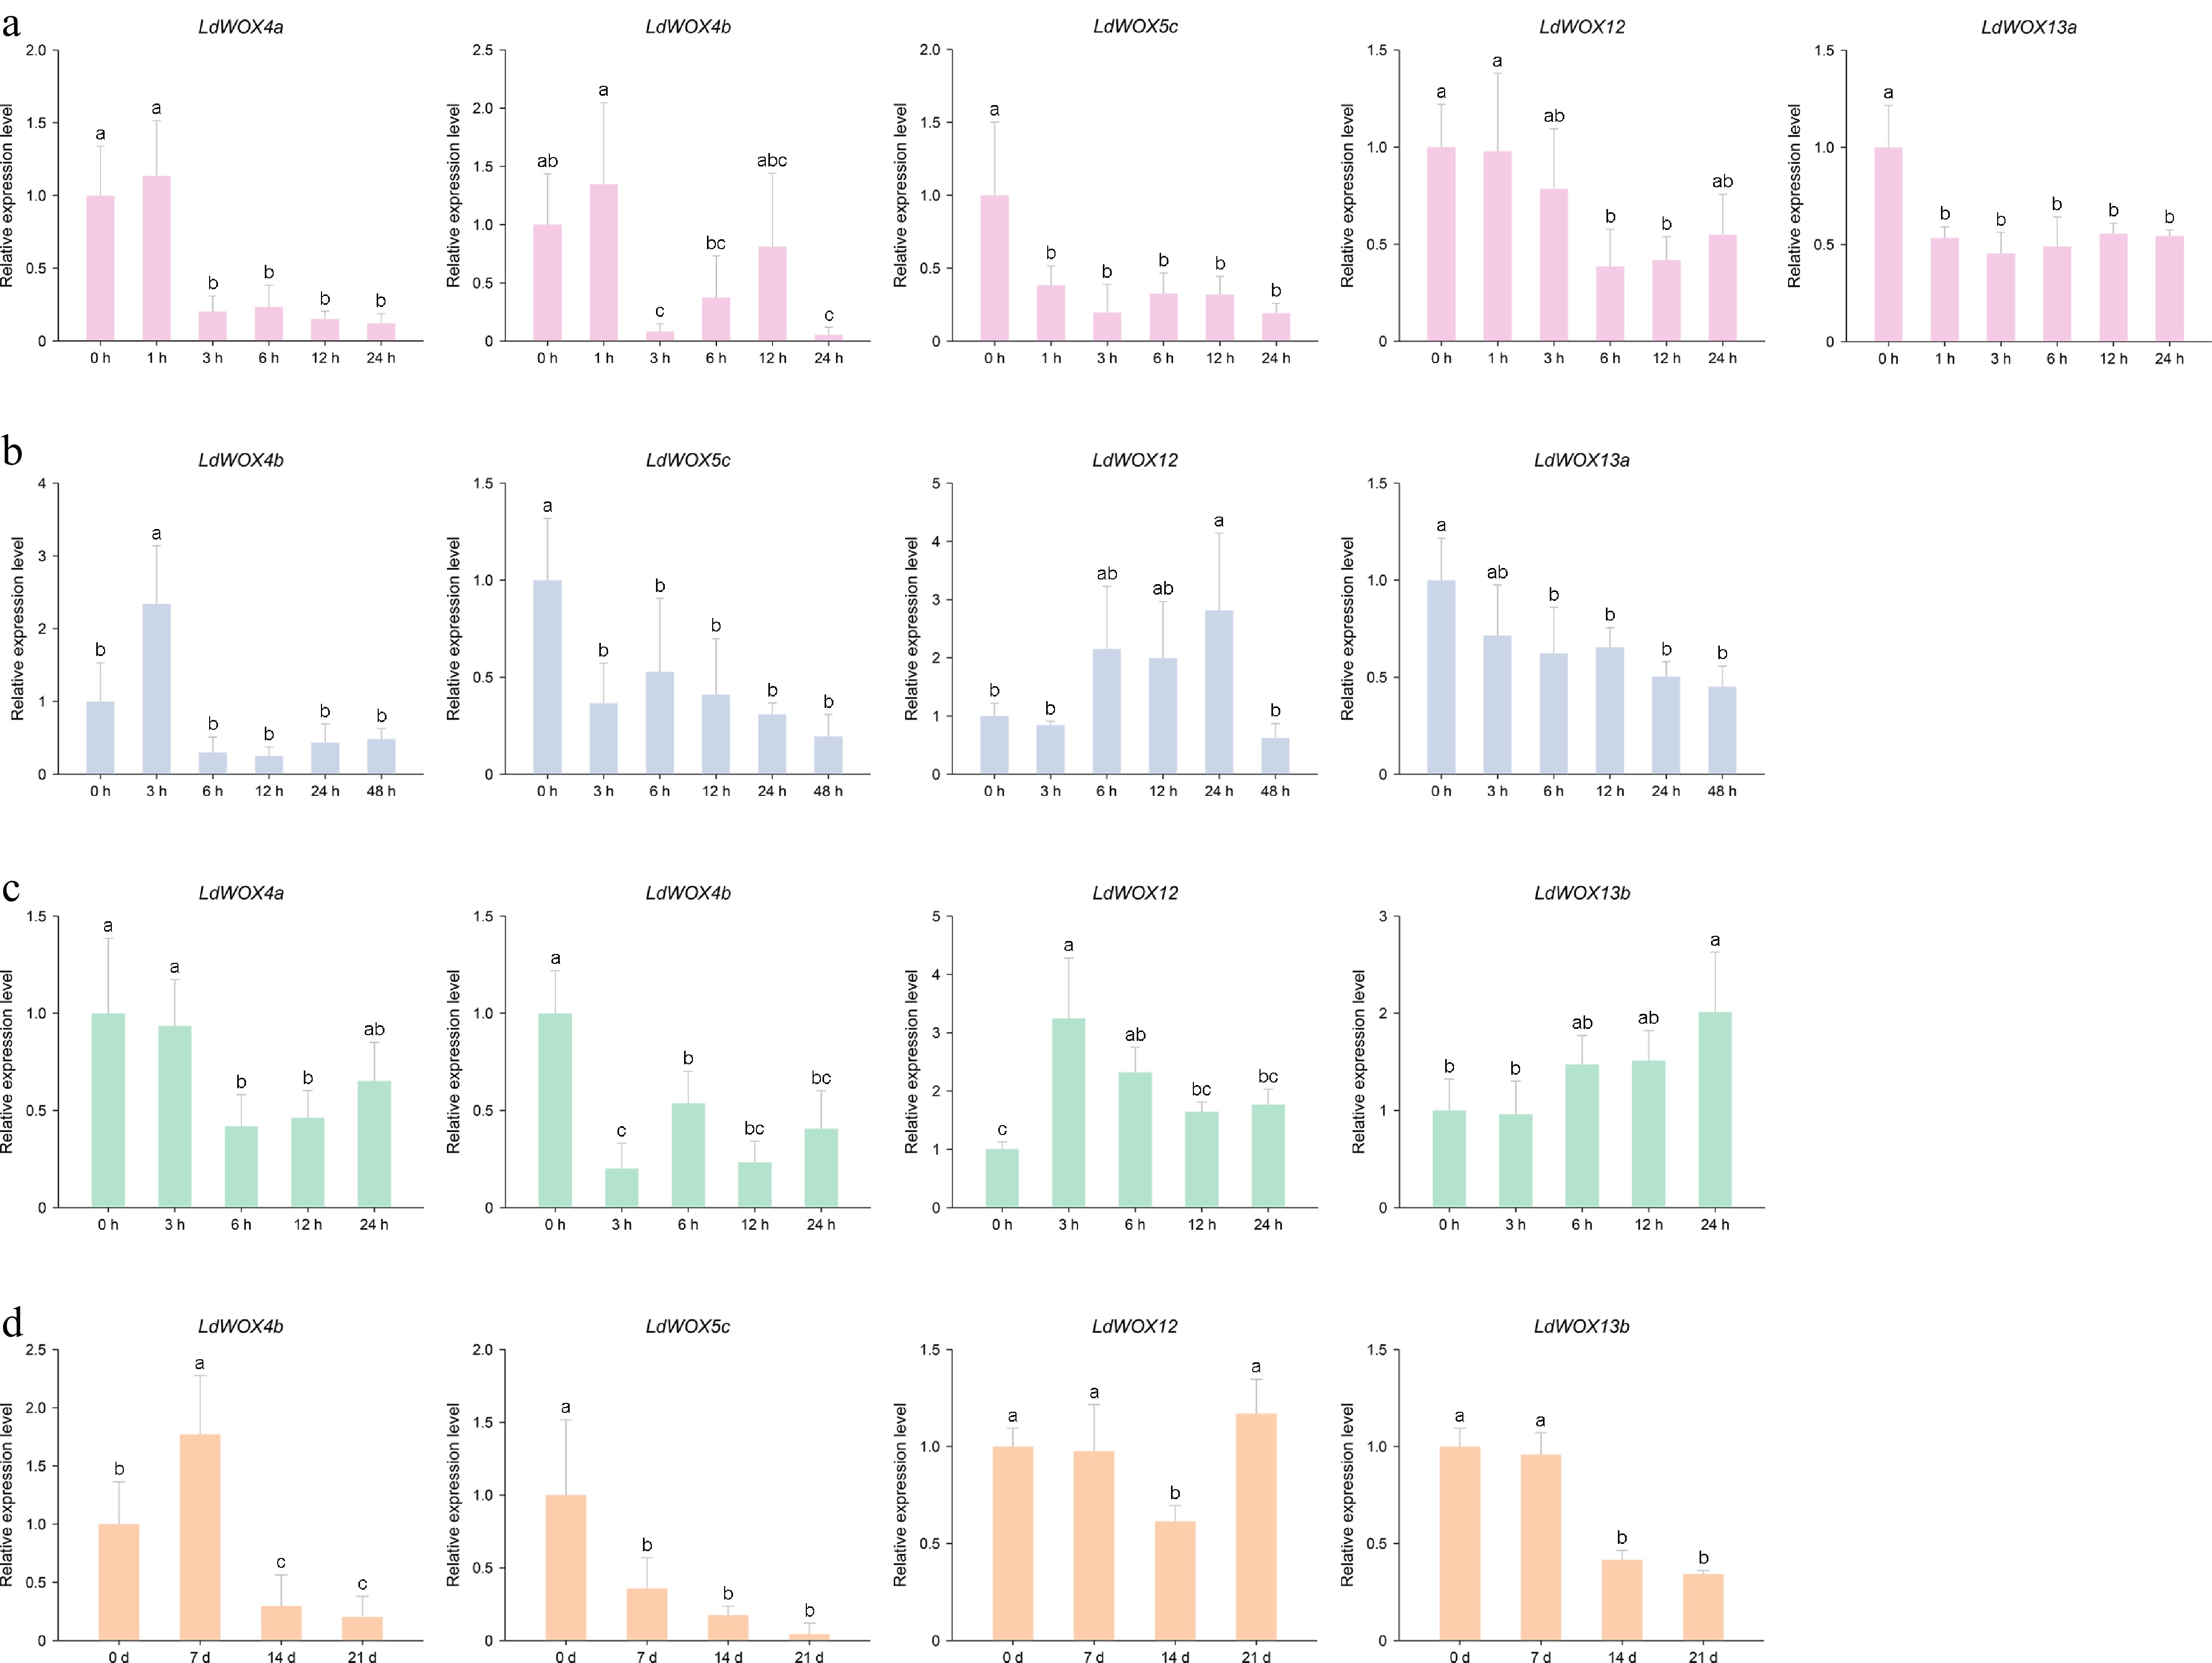
Figure 7.
Expression dynamics of LdWOX genes in the stem roots of Lanzhou lily under (a) high-temperature stress, (b) low-temperature stress, (c) salt stress, and (d) drought stress. Only genes showing significant expression changes over time are displayed. Data are presented as the means ± SD (n = 3). One-way ANOVA followed by an LSD post hoc test was used. Different lowercase letters indicate significant differences (p < 0.05).
Figures
(7)
Tables
(0)