-
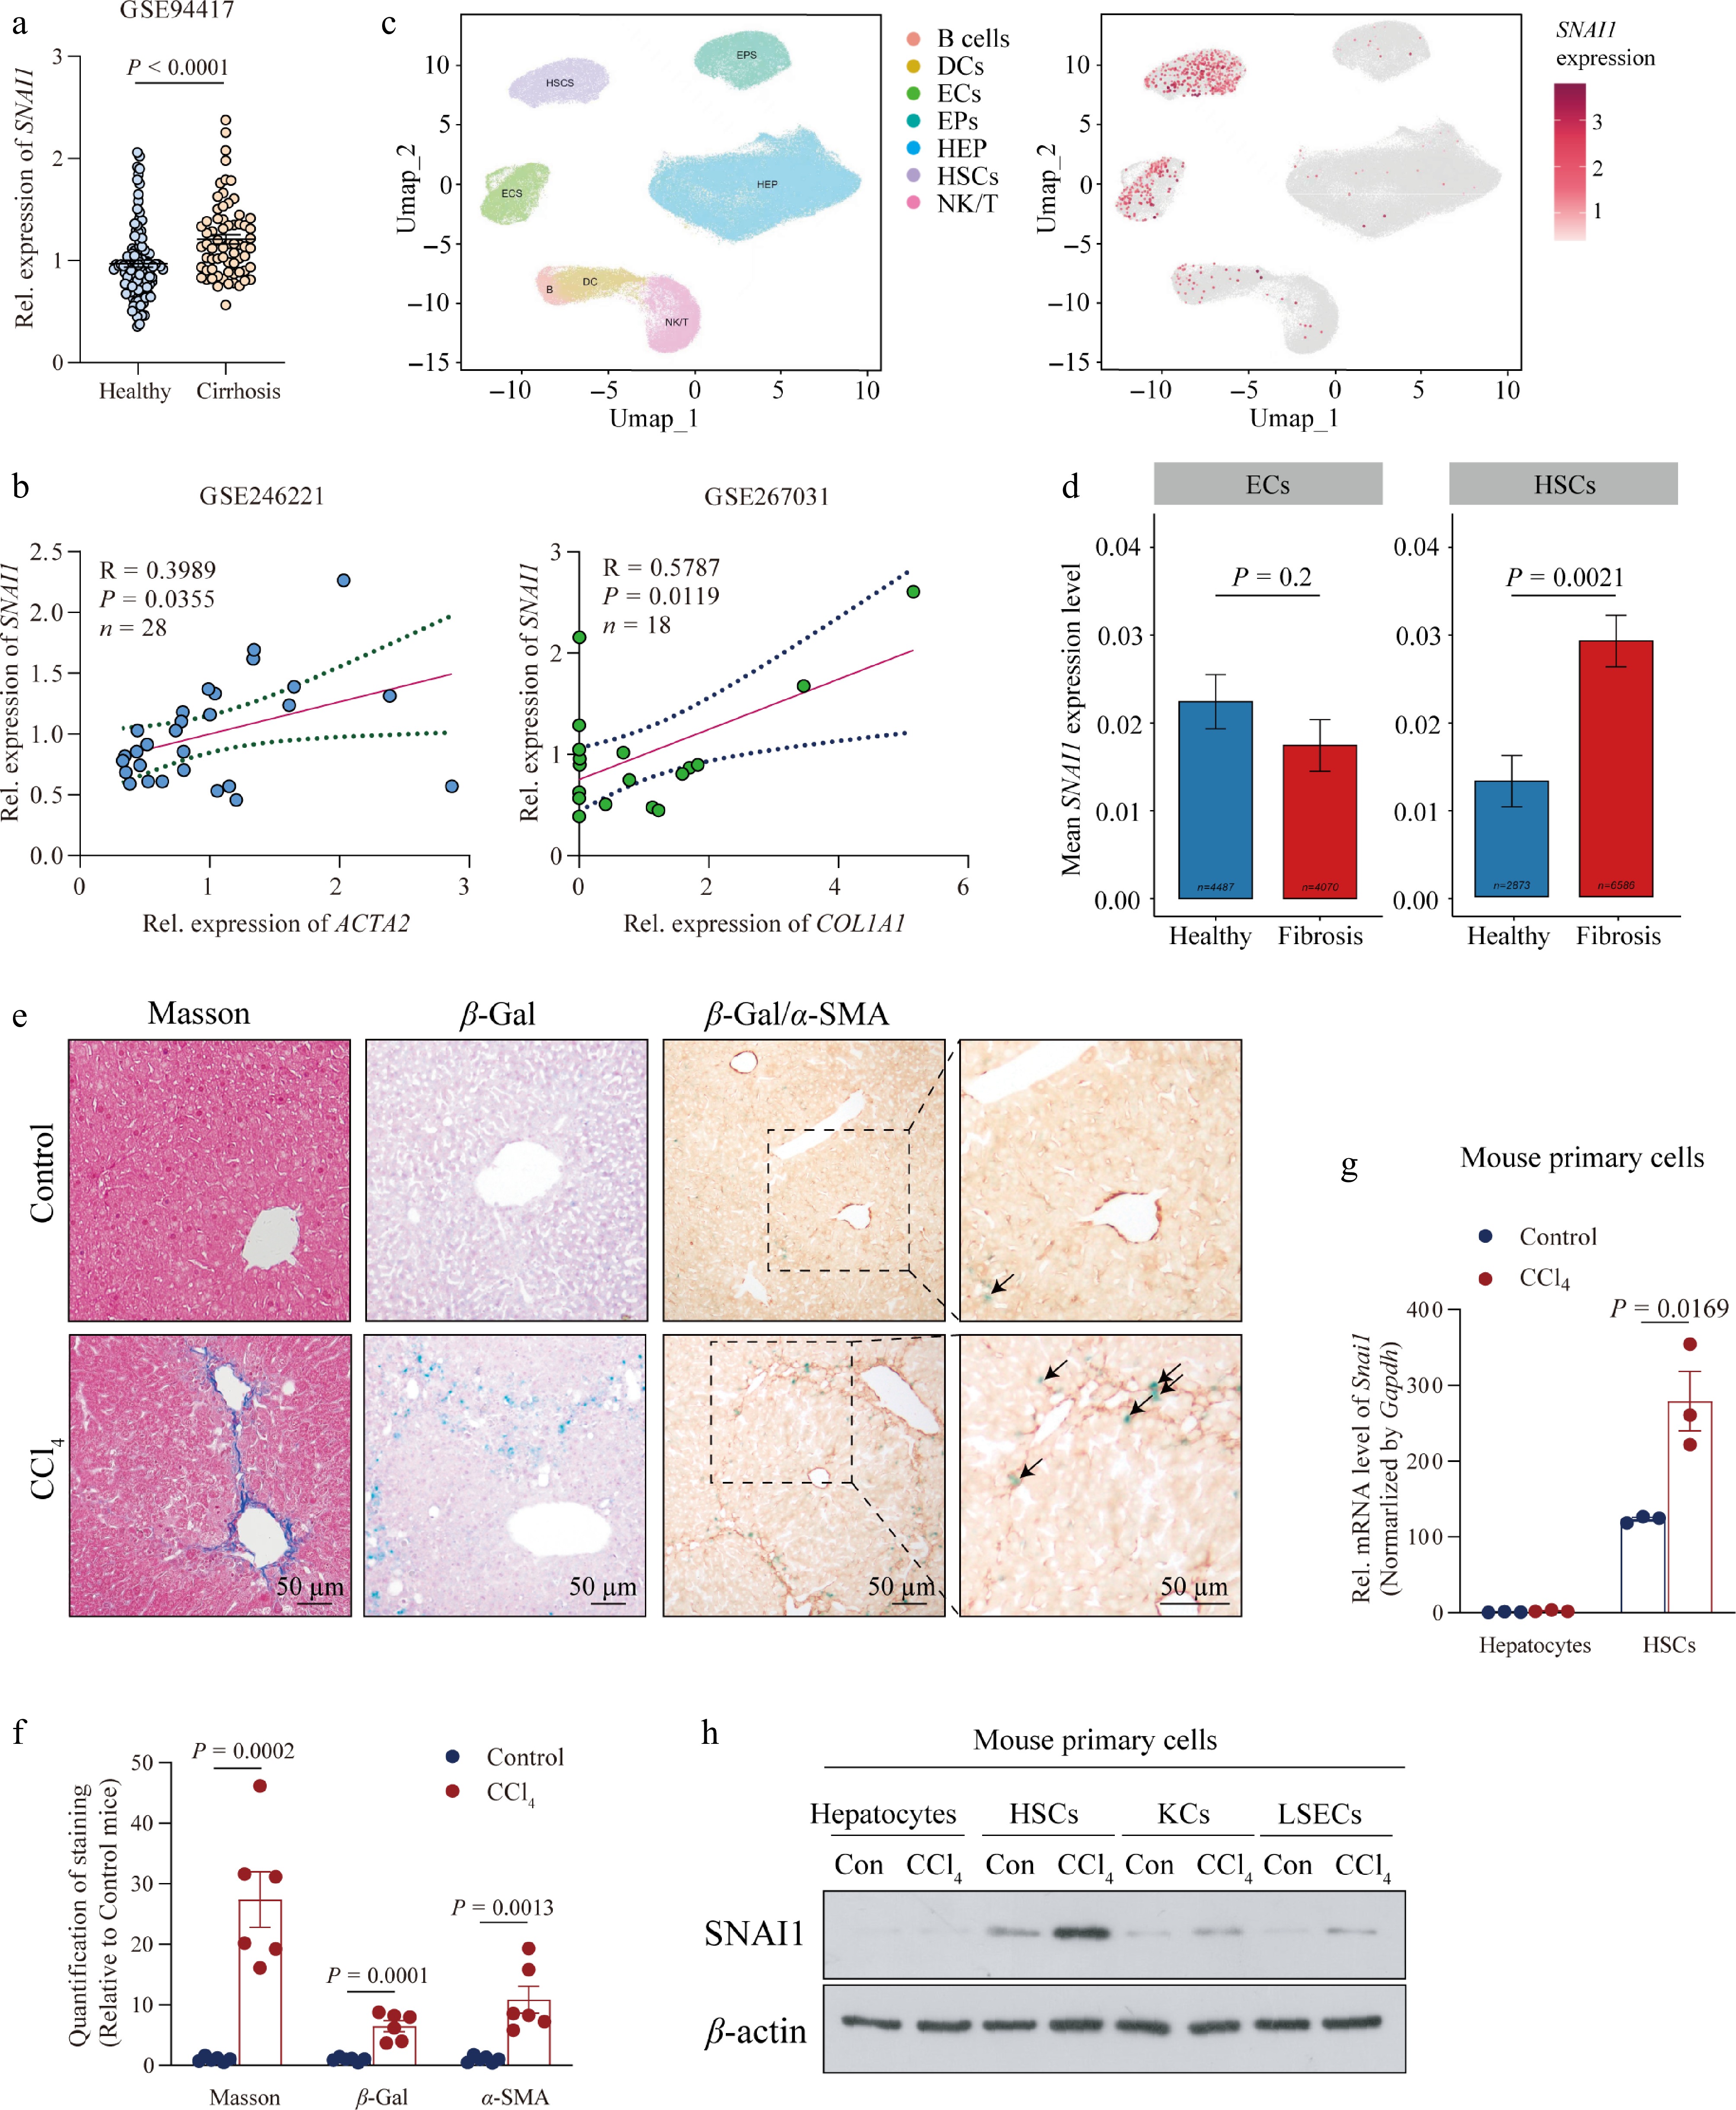
Figure 1.
SNAI1 expression in HSCs was upregulated during the progression of liver fibrosis. (a) Relative mRNA level of SNAI1 acquired from the Gene Expression Omnibus (GSE94417) in livers from healthy controls or patients with cirrhosis. (b) Correlation of relative SNAI1 expression with ACTA2 and COL1A1 in patients with MASH. Genetic data acquired from GSE246221 and GSE267031, respectively. (c) Single-cell transcriptome analysis of data from GSE256398; UMAP visualization of liver cell clusters based on human scRNA sequencing (left). Red dots represent the expression of SNAI1 (right). (d) Mean SNAI1 expression level in endothelial cells (ECs) and HSCs. (e) Representative images of Masson staining, β-gal staining, and β-gal/α-SMA co-staining in mice injected with oil (Control) and CCl4. Arrows indicate the positive area of β-gal/α-SMA. Scale bar: 50 μm. (f) Quantification of the positive area in Fig. 1e. Primary hepatocytes, HSCs, KCs, and LSECs were isolated from liver tissues in mice subjected to oil or CCl4 for 4 weeks. (g) mRNA levels of Snai1 in hepatocytes and HSCs. (h) Protein levels of SNAI1 in hepatocytes, HSCs, KCs, and LSECs. Data are presented as mean ± SEM. P < 0.05 indicates a significant difference. All data were analyzed by two-tailed Student’s t-test except data in (d) using Wilcoxon Mann–Whitney test.
-
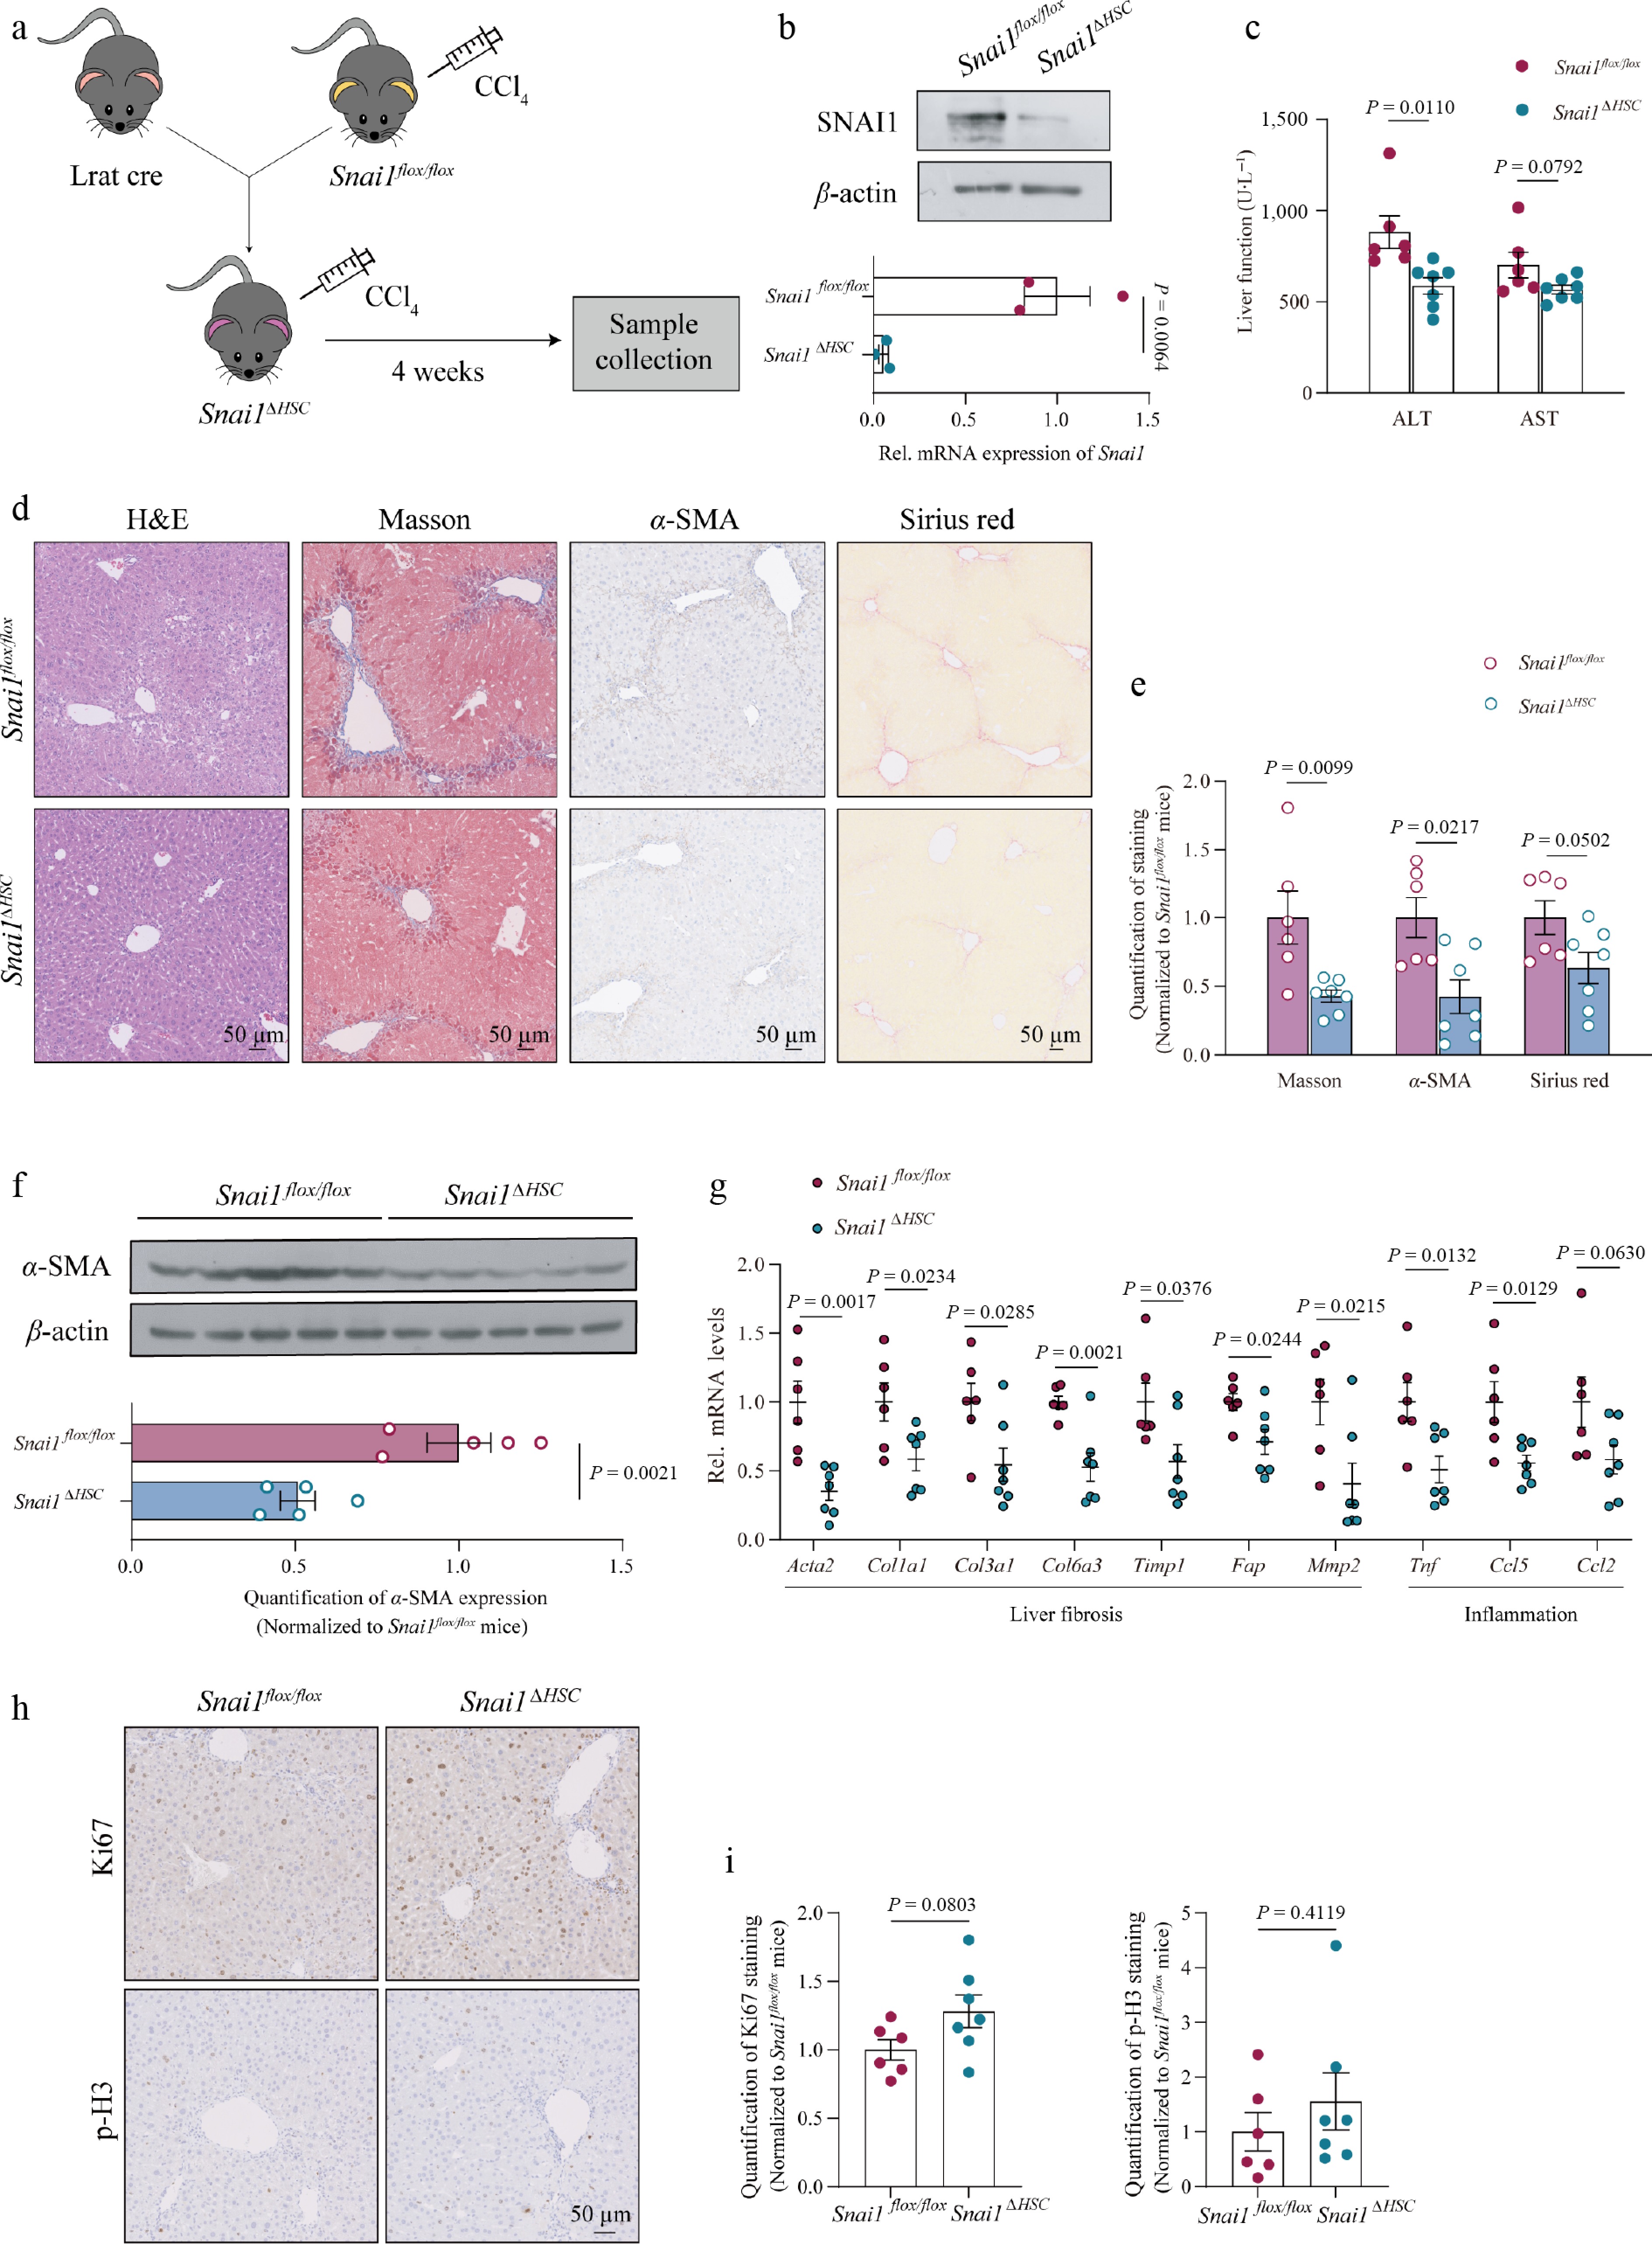
Figure 2.
HSC-specific deficiency of Snai1 protected mice from CCl4-induced liver fibrosis. (a) Schematic of the Snai1ΔHSC mouse generation strategy and 4-week CCl4-induced fibrotic mouse model. (b) SNAI1 protein and mRNA levels of primary HSCs were isolated from Snai1flox/flox and Snai1ΔHSC mouse liver. Snai1flox/flox and Snai1ΔHSC mice were injected with CCl4 twice a week for 4 weeks (n = 6 for Snai1flox/flox mice and n = 7 for Snai1ΔHSC mice). (c) Serum ALT and AST levels. (d) Representative images of H&E, Masson staining, α-SMA immunohistochemistry staining, and Sirius red staining. Scale bar: 50 μm. (e) Quantification of positive areas in (d). (f) Immunoblotting and quantification of α-SMA. (g) The mRNA levels of collagen-associated genes and pro-inflammatory genes. (h) Representative images and (i) positive signal quantification of Ki67 and p-H3 staining in liver sections. Scale bar: 50 μm. Data are presented as mean ± SEM. P < 0.05 indicates a significant difference. All data were analyzed by a two-tailed Student’s t-test.
-
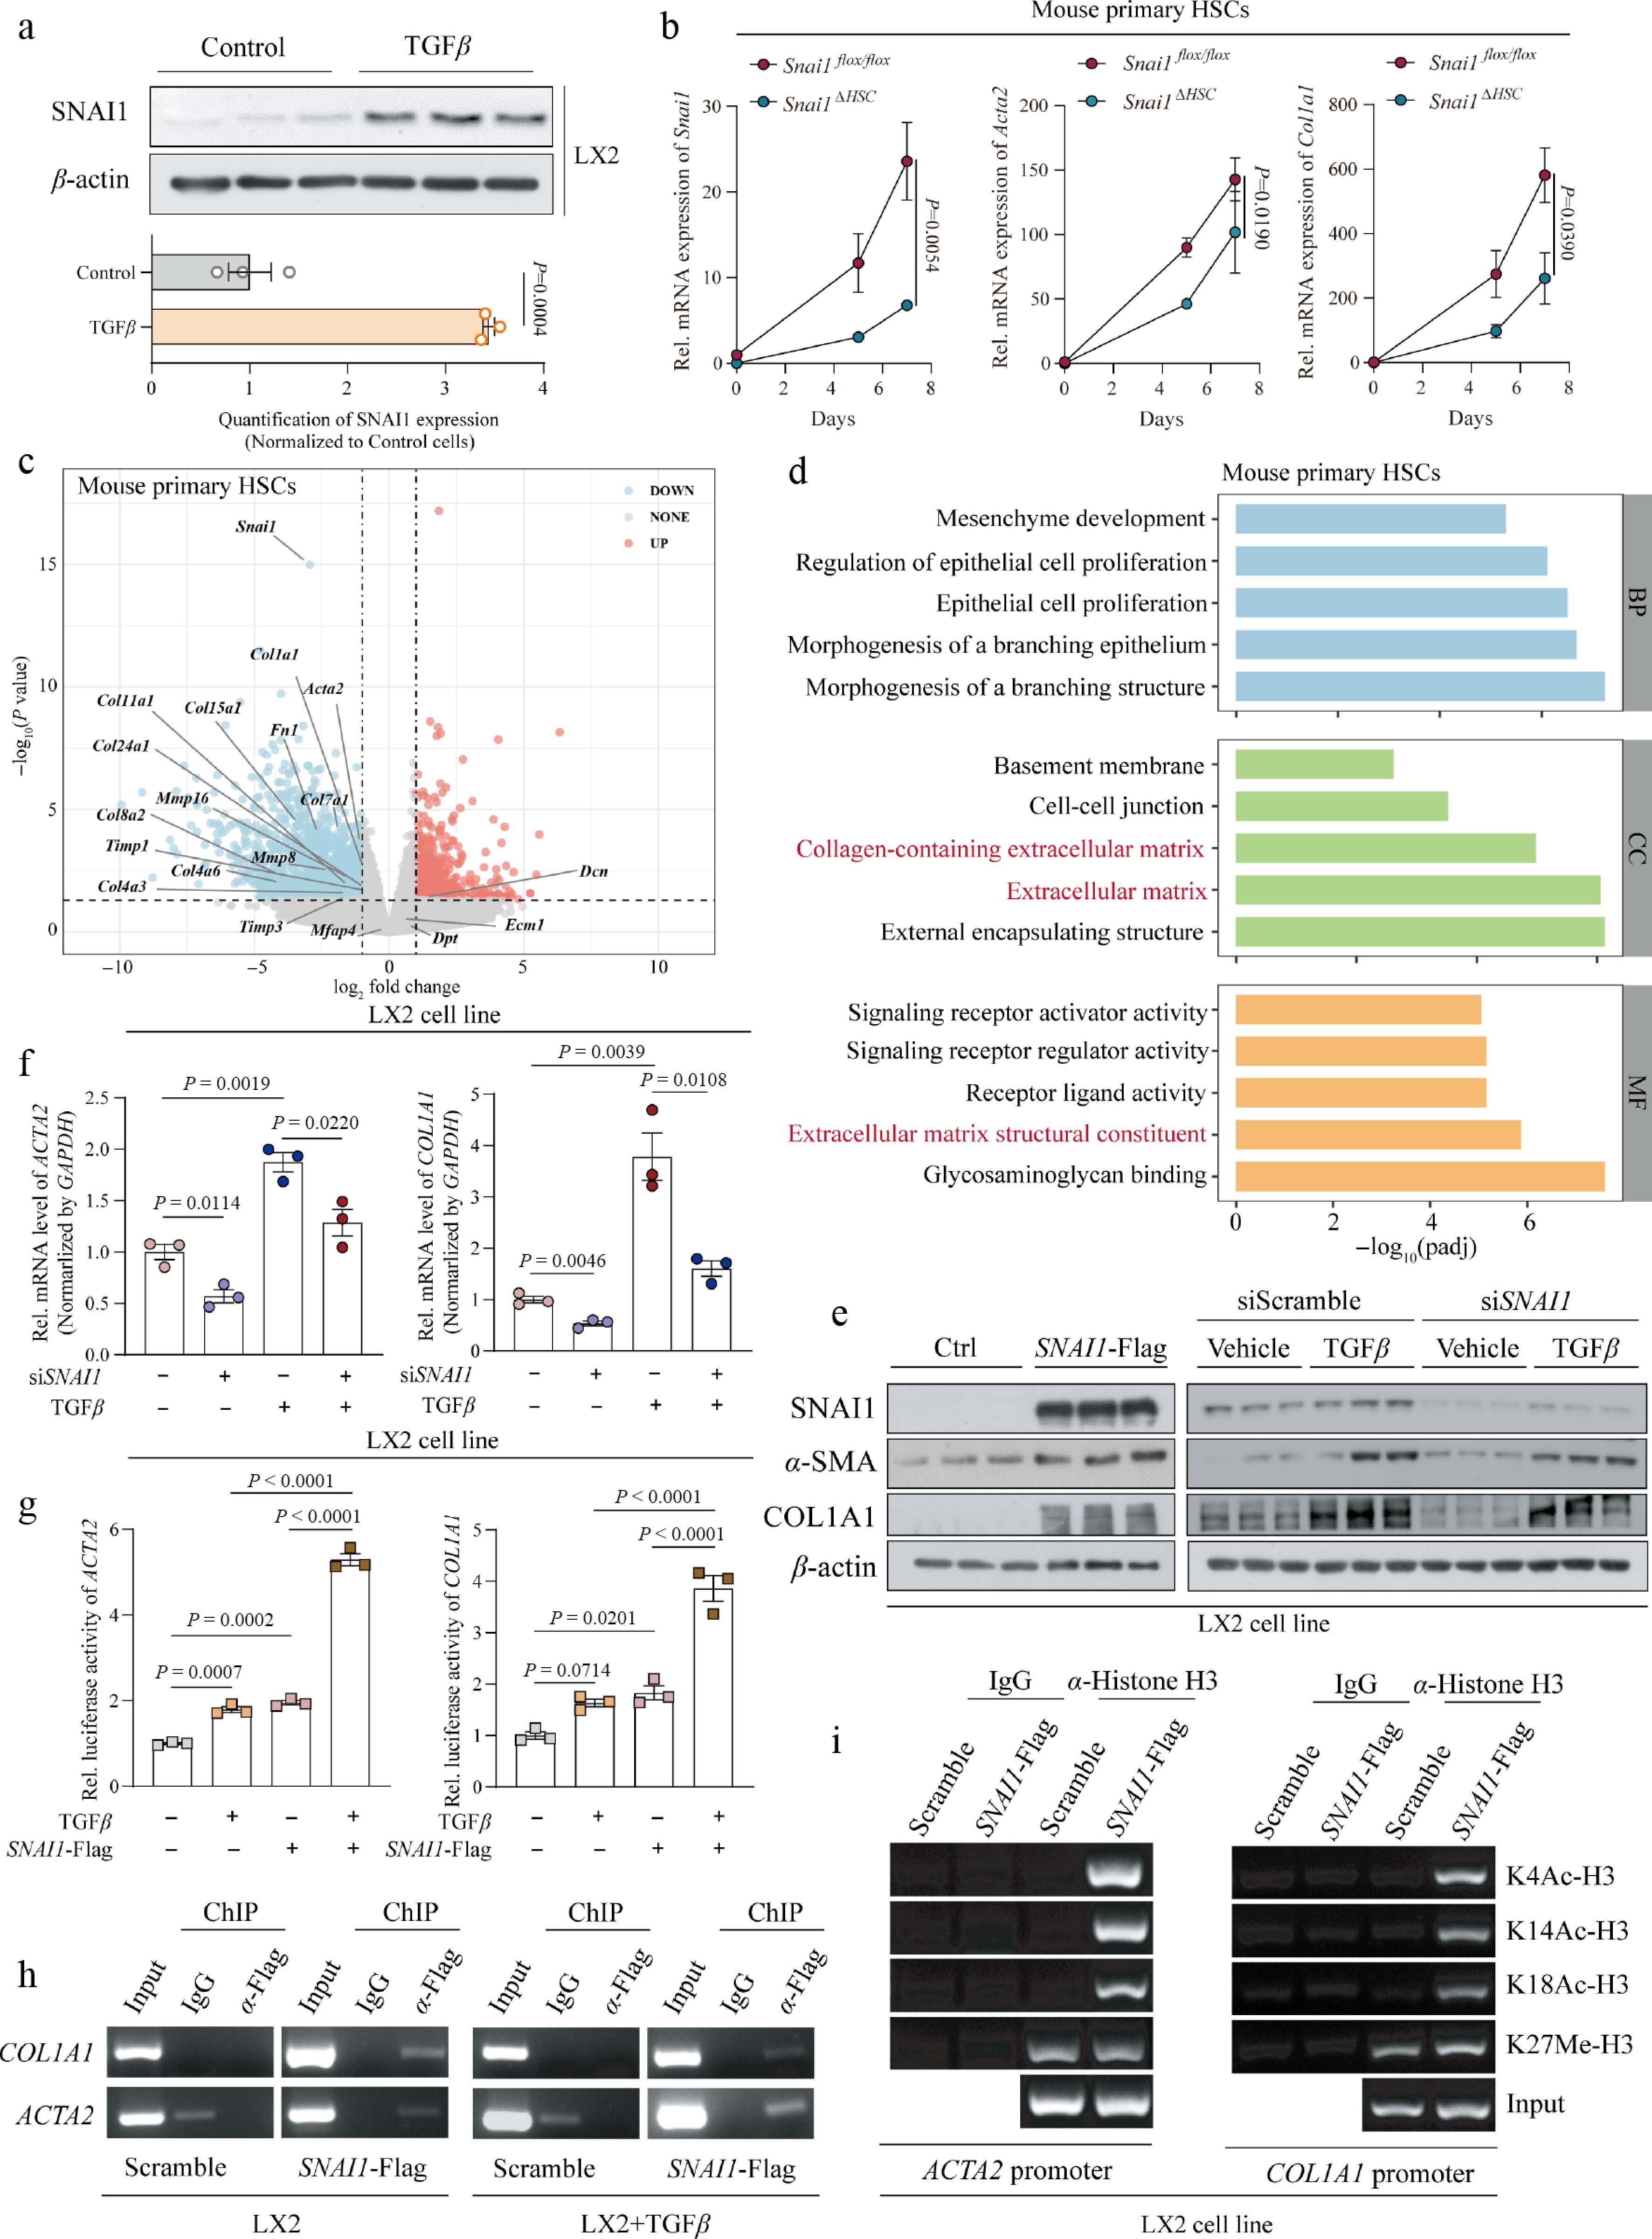
Figure 3.
Snai1 enhanced the activation of HSCs. (a) Protein level of SNAI1 in LX2 cells treated with 10 μmol·L−1 TGF-β for 48 h. (b) mRNA levels of Snai1, Acta2, and Col1a1 in primary HSCs from Snai1flox/flox and Snai1ΔHSC mice cultured for 0, 5, and 7 d. The P value showed a significant difference by calculating the area under the curve (AUC). (c) Volcano plots of differentially expressed genes (log2FC > 1 and P value < 0.05) between activated primary HSCs isolated from Snai1flox/flox and Snai1ΔHSC mice. (d) Downregulated pathways analyzed by Gene Ontology (GO) pathway enrichment analysis. (e) The protein levels of SNAI1, α-SMA, and COL1A1 in LX2 cells transfected with an empty vector and SNAI1-Flag plasmid (left) or siScramble and siSNAI1, treated with or without TGF-β (right). (f) Gene expression of Acta2 and Col1a1 in LX2 cells. Cells were transfected with siRNA (siScramble and siSNAI1) and treated with 10 μmol·L−1 TGF-β for 48 h. (g) Transcriptional activity of Acta2 and Col1a1 in LX2 cells overexpressing SNAI1 and treated with TGF-β. (h) Representative images of ChIP-PCR analysis confirming the loading of SNAI1 on the promoters of ACTA2 and COL1A1 in LX2 cells. (i) Representative images of ChIP-PCR analysis to determine the recruitment of H3K4Ac, H3K14Ac, and H3K18Ac to the ACTA2 and COL1A1 promoters in LX2 cells with SNAI1 overexpressed. Data are presented as mean ± SEM. P < 0.05 indicates a significant difference. All data were analyzed by a two-tailed Student’s t-test, and data in (g) were analyzed by one-way ANOVA with the Newman–Keuls multiple comparison test.
-
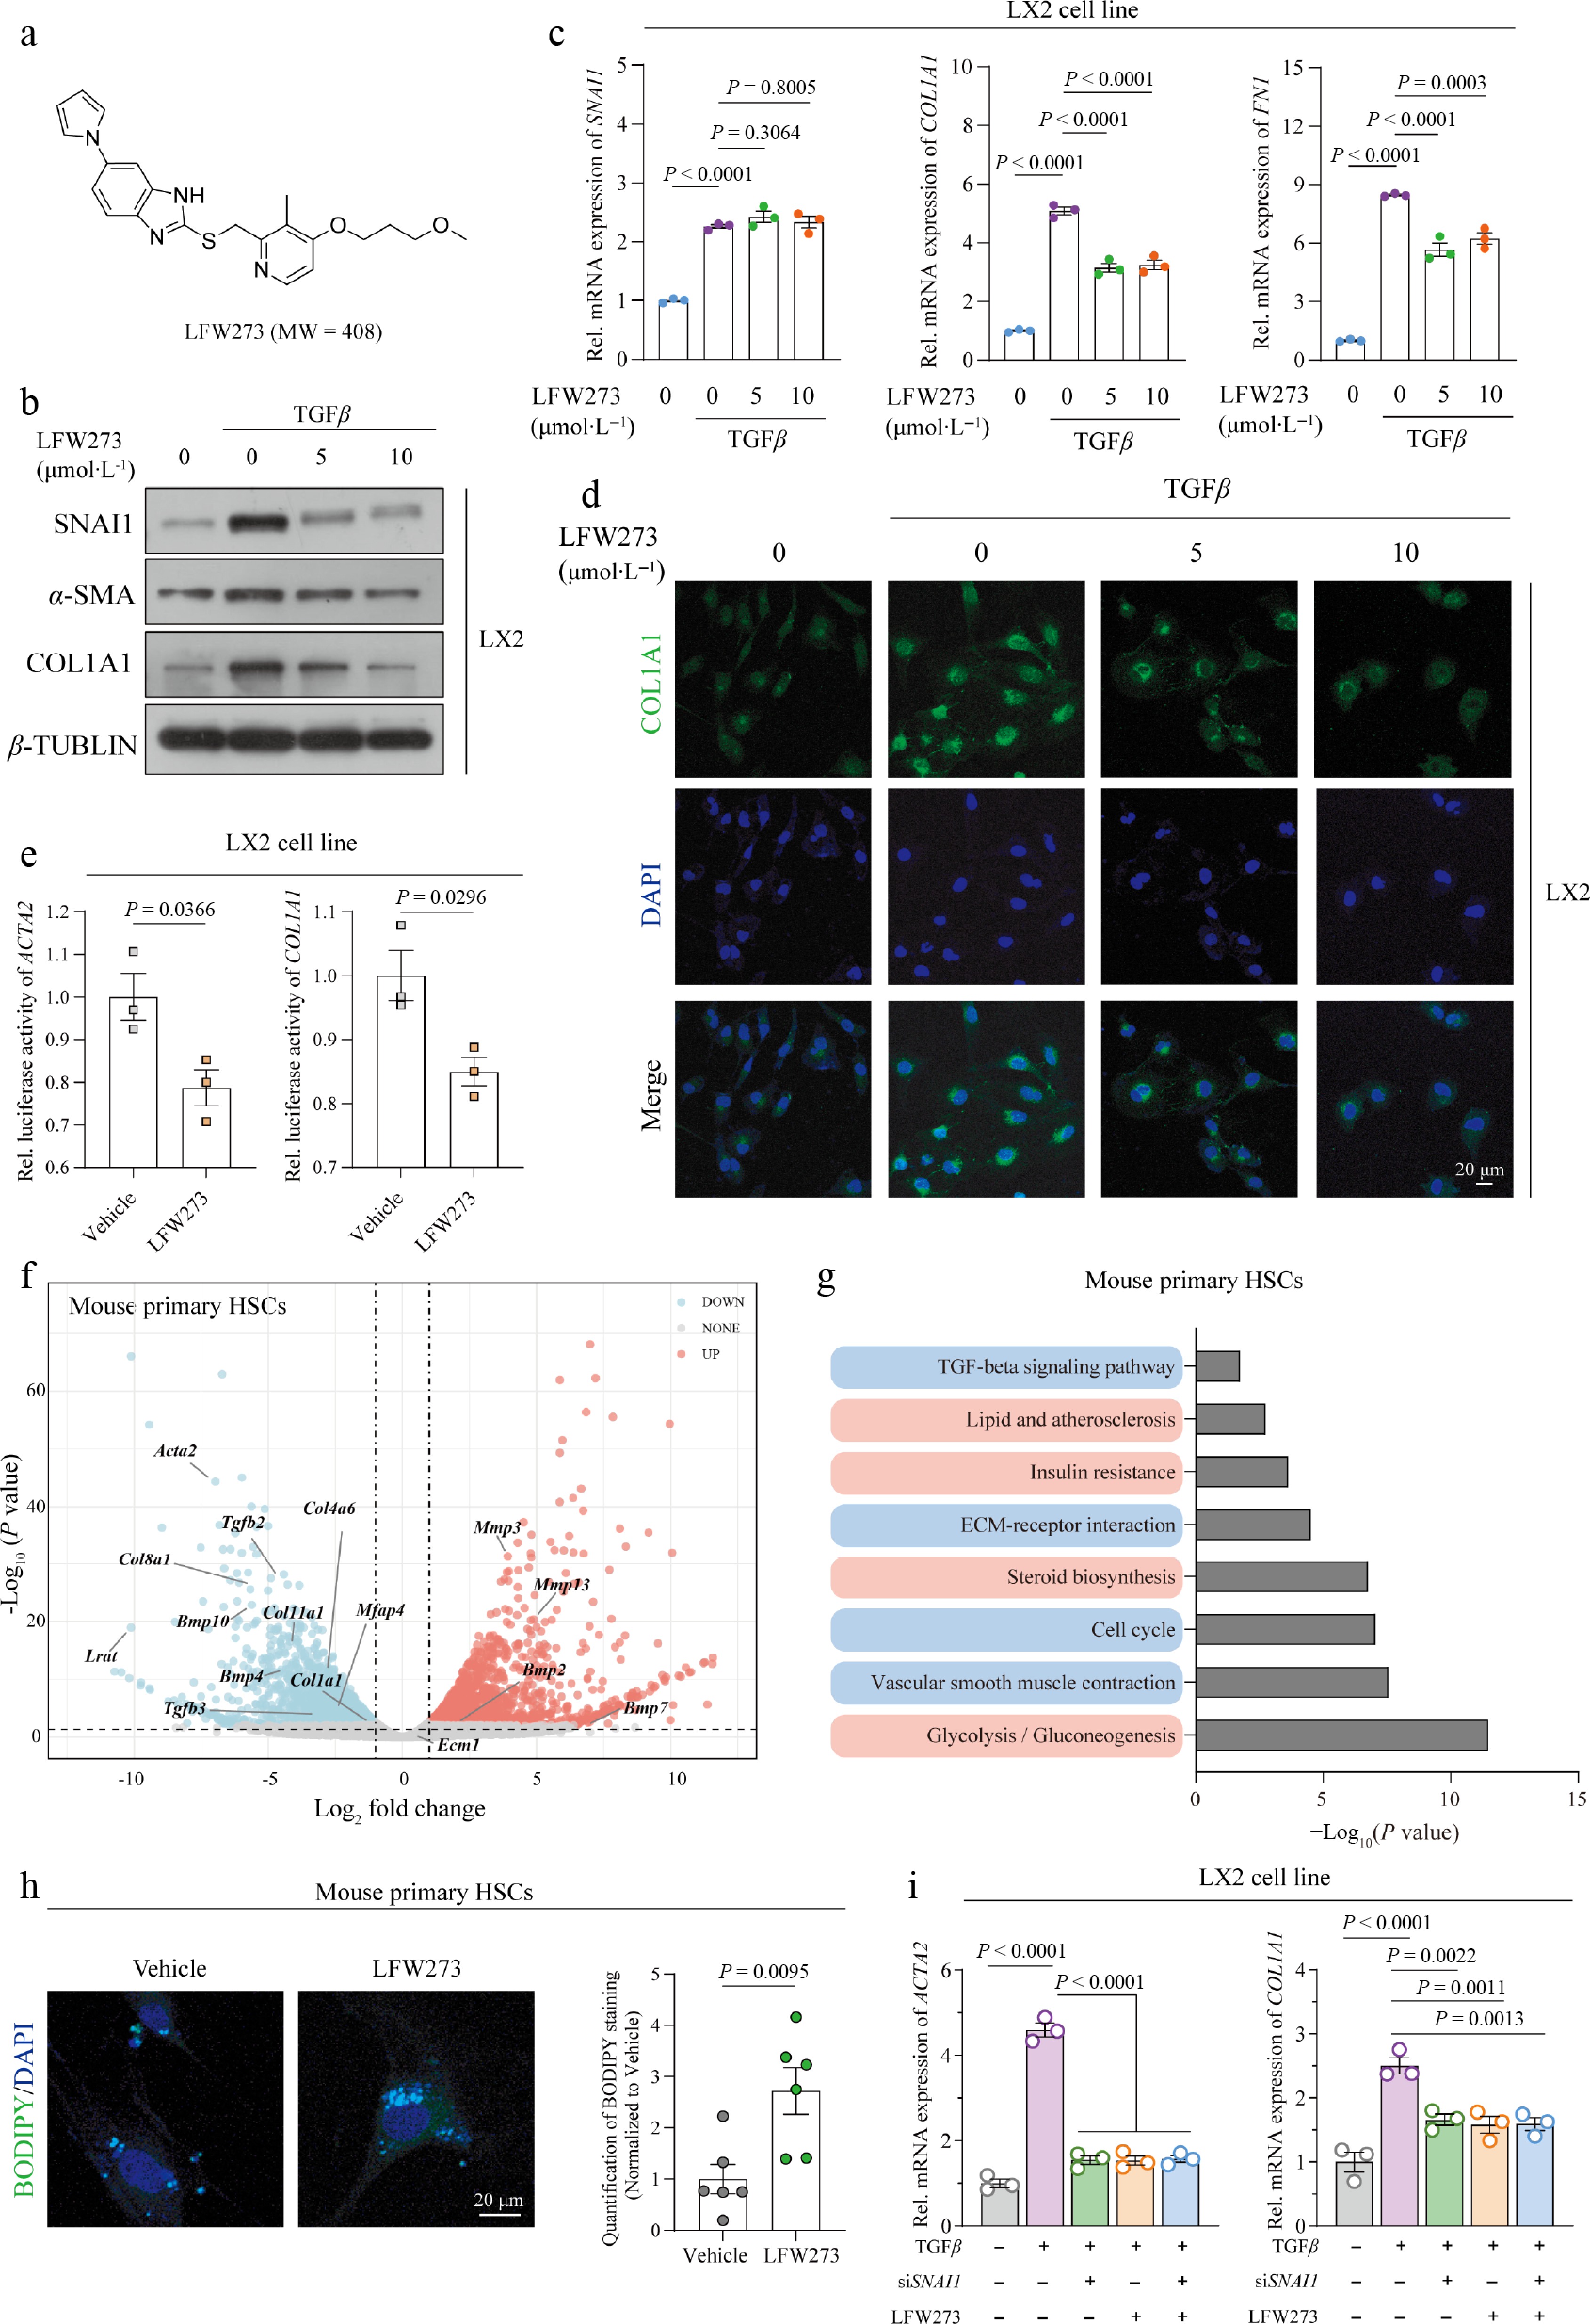
Figure 4.
LFW273, a SNAI1-specific inhibitor, suppressed the activation of HSCs. (a) The construction and molecular weight of LFW273. LX2 cells were treated with 10 μmol·L−1 TGF-β for 12 h, followed by LFW273 at 5 or 10 μmol·L−1 for 48 h. (b) Protein levels of SNAI1, α-SMA (ACTA2) and COL1A1. (c) mRNA expression of SNAI1, COL1A1, and FN1. (d) Immunofluorescent staining with anti-COL1A1 antibody. Scale bar: 20 μm. (e) Transcriptional activity of ACTA2 and COL1A1 in LX2 cells treated with TGF-β and 5 μmol·L−1 LFW273. Primary HSCs activated by FBS for 7 d in vitro and treated with vehicle or LFW273 for 48 h. (f) Volcano plot of differentially expressed pro-fibrotic genes (log2FC > 1 and P value < 0.05). (g) Kyoto Encyclopedia of Genes and Genomes (KEGG) pathway enrichment analysis. (h) Representative images of BODIPY staining (left) and quantification (right). Scale bar: 20 μm. (i) LX2 cells were transfected with siSNAI1 or siScramble and were treated with TGF-β (10 μmol·L−1) for 12 h, followed by 10 μmol·L−1 LFW273 for 48 h. mRNA level of ACTA2 and COL1A1. Data are presented as mean ± SEM. P < 0.05 indicates a significant difference. All data were analyzed by two-tailed Student’s t-test or one-way ANOVA with Dunnett's multiple comparisons test.
-
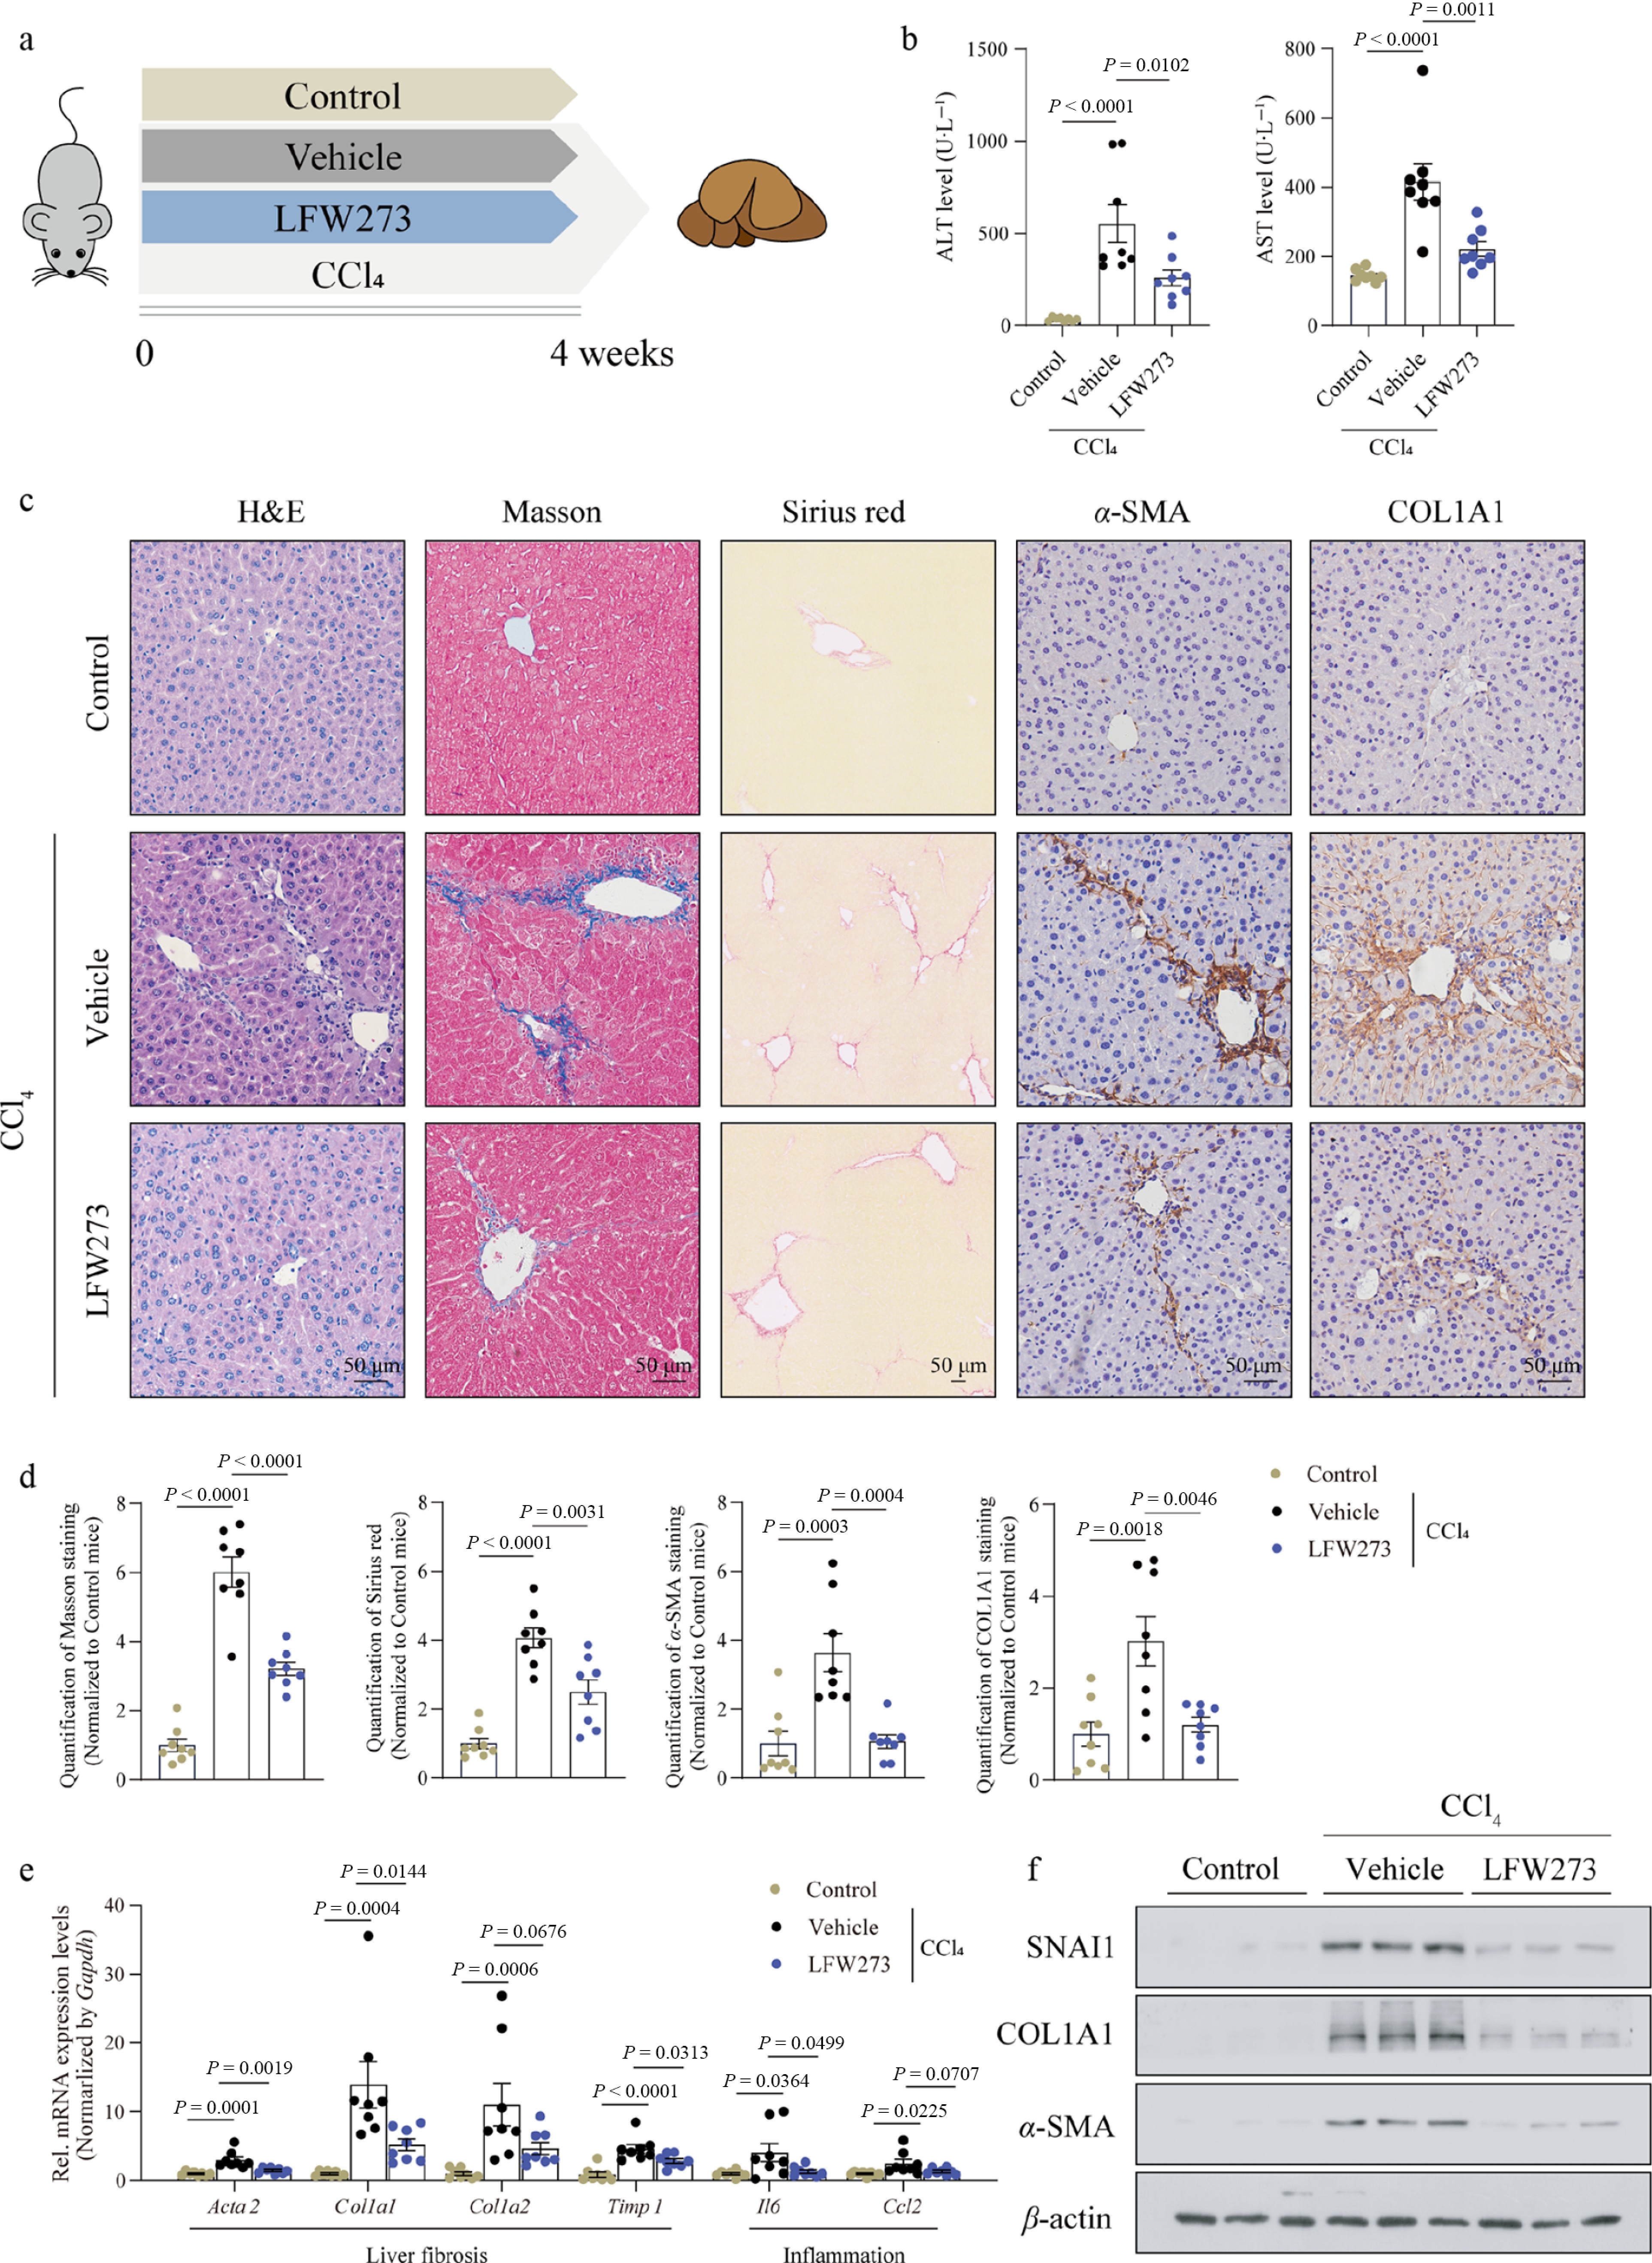
Figure 5.
Pharmacological inhibition of SNAI1 by LFW273 prevented CCl4-induced liver fibrosis in mice. Mice were injected with CCl4 and administered LFW273 for 4 weeks (n = 8 per group). (a) Schematic of the mouse model. (b) Serum ALT and AST. (c) Representative images of H&E, Masson, Sirius red, α-SMA and COL1A1 immunohistochemistry staining. Scale bar: 50 μm. (d) Quantification of positive staining areas in (c). (e) Gene expression of Acta2, Col1a1, Col1a2, Timp1, Il6, and Ccl2. (f) Protein levels of SNAI1, COL1A1, and α-SMA in liver tissues. Data are presented as mean ± SEM. p < 0.05 indicates a significant difference. All data were analyzed by one-way ANOVA with Dunnett's multiple comparisons test.
-
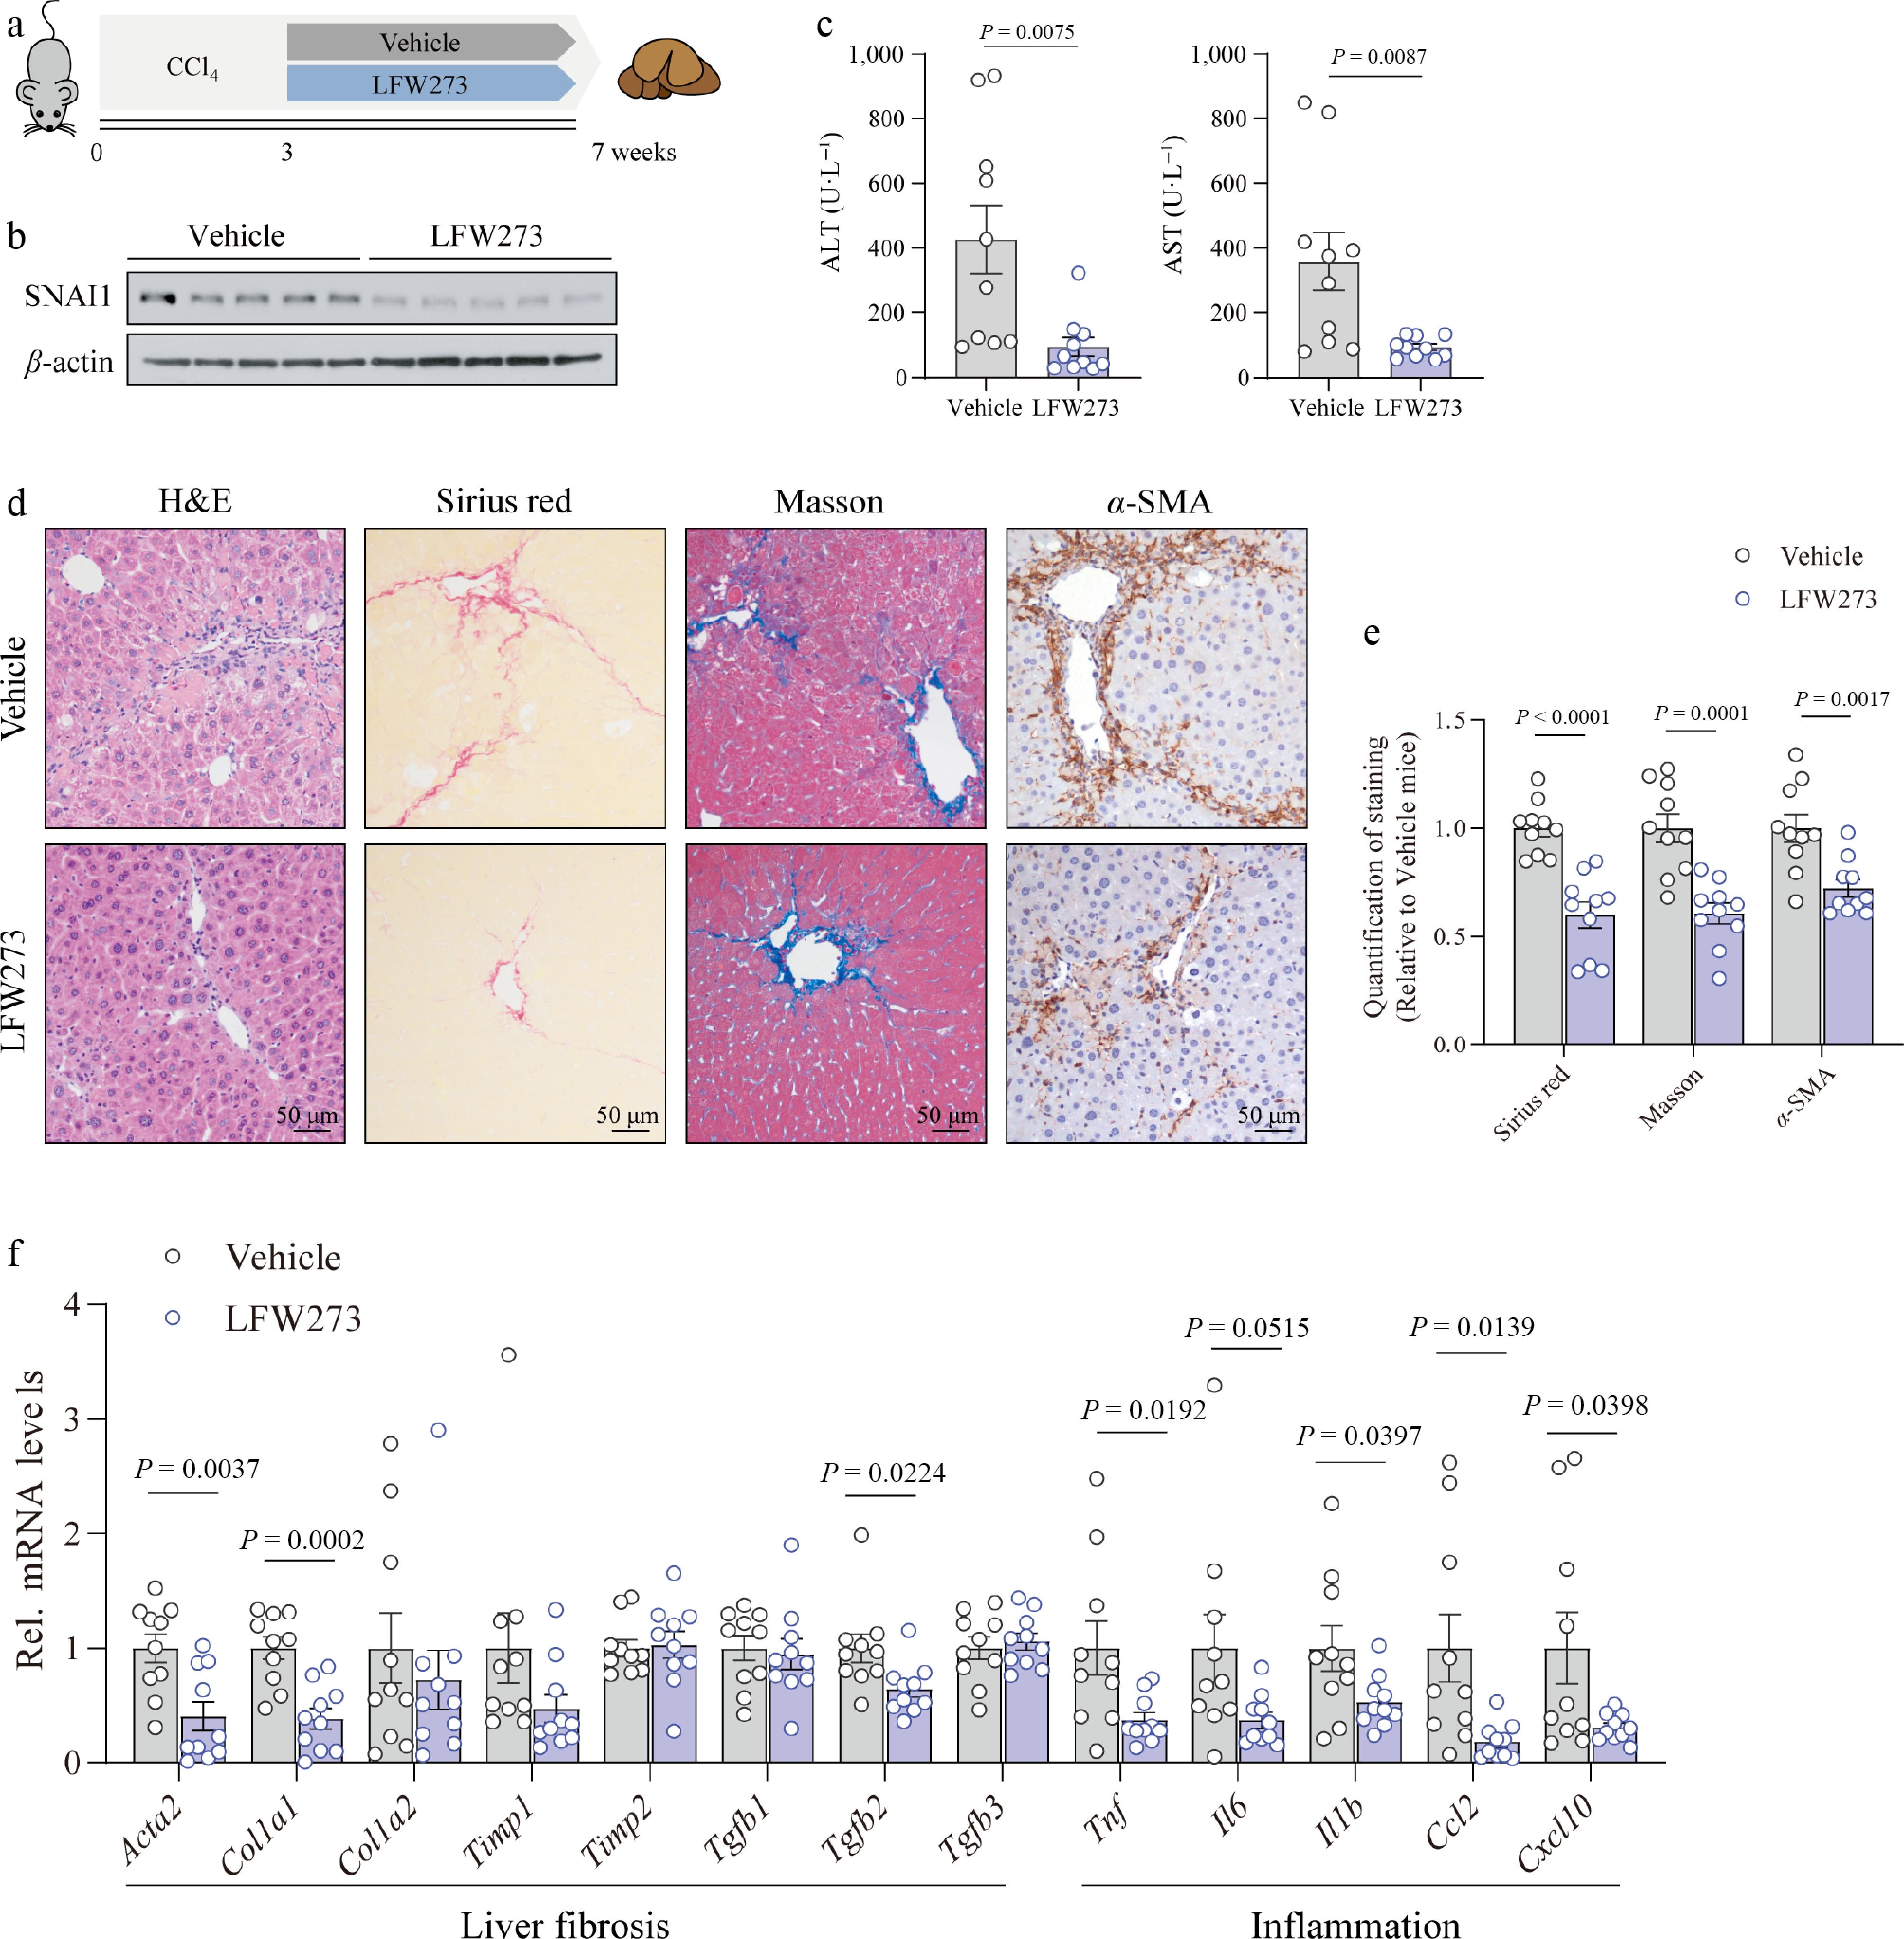
Figure 6.
LFW273 alleviated the development of liver fibrosis in mice pre-treated with CCl4. Mice were injected with CCl4 for 3 weeks, followed by gavage administration of LFW273 at a dose of 100 mg·kg−1 for an additional 4 weeks (n = 10 per group). (a) Schematic of the mouse model. (b) Immunoblotting of SNAI1. (c) ALT and AST levels in serum. (d) Representative images of H&E, Sirius red, Masson, and α-SMA staining. Scale bar: 50 μm. (e) Quantification of positive staining on liver sections. (f) Gene expressions of Acta2, Col1a1, Col1a2, Timp1, Timp2, Tgfb1, Tgfb2, Tgfb3, and pro-inflammatory genes including Tnf, Il6, Il1b, Ccl2, and Cxcl10 in liver tissues. Data are presented as mean ± SEM. p < 0.05 indicates a significant difference. All data were analyzed by a two-tailed Student’s t-test.
-
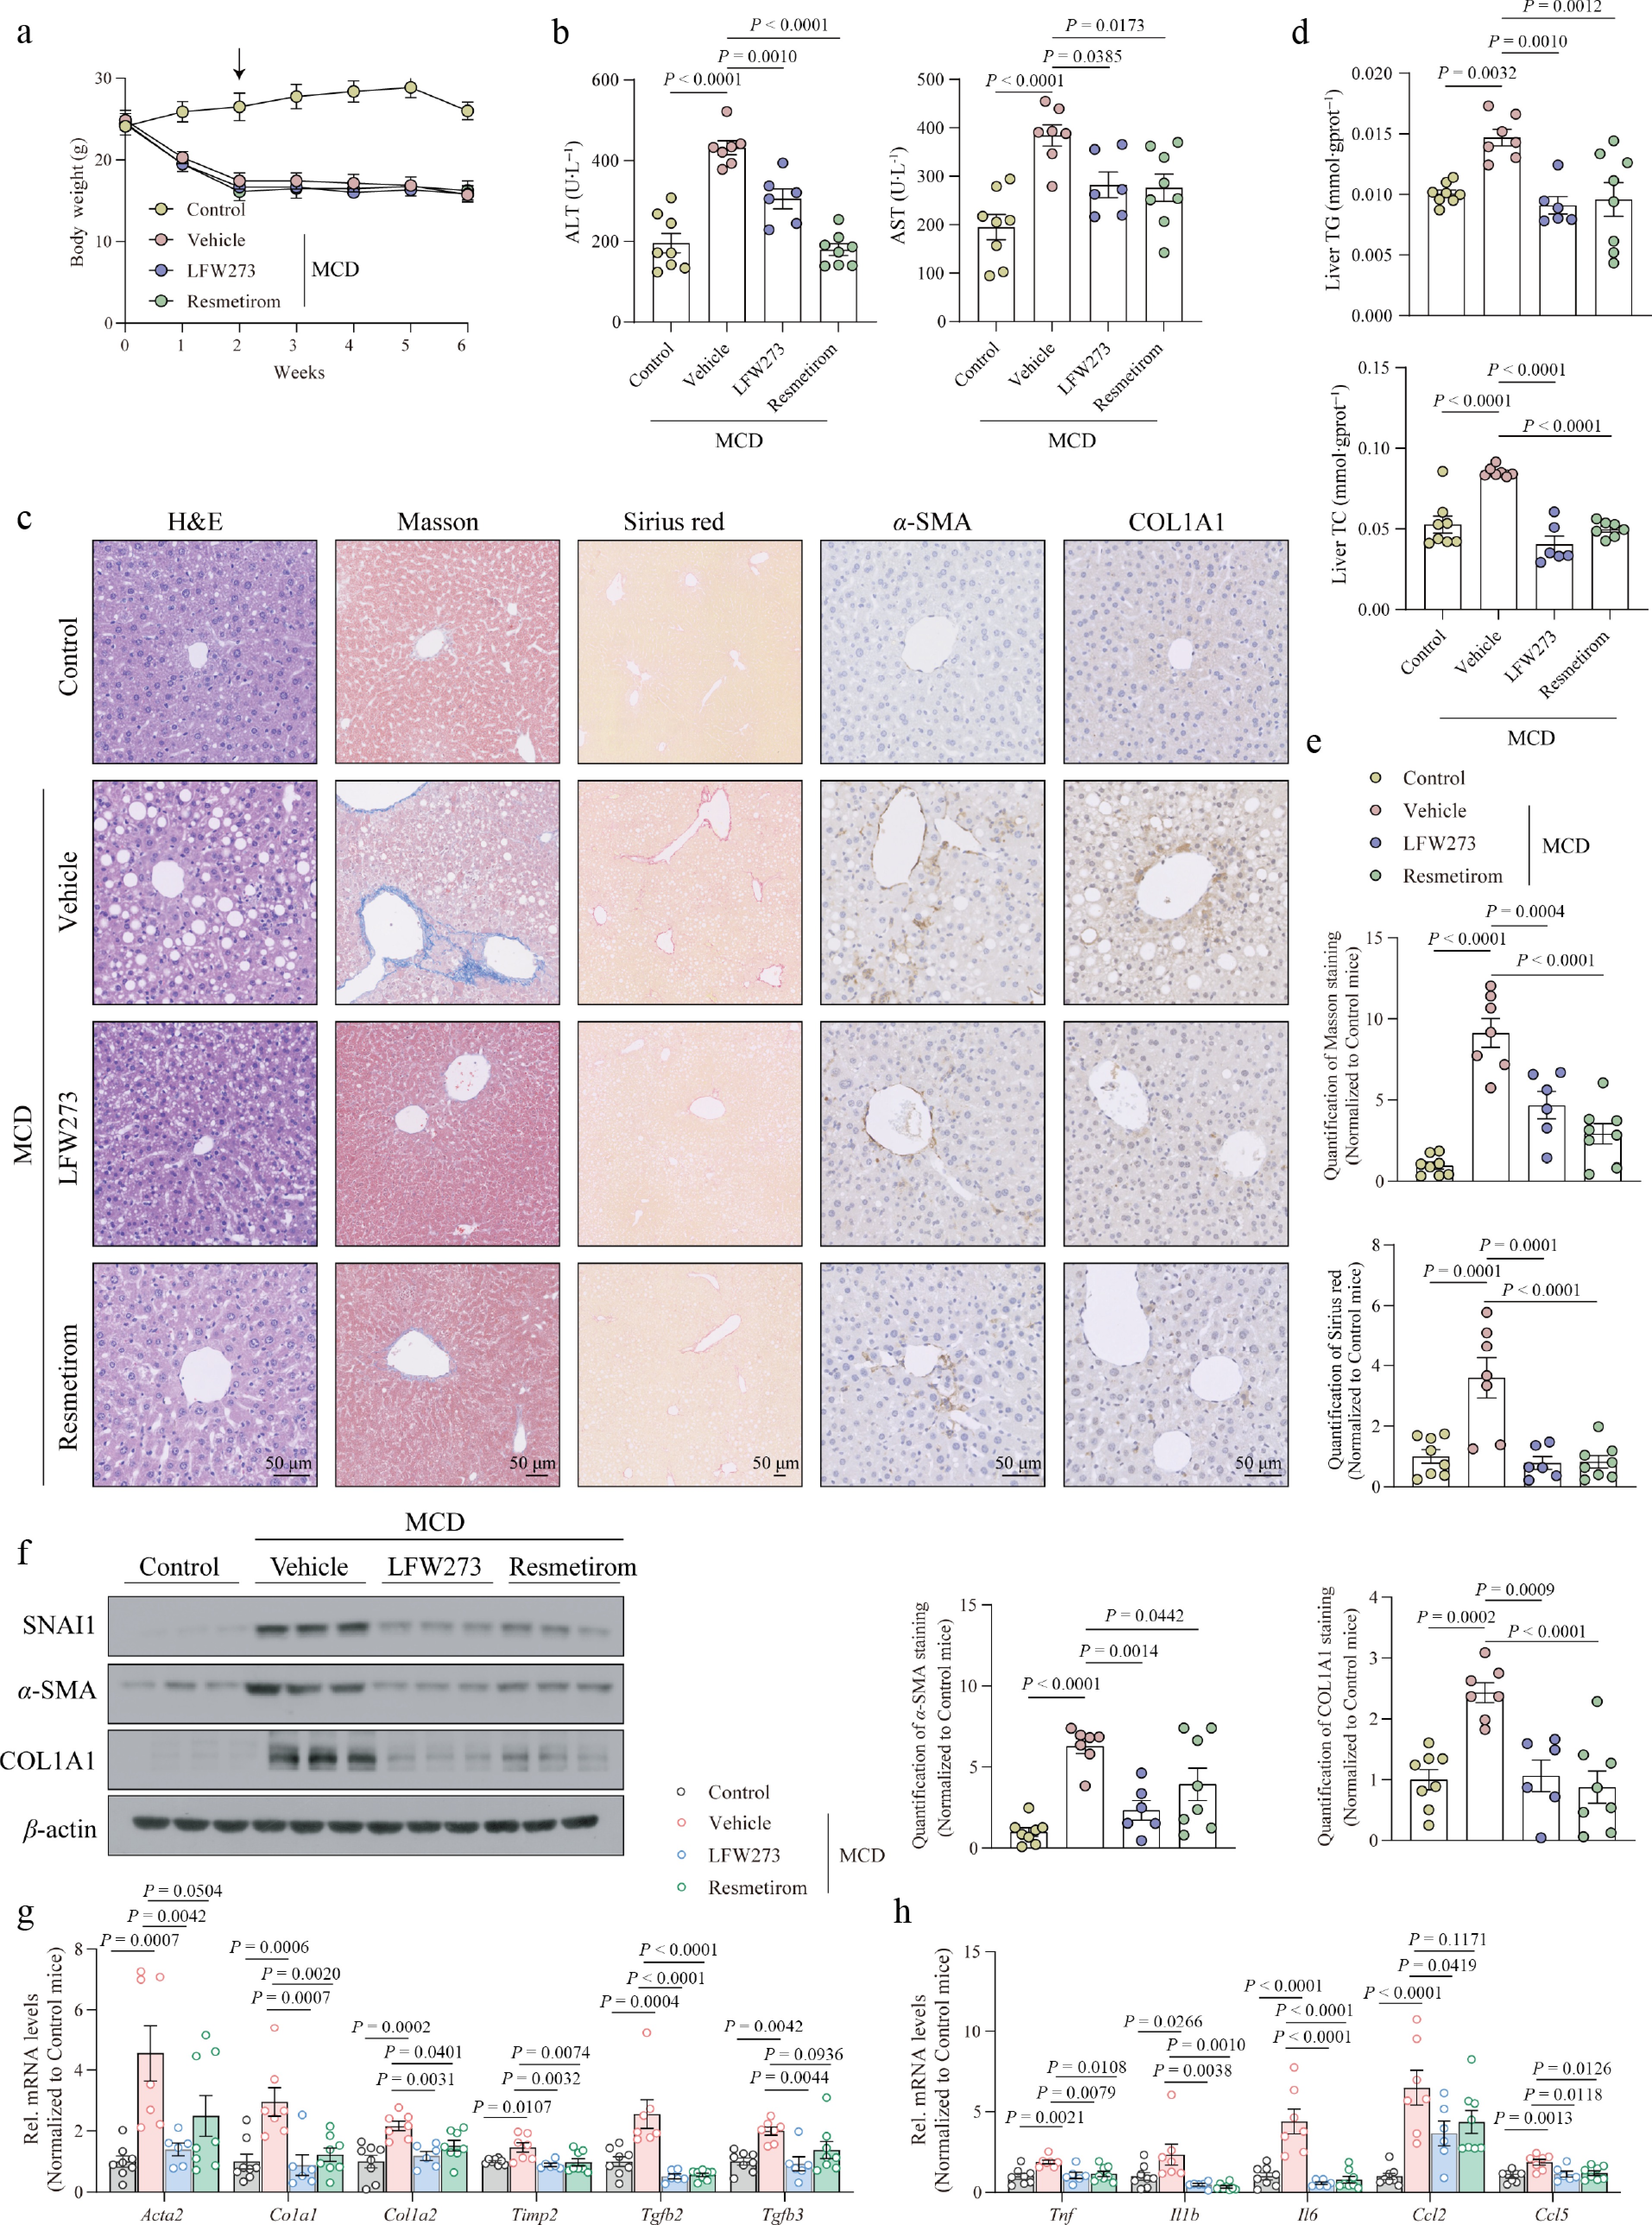
Figure 7.
MASH-accompanied liver fibrosis was abolished by LFW273 treatment. Mice were fed an MCD diet for 2 weeks, followed by LFW273 and resmetirom administration for an additional 4 weeks (n = 8 for Control; n = 7 for vehicle; n = 6 for LFW273; n = 8 for resmetirom). (a) Body weight. (b) Serum ALT and AST. (c) Representative image of H&E, Masson, Sirius red, and immunohistochemistry staining with anti-α-SMA and anti-COL1A1 antibodies. Scale bar: 50 μm. (d) Hepatic levels of TG and TC. (e) Quantification of positive areas in (c). (f) Protein levels of SNAI1, α-SMA, and COL1A1 in liver tissues. (g) Expression of genes encoding HSC activation and collagen production. (h) Expression of genes related to liver inflammation. Data are presented as mean ± SEM. P < 0.05 indicates a significant difference. All data were analyzed by ordinary one-way ANOVA with Dunnett's multiple comparisons test.
Figures
(7)
Tables
(0)