-
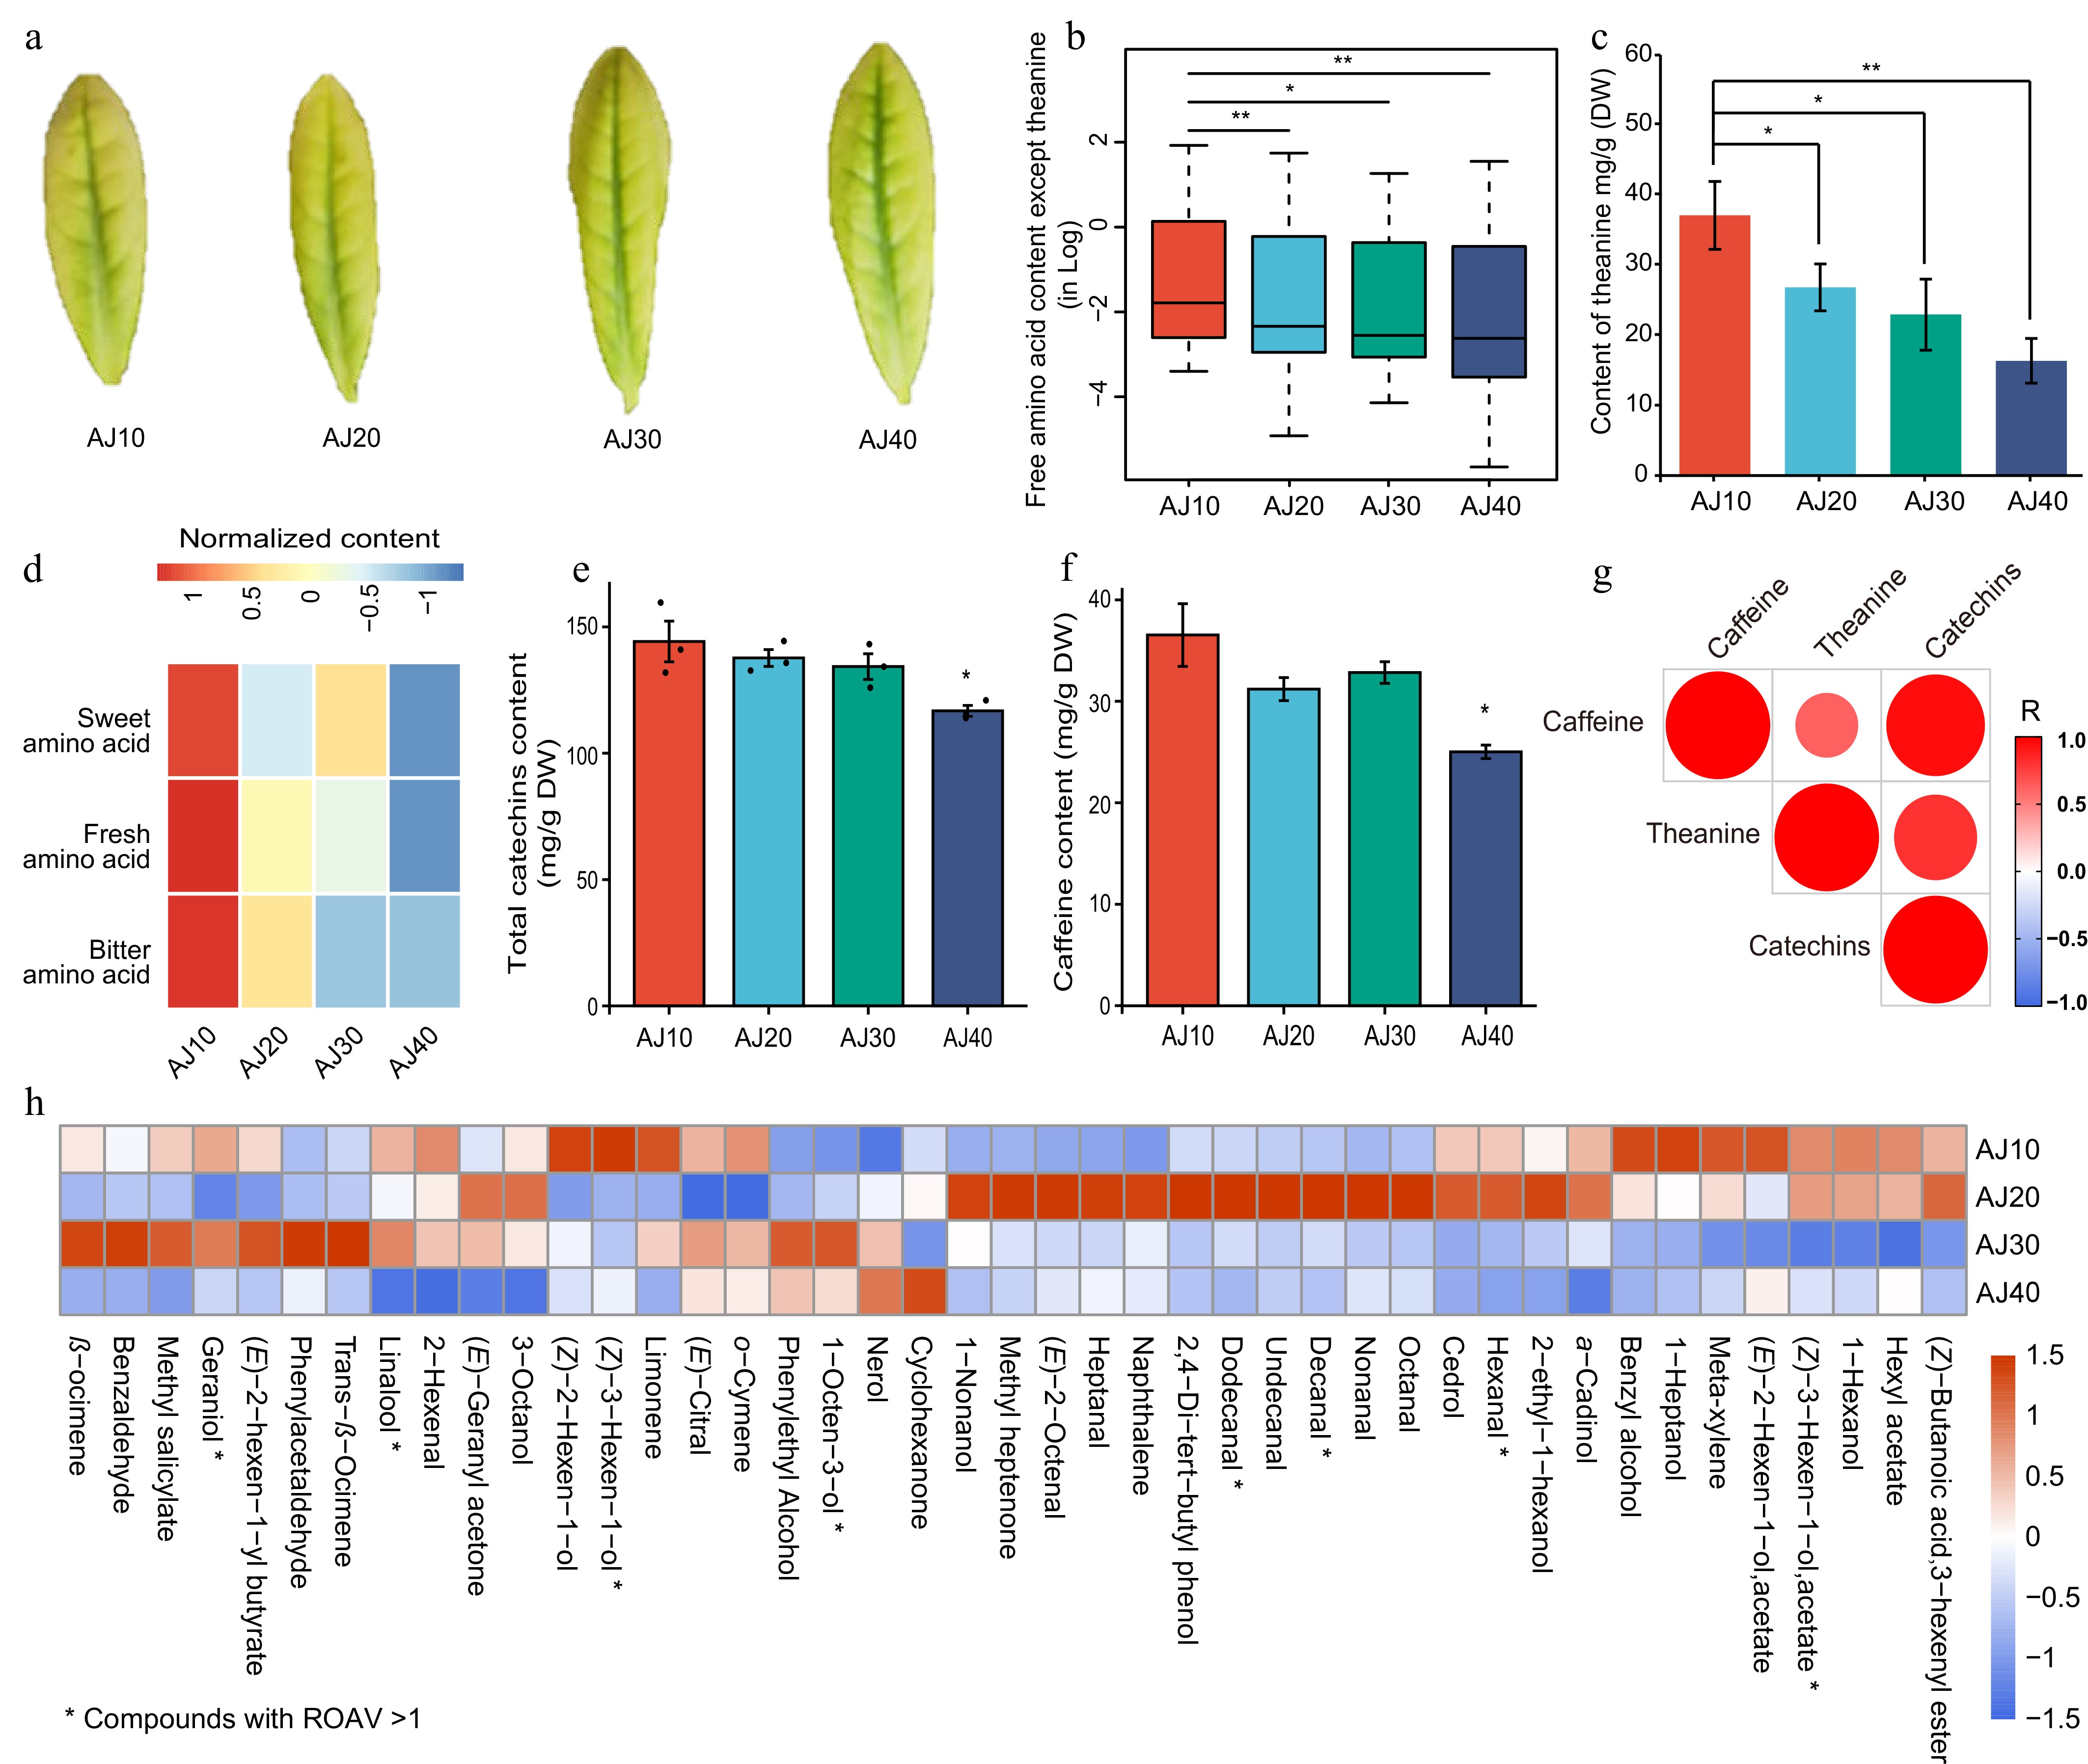
Figure 1.
The content change of tea-quality-related metabolites under long-term clonal propagation. (a) Phenotype of tender leaves of 'Baiye1' at different stages of 10 (AJ10), 20 (AJ20), 30 (AJ30), and 40 (AJ40) years. (b) The content of free amino acids in 'Baiye 1' at different cultivation ages. (c) The accumulation profile of theanine in 'Baiye 1' at different cultivation ages. (d) The accumulation profile of different types of amino acids in 'Baiye 1'. The contents of (e) total catechins, and (f) caffeine in 'Baiye 1'. (g) Correlations of catechins, theanine, and caffeine at different cultivation ages. (h) The pattern of aromatic compounds in 'Baiye 1' at different cultivation ages. AJ10–AJ40 indicated the cultivation age from 10 to 40 years. * p value < 0.05, ** p value < 0.01.
-
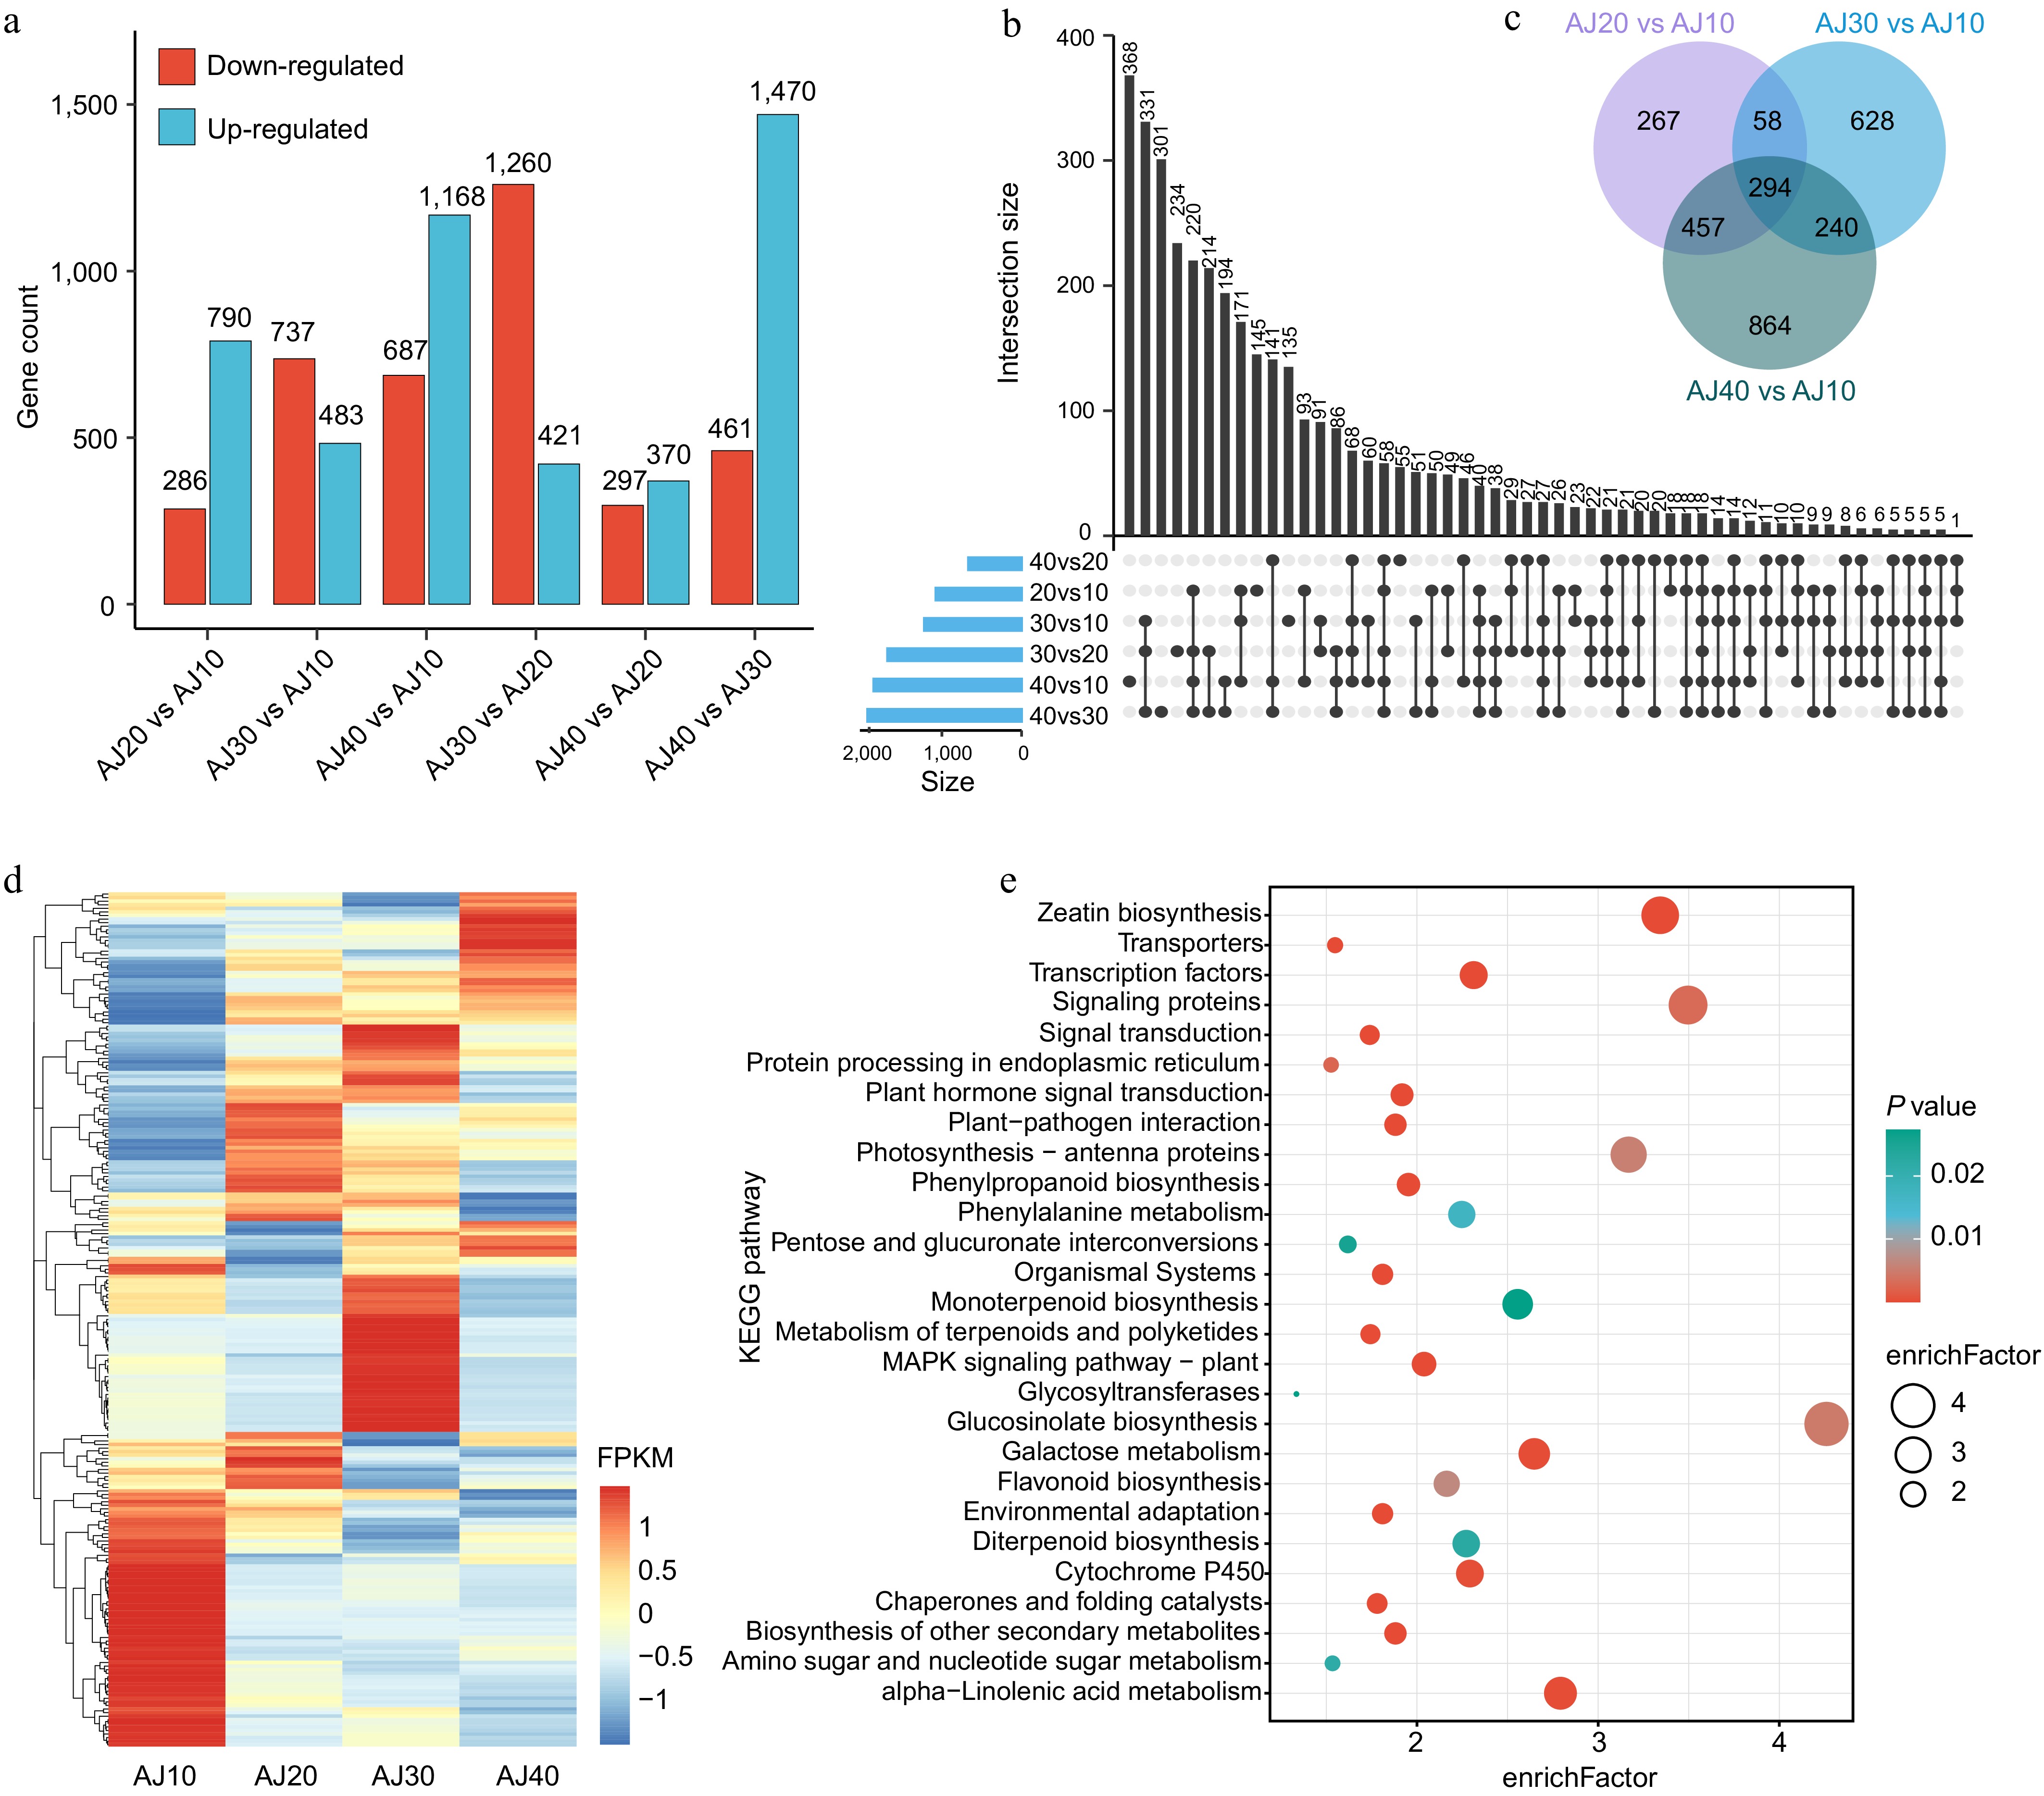
Figure 2.
Transcriptomic change patterns of 'Baiye 1' during different cultivation ages. (a) Differentially expressed gene identification among different cultivating ages from 10 to 40 years. (b), (c) Counts of differentially expressed genes between different comparisons. (d) Expression patterns of the differentially expressed genes in AJ10 to AJ40. (e) Functional gene enrichment of the differentially expressed genes. AJ10 to AJ40 indicate the cultivation age from 10 to 40 years.
-
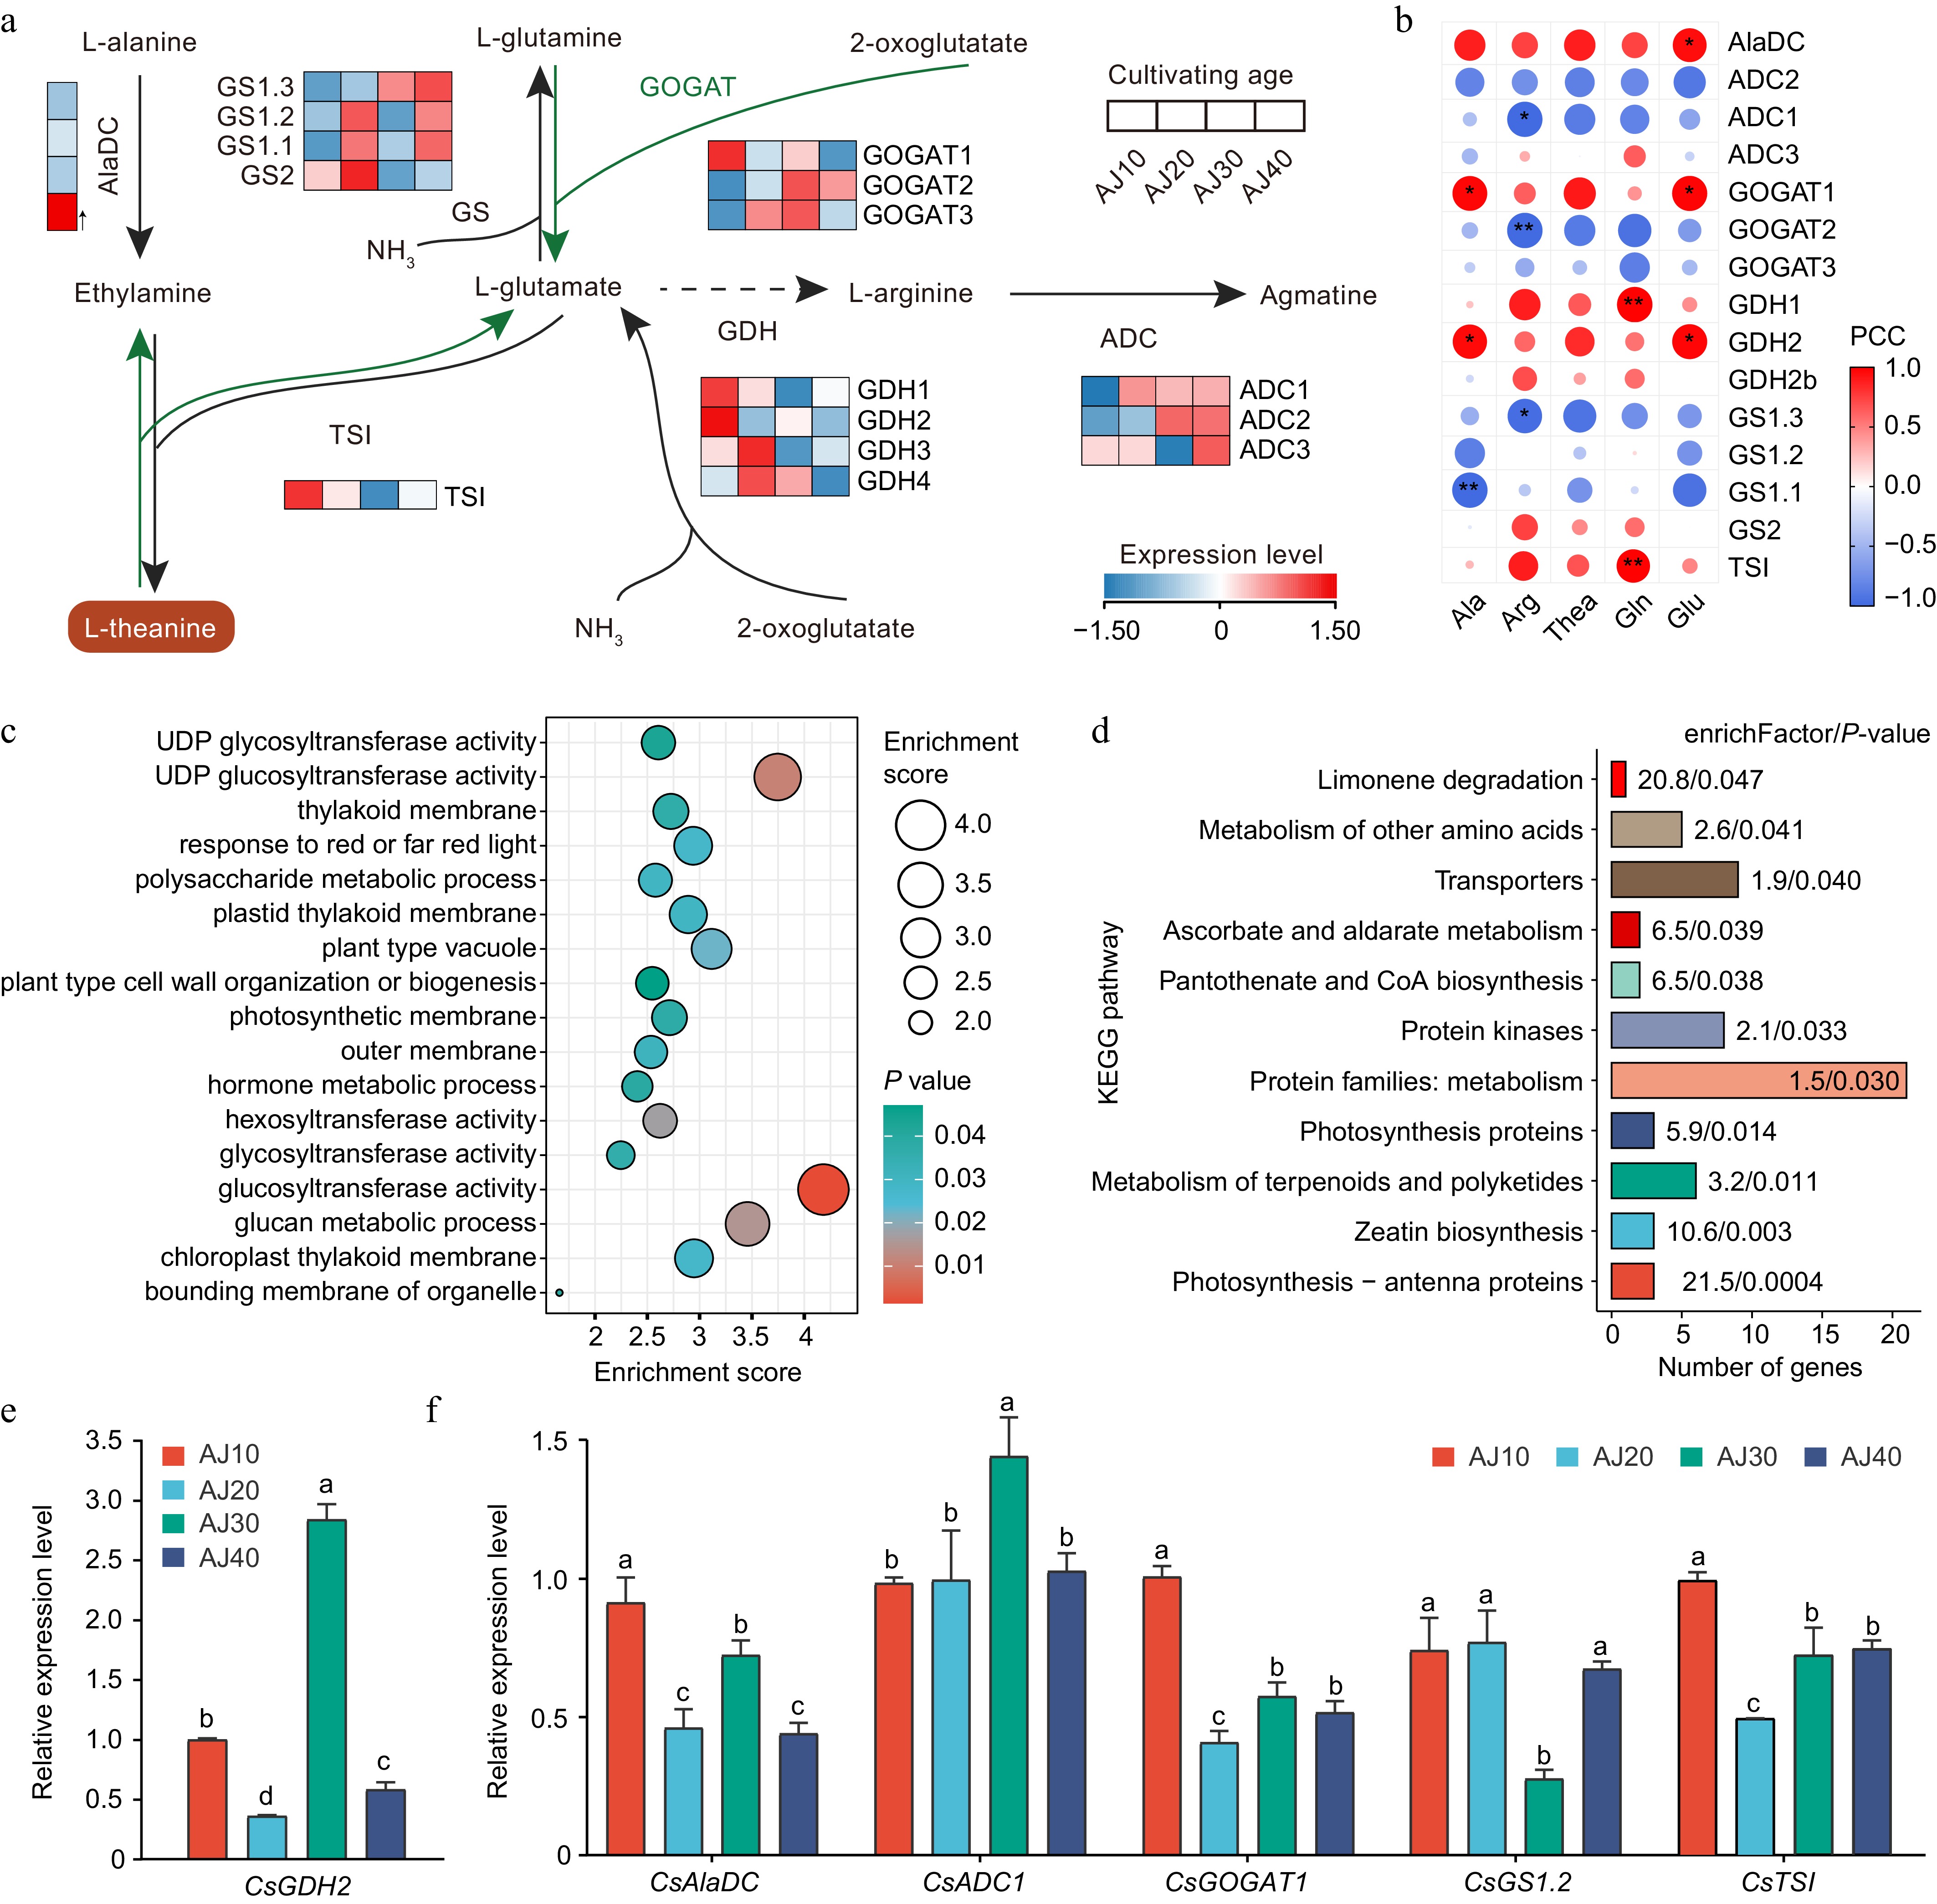
Figure 3.
Expression profile of genes in the theanine metabolism pathway in 'Baiye 1'. (a) The expressions of key genes of theanine synthesis. (b) Correlations analyses of the key genes in theanine pathways and major free amino acids in 'Baiye 1' at different cultivation ages. * p value < 0.05, ** p value < 0.01, *** p value < 0.001. (c), (d) Functional enrichment of the DEGs. (e), (f) Validation of the key gene expressions with qRT-PCR. Different lowercase letters indicate a significant difference.
-
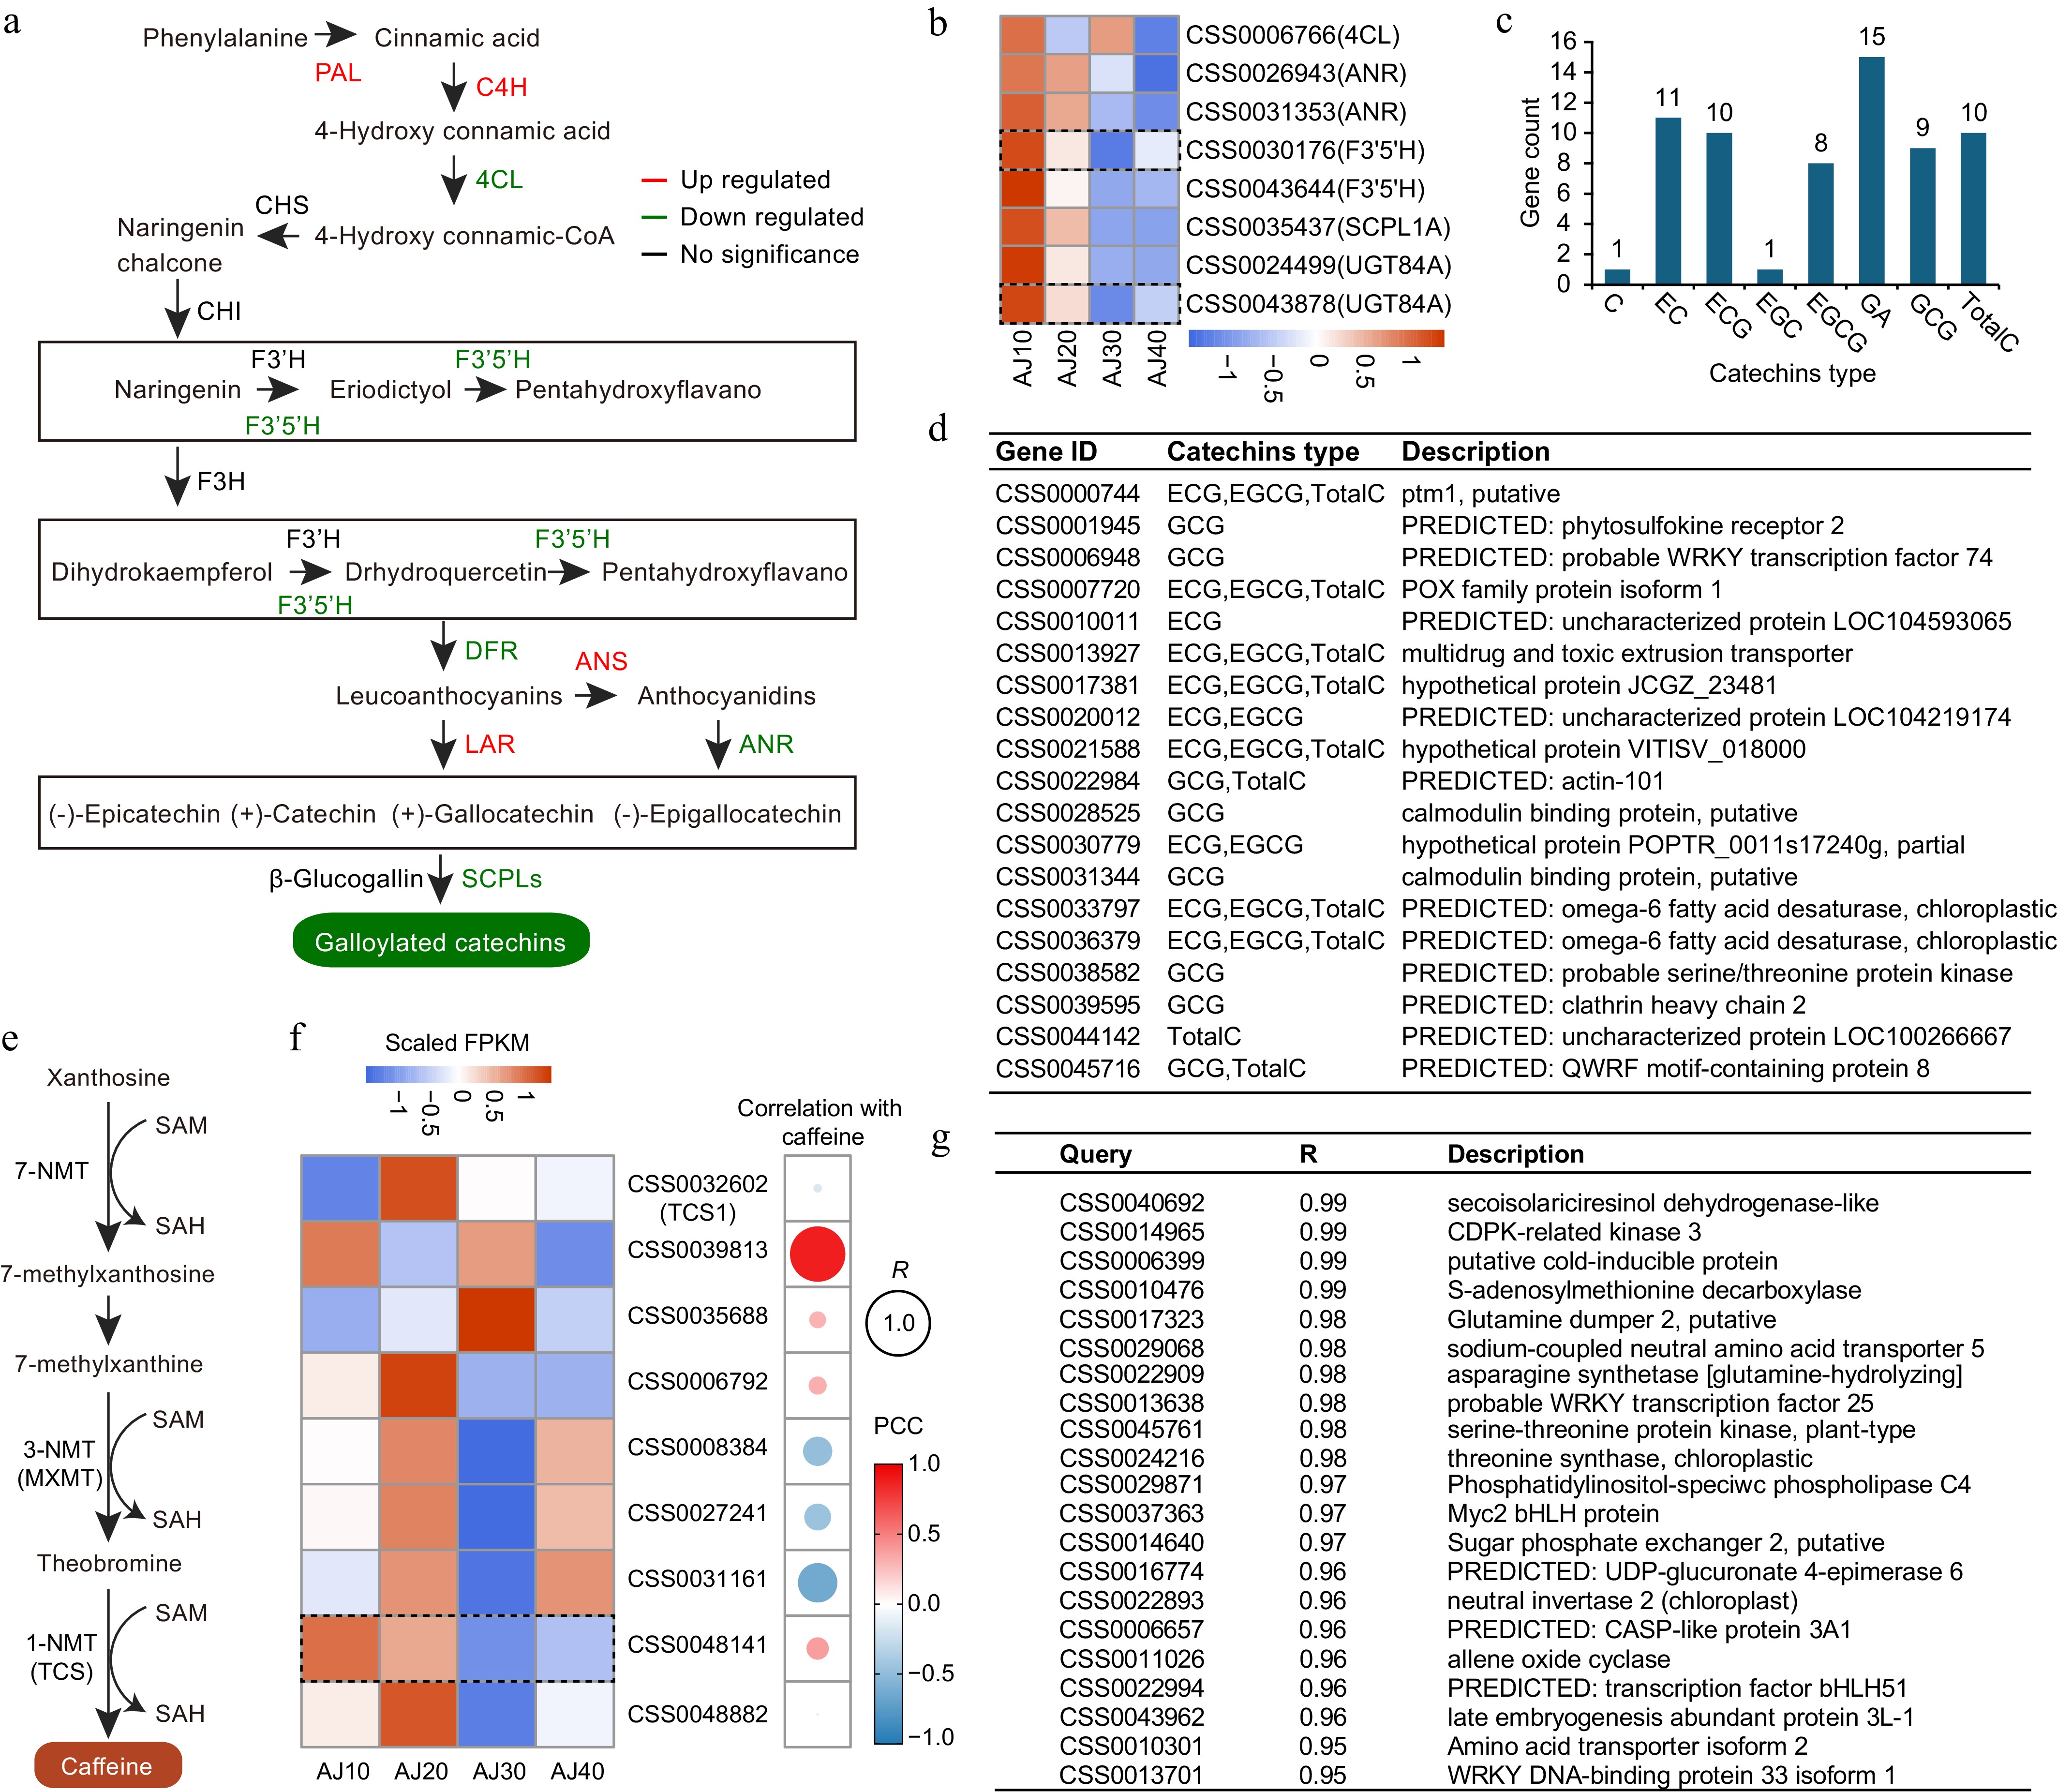
Figure 4.
Identification of candidate genes associated with the decrease of caffeine biosynthesis. (a) The pathway and the expressions of key genes of catechins synthesis. (b) Expression patterns of key genes related to catechins at different cultivation ages. (c), (d) Number of DEGs and candidate genes correlated with different types of catechins. (e), (f) The caffeine synthesis pathway and the correlations between key gene expression and caffeine content in 'Baiye 1' under different cultivation ages. (g) Candidate DEGs associated with the caffeine content change. The significance is indicated by 'a'–'c', where different letters mean significant. AJ10-AJ40 indicates the cultivation age from 10 to 40 years.
-
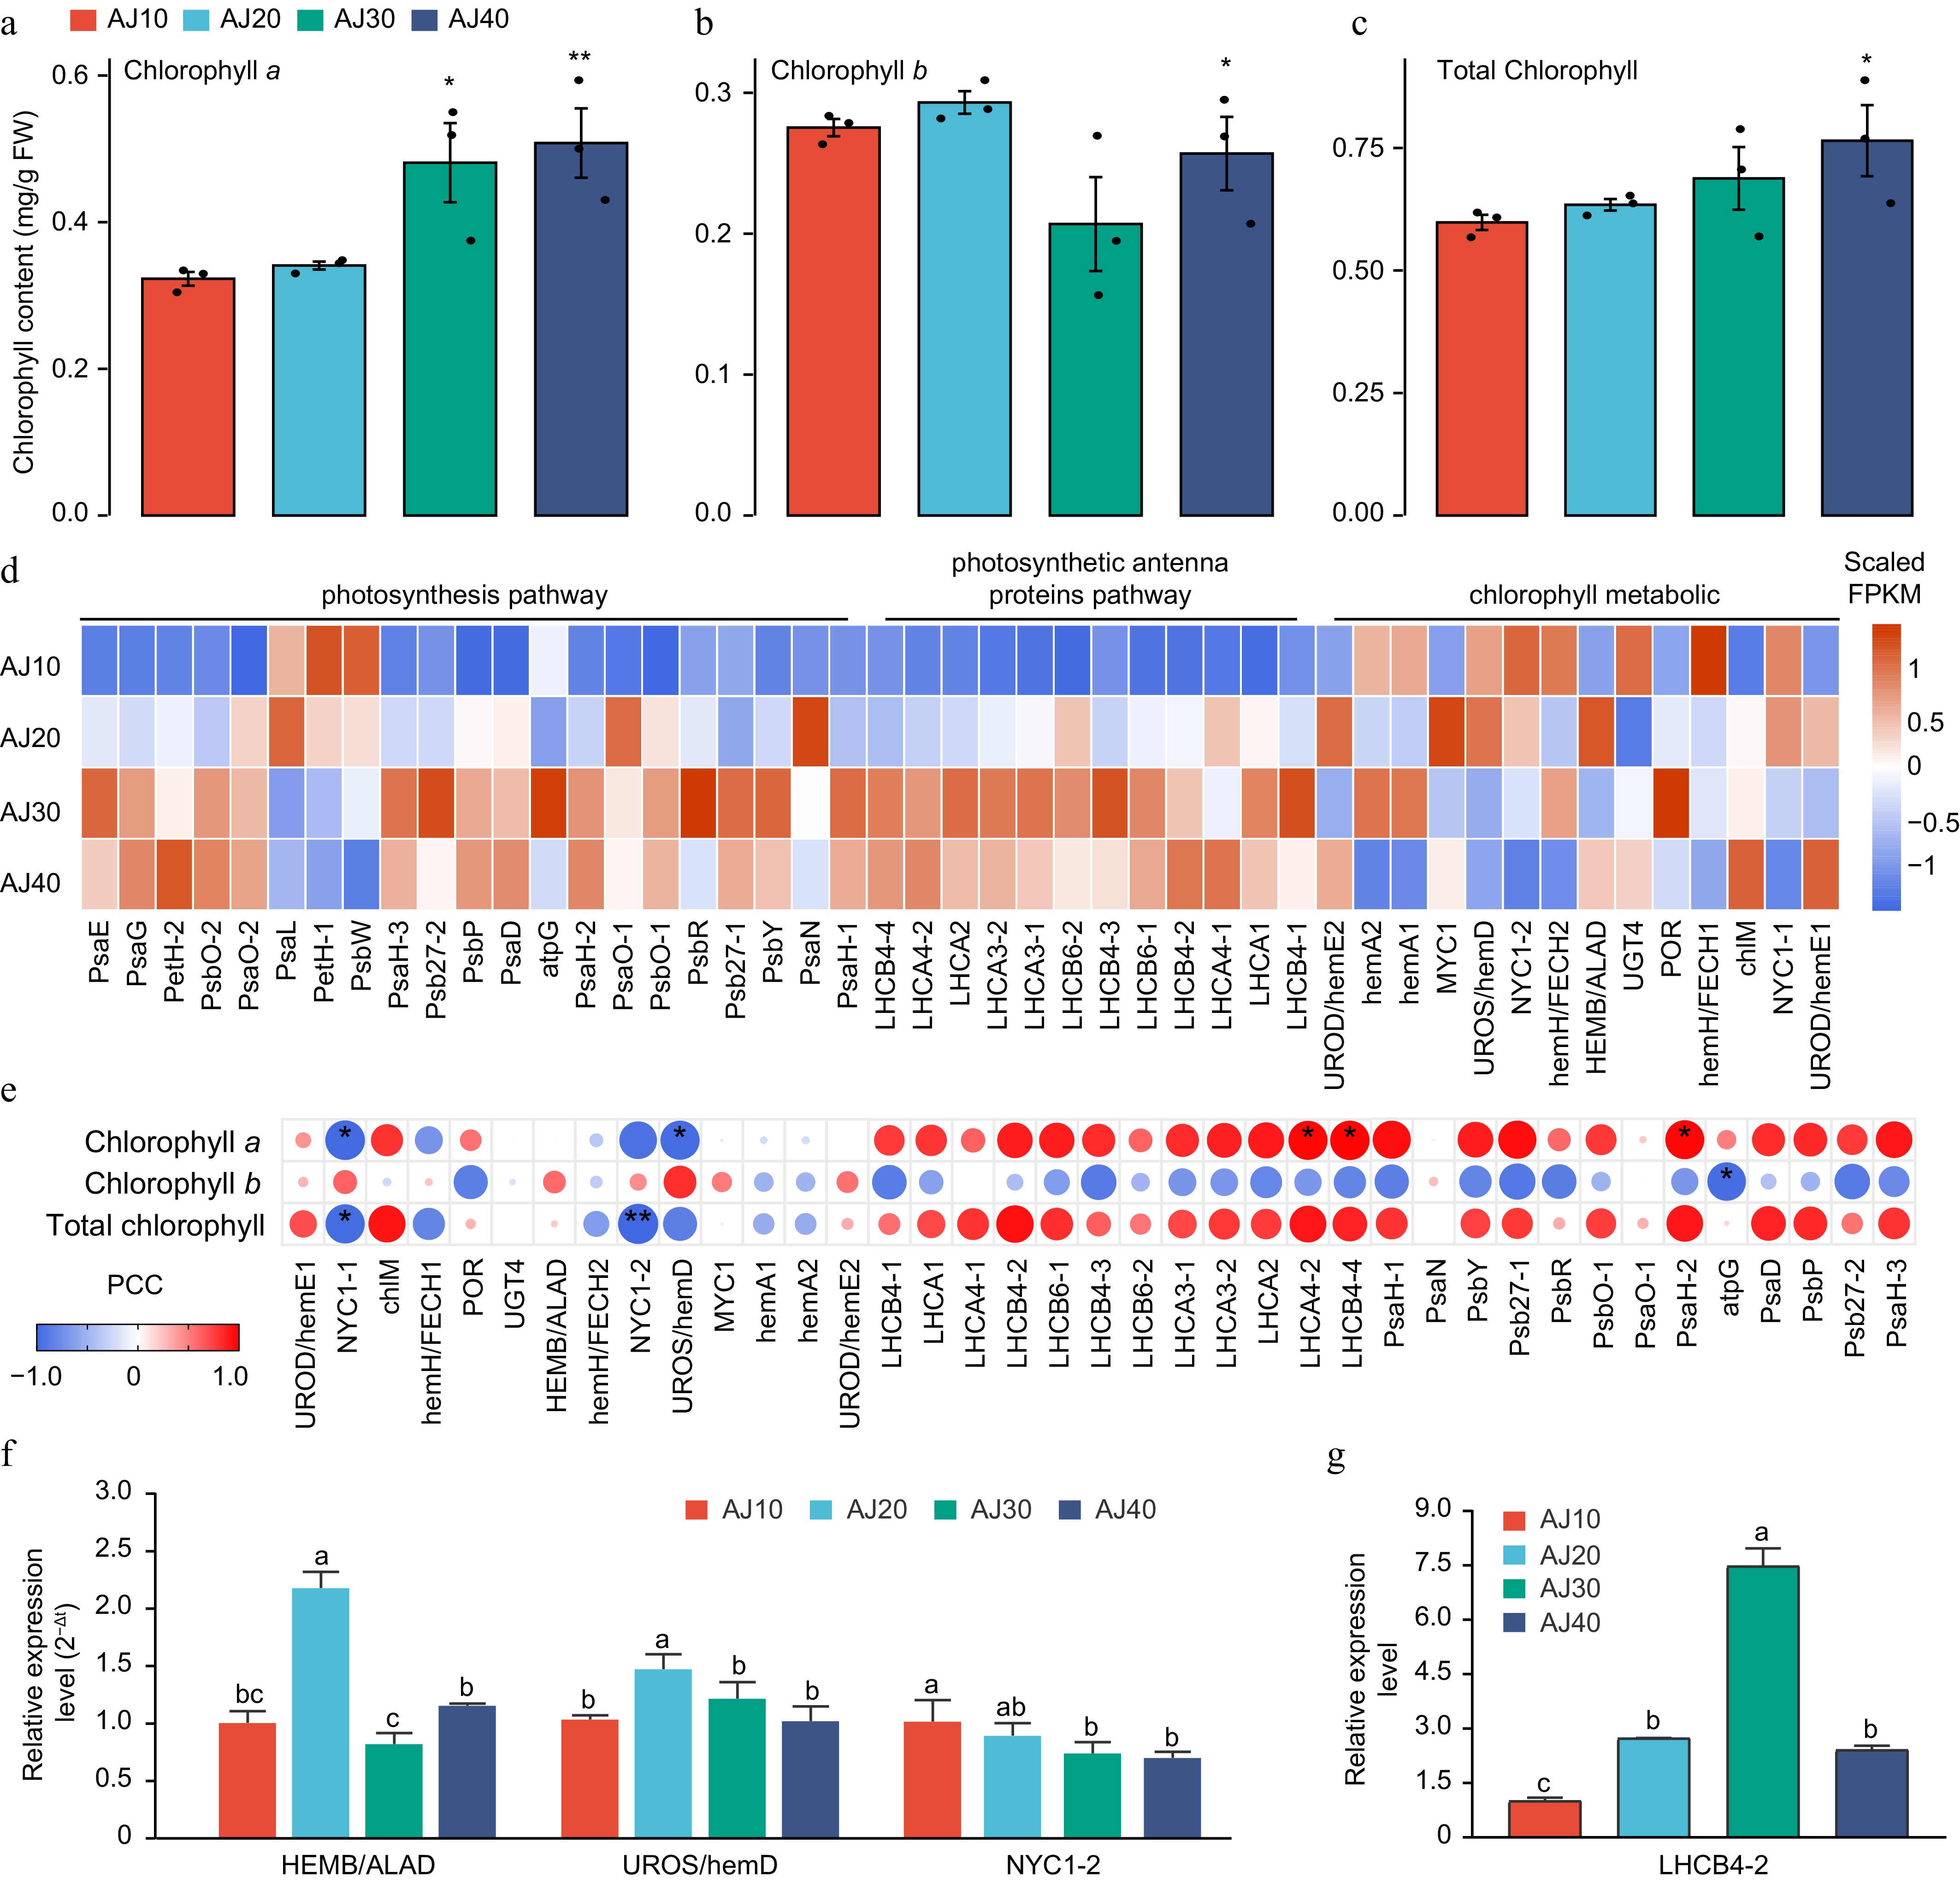
Figure 5.
Chlorophyll and photosynthesis change during the long-term cultivation of 'Baiye 1'. (a) The content change of chlorophyll a of 'Baiye 1' at different cultivation ages. (b) Chlorophyll b change in 'Baiye 1' at different cultivation ages. (c) The content change in total chlorophyll at different cultivating ages. (d) Expression variations of key genes related to chlorophyll. (e) Correlation analysis between the chlorophyll-related genes and chlorophyll content in 'Baiye 1' over different cultivation ages. PCC: Pearson correlation coefficient. * p value < 0.05, ** p value < 0.01, *** p value < 0.001. (f), (g) qRT-PCR validation of the key genes relative to chlorophyll content and the photosynthetic antenna protein pathway. Significance is indicated by 'a'–'c', where different letters mean significant. AJ10–AJ40 indicated the cultivation age from 10 to 40 years.
-
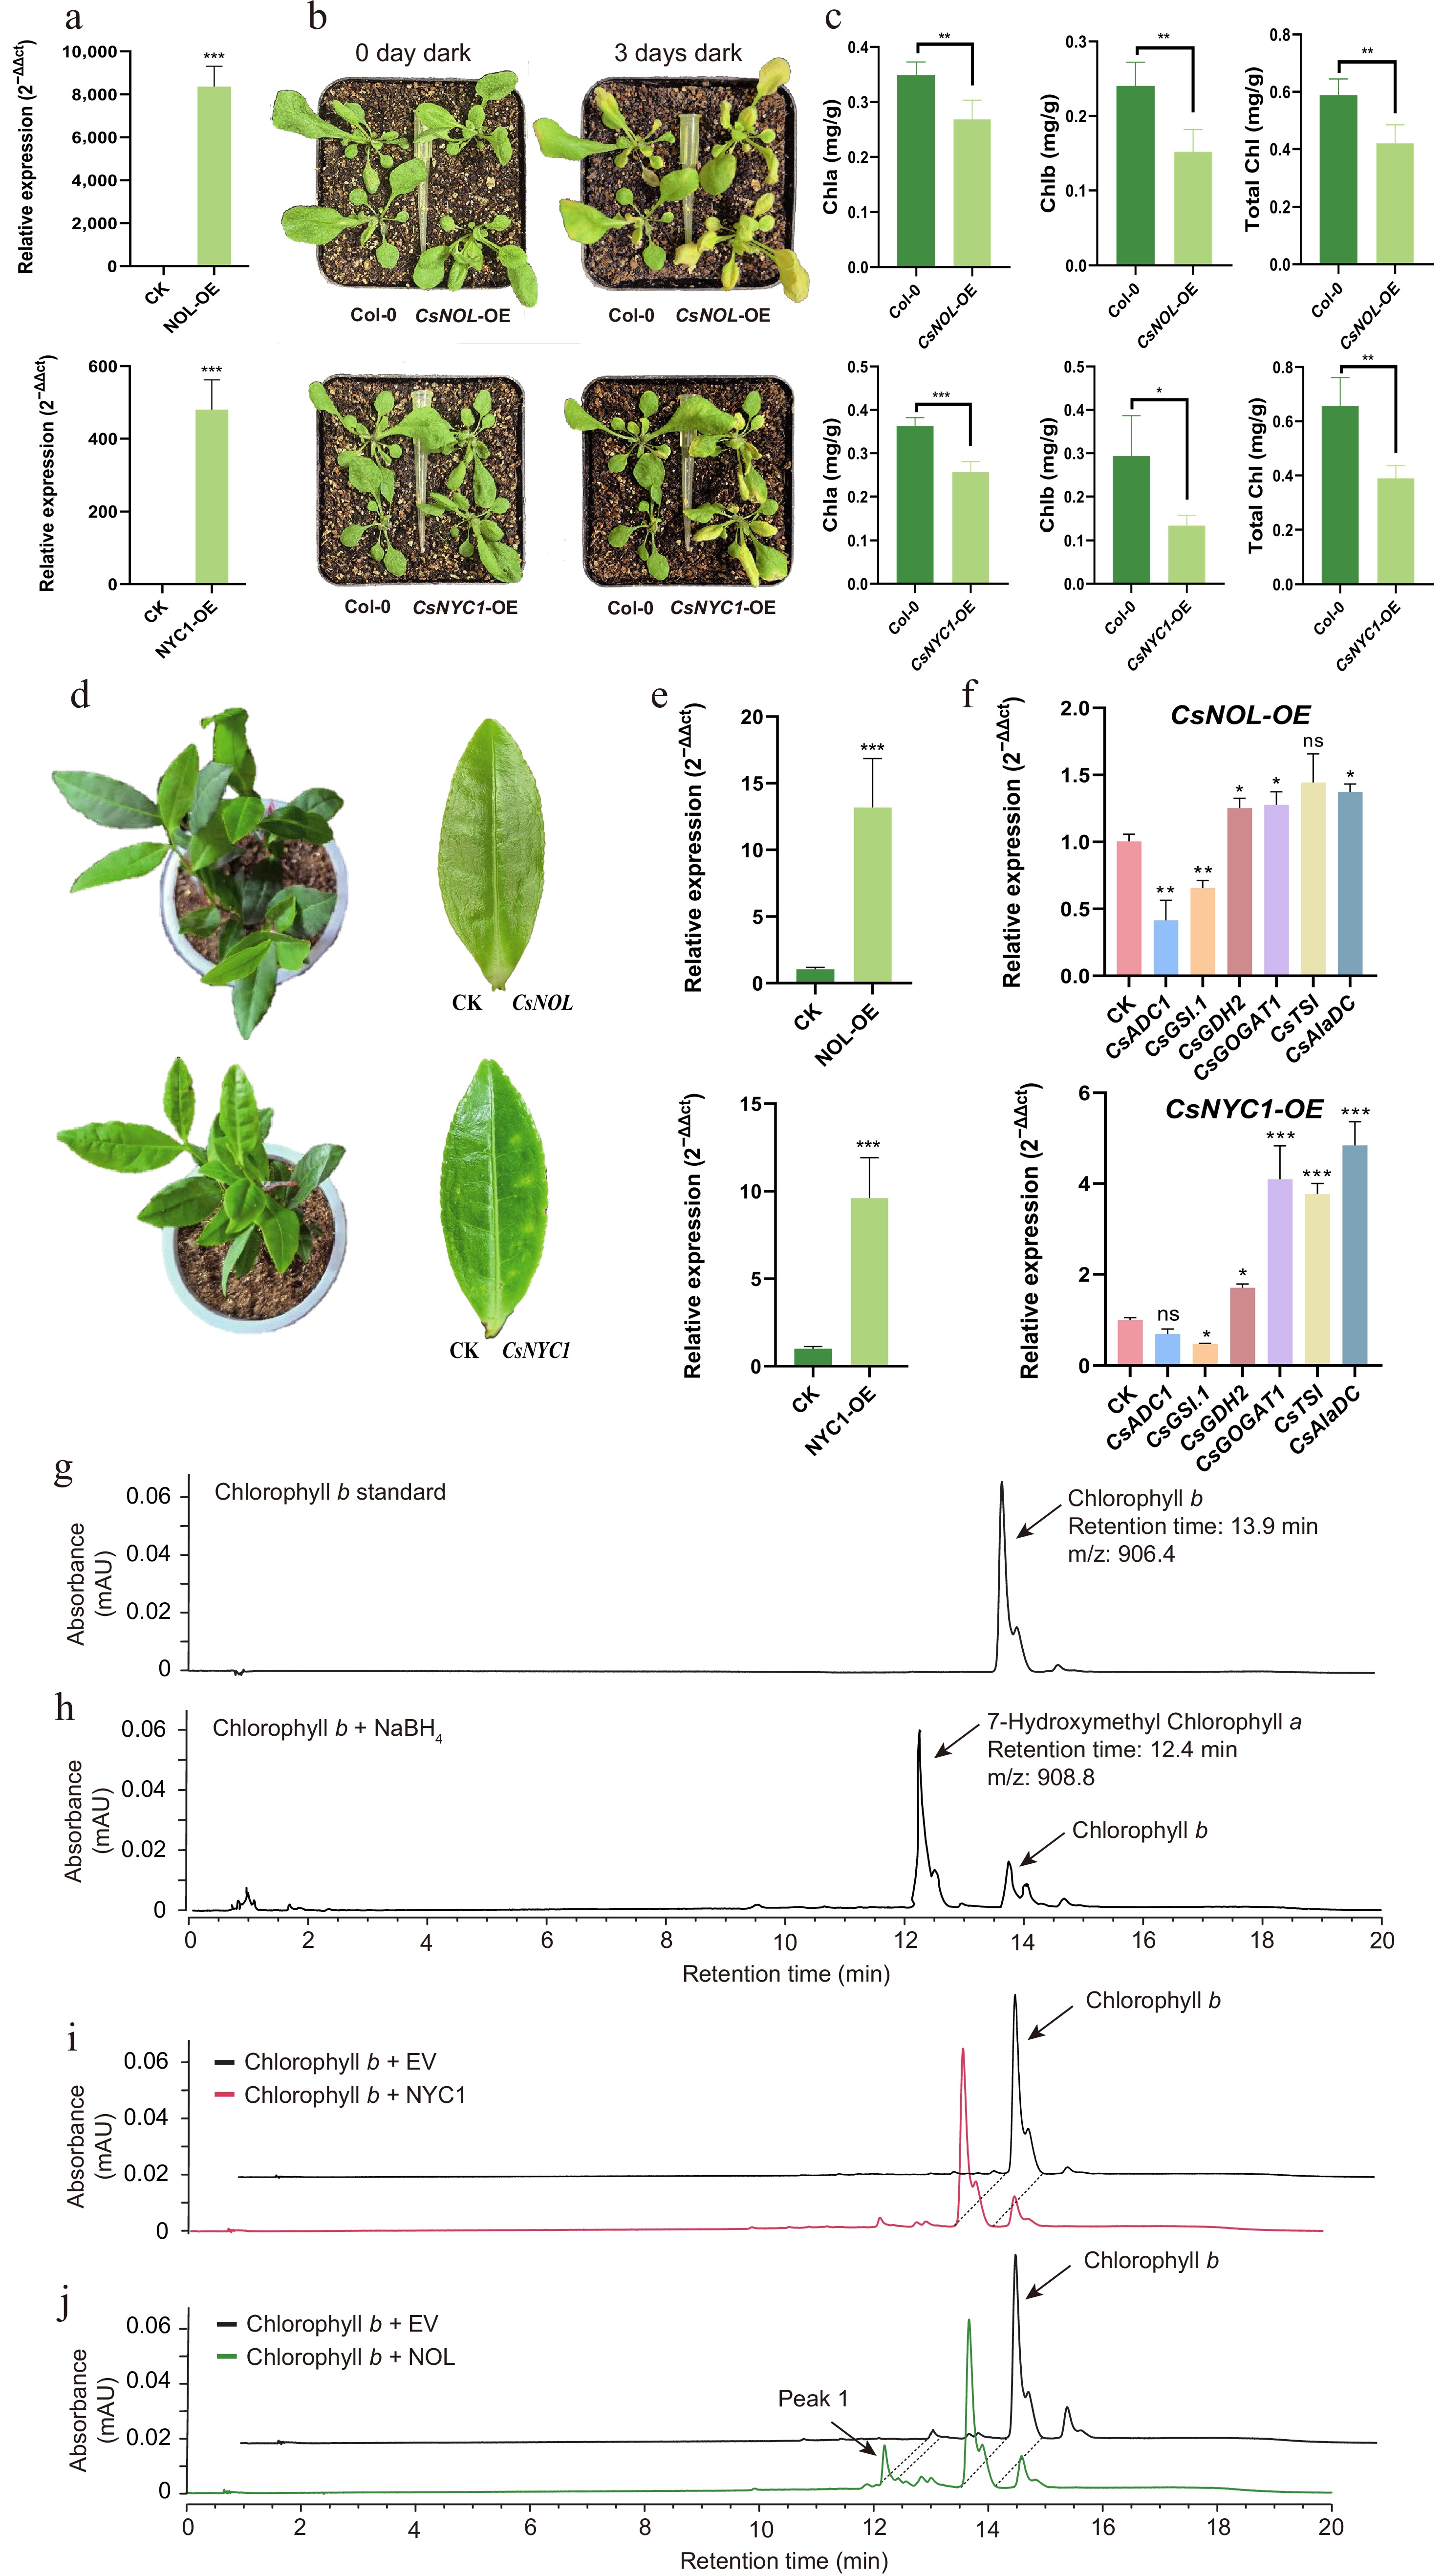
Figure 6.
Functional analyses of CsNOL and CsNYC1 in vivo and in vitro. (a) Gene expression levels and phenotype analyses in transgenic Arabidopsis of CsNOL and CsNYC1. (b) Phenotype of transgenic Arabidopsis. (c) Chlorophyll content. (d) Transient overexpression of tea plants. (e) Expression level of CsNOL and CsNYC1 in overexpressing tea leaves. (f) Genes related to amino acid content expression levels of tea plants with transient overexpression. (g) Chlorophyll b standards. (h) 7-hydroxymethyl chlorophyll a prepared from chlorophyll b using NaBH4. (i), (j) Pigments extracted from the reaction mixture incubated with chlorophyll b harboring empty or recombinant CsNOL proteins were subjected to UPLC. Peak 1 newly appeared in the incubation of chlorophyll b and CsNOL. The absorbance at 441 nm is shown. * p value < 0.05, ** p value < 0.01, *** p value < 0.001.
-
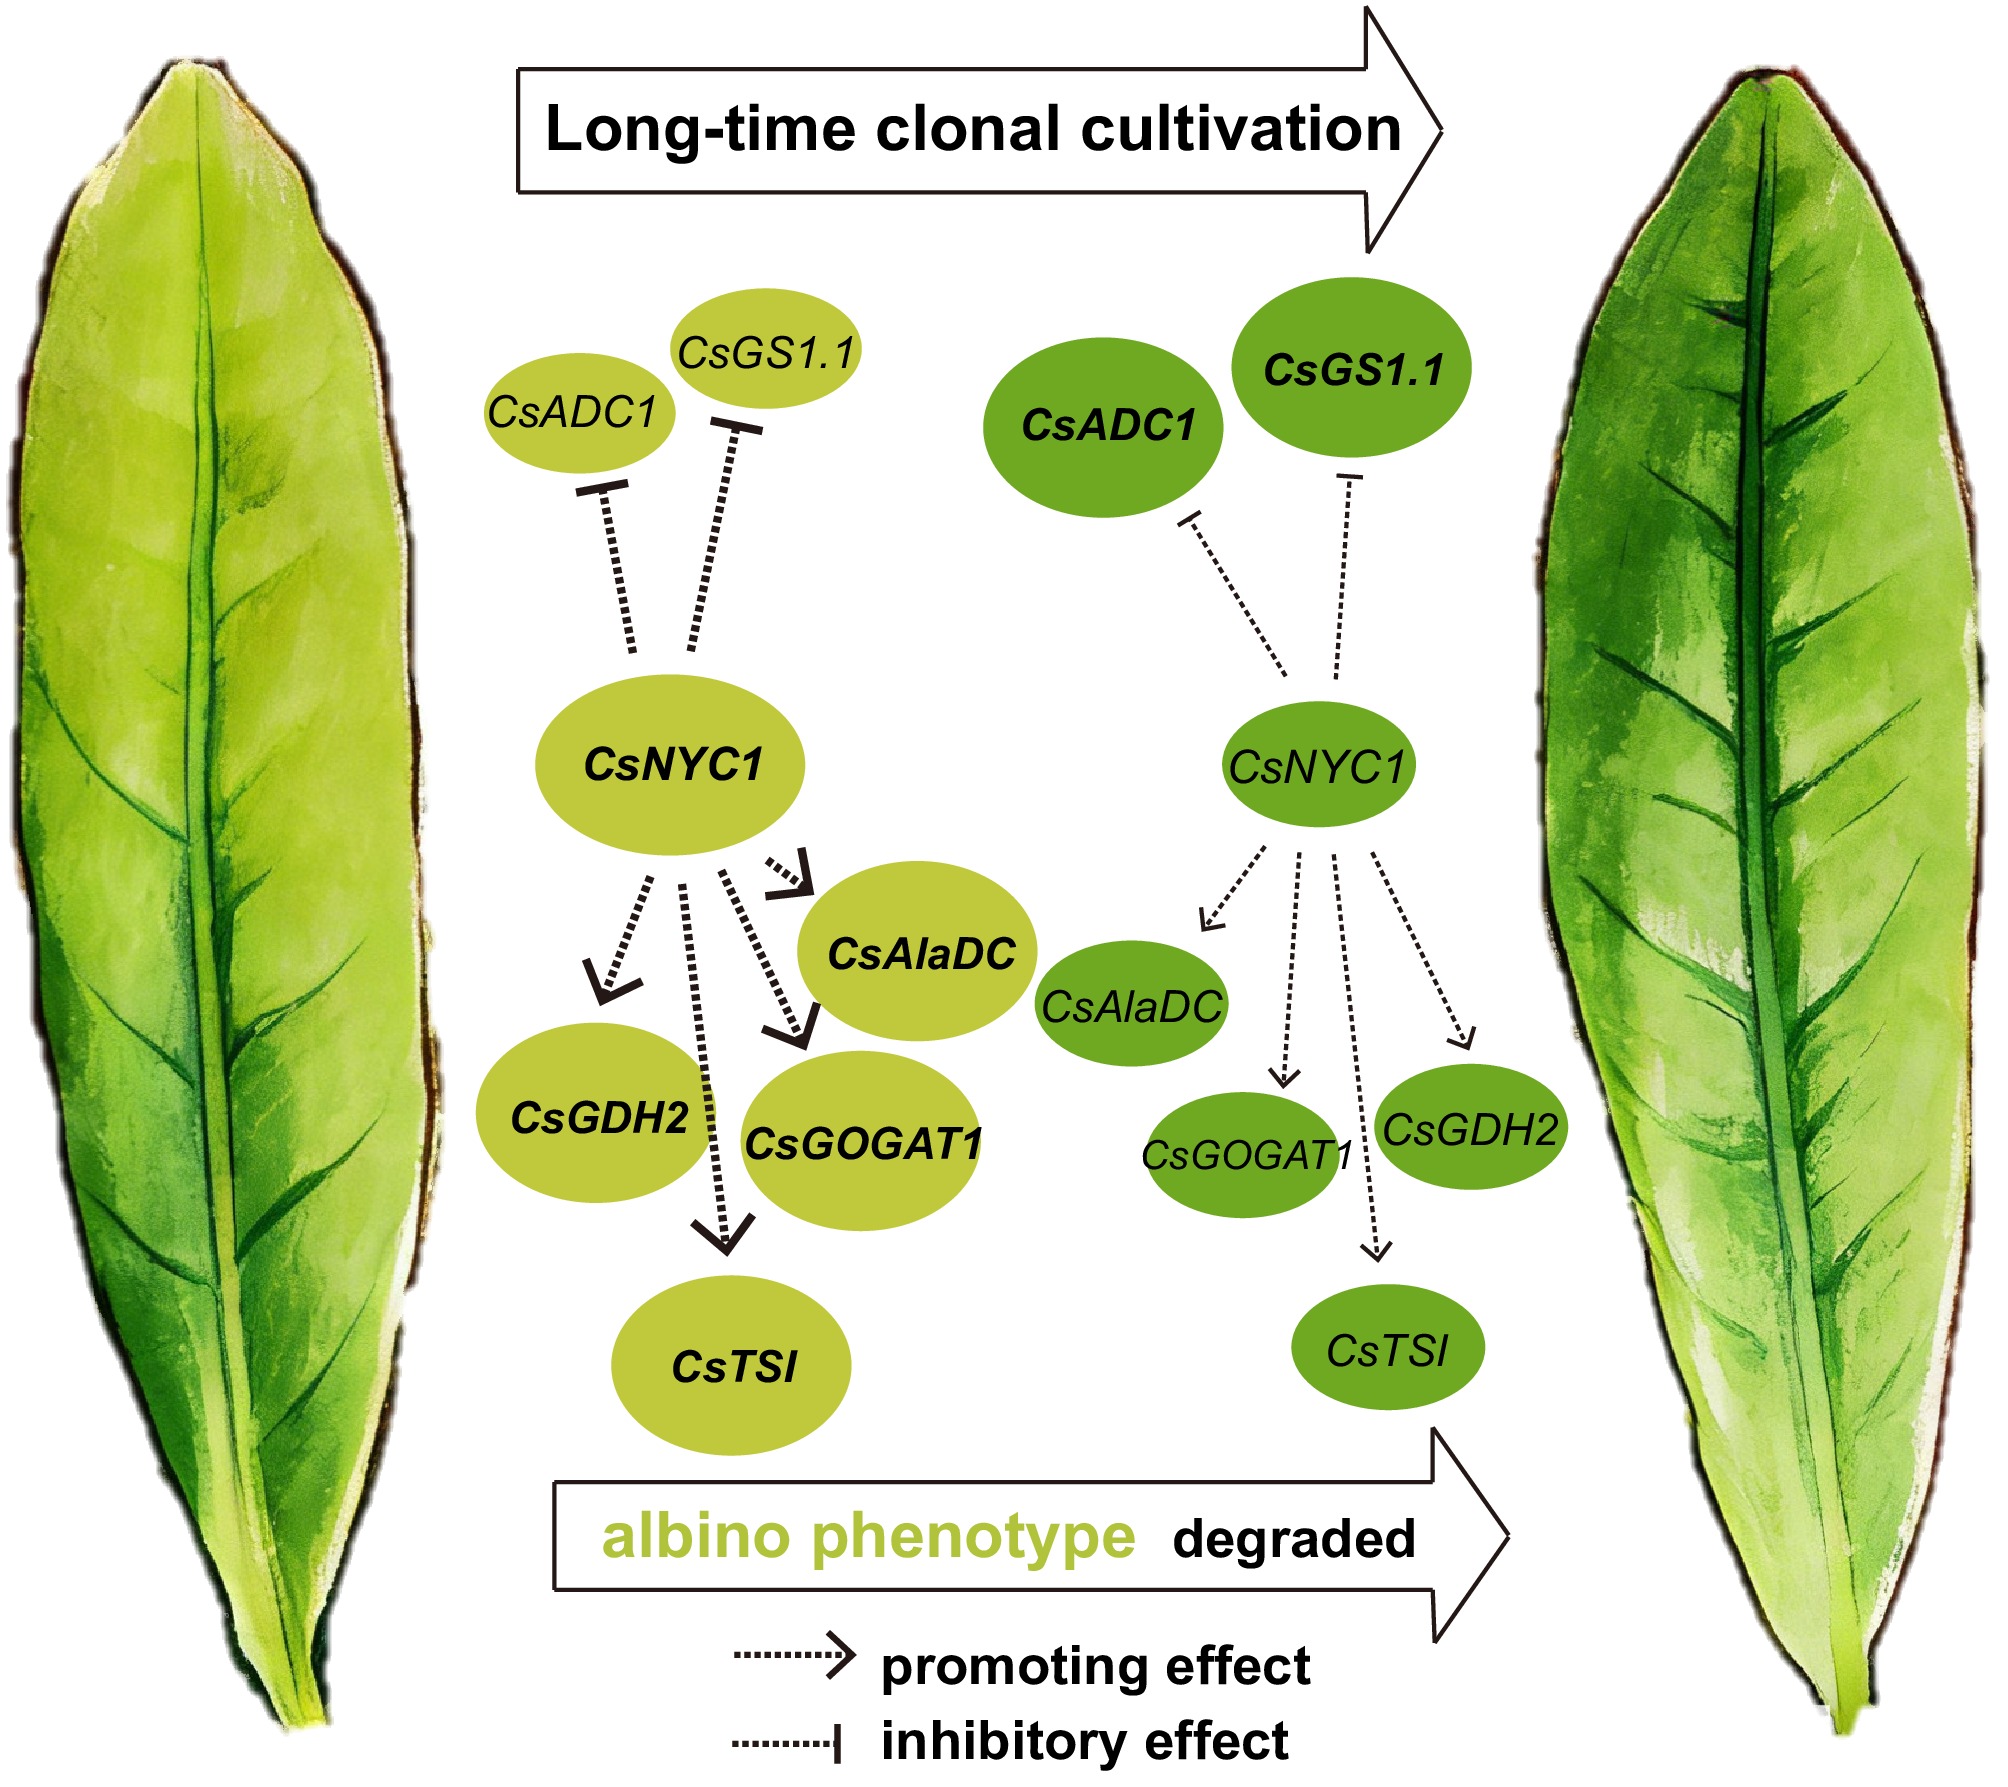
Figure 7.
Proposed regulatory network of chlorophyll degradation and amino acid metabolism-related genes in albino tea plants under long-term clonal propagation.
Figures
(7)
Tables
(0)