-
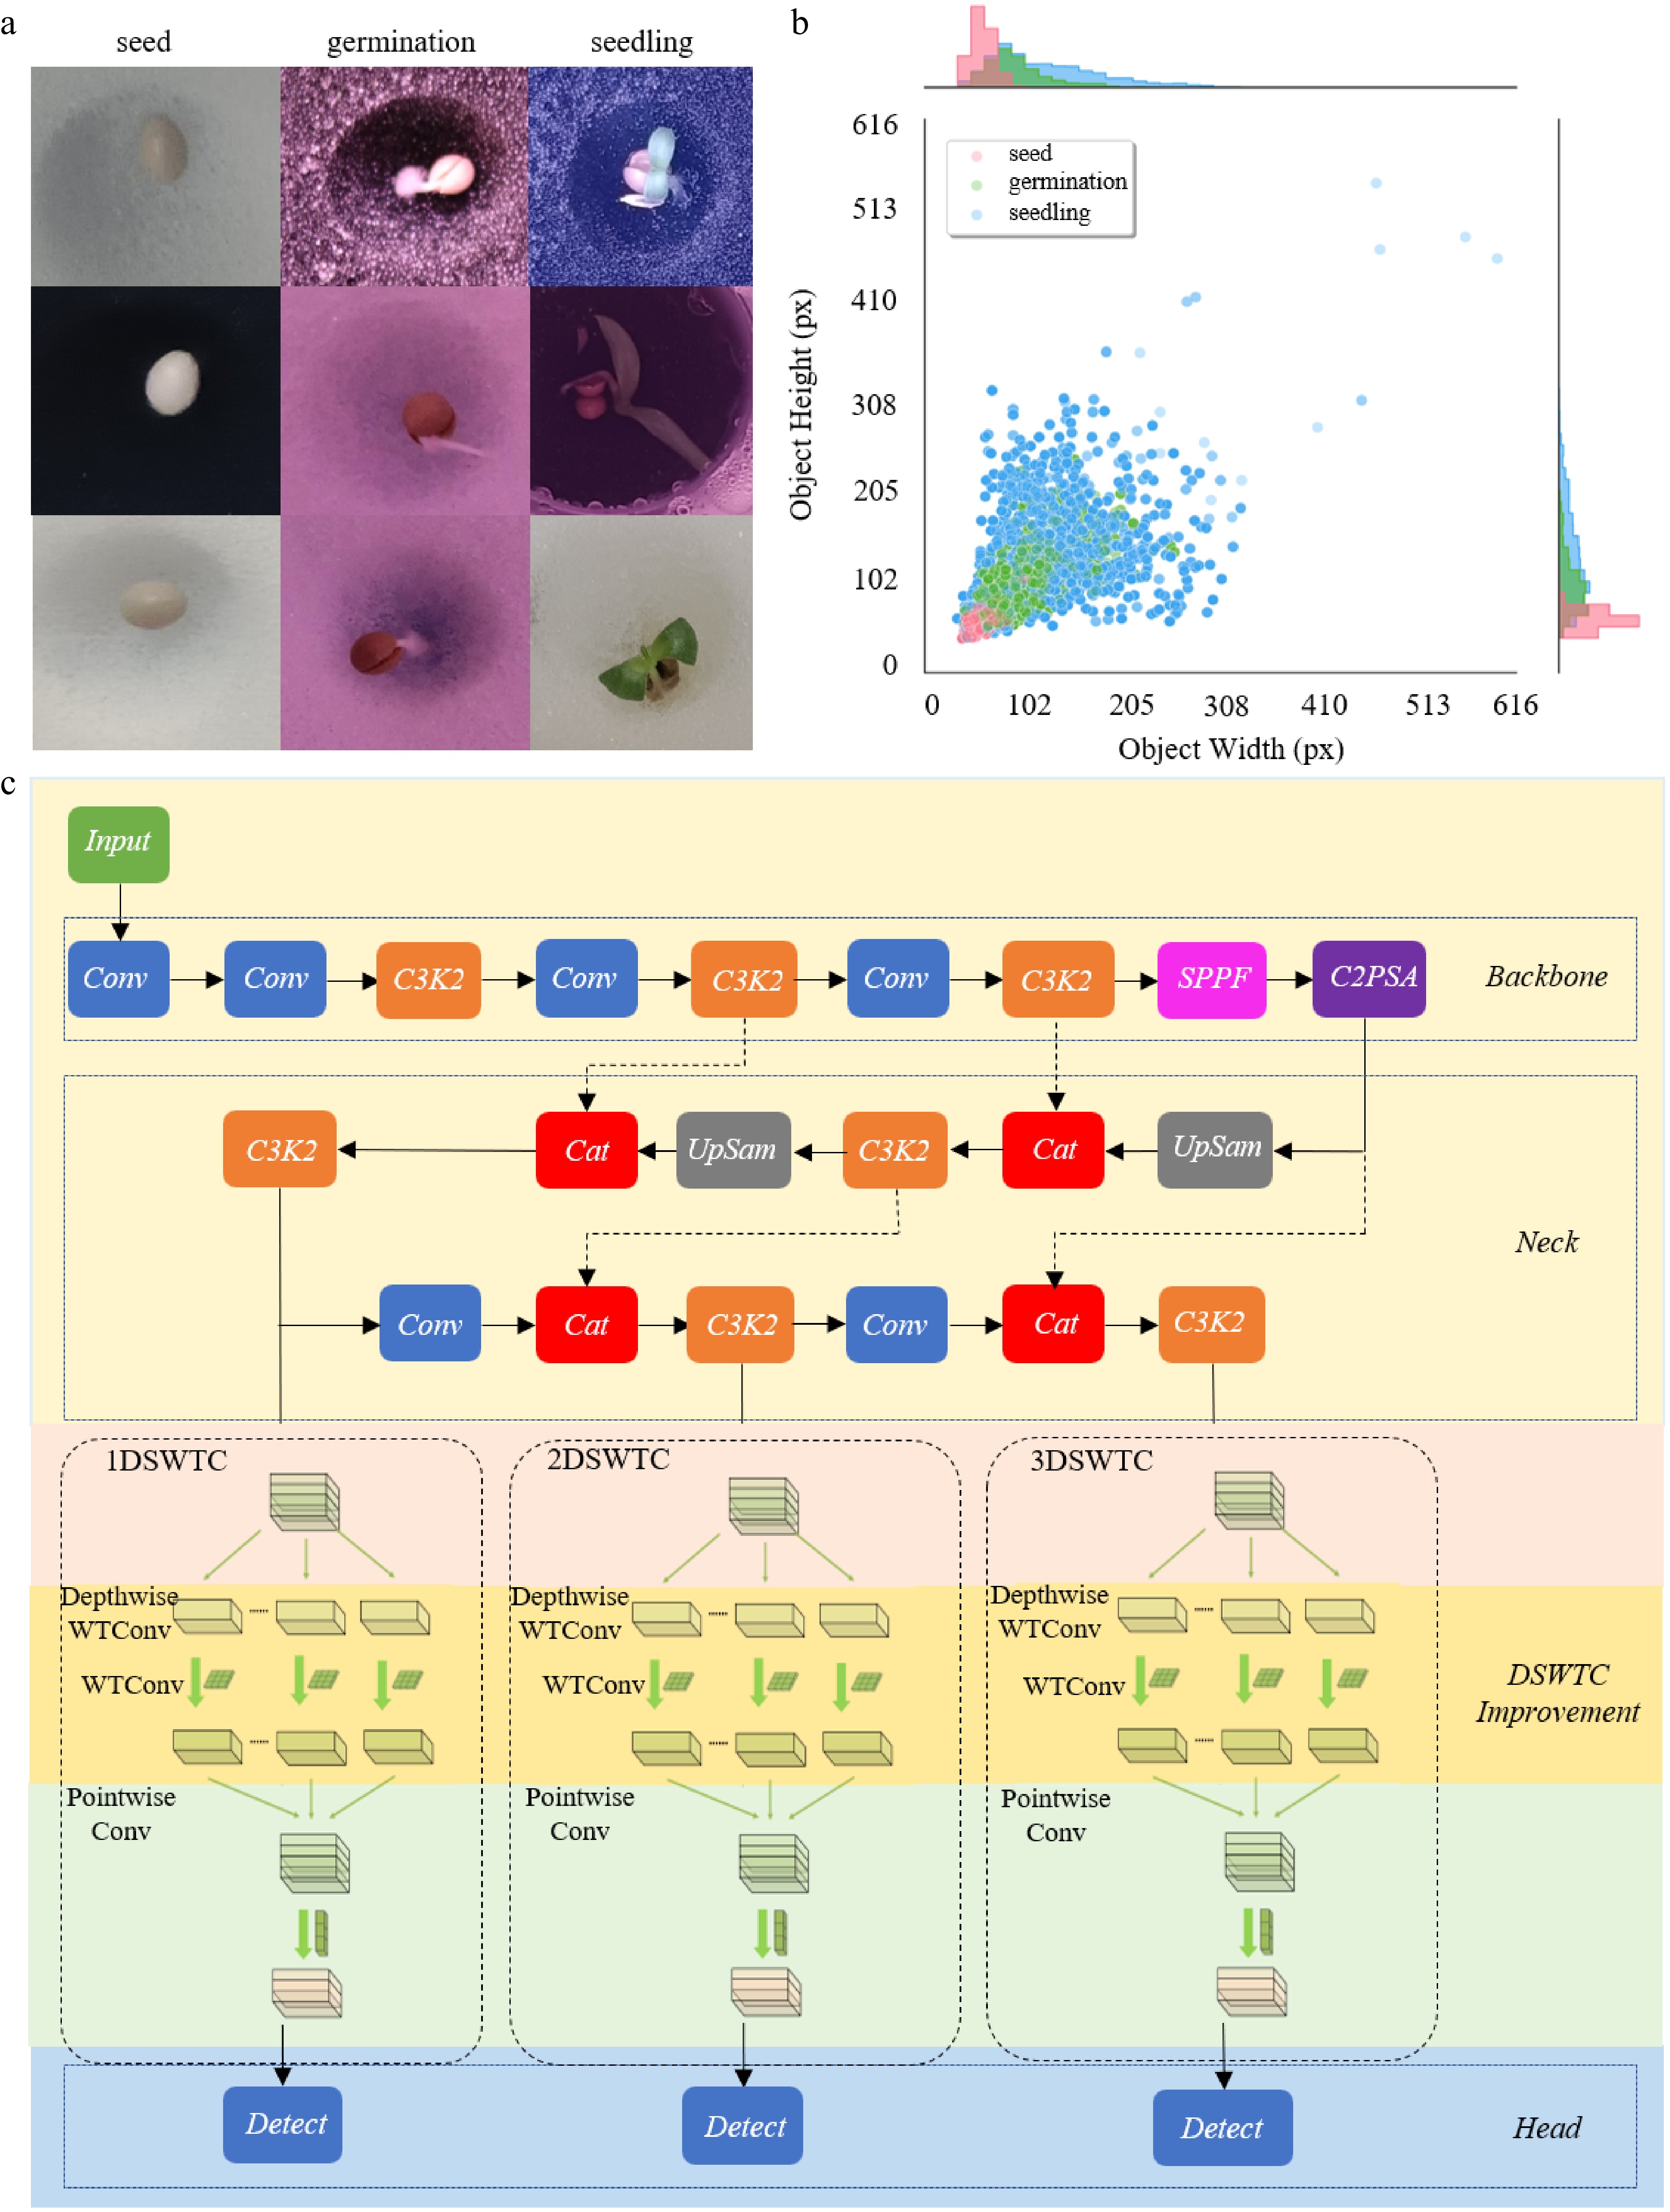
Figure 1.
Overview of the datasets and detection model. (a) Three growth stages: Seeds, germination and seedlings. (b) Size distribution of three types of annotation bounding boxes in the dataset. (c) The proposed YOLOv11-DSWTC object detection model in this study.
-
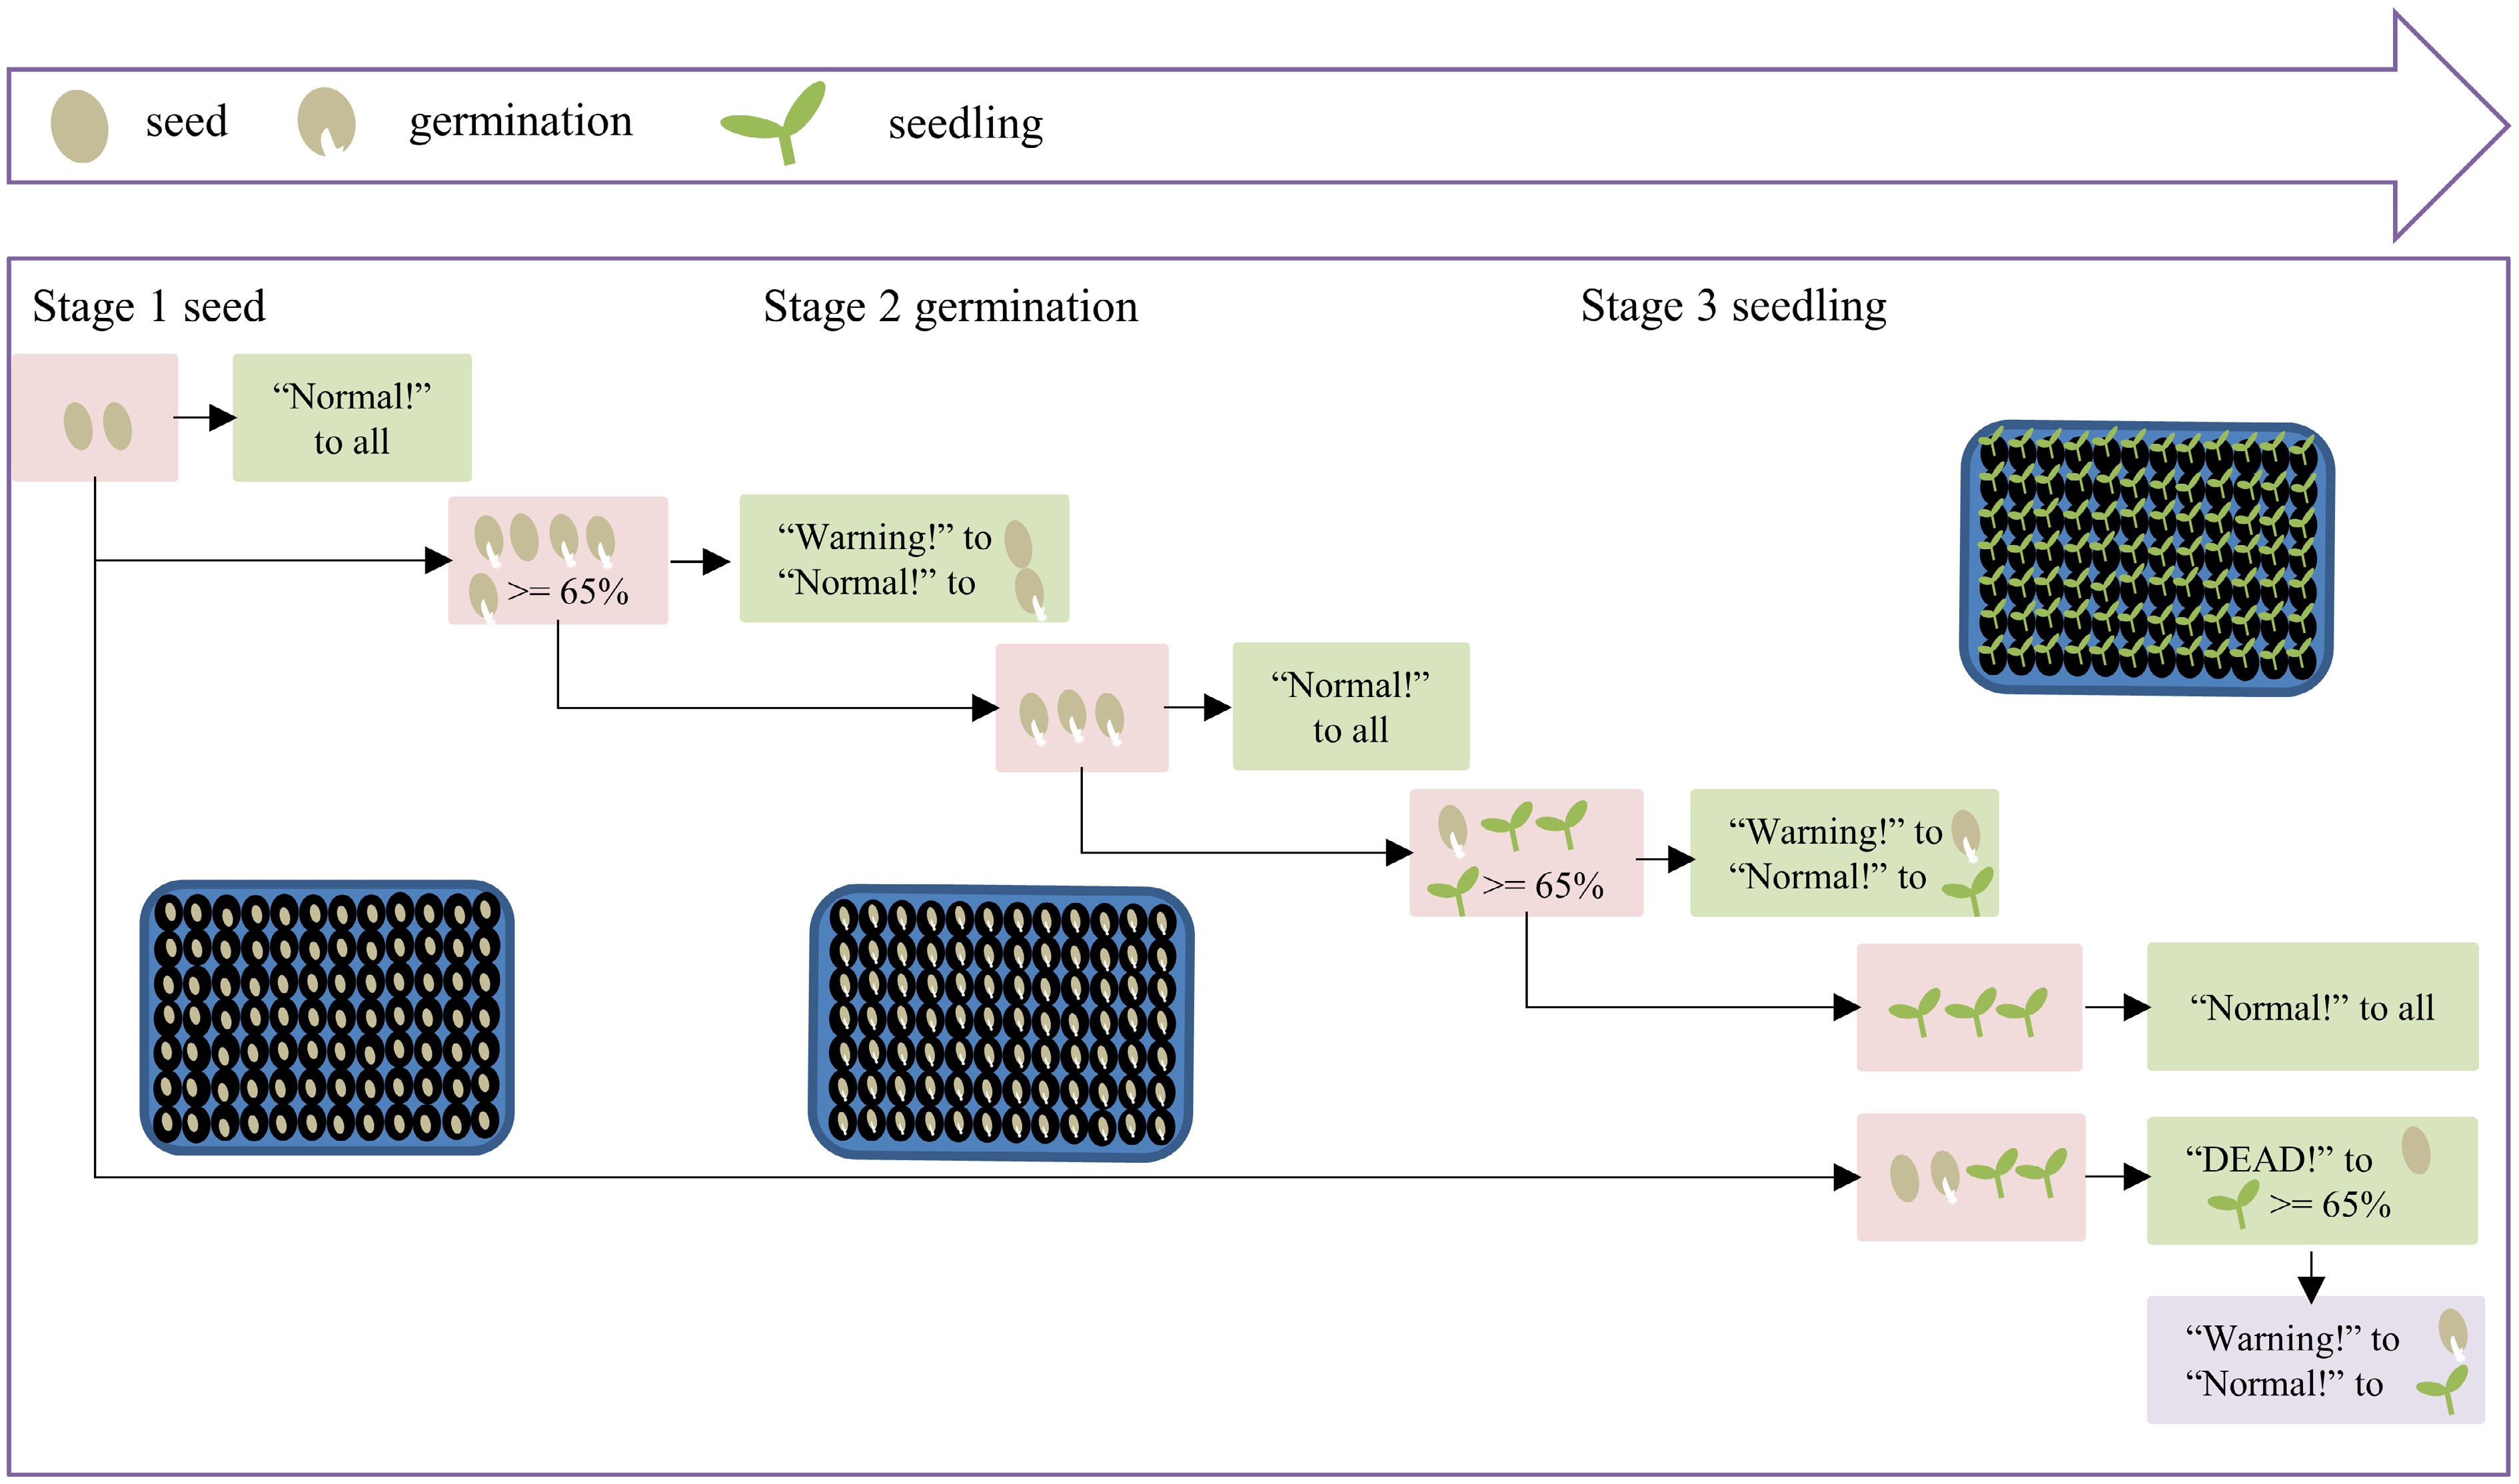
Figure 2.
Process of the warning mechanism.
-
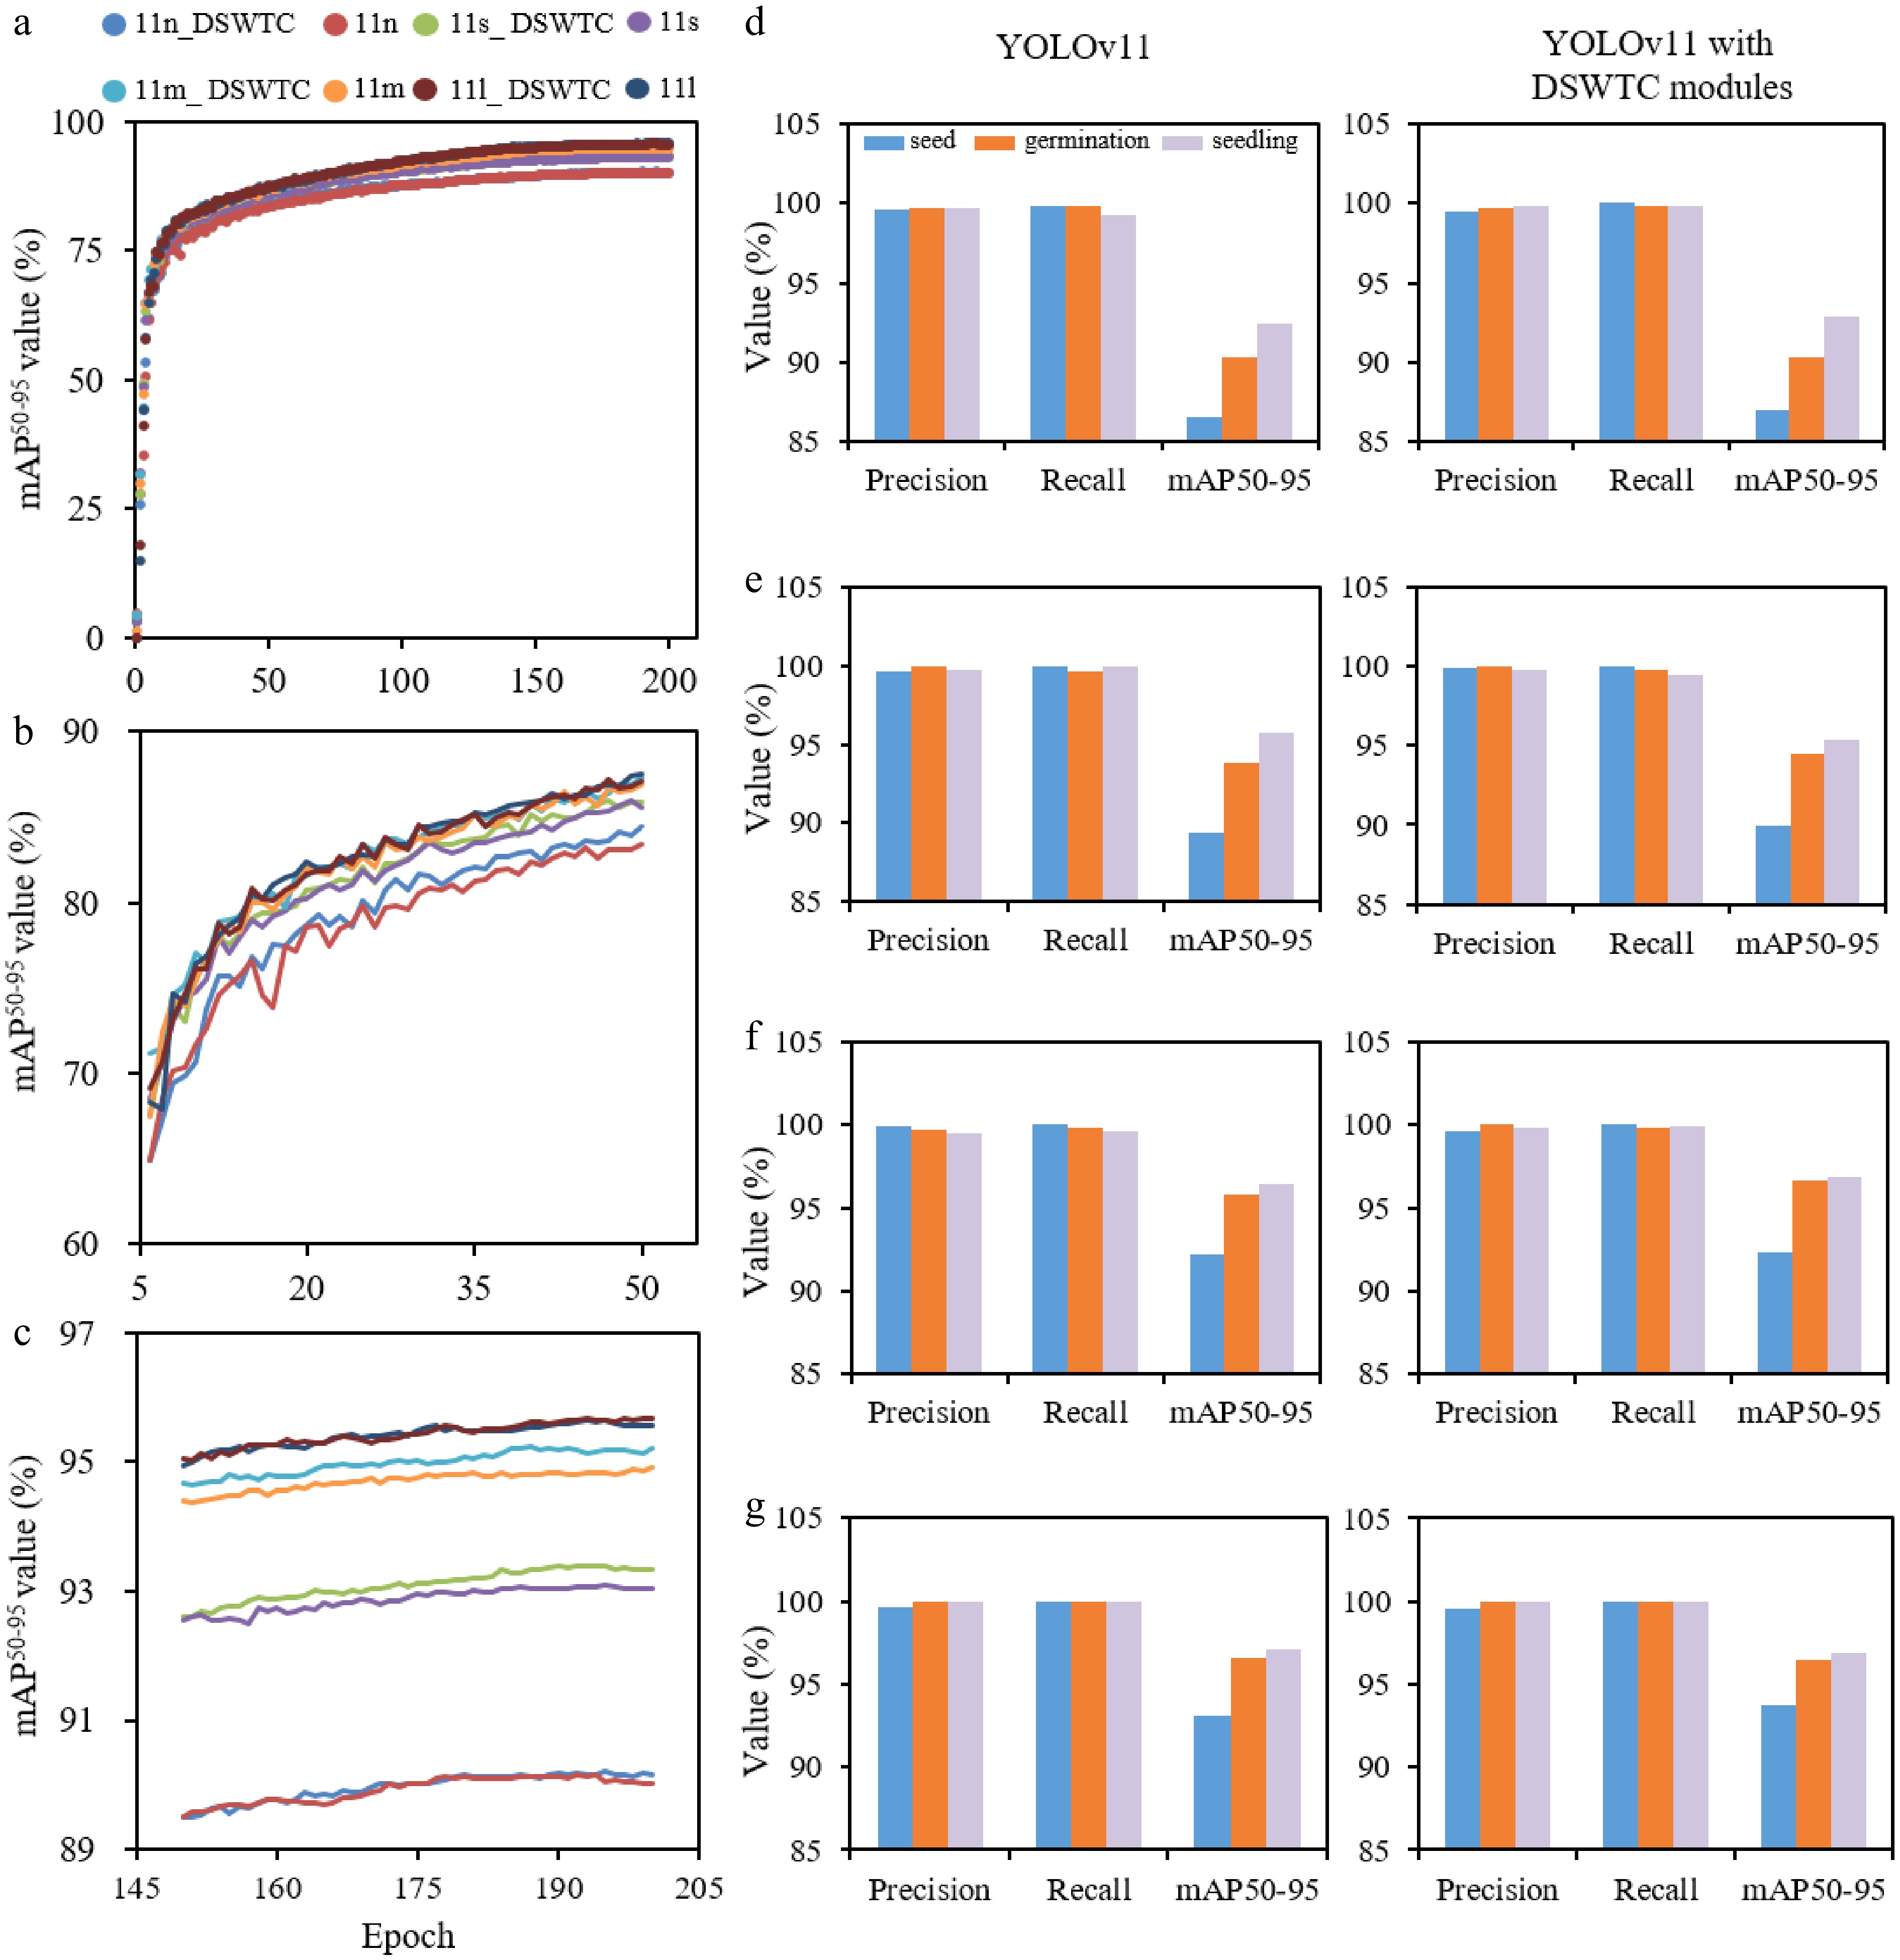
Figure 3.
mAP50–95 changes of different YOLOv11 versions with and without the DSWTC module, and detection performance for seeds, germination, and seedlings. The overall mAP50–95 values in (a) 0–200 epochs, (b) 5–50 epochs, and (c) 150–200 epochs, respectively. (d), (e), (f), and (g) showed the seed, germination, and seedling detection performance in different sizes before and after embedding the DSWTC module on test dataset.
-
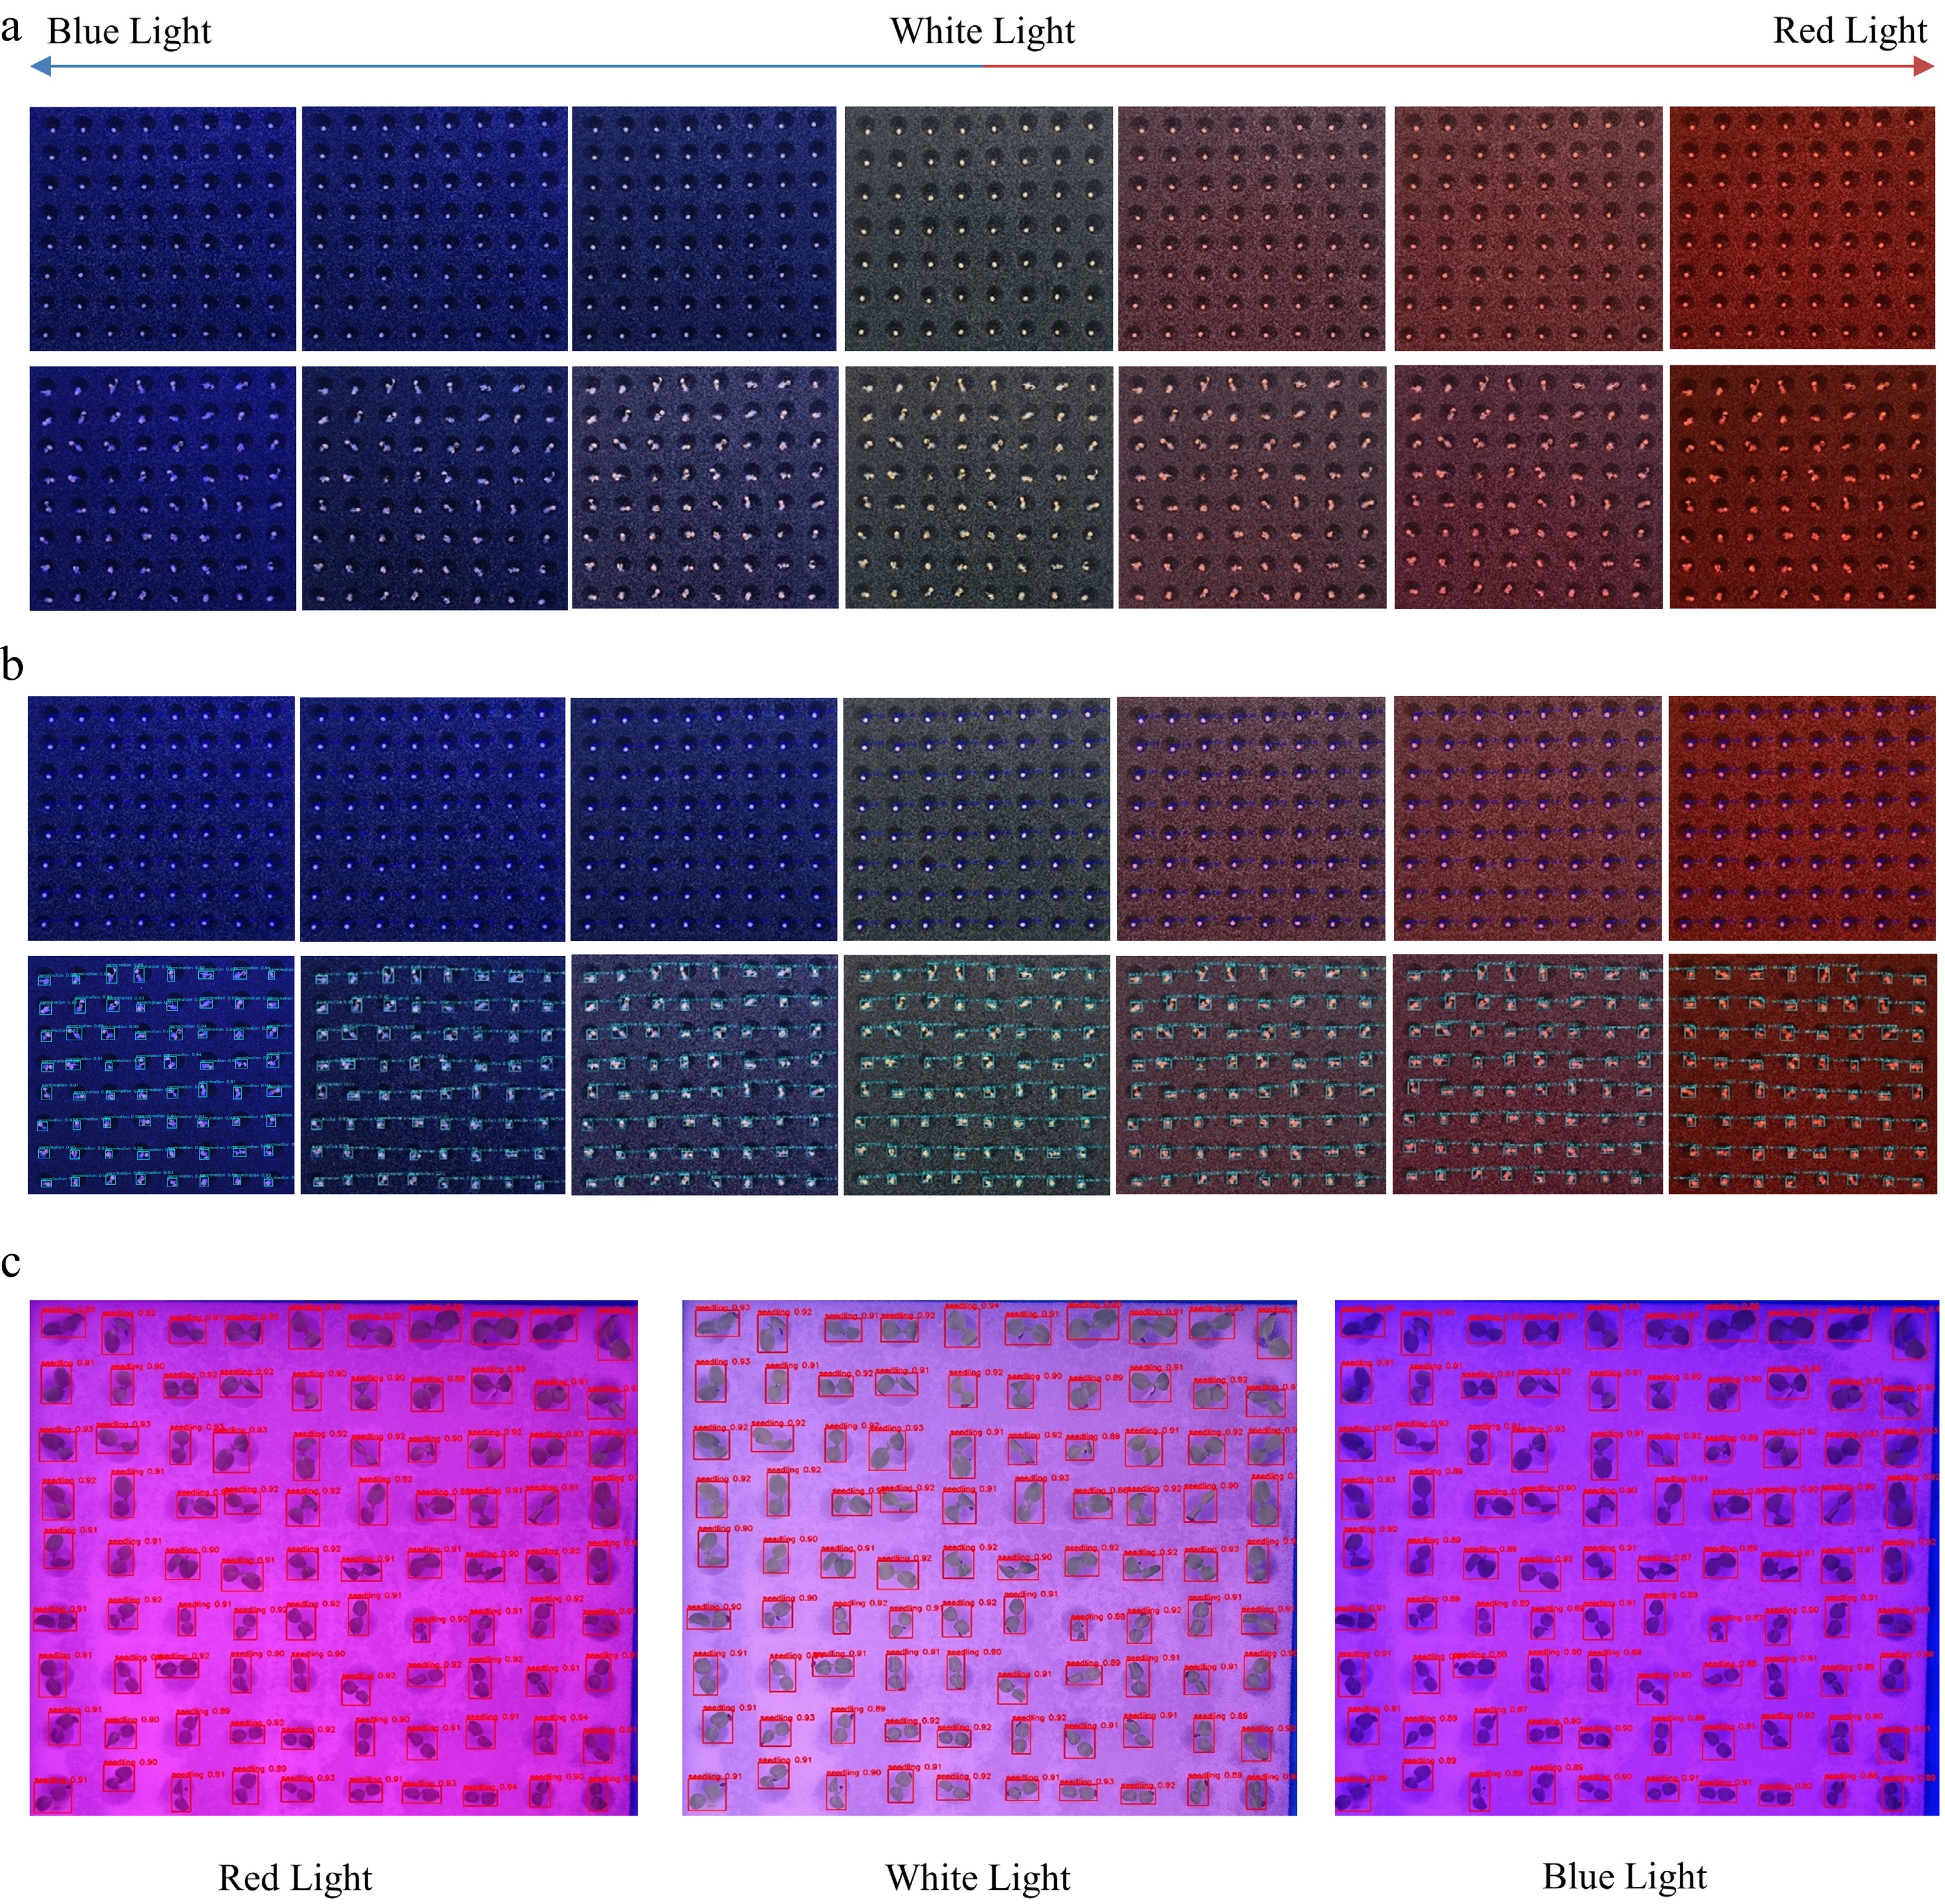
Figure 4.
Seed, germination, and seedling detection under different LED formulas in the PFALs. (a) Seed and germination under different LED lights. (b) Detection performance under the corresponding LED lights. (c) For better observation, the results of seedling detection performance are presented separately.
-
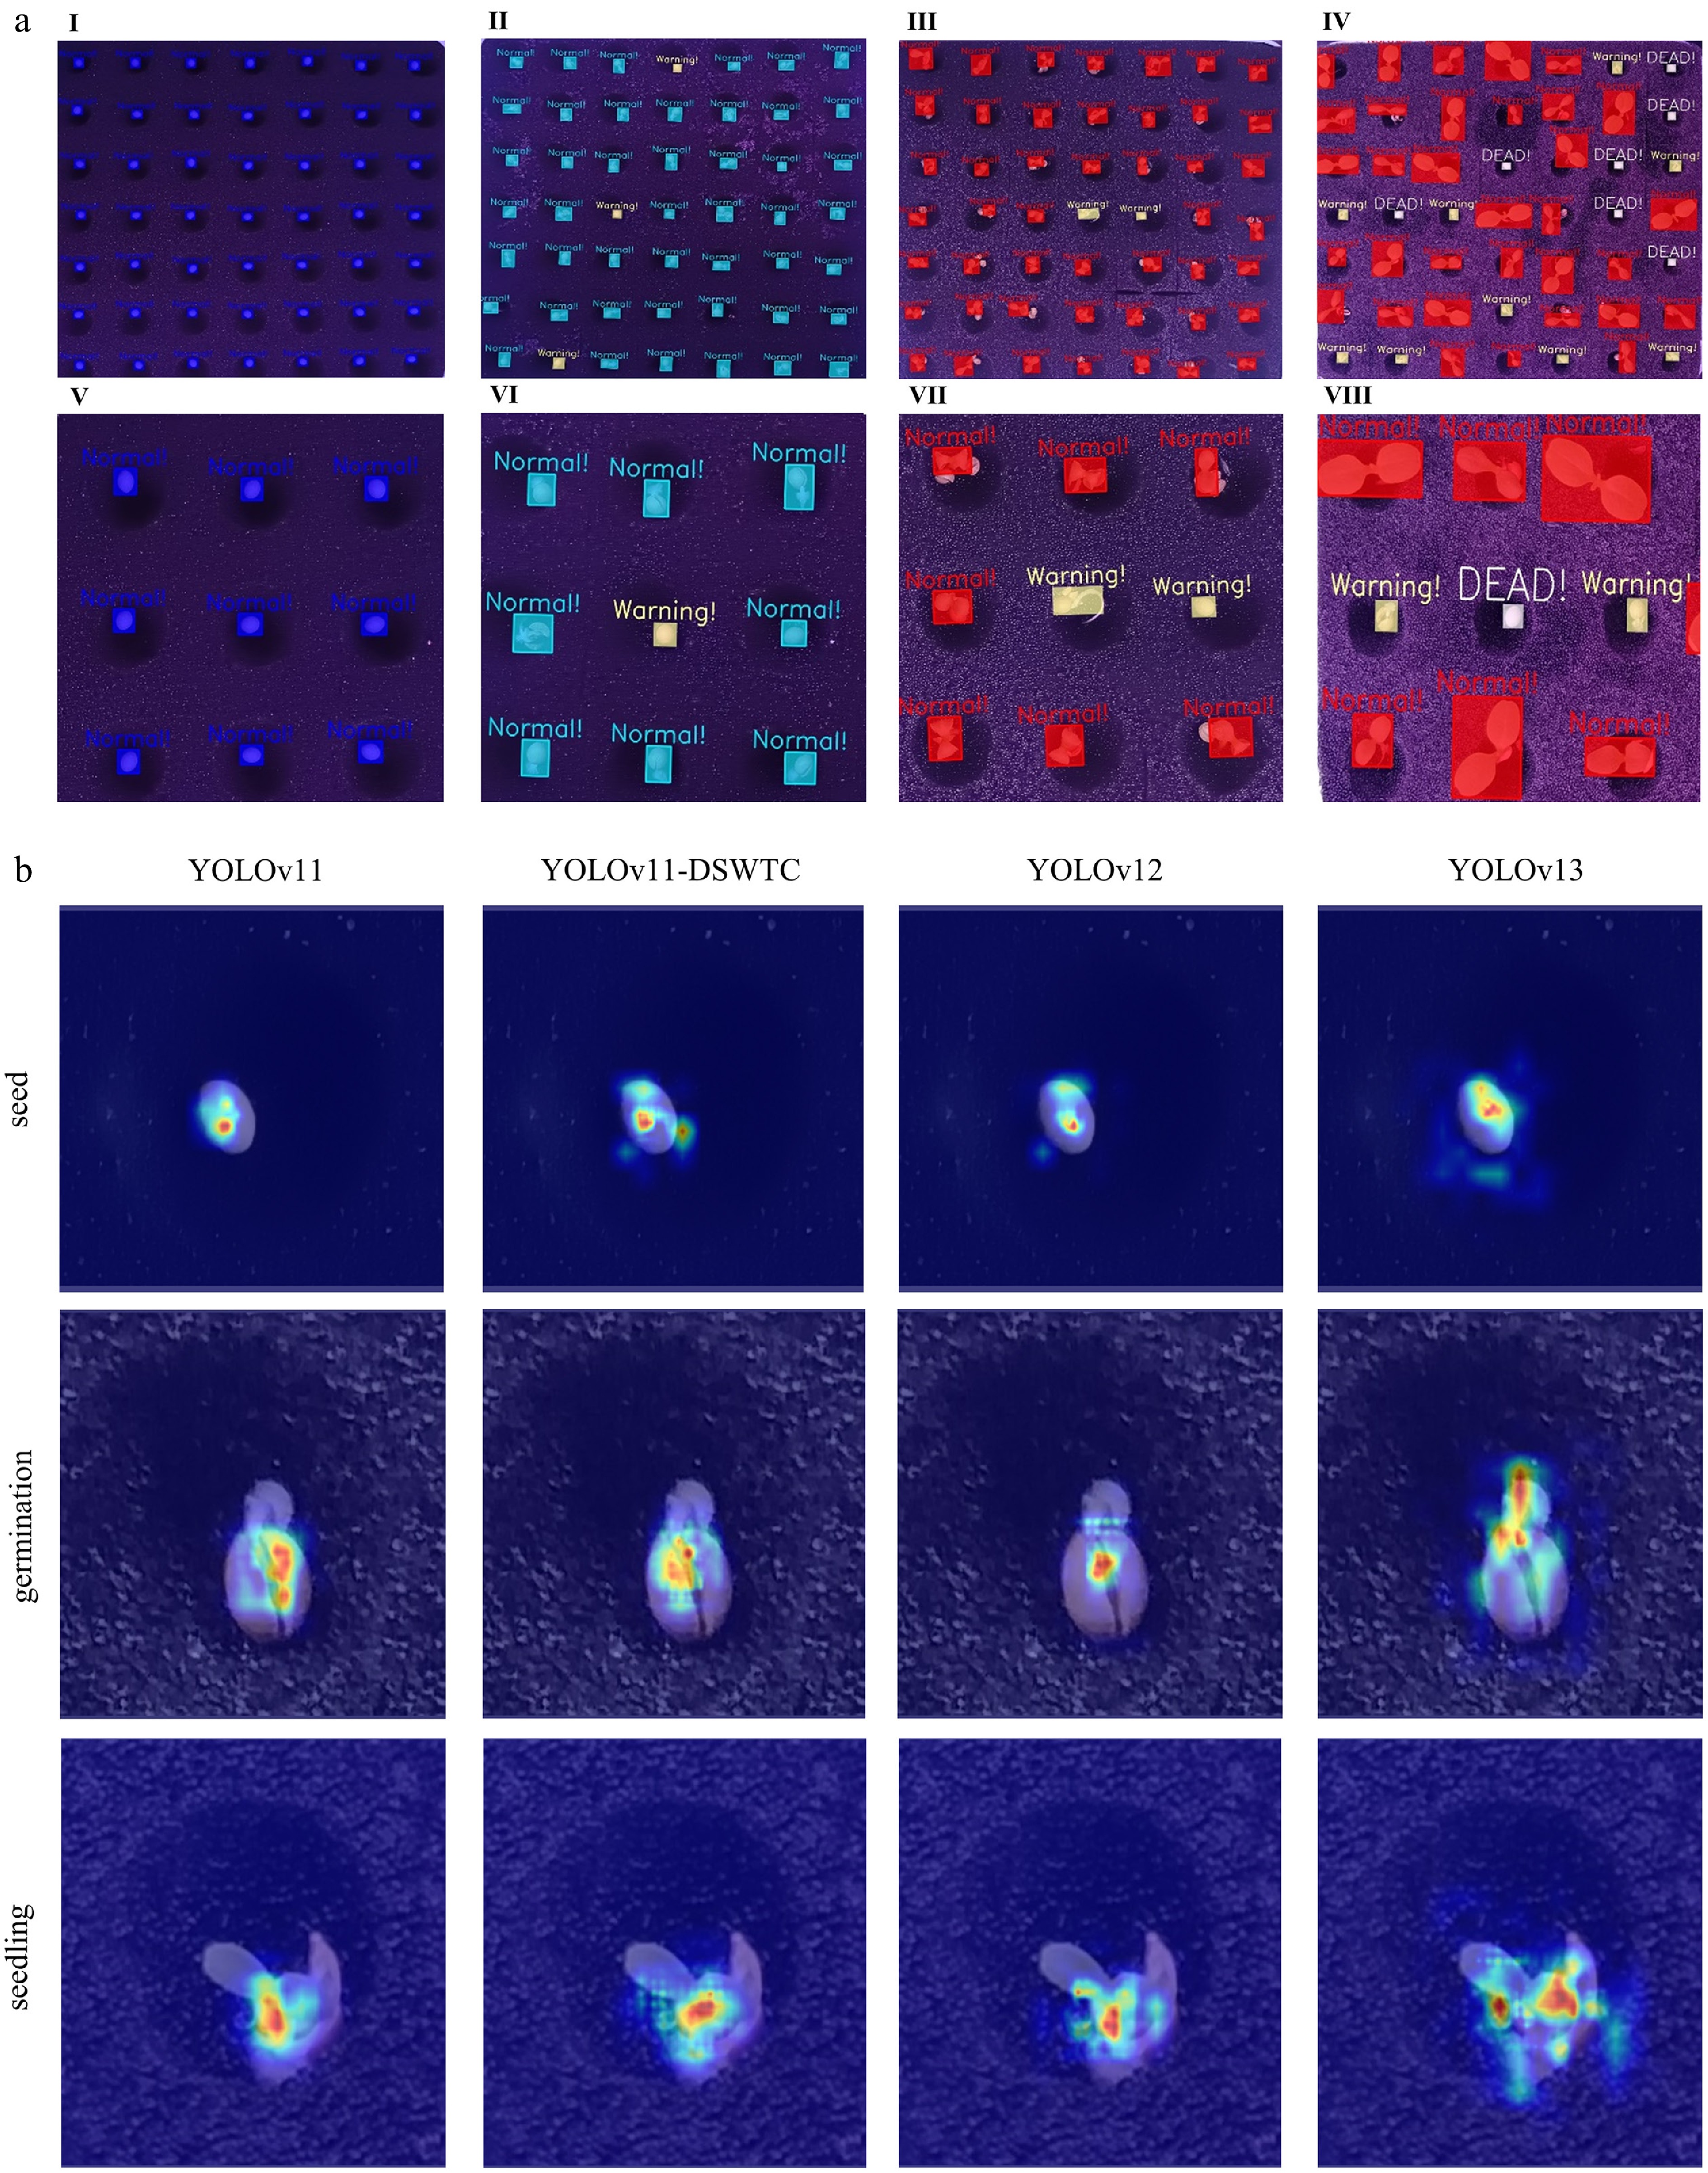
Figure 5.
Application of the warning mechanism in different scenes and comparison of performance with other advanced models. (a) I–IV are applications of the algorithm in different scenes; V–VIII are partly enlarged figures of I–IV, respectively. (b) Heatmap-based comparison of small versions among different YOLO models.
-
Model Precision (%) Recall (%) F1 score (%) mAP50–95 (%) YOLOv11-n 99.70 99.60 99.65 89.73 +DSWTC 99.65 99.86 99.75 90.07 YOLOv11-s 99.85 99.84 99.85 93.01 +DSWTC 99.86 99.77 99.81 93.29 YOLOv11-m 99.73 99.80 99.76 94.79 +DSWTC 99.79 99.88 99.83 95.26 YOLOv11-l 99.86 99.99 99.92 95.59 +DSWTC 99.83 99.96 99.90 95.69 Table 1.
Overall evaluation parameters of different-sized models on the test dataset before and after embedding the DSWTC module.
-
Image M N OA (%) I 49 49 100.00 II 49 47 95.92 III 49 48 97.96 IV 49 49 100.00 Average 98.47 -
Model P
(%)R
(%)F1
(%)mAP50–95
(%)Inference
speed (FPS)FLOPs
(G)Size
(MB)YOLOv11-DSWTC 99.86 99.77 99.81 93.29 166.16 22.00 9.83 YOLOv12 99.79 99.76 99.77 92.41 156.25 21.20 9.12 YOLOv13 99.92 99.76 99.84 93.47 125.58 20.70 9.00 Note: P, R, and F1 are precision, recall, and F1 score, respectively. FLOPs denotes floating-point operations. Table 3.
Comparison experiment with other small versions of YOLO.
Figures
(5)
Tables
(3)