










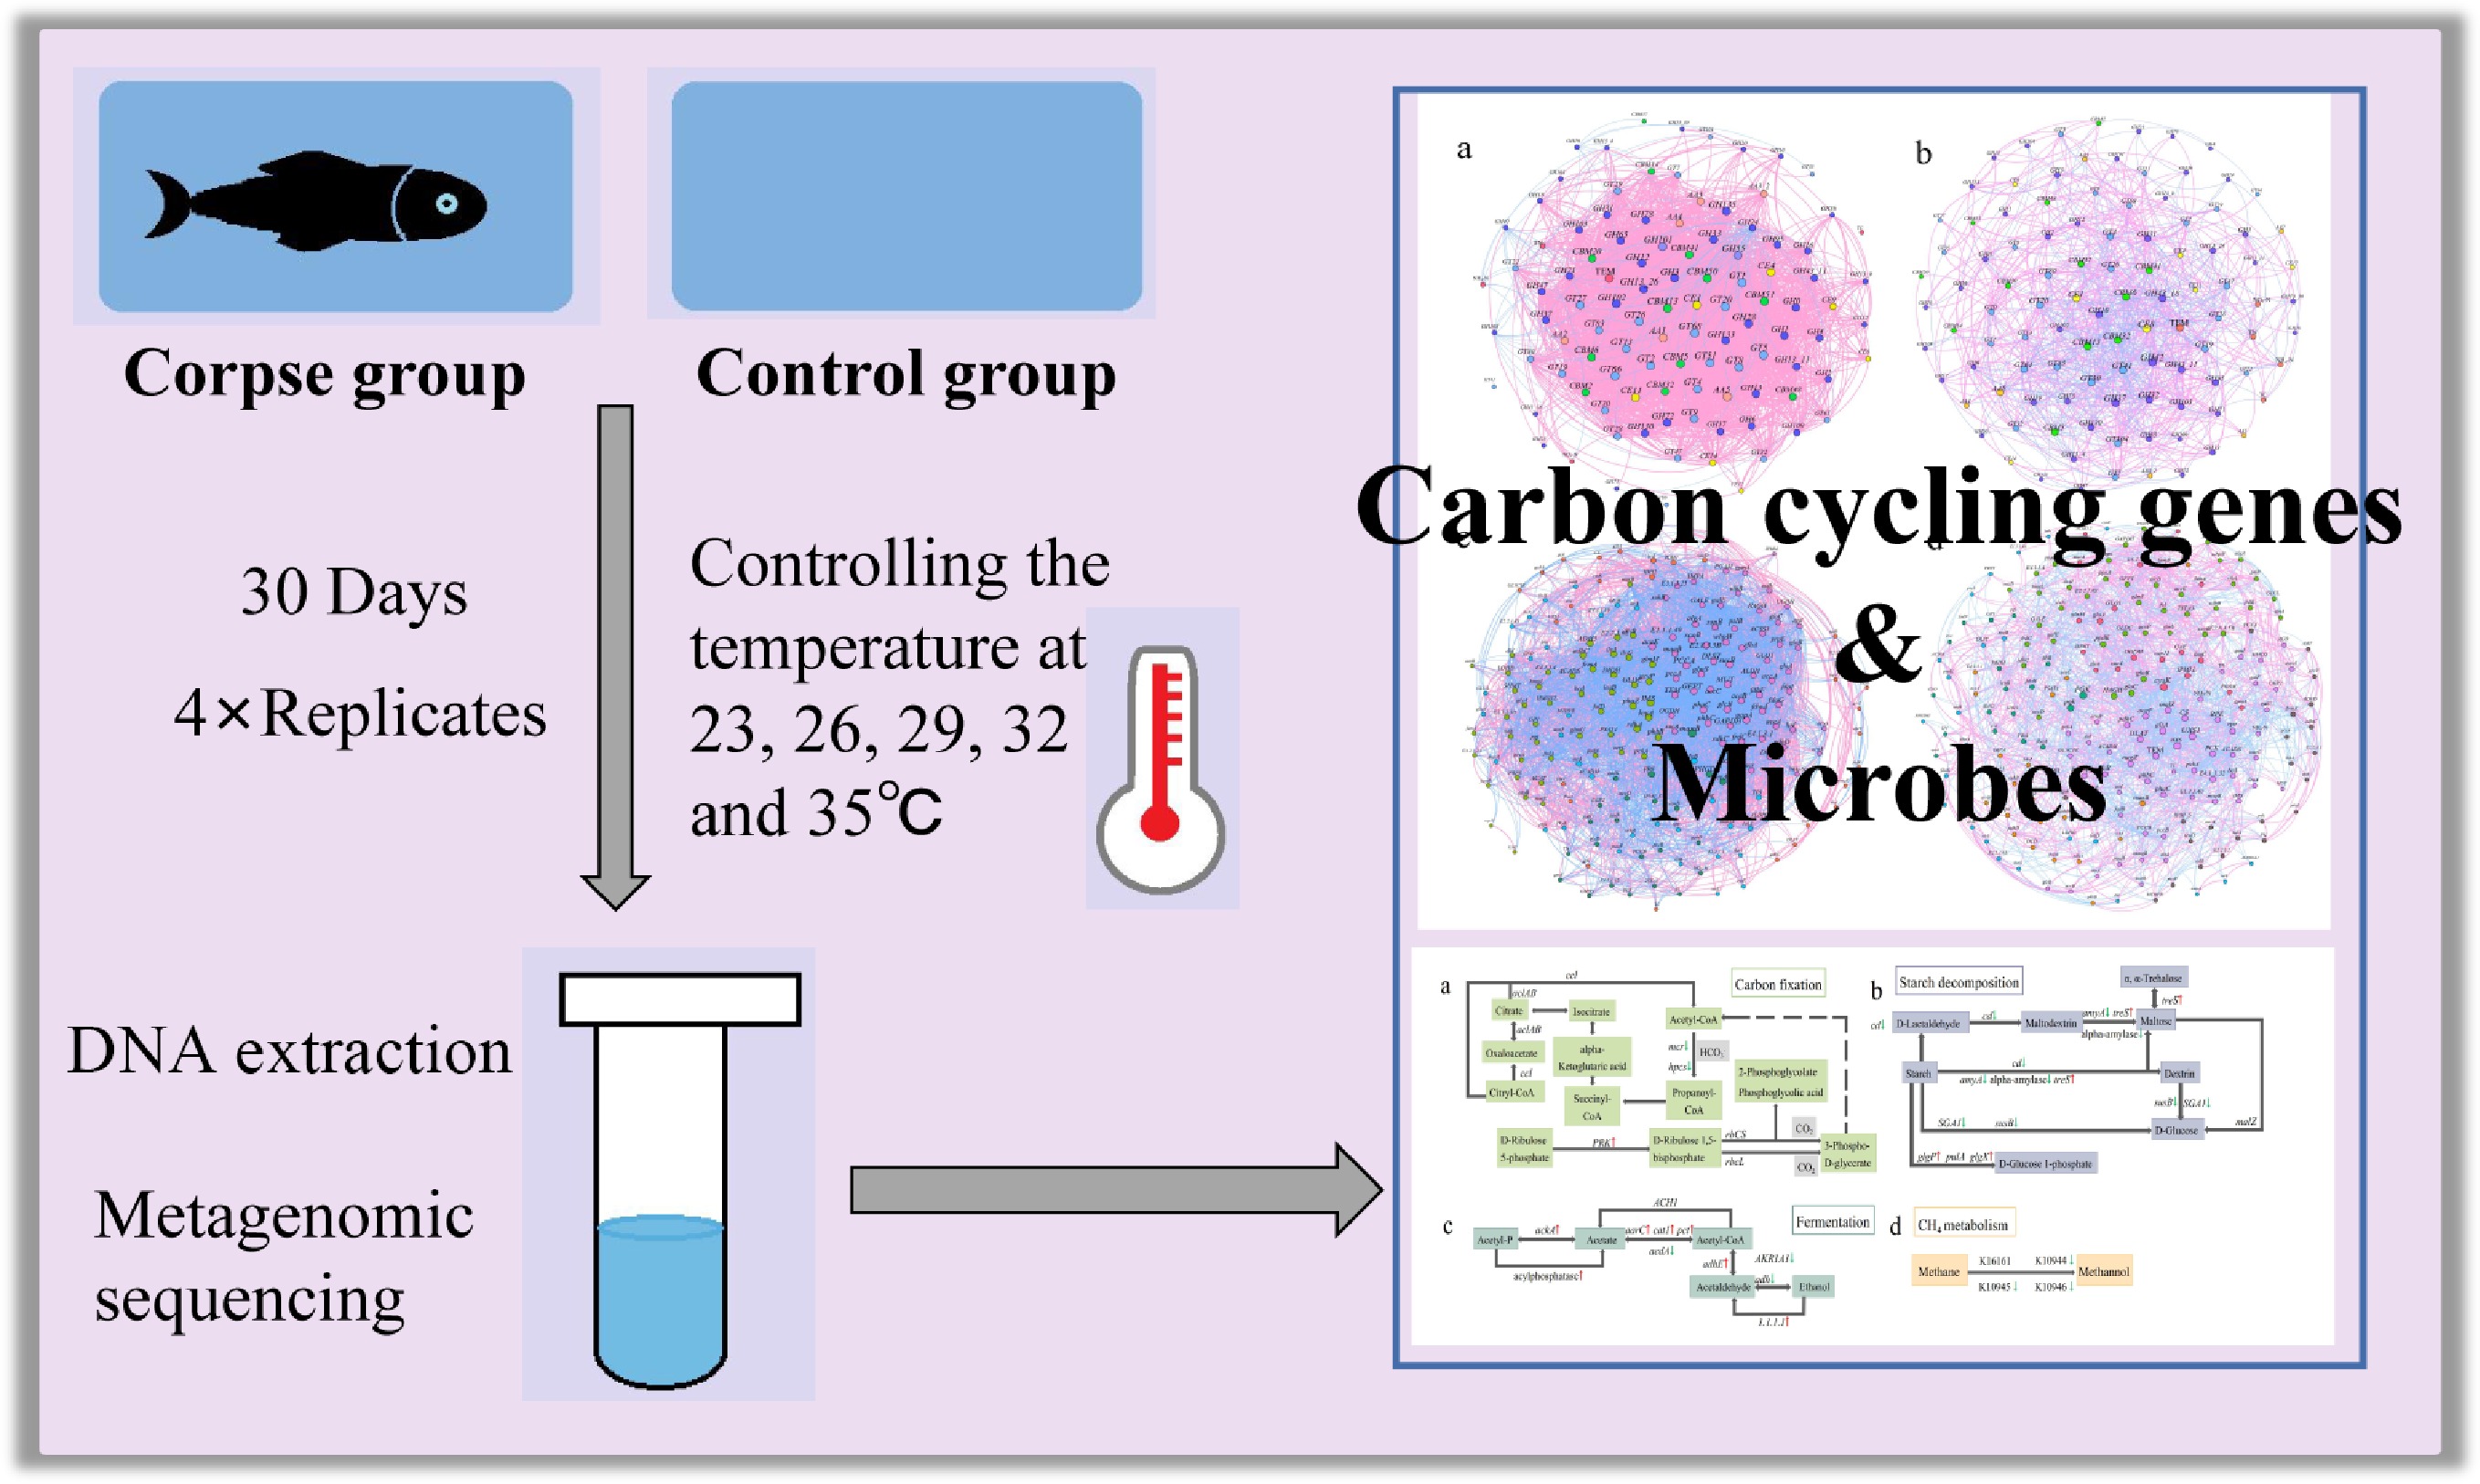



-
The death of animals, and the subsequent decomposition of corpses are key processes in nutrient release and transformation[1]. Annually, approximately 5,000 kg of animal cadavers are produced per square kilometer of soil[1]. During the process of corpse decomposition, scavengers[2] and insects[3−5] are attracted by volatile substances to feed on animal corpses. In addition, microorganisms such as bacteria and fungi contribute significantly to corpse decomposition, in both terrestrial and aquatic environments. Decomposers break down dead organic matter, generating energy to fuel their metabolic activities. Cadaveric fluids, such as polyamines, amines, benzene and its derivatives, released during corpse decomposition[6], significantly alter the physicochemical properties of the surrounding environment[7]. Accumulation of cadaveric substances in ecosystems deteriorates environmental quality[8], and further affects environmental microorganisms[9]. Cadaveric substances are rich in macro-elements, including oxygen, nitrogen, phosphorus, sulfur, and carbon, with carbon being a primary constituent of animal cellular structures. Approximately 20% of the carbon produced by an animal corpse can be released into the environment through decomposition processes[1], subsequently participating in the ecosystem carbon cycle.
Aquatic environments, including lakes, rivers, and oceans, serve as significant carbon reservoirs on Earth, accounting for more than half of global primary production[10−13]. Phytoplankton and other autotrophic microorganisms in aquatic environments absorb CO2 from the atmosphere through photosynthetic fixation[14], making them crucial contributors to carbon fixation[15]. Aquatic microorganisms participate in carbon degradation and contribute to ecosystem carbon budgets by decomposing organic matter and symbiosing with plants[16,17]. The fixation and release of carbon dioxide together drive the fundamental element cycle: the biogeochemical cycle of carbon. The genes encoding proteins that perform these functions are called carbon cycling genes. Previous studies have shown that there is a decoupling between functional genes, including carbon-cycling genes, and the microorganisms that carry them[18,19]. In other words, because functional genes are more sensitive to environmental changes and respond more rapidly, their abundance and composition may be disturbed by various environmental factors[20].
Many factors, such as pH[21], nutritional conditions[22], and oxygen content[23] can affect the microorganisms, but temperature plays an irreplaceable role[24,25] in shaping the microbial community. Recent studies[26,27] estimated that the global temperature may be 3 °C higher than the pre-industrial levels by AD 2100 due to increased industrial activity. Rising temperatures are expected to increase the frequency of extreme weather events[28], cause a sharp decline in biodiversity[29], accelerate the melting of polar ice sheets[30], and raise sea levels. The carbon cycle is also affected by temperature. Previous studies have reported that a temperature rise can lead to an increase in organic carbon mineralization rates[31,32] and, conversely, to a decrease in carbon sequestration potential[33]. In addition, the influence of temperature on microbes is more complicated. On the one hand, temperature affects microbial respiration, altering carbon storage, which in turn affects atmospheric carbon dioxide concentrations, and further enhances the greenhouse effect[34,35]. On the other hand, the capacity of microorganisms to recycle and utilize the crucial carbon element also plays an essential role in carbon fixation[36]. Temperature rise will directly or indirectly affect the composition and function of microbes, altering their metabolic activities (e.g., decomposition rates, reproduction, and mortality), and thus change the abundance and distribution of carbon cycle genes[34]. However, the effects of temperature and a carbon pulse (corpse decay) on genes involved in carbon cycling remain unclear. Therefore, it is necessary to examine the impact of temperature and corpse decay on genes involved in carbon cycling.
In this research, fish were employed as a model of decomposition, since they are widely distributed in water. Extensive screening for microorganisms involved in the carbon cycle was carried out using metagenomic sequencing. Based on the above studies, a hypothesis that increasing temperature is associated with a greater abundance of carbon-cycling genes, and that carcass decomposition facilitates the expression of carbon-degradation genes is proposed. To better illustrate this hypothesis, four scientific questions are put forward: (1) How do cadaver decay and temperature change carbon cycling genes and corresponding microorganisms? (2) Which Carbohydrate-Active Enzymes genes (CAZy) are most sensitive to temperature and corpse decay? (3) Which carbon cycling genes are correlated with the concentration of total carbon? Do they change synergistically with increasing temperature? (4) How do temperature and corpse decomposition affect the carbon circulation pathway?
-
The experimental study was conducted from April to May 2021 in Lanzhou, Gansu Province, China (36.03° N, 103.40° E). Twenty fish individuals of Cyprinus carpio haematopterus, with an average weight of 110.02 g, were purchased from a local aquatic marketplace to serve as decomposition models for investigating the effects of their carcass decay on the microbiome. Following euthanasia with an anesthetic (MS222, LOT: X21M9Y56602, Hunan Tiancheng Polymer Material Co., Changsha, China), all 20 fish corpses (including internal organs) were randomly placed in 20 plastic boxes containing water samples collected from the Lanzhou section of the Yellow River (36.07° N, 103.86° E). An additional set of 20 boxes, each filled with 40 L of Yellow River water without any carcasses, served as negative controls. All boxes were identical in size (0.58 m × 0.45 m × 0.30 m) and were covered with transparent plastic film to prevent contamination by external microorganisms. Before use, all boxes were thoroughly cleaned with sterile water and disinfected with ethanol.
The 20 boxes containing fish corpses were set as the experimental (corpse) group (E group), while the remaining 20 boxes served as the control group (T group). A sterile underwater heater (CN-008-200W, Chuang Ning, China) was placed in each box to adjust the temperature. The 20 boxes in the experimental group were divided into five temperature gradients (23, 26, 29, 32, and 35 °C), with four replicates at each temperature. The control group also received the same temperature treatment. The average room temperature was 18 °C, and the relative humidity was 10%. The experiment lasted 30 d until complete decomposition was achieved. The experimental process lasted until all soft tissues were completely degraded, leaving only the skeleton, which could not be degraded. Our previous study[37] presented photographs of the decomposition processes under different temperatures.
In total, 2.5 L of water samples were collected at the terminal stage from each box and filtered through 5 μm and 0.22 μm cellulose membranes (Merck Millipore, USA) to remove impurities and concentrate the microbiome. The 40 obtained samples were sealed in sterile plastic tubes and then immediately stored at −40 °C. The cellulose membranes (0.22 μm) were cut into pieces with sterile scissors for the following experiment to facilitate DNA extraction. DNA was extracted using the DNeasy® PowerSoil® Kit (QIAGEN, Germany). DNA concentration was measured using a Nanodrop 2000 Spectrophotometer (Thermo Scientific, Waltham, MA, USA). Approximately 120 mL of water samples were collected for subsequent measurement of physicochemical properties.
Analysis of physicochemical properties
-
Water physicochemical properties were measured: ammonium nitrogen (NH4-N), total carbon (TC), total nitrogen (TN), nitrate nitrogen (NO3-N), inorganic phosphorus (IP), organic phosphorous (OP), total sulphur (TS), total dissolved solids (TDS), pH, conductivity (CON), salinity (SALT), oxidation-reduction potential (ORP), and dissolved oxygen (DO). The original data of physicochemical properties are shown in Supplementary Table S1. More physicochemical properties are described in previous research[37].
Metagenomic sequencing and analysis
-
More detailed metagenomic methods were described in our previous research[37]. The extracted DNA was used for metagenomic sequencing. From each sample, we retrieved 50.9 million high-quality sequences. Aligning against the NCBI NR database through DIAMOND v 0.7.12, the functional annotations of unigenes were annotated via two databases: Carbohydrate-Active Enzyme (CAZy,
www.cazy.org ) and Kyoto Encyclopedia of Genes and Genomes (KEGG,www.kegg.jp/dbget )[38,39]. The CAZy genes belonged to six classes: glycosyl transferase (GT), glycoside hydrolase (GH), carbohydrate esterase (CE), auxiliary activity redox enzymes (AA), polysaccharide lyase (PL), and carbohydrate-binding modules (CBMs). The KEGG database includes genes associated with environmental information processing, genetic information processing, cellular processes, metabolism, and human diseases. Then, the KEGG genes were categorized into different KEGG orthologs (KO) based on their functions. A total of 439 CAZy genes and 685 carbon cycling KO entries were obtained. Based on previous studies, to further explore the functional units of CAZy genes, they were divided into nine categories based on their functions in decomposing specific carbohydrates: starch, carbohydrate esters, pectin, lignin, chitin, cellulose, oligosaccharides, debranching enzymes, and hemicellulose[40,41]. The details of the classification method and all references are provided in Supplementary Table S2.Statistical analysis
-
The rank-sum (Mann-Whitney U) test was used to compare the significant differences in alpha diversity (observed species) using SPSS 26.0 (SPSS Inc., Chicago, IL, USA) among the control and experimental groups[42]. Beta diversity was visualized using principal coordinates analysis (PCoA) based on Bray-Curtis and Jaccard distance matrices[43]. The two calculations were based on independent OTUs; namely, no evolutionary link was assumed to exist between OTUs. However, the Jaccard distance matrix only reflects the existence of species, while the Bray-Curtis distance matrix also includes information on species abundance. The correlation between temperature and the relative abundance of carbon cycling genes was produced by linear regression and curve fitting[44,45]. All figures were generated using Origin 2018 (OriginLab, Northampton, USA). Using R4.1.3, analysis of variance (ANOVA) was used to compare the relative abundance differences between the control and experimental groups[46]. Permutational multivariate analysis of variance (PERMANOVA) and multiple regression matrix (MRM) were used to estimate the effects of environmental factors (TC, TN, NO3-N, NH4-N, IP, OP, TS), and treatment (corpse and temperature) on the carbon cycling gene profile[47]. The packages 'pheatmap' and 'heatmap' were employed to reveal the relative abundance of CAZy genes and carbon cycling genes[48], respectively. Gephi 0.9.2 was used to construct the networks[49,50]. To estimate the co-occurrence relationships among carbon cycling genes (|r| > 0.5), the top 200 carbon cycling genes with the highest relative abundance and physicochemical properties were included, and the topological parameters of the networks were also calculated. Six parameters (including average path length, average degree, diameter, modularity, density, and average clustering coefficient) were chosen to evaluate the characteristics of these networks[51]. The carbon cycle pathway was established by the KEGG PATHWAY database (
www.kegg.jp/kegg/pathway.html )[52]. -
In this study, the identified microorganisms carrying carbon cycling genes included bacteria, eukaryotes, viruses, and archaea, among which bacteria accounted for an average of 99.81% across all samples, indicating they were the dominant group (Supplementary Table S3). The composition of carbon-cycling microbes at the phylum and genus levels is shown in Fig. 1a, b. The phylum Proteobacteria was the most dominant in all samples (Fig. 1a). The results showed that phyla Acidobacteria, Actinobacteria, Chloroflexi, Spirochaetes and Firmicutes increased in the T group, while the relative abundance of Verrucomicrobia and Proteobacteria increased in the E group (p < 0.05). Some genera showed an increase in relative abundances of Novosphingobium, Betaproteobacteria (UG), Acidovorax and Nocardioides (Fig. 1b) (one-way ANOVA, p < 0.05). The temperature had significant effects on the proportions of Spirochaetes, Cyanobacteria, Bacteroidetes, and Actinobacteria, while corpse decay significantly affected all phyla except Planctomycetes and Bacteroidetes (Supplementary Table S4, two-way ANOVA, p < 0.05). The temperature significantly changed the relative abundance of Polynucleobacter, Sphingobium, Actinobacteria (UG), Betaproteobacteria (UG), and Acidimicrobiaceae (UG) at the genus level. Corpse decomposition also enriched many genera, such as Novosphingobium, Acidovorax, and Nocardioides (Supplementary Table S5; two-way ANOVA, p < 0.05).
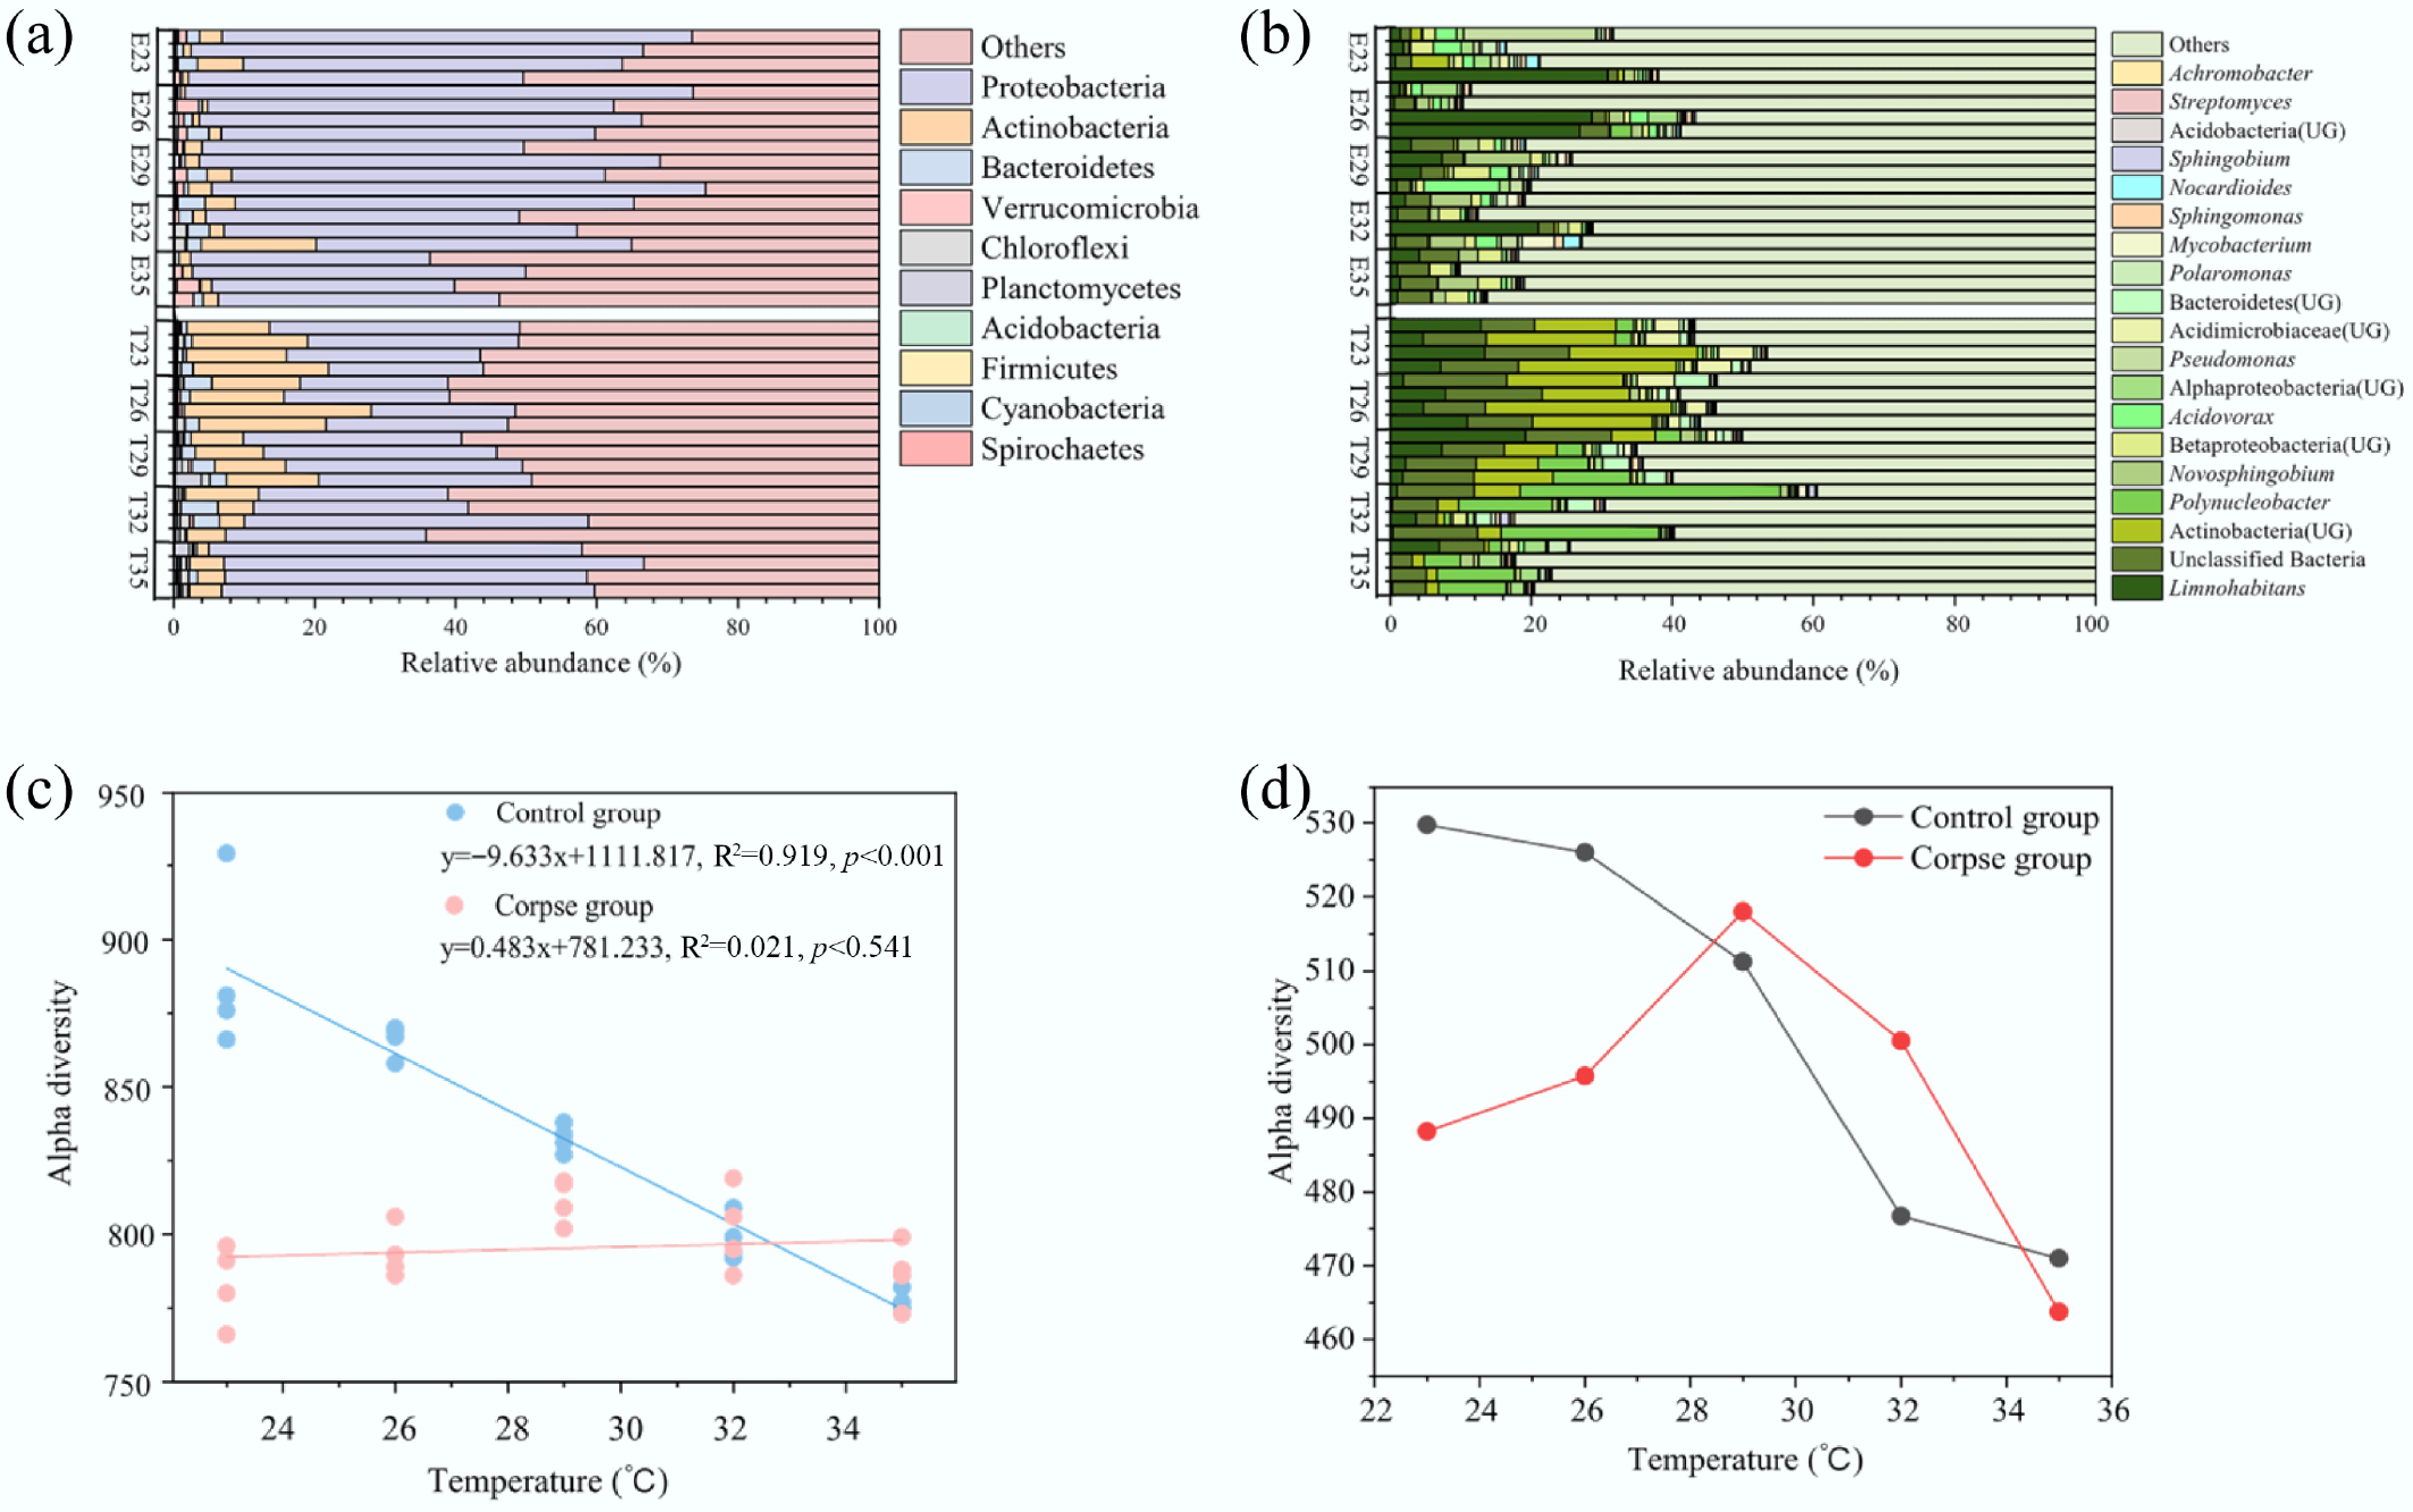
Figure 1.
Carbon cycling bacterial community composition at the (a) phylum, and (b) genus level in the control and experimental groups. Only dominant genera with the top 10 highest mean relative abundance are shown. (c) The result of linear fitting showed the relationship between alpha diversity of CAZy genes and temperature. The results of linear fitting and p value are listed on the figures, and p < 0.05 indicates significant difference. (d) A line chart revealed the change trend of alpha diversity of carbon cycling KO genes. Abbreviations: E, experimental groups; T, control groups.
Effects of corpse decay on carbon cycling genes
-
Observed species of carbon cycling KOs are shown in Fig. 1d. Treatments with cadavers showed an unimodal distribution, with the highest alpha diversity at 30 °C. The results of PCoA showed that the beta diversity of carbon cycling KOs was affected by carcass decay (Fig. 2a, b; Supplementary Table S6, PERMANOVA, p < 0.05).
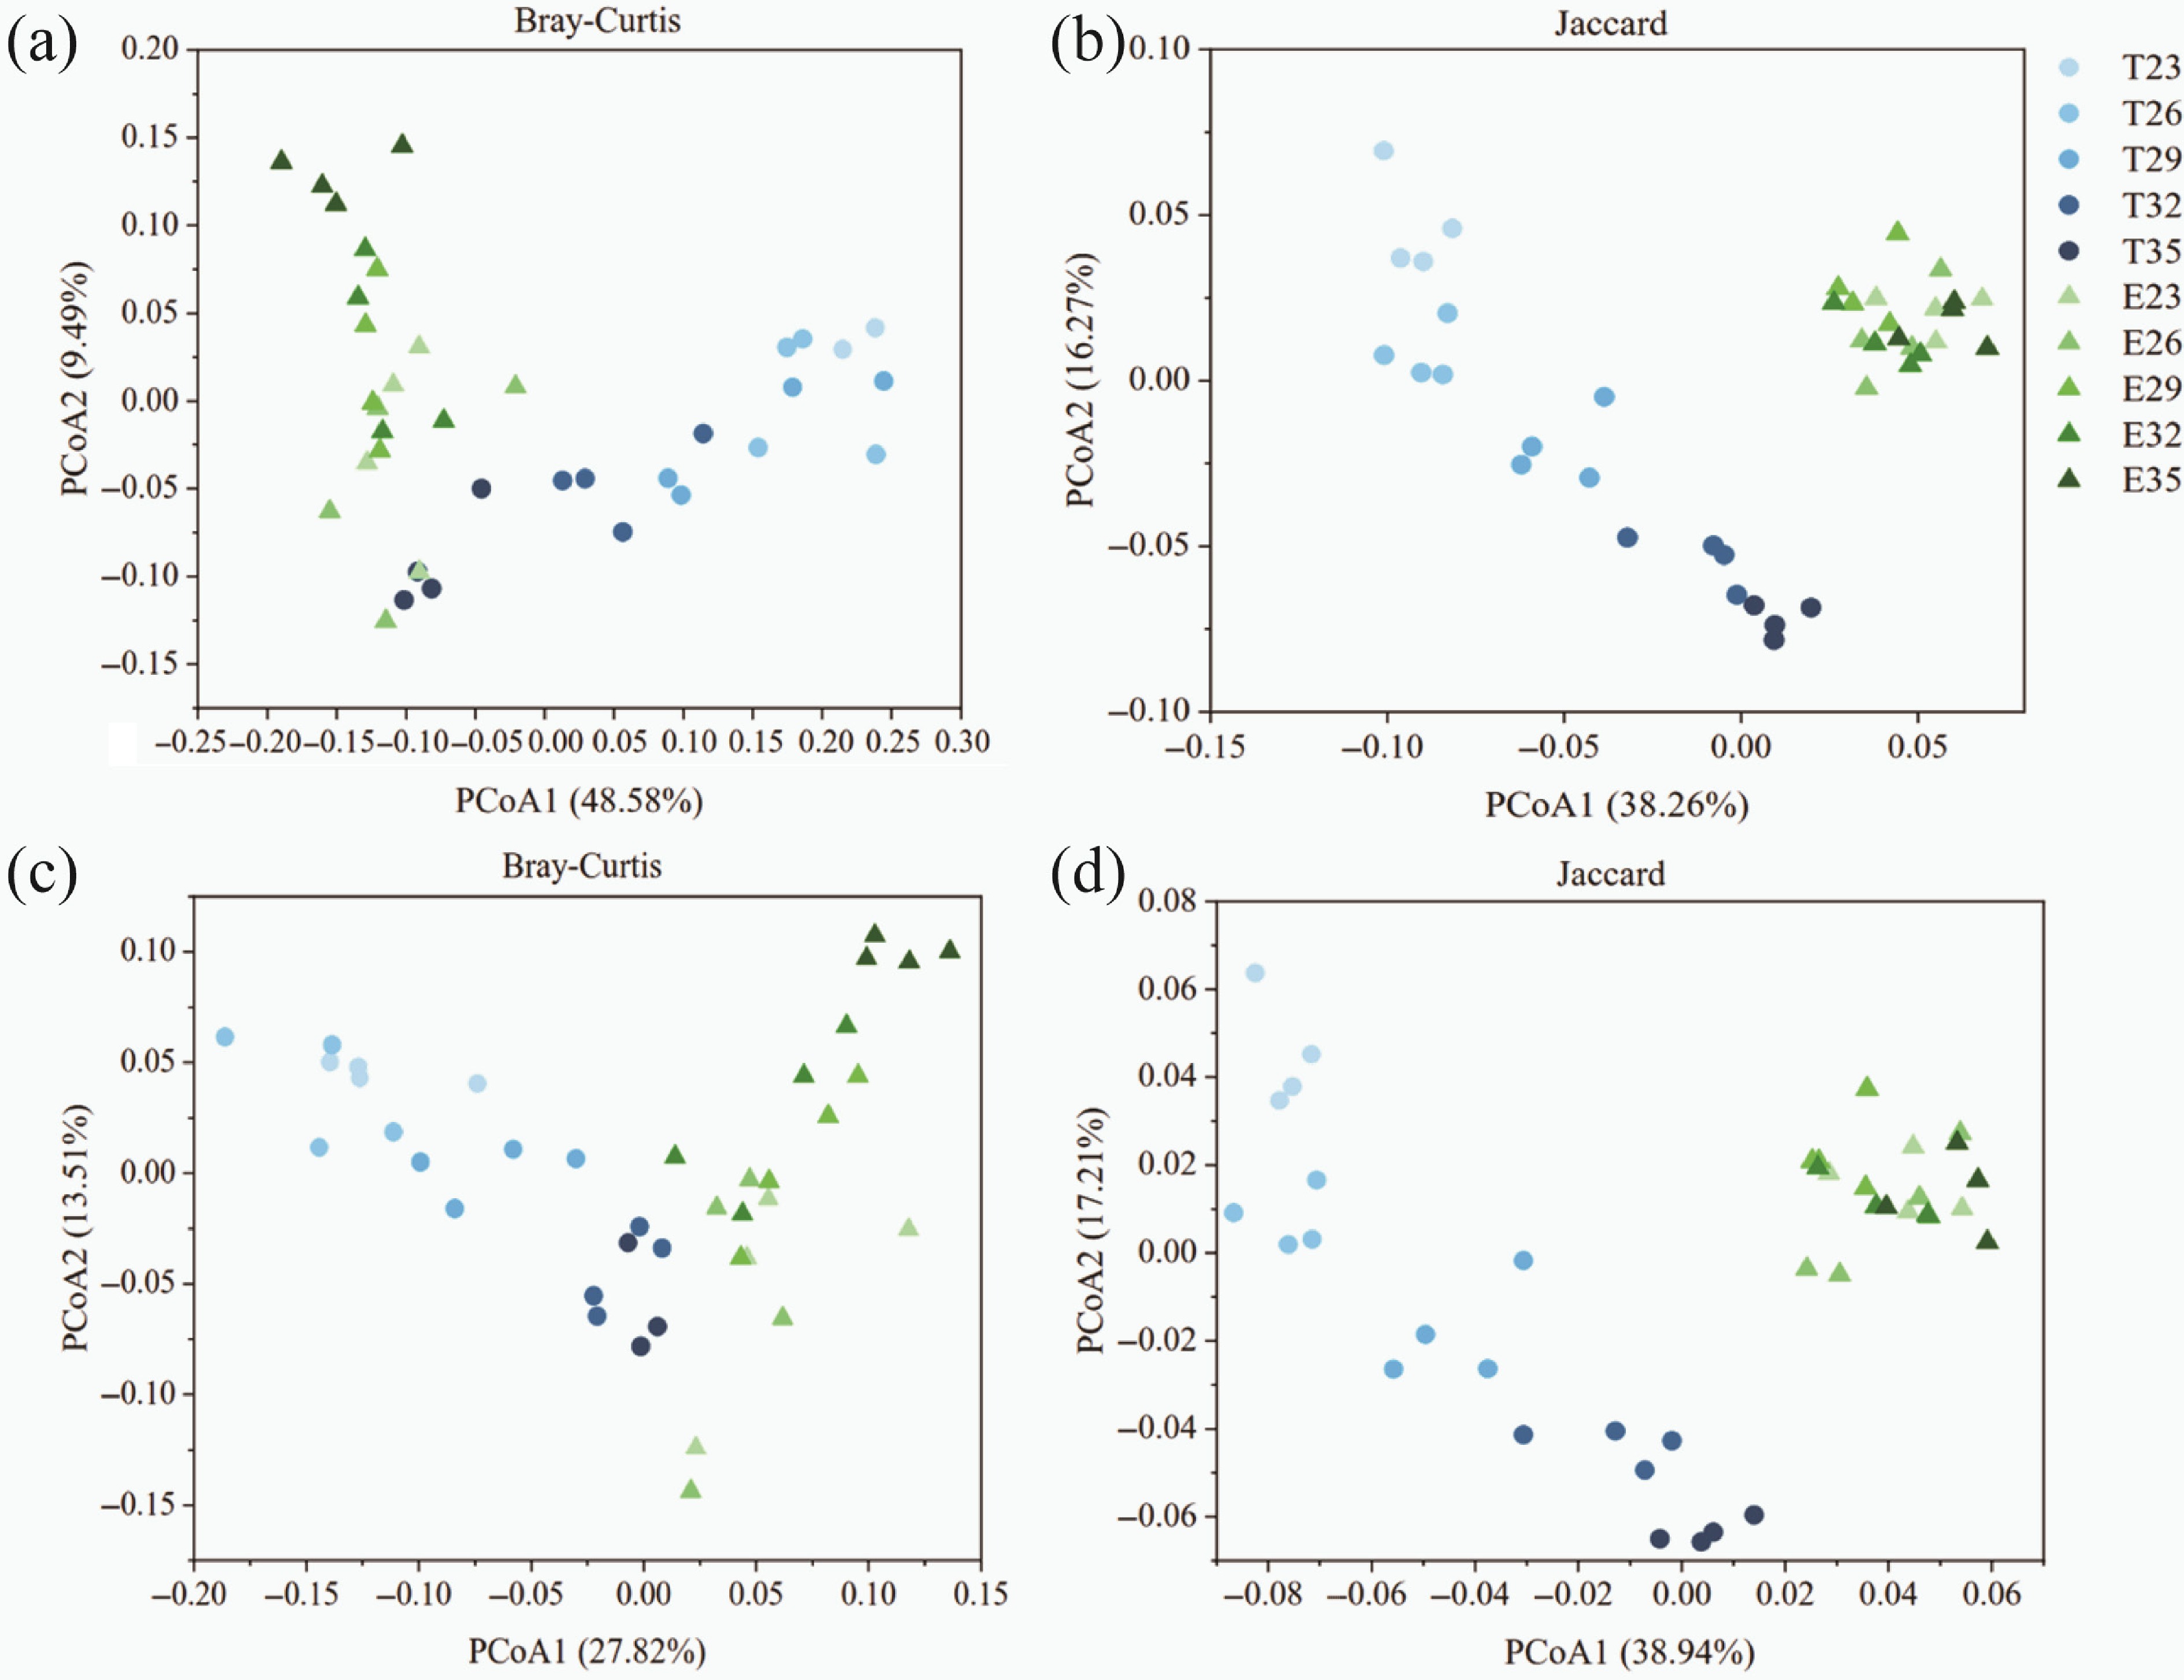
Figure 2.
Principal coordinate analysis (PCoA) of carbon cycling (a), (b) KO, and (c), (d) CAZy genes based on (a), (c) Bray-Curtis, and (b), (d) Jaccard distance matrices. Each point represented the average PCoA values of the corresponding dimension of each group. The blue color represented the control groups, and green represented experimental groups. The color from light to dark reflected the temperature rise. Abbreviations: E, experimental groups; T, control groups.
Lefse analysis was employed to identify carbon cycling KOs with significant differences in distribution across conditions (Supplementary Figs S1−S3). A total of 40 carbon cycling KOs enriched in the control and the corpse groups were selected from all carbon cycling KOs (Supplementary Fig. S1). The carbon cycling KOs in the cadaver groups mainly focused on carbon degradation pathways, such as the reduction of the citric acid cycle, the ethylmalonyl pathway, gluconeogenesis, the dicarboxylate-hydroxybutyrate cycle, and the reduction of the pentose phosphate cycle.
The top 10 CAZy genes with the highest TPM abundance were selected in Supplementary Fig. S4, which were dominated by GTs and increased in the E group (one-way ANOVA, p < 0.05). Figure 3 shows the distribution of these CAZy enzyme genes in the experimental groups (Fig. 3b). The dominant genes were GT2, GT4, CBM50, GH23, and GT51. Then, 327 CAZy genes with statistically significant differences between control and experimental groups were selected (one-way ANOVA, p < 0.05). Among them, the top 20 with the highest relative abundance are shown in Supplementary Fig. S5 and also dominated by GTs and GHs. Most of these genes were enriched in experimental groups.
The effects of temperature on carbon cycling genes
-
The control group showed that alpha diversity of carbon cycling genes was negatively related to temperature (Fig. 1d). The PCoA results showed that beta diversity of carbon cycling KOs was affected by temperature (Fig. 2a, b; Supplementary Table S6, PERMANOVA, p < 0.05). There were correlations between temperature and 344 KOs, including 224 positive and 120 negative correlations, accounting for 50.37% of the total 683 KOs (Supplementary Fig. S6). Under different temperature conditions, the carbon cycling KOs enriched with main functions focused on carbon degradation, including glycolysis and pyruvate oxidation (Supplementary Fig. S3). Several KOs showed sensitivity to the temperature range. K01711, K01681, and K00012 were enriched in the low temperature (23−26 °C), while K03821 and K01069 were enriched in the higher temperature (32−35 °C).
The linear fitting results for alpha diversity revealed a significant variation in CAZy gene diversity with temperature (Fig. 1c). The alpha diversity of the control group decreased significantly with rising temperature (p < 0.001), whereas the corpse group showed no significant change. For beta diversity, in the control groups, there was a remarkable discrepancy among different temperature gradients (Fig. 2c, d; Supplementary Table S7; PERMANOVA, p < 0.05). Nonetheless, this temperature change was not observed in the experimental groups (PERMANOVA, p > 0.05). The dominant CAZy enzyme genes in the control groups were the same as those in the experimental groups (Fig. 3a). Temperature was an essential factor, accounting for 37.59% of CAZy genes; 28.25% were positively and 9.34% were negatively related to temperature (Supplementary Fig. S6). For CAZy genes with significant differences in abundance between the control and experimental groups, relative abundance increased with rising temperature, except for GH19 and GT0 (Supplementary Fig. S5).
The CAZy genes were divided into six classes to reflect the microbial potential for organic carbon degradation and biosynthesis: GHs, GTs, CEs, CBMs, PLs, and AAs. The relative abundance of GTs, CBMs, CEs, AAs, and GHs increased significantly with the increase of temperature (Supplementary Figs S7 and S8, one-way ANOVA, p < 0.05), outside of PLs (one-way ANOVA, p > 0.05). Then, a two-way ANOVA was used to explore the effects of carcass decay and temperature on CAZy genes (Supplementary Table S8). The relative abundance of GTs, GHs, CEs, CBMs, and AAs was significantly affected by temperature and corpse decomposition (two-way ANOVA, p < 0.05). PLs were neither affected by corpse decay nor temperature (two-way ANOVA, p < 0.05).
Based on previous research[38], 92 CAZy genes were selected and classified into nine categories according to their functions in decomposing specific carbohydrates (Fig. 4). The network analysis showed the linkages and affiliations among these CAZy genes. The proportion of these genes is shown in Supplementary Fig. S9. The heatmap showed that most of the genes were enriched in the experimental groups. Linear fitting showed that the relative abundance of CAZy genes decomposing starch, carbohydrate esters, pectin, lignin, chitin, cellulose, oligosaccharides, debranching enzymes, and hemicellulose were positively related to temperature in the control groups (Fig. 5, p < 0.001). In the experimental group, only the CAZy genes decomposing carbohydrate esters showed a positive correlation with temperature (Fig. 5b, p < 0.05). Furthermore, the average relative abundance of CAZy genes in the E group was higher than in the T group across all samples.
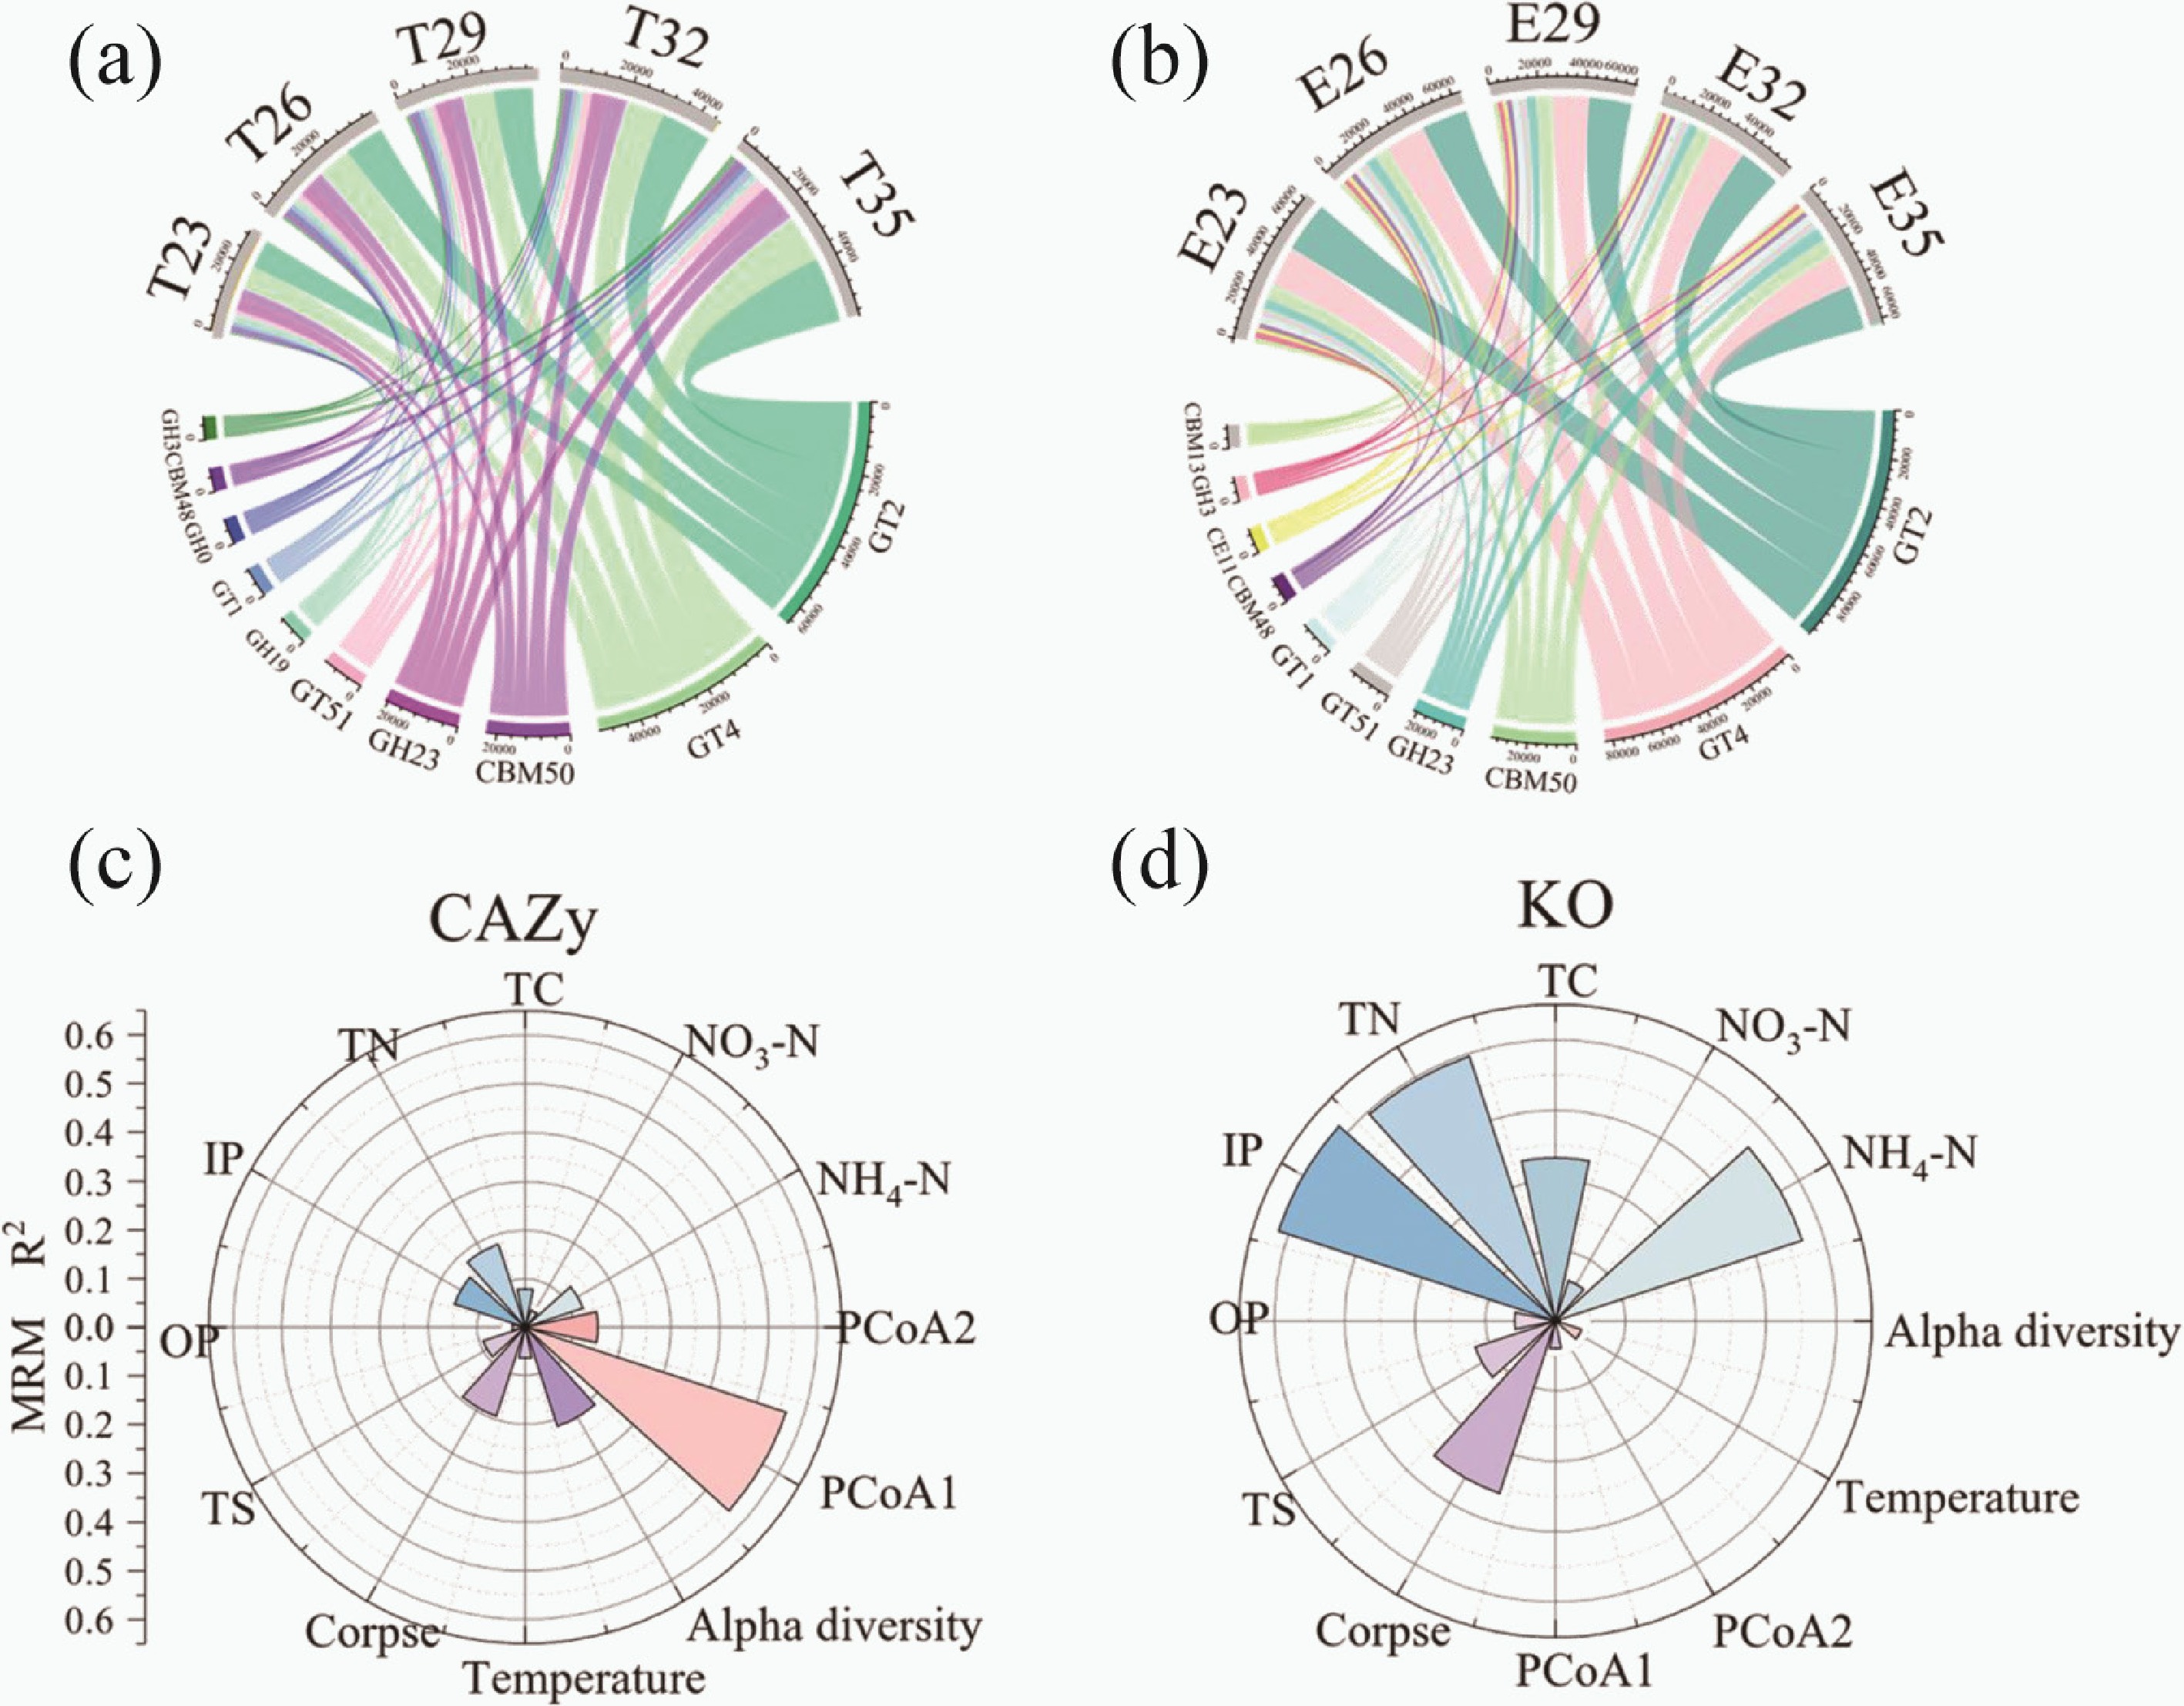
Figure 3.
The chord diagram showed the distribution of the 10 CAZy genes with the highest TPM (transcripts per million) abundance in the (a) control groups, and the (b) experimental groups. Multiple regression matrices (MRM) showing the relative contribution (R2) of these factors for (c) CAZy, and (d) carbon cycling KO genes based on the Bray-Curtis distance metrics. Only the factors with p value < 0.05 are shown. Abbreviations: E, experimental groups; T, control groups; TN, total nitrogen; TC, total carbon; IP, inorganic phosphorus; OP, organic phosphor; TS, total sulphur.
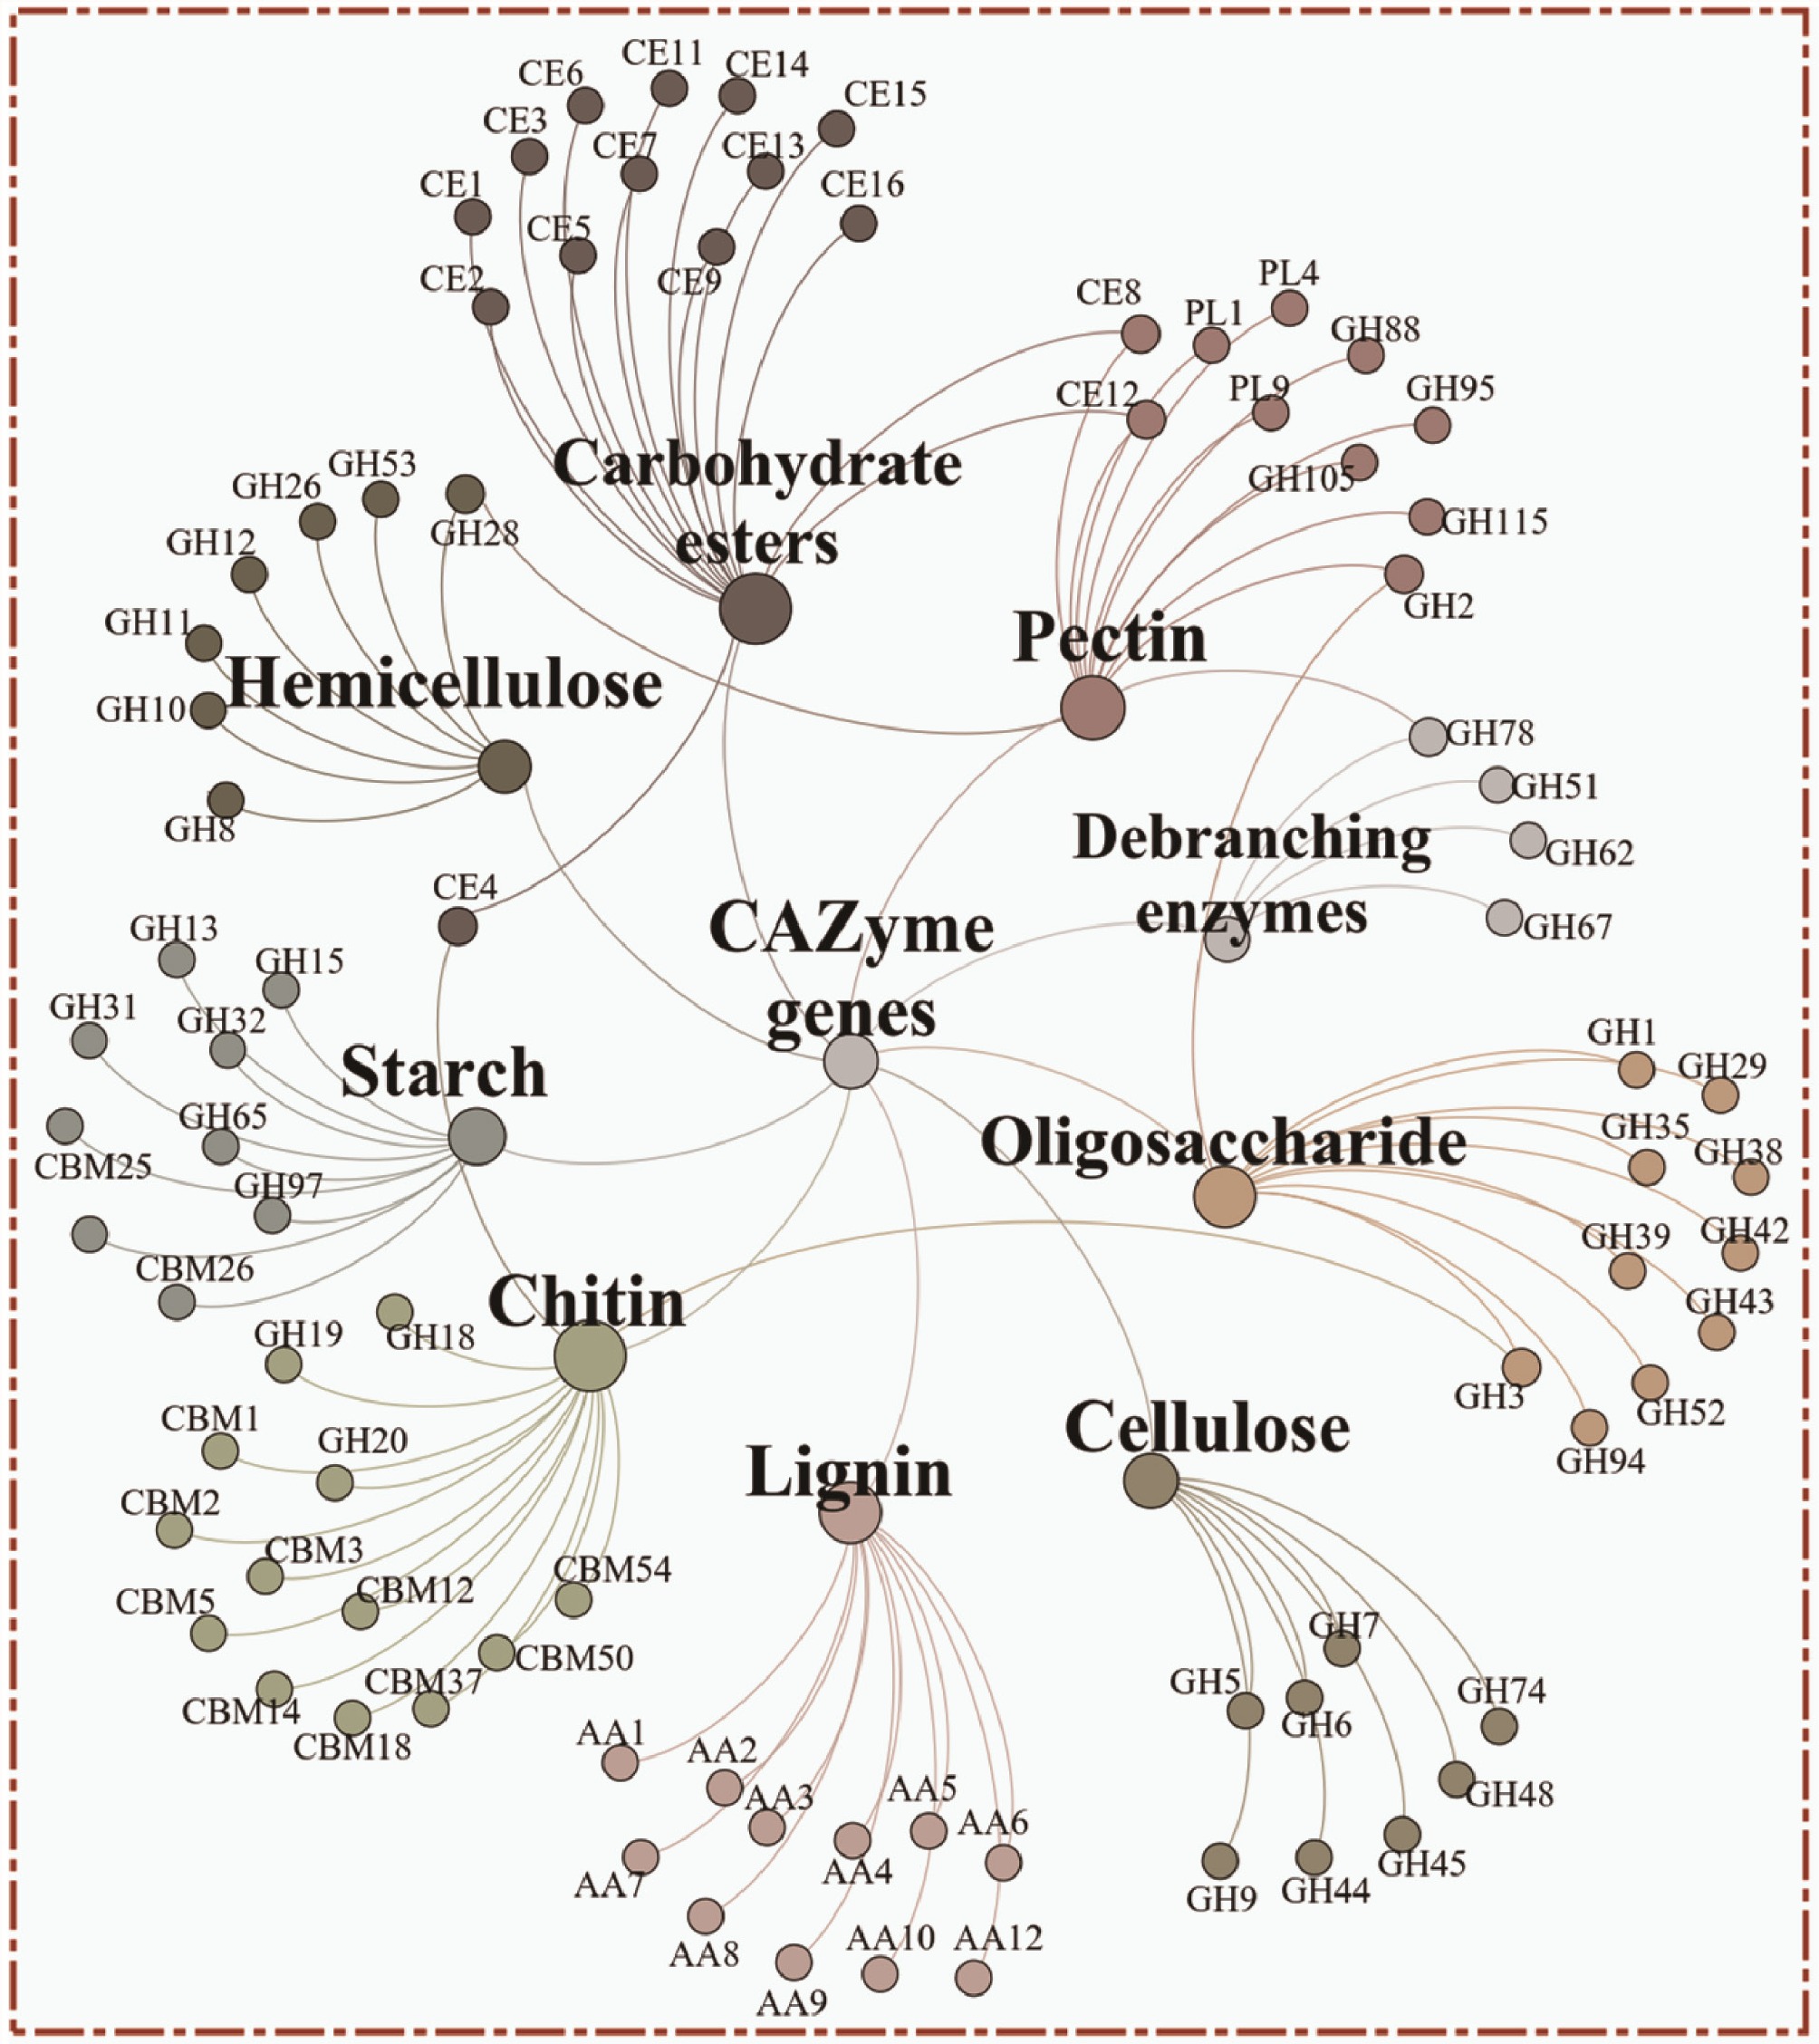
Figure 4.
Network analysis showing the carbohydrate decomposition genes of starch, carbohydrate esters, pectin, lignin, chitin, cellulose, oligosaccharide, debranching enzymes, and hemicellulose.
Main driving factors of carbon cycling genes
-
It was found that TC in the experimental groups increased by 86.6%, while temperature did not (one-way ANOVA, p < 0.05). For the driving factors of carbon cycling KOs entry, PERMANOVA showed that carbon cycling KOs were significantly affected by temperature, corpse, microbes, and physicochemical properties (except TN, OP, and TS) (PERMANOVA, p < 0.05; Supplementary Table S9). For the structure of carbon cycling KOs, MRM was used to calculate the relative contributions of the influential factors (MRM, p < 0.05; Supplementary Table S10, Fig. 3d). Physicochemical factors (NH4-N, NO3-N, TC, TN, TS, IP, and OP) significantly affected the structure of the carbon cycling KOs community (p < 0.05). However, microbes had little effect on the structure of the carbon cycling KOs community (p > 0.05). In addition, these factors were divided into four classes (temperature, corpse, microbes, and environmental factors). It was found that the environmental factor was the most essential factor (R2 = 0.399, p < 0.001), followed by corpse (R2 = 0.258, p < 0.001), and temperature (R2 = 0.040, p < 0.01). The results confirmed that there was no relationship between the microbes and the carbon cycling KO genes (MRM, p > 0.05; Supplementary Table S11).
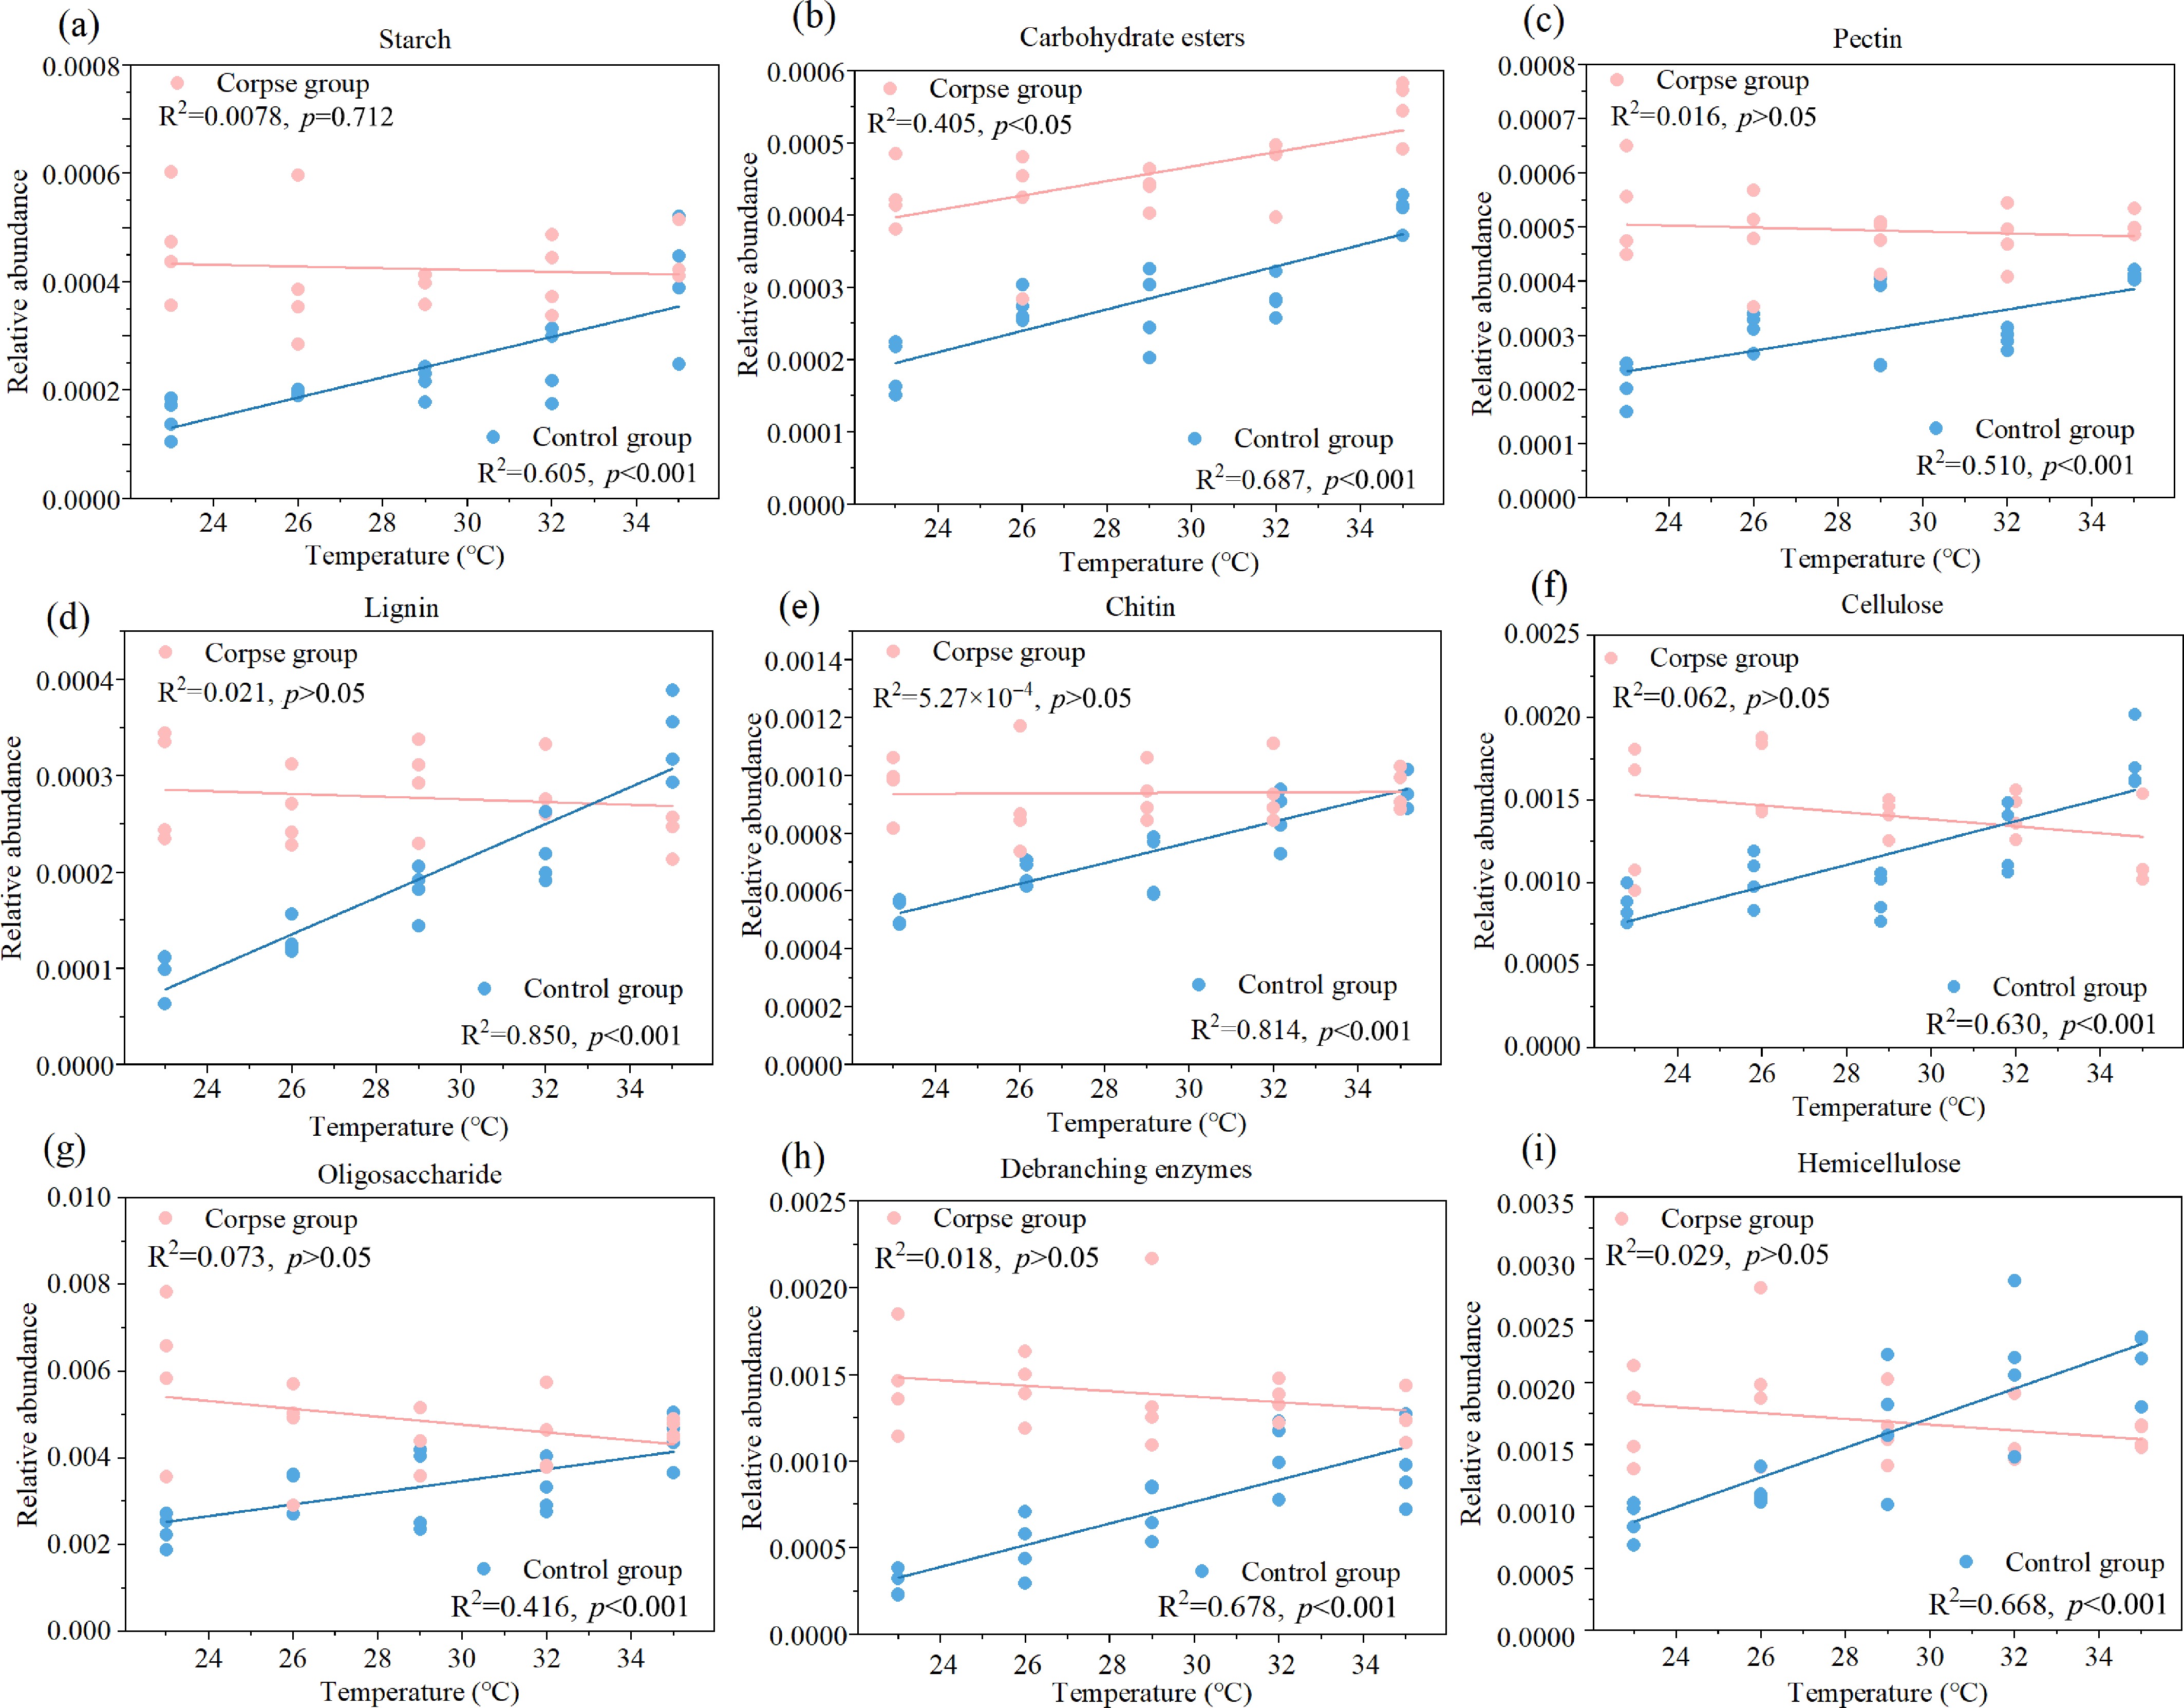
Figure 5.
The linear fitting graphs revealed the interrelationship between relative abundance of nine kinds of carbohydrate decomposition genes—(a) starch; (b) carbohydrate esters; (c) pectin; (d) lignin; (e) chitin; (f) cellulose; (g) oligosaccharide; (h) debranching enzymes; (i) hemicellulose, and temperature in control (blue) and experimental groups (pink). The results of linear fitting and p value were listed on the figures, and p < 0.05 indicates significant difference.
The heatmap shows that the relative abundance of CAZy genes was related to physicochemical properties (Supplementary Fig. S10). The concentration of NH4-N was positively correlated with six levels of 1 CAZy genes (p < 0.05). The concentration of TC was positively associated with GHs, GTs, CBMs, CEs, and PLs. There were positive correlations between TN concentration and most CAZy genes (GHs, GTs, CBMs, CEs, and AAs) (Supplementary Fig. S10; p < 0.05). Furthermore, the correlations between CAZy genes that decompose specific carbohydrates and physicochemical properties were also calculated and depicted in a heatmap (Supplementary Fig. S11). Most CAZy genes were positively associated with NH3-N, TC, and TN (p < 0.05). Based on the above results, the TC concentration and the relative abundance of CAZy genes were further linearly fitted (Supplementary Fig. S12). Except for AAs, TC concentration was positively correlated with GHs, GTs, CBMs, CEs, and PLs (Supplementary Fig. S12a−S12f; p < 0.05). Furthermore, TC was positively related to the relative abundance of CAZy gene groups that decompose carbon-containing organic compounds (except lignin, cellulose, and hemicellulose) (Supplementary Fig. S12g−S12o; p < 0.05). To select the specific CAZy genes related to TC, the CAZy genes with relative abundance of the top 100 were included in the network analysis (Supplementary Fig. S13; p < 0.05, |r| > 0.5). It was found that the following four CAZy genes (GH2, GH31, GT4, and GT35) were positively correlated with TC concentration (Supplementary Fig. S13).
In addition, PERMANOVA was used to assess the effects of influential factors on CAZy genes (Supplementary Table S9). It can be seen that temperature, corpse decay, NH4-N, TC, TN, IP, alpha and beta diversity of carbon cycle microorganisms were significantly related to the relative abundance of CAZy genes (PERMANOVA, p < 0.05). The result of MRM showed that temperature, corpse decay, NH4-N, NO3-N, TC, TN, IP, OP, TS, alpha and beta diversity had significant effects on the structure of CAZy genes (Fig. 3c, Supplementary Table S10; p < 0.05). Then, these influential factors were classified into four categories: temperature, corpse decomposition, microbes (alpha and beta diversity), and environmental factors (physicochemical properties) (Supplementary Table S11). The four factors had a significant impact on the structure of CAZy genes (MRM, p < 0.001). Microbes contribute the most (R2 = 0.220), followed by corpse decay (R2 = 0.193), environmental factor (R2 = 0.156), and temperature (R2 = 0.064).
Co-occurrence network analysis of carbon cycling genes
-
Network analysis showed that relationships among the carbon cycling KOs genes (Fig. 6c, d). To estimate the variety caused by cadaver decomposition, six network topology parameters were used (Supplementary Table S12). The more intense interrelationships were observed in the control groups, whereas the networks in the experimental groups showed more pronounced modularity.
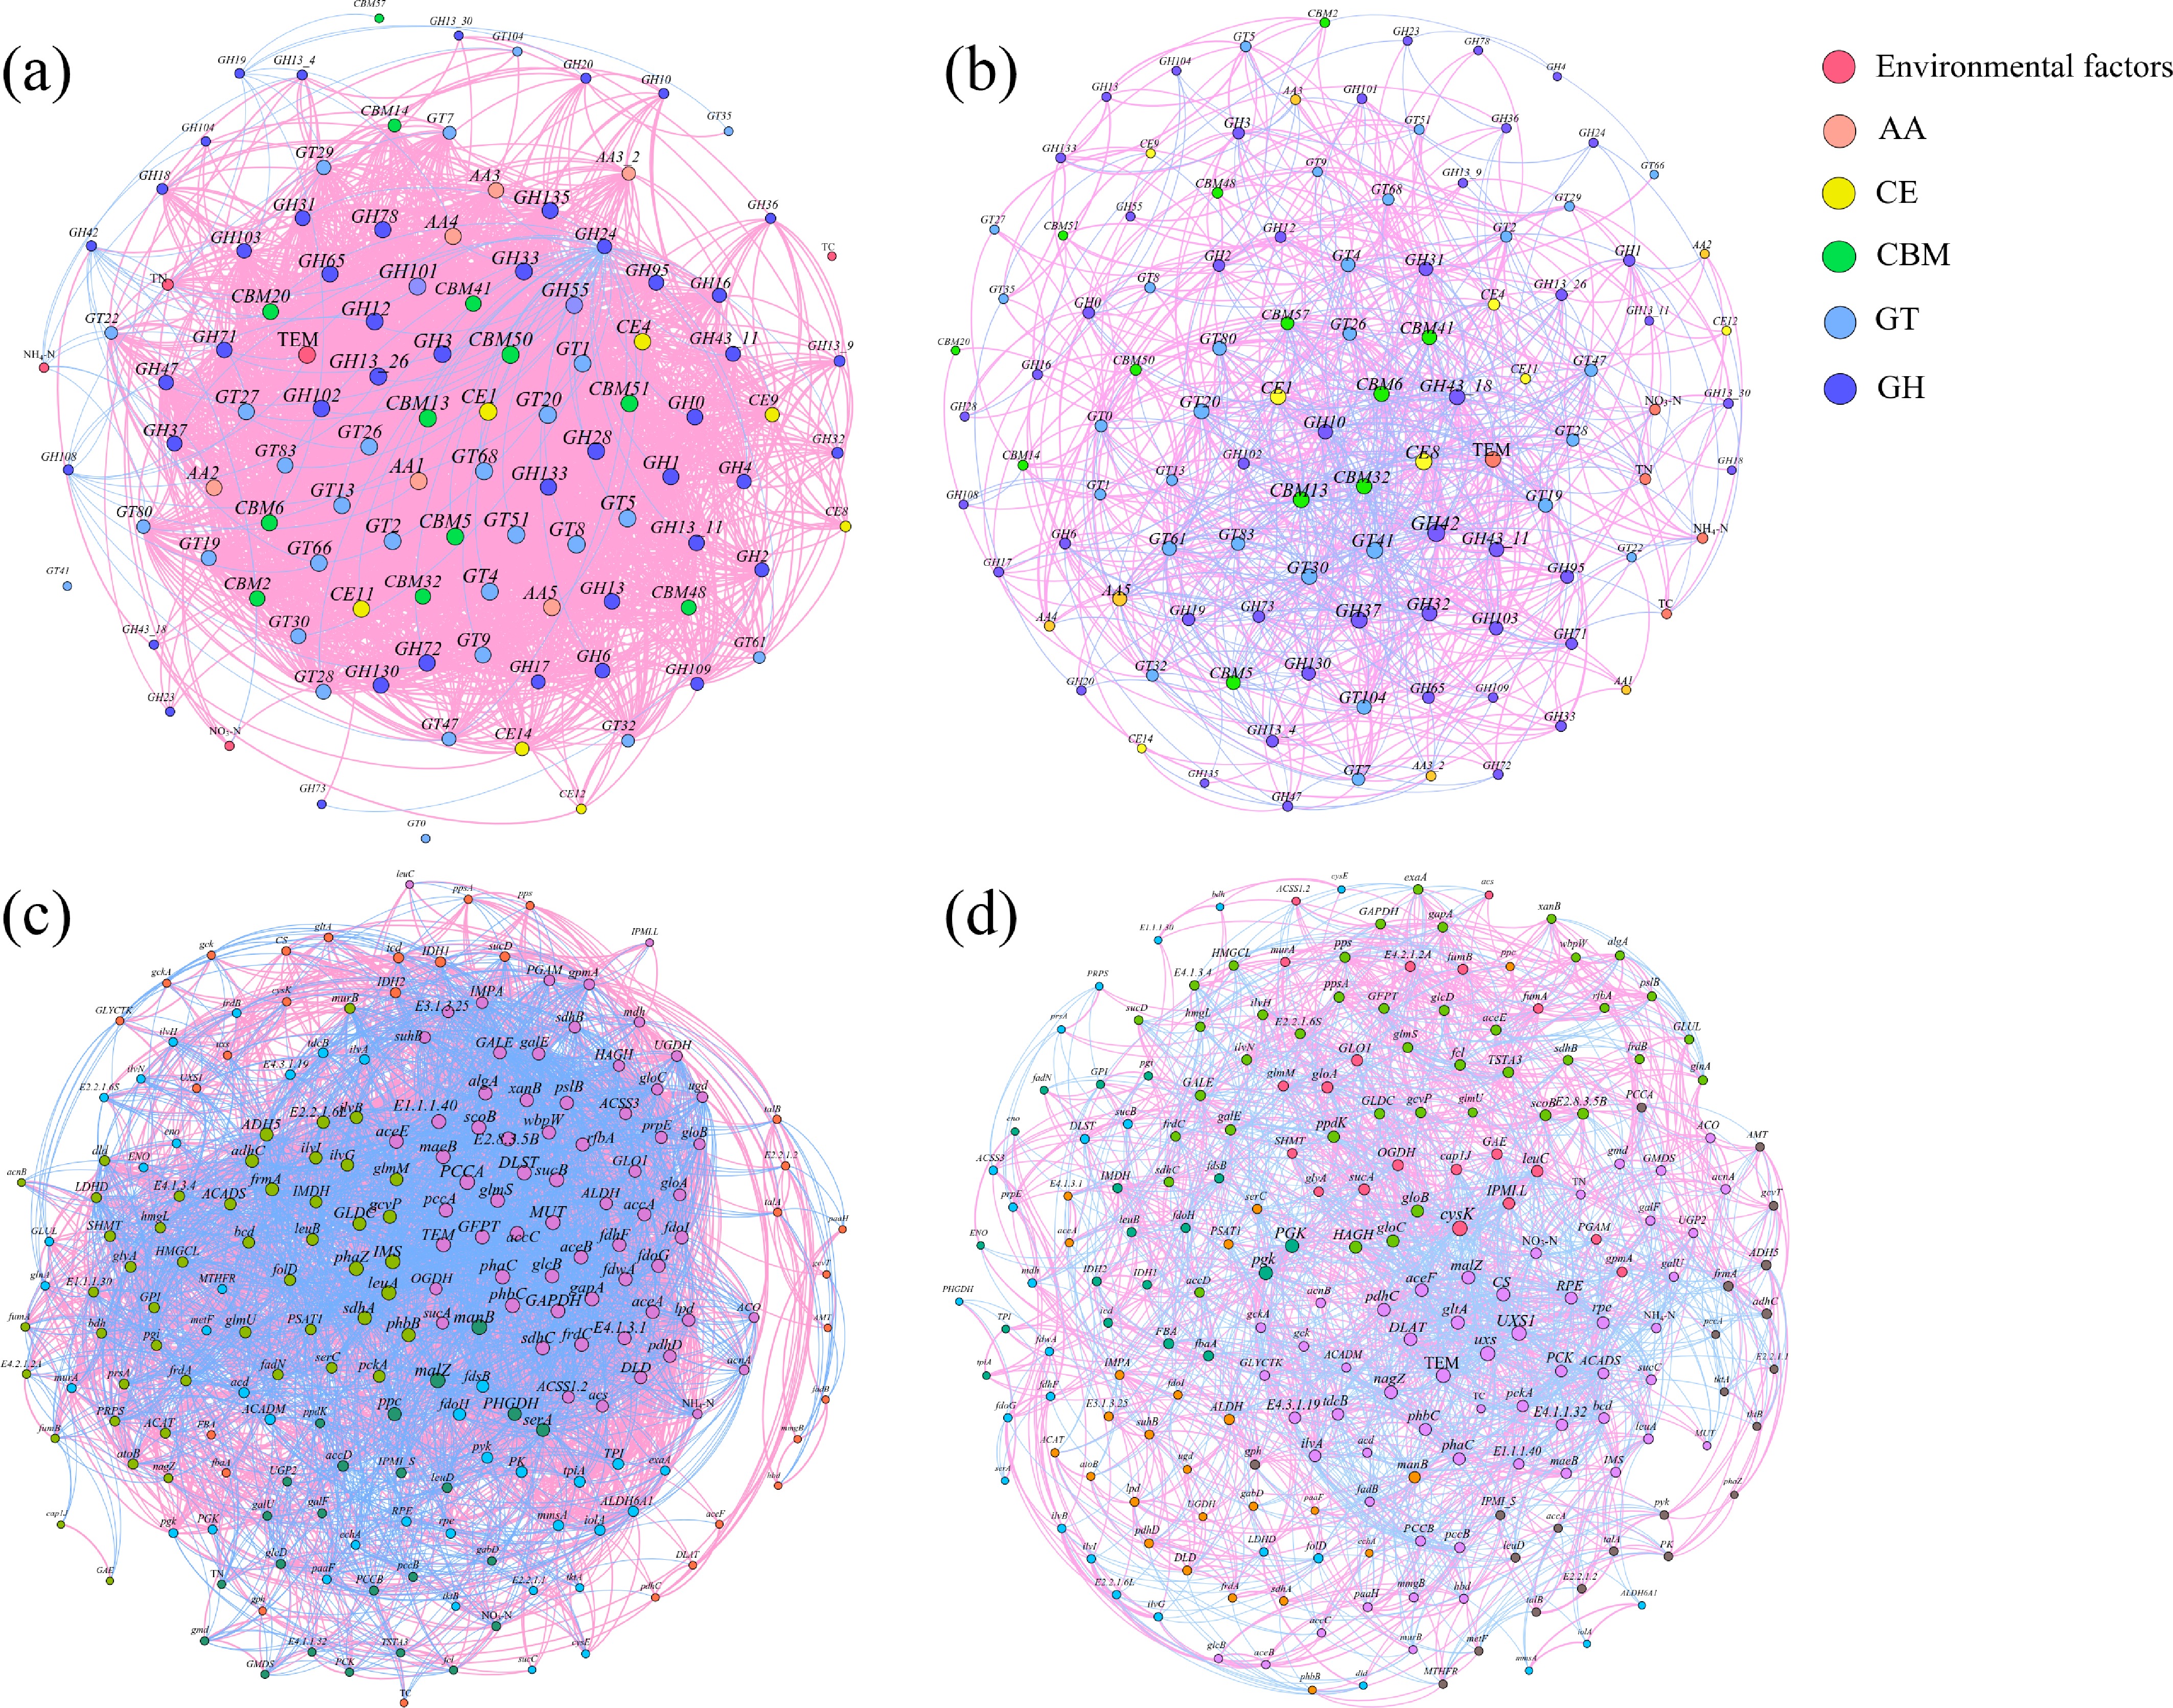
Figure 6.
Co-occurrence network (correlation matrix calculated by R package 'psych', |r| > 0.5, p < 0.05) of (a), (b) CAZy genes, and (c), (d) carbon cycling KO genes in the (a), (c) control, and (b), (d) experimental groups. For the carbon cycling KO genes, the most abundant 200 genes and the physicochemical properties are included. Nodes were colored according to (a), (b) classification, and (c), (d) modularity, and node size represented the correlation between genes. Information on key nodes is nearby the network figures.
To reveal correlations among CAZy genes, network analysis was performed (Fig. 6a, b; Supplementary Table S13). The control group had a higher edge counts (2592), higher average degree (49.371), lower average path length (1.586), higher average clustering coefficient (0.777) and density (0.475) compared with the experimental group (edge counts = 894, average degree = 17.029, average path length = 2.206, average clustering coefficient = 0.474, density = 0.164). The proportion of negative edge counts to positive edge counts in the T group was higher than in the E group.
Impact of cadaver decay on carbon circulation pathway
-
Combined with a previous study[53], the genes participating in the carbon cycle were summarized (Supplementary Tables S14−S19). Then, based on the KEGG PATHWAY database, the pathways for carbon-cycling genes were established (Fig. 7). Figure 7a shows a partial pathway of carbon fixation. The path revealed the process by which D-ribose-5-phosphate fixed carbon dioxide, and converted it into other carbon-containing organic substances under the catalysis of enzymes. Compared with the control group, the gene abundance in the 3-hydroxypropionic acid double cycle (3-HP) pathway decreased (one-way ANOVA, p < 0.05), the abundance of phosphate ribulose kinase (PRK), and ribulose-bisphosphate carboxylase (rbcLS) in the CBB cycle increased (one-way ANOVA, p < 0.05) in the E group. In the pathway of starch metabolism (Fig. 7b), except treS, which encoded α-amylase, the abundance of genes that catalyzed the conversion of starch to glucose decreased due to carcass decay (one-way ANOVA, p < 0.05). For the process of fermentation (Fig. 7c), in the experimental group, the abundance of genes encoding acetate kinase, acyl phosphatase, ethanol dehydrogenase, succinyl-CoA transferase, and propionate-CoA transferase increased (one-way ANOVA, p < 0.05), and the dominant catalytic products were acetate and ethanol. The gene abundance of enzymes encoding ADP and NADP+ decreased significantly (one-way ANOVA, p < 0.05). For the methane metabolism pathway (Fig. 7d), K10944, K10945, and K10946 respectively encoded three subunits of methane/ammonia monooxygenase, which catalyzed the conversion of methane to methanol. In the cadaver group, the abundance of these three carbon cycling KOs decreased significantly (one-way ANOVA, p < 0.05).
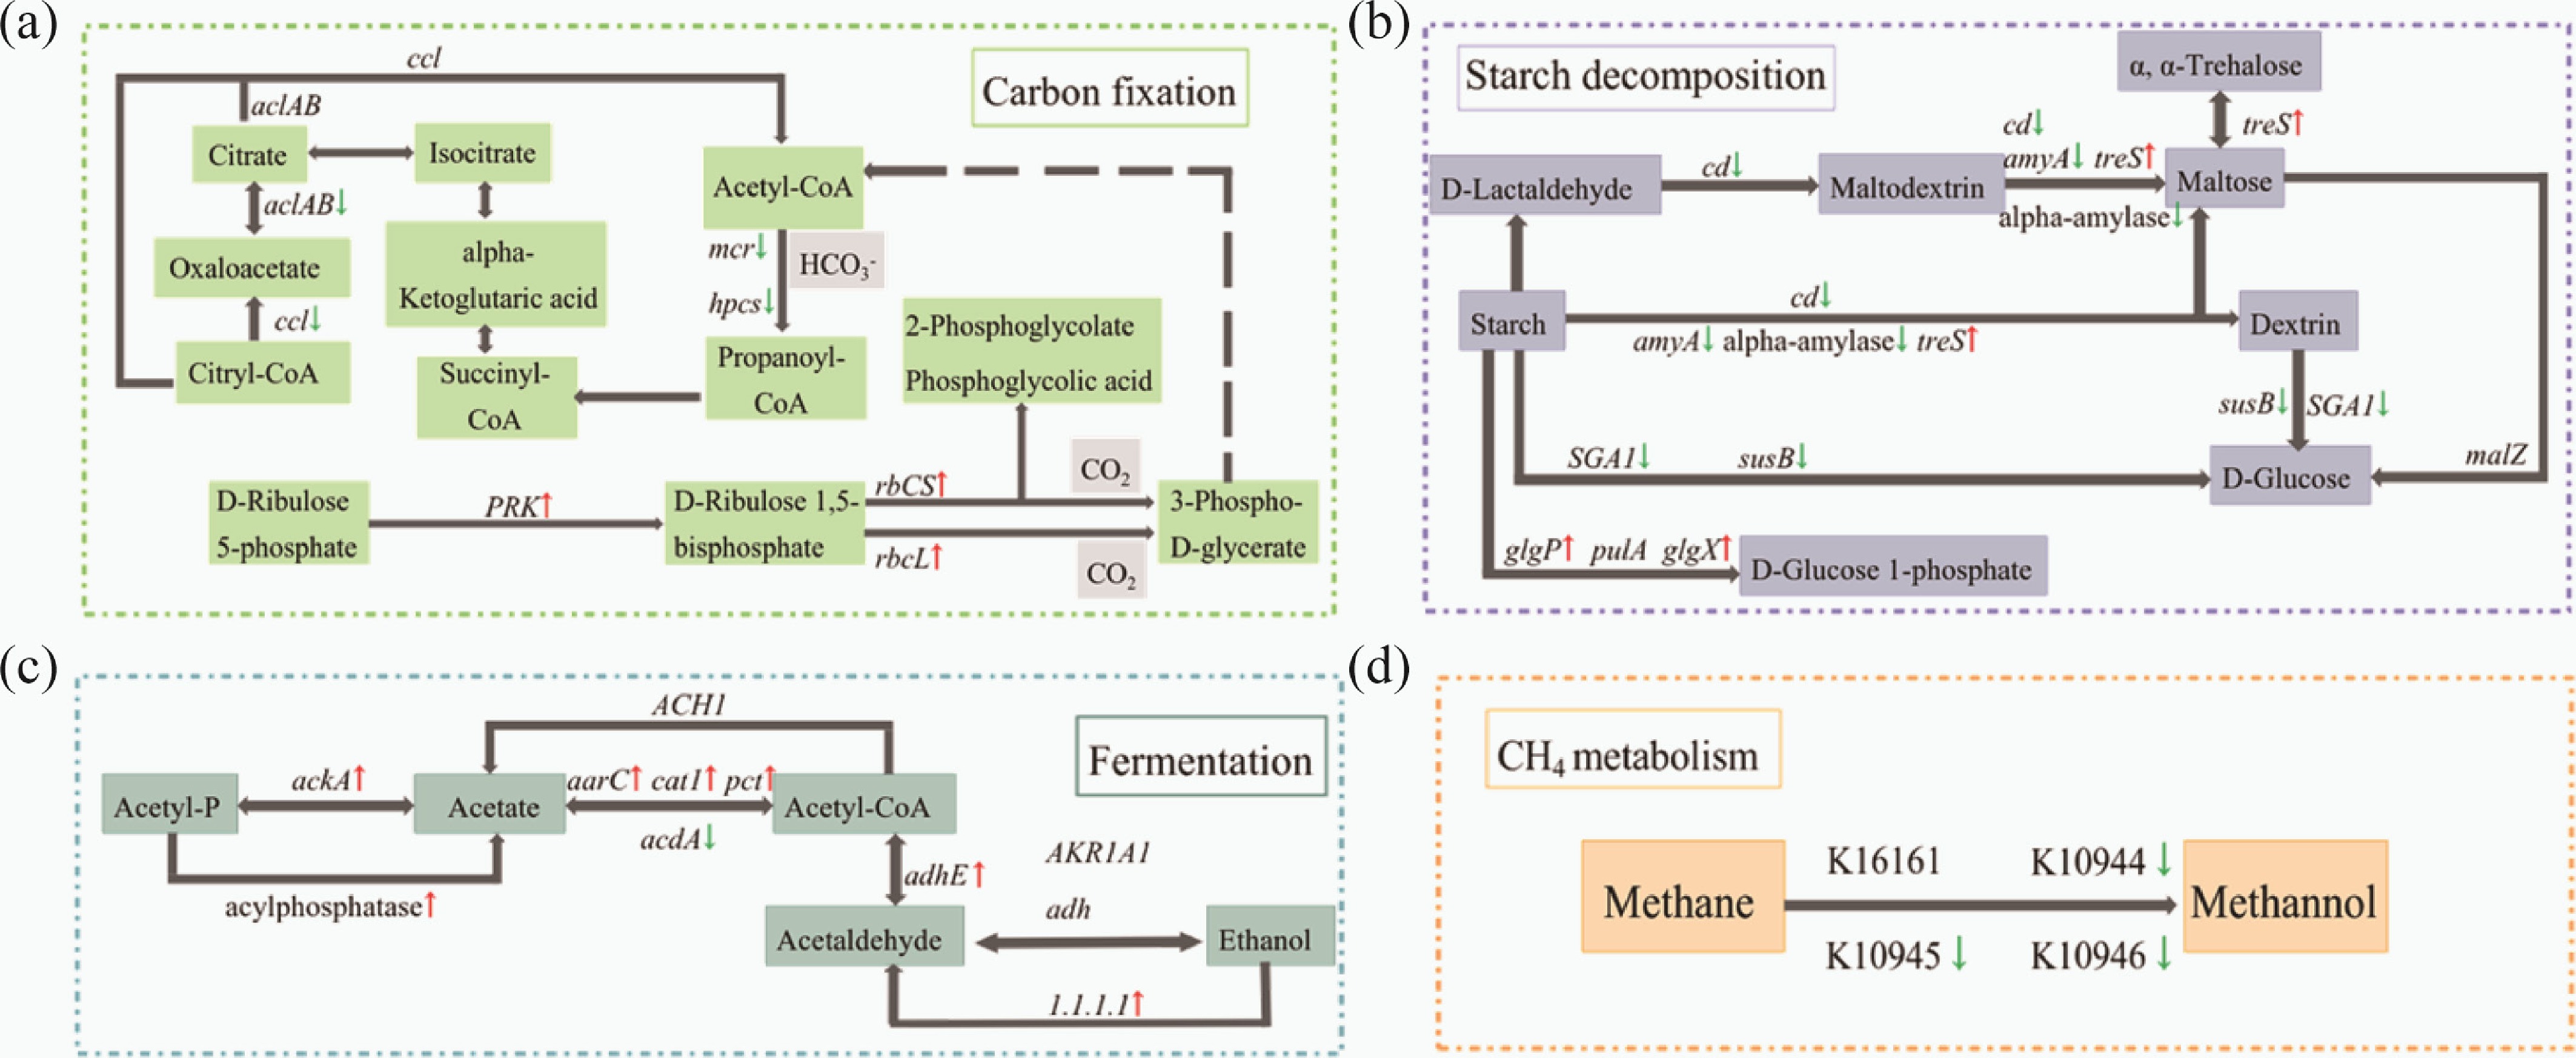
Figure 7.
Flow chart reconstruction of the carbon cycle pathway. (a) carbon fixing; (b) fermentation; (c) starch decomposition; (d) CH4 metabolism. The flow chart shows the genes that were significantly down-regulated (green arrow) or up-regulated (red arrow) in the experimental group, compared with the control group (one-way ANOVA, p < 0.05).
-
The present research found that temperature is a significant predictor of the abundance of carbon cycling genes. For 50.37% of the carbon cycling genes, their relative abundance was found to be correlated with water temperature. The observed changes in alpha and beta diversity among carbon cycling KOs and CAZy genes highlighted the substantial impact of temperature. Specifically, for alpha diversity, both CAZy genes and carbon cycling KOs showed decreases in the control groups as temperature increased. Thus, temperature emerges as an essential factor influencing microbial community diversity[54,55]. Therefore, this phenomenon can be explained by the sensitivity of microbes and their associated carbon cycling genes to temperature in the absence of other disturbances[56]. The selective effect of rising temperatures causes some microbes that cannot adapt to high-temperature environments to become dormant or even extinct[57]. This phenomenon further led to a decline in the alpha diversity of genes involved in carbon cycling. However, this effect was not observed in the experimental groups. Only a small proportion of genes in the experimental groups showed trends associated with temperature changes. The possible reason for this observation is the high concentrations of carbon and nitrogen, which create an eutrophic environment that may inhibit oxidative stress in freshwater photosynthetic organisms, thereby reducing carbohydrate release into the environment[58]. The increase in heterotrophic microbial diversity might maintain microbial alpha diversity harboring carbon-degradation genes during decomposition and mitigate the effects of temperature.
However, the situation regarding carbon cycling KOs differed. The prsent results demonstrated that the alpha diversity of carbon cycling KOs in the corpse groups peaked at intermediate temperatures (26–29 °C). A suitable environment, characterized by appropriate temperatures and abundant nutrients, may promote microbial proliferation[59]. Due to functional redundancy[60], the alpha diversity of carbon cycling KOs increased at lower temperatures. When the temperature exceeded 32 °C, the effect of temperature on the alpha diversity of carbon cycling KOs exceeded that of corpse decomposition. Additionally, carbon cycling KOs with similar enrichment trends were observed within the same temperature range in both the control and experimental groups, indicating their sensitivity to temperature and the benefits of an optimal temperature range for these KOs.
Selective effect of carbon pulse on microbes and their carrying genes
-
The TPM abundance of most carbon-cycling genes was significantly higher in the experimental groups than in the control groups. Moreover, at lower temperatures, the abundance of carbon cycling genes in the experimental groups was higher than in the control groups. The fitting results for TC and carbon cycling genes further demonstrated that the carbon pulse released into the environment has a significant positive effect on these genes over a given period. This can be attributed to the selective pressure exerted on microbes by the environmental changes caused by cadaver decay. Consistent with this observation, previous studies have reported that variations in the types and quantities of carbon sources in the environment can lead to distinct metabolic characteristics in microorganisms[61,62]. It is hypothesized that microbes associated with the decomposition of high-carbon substrates were dominant in this relatively closed environment, leading to a high abundance of carbon-degradation genes among environmental genes. Genes related to specific carbohydrate degradation (starch, lignin, chitin, cellulose, and oligosaccharides) showed a clear enrichment trend in the cadaver groups. This observation suggests that at lower temperatures, the impact of carbon pulses on carbon cycling genes was more pronounced than that of temperature. In addition, Lefse results indicated that the main functional pathways in the control groups focused on carbon fixation and carbon degradation. In contrast, the experimental groups primarily focused on carbon-degradation pathways. This indicated that when carbon pulses occurred in the environment, microbial responses tend to first prioritize utilizing existing substrates. Specifically, when an optimized and more readily decomposable carbon source is available, both functional gene abundance and activity associated with secondary carbon sources are likely to be constrained, a phenomenon known as carbon catabolite repression (CCR)[63].
Driving factors of the carbon gene community
-
For the CAZy genes, microbial factors accounted for the greatest variation (R2 = 0.220), indicating that these genes were closely associated with specific microbes. However, microbial factors provided little explanation of variation in carbon cycling KO genes (R2 = 0.001). These situations indicated the functional redundancy of genes in the environment. The variety of microbes may assume similar and repeated functions to ensure they can resist disturbances caused by environmental changes, a phenomenon called the decoupling of species and functions[64]. Similar results were also reported by previous researchers in coastal wetlands[65]. In addition, the physicochemical changes caused by corpse decomposition also mediate alterations in microbial communities. The relative contributions of corpse (R2 = 0.258), and environmental factors (R2 = 0.399) to the carbon cycling KOs profile showed the sensitivity of functional genes to environmental changes. It indicated that environmental factors shape microbial community metabolic activity to some extent[66].
Several driving factors of carbon-cycling genes were identified in this research. Physicochemical properties of water had an indirect effect on the abundance of carbon-cycling genes through microbial diversity. TC concentration, significantly affected by cadaver decomposition, was positively correlated with numerous CAZy genes, reflecting a correlation between the carbon pulse and environmental carbon cycling genes, especially carbon-degradation genes. Similarly, researchers have found a correlation between the degradation of plant cell wall components and the corresponding genes in the environment[67]. When exogenous carbon is added, environmental carbon increases, so carbon degradation assumes a pivotal role. Linear fitting of CAZy genes for the decomposition of specific carbohydrates and TC concentration further elucidated their interrelationship. The related decomposition genes for refractory organic substances such as cellulose, hemicellulose, and lignin were not affected by TC concentration, which may be because corpses contain very little of these substances, and microorganisms will prioritize using the easily degradable carbon.
Response mechanism of the carbon circulation pathway to corpse decomposition
-
It has been reported that the microbial community can respond to carbon input through gene regulation in a short time[68]. Th present results also support this conclusion. The environmental oxygen limitation caused by corpse decay[37,42] leads to the high abundance of fermentation-related genes in the experimental groups. However, during fermentation processes, the abundance of genes encoding ADP and NADP+-producing enzymes decreases, and their products are essential cofactors in cellular redox reactions and important substrates for dark reactions[69]. This result indicates that the fermentation process may inhibit the Calvin cycle by reducing the reductant available for the dark reaction, thereby diminishing CO2 fixation by microorganisms.
It was found that the gene encoding methane/ammonia monooxygenase, which catalyzes the conversion of methane to methanol, slumped in the cadaver groups. It has been reported that ammonia inhibits methane oxidation activity in methanotrophs[70]. Therefore, the downregulation can be explained by the ammonia-rich environment created by corpse decay, which inhibits the abundance of methane oxidation genes.
In the metabolic pathway of starch degradation, the gene abundance that catalyzes the conversion of starch to glucose was almost decreased in cadavers. Conversely, there was an up-regulation of genes involved in converting starch to glucose-1-phosphate. Glucose-1-phosphate can be converted into amylose, which is more readily decomposed into D-glucose. It may be a response mechanism for microbes to accelerate the decomposition of exogenous carbonaceous organic matter.
Carbon fixation in the microbial community is a complex process that mainly involves the reductive pentose phosphate cycle (CBB), reductive citrate cycle (rTCA), 3-hydroxypropionate cycle (3-HP), reductive acetyl-CoA pathway (Wood-Ljungdahl pathway), 3-hydroxypropionate/4-hydroxybutyrate (3-HP/4-HB), and dicarboxylate-hydroxybutyrate cycle (DC/4-HB)[71,72]. With the exception of the last two pathways, the detected genes refer to four of these carbon-fixing pathways. It was found that the abundance of mcr and hcps decreased in the experimental groups, and the corresponding enzyme encoded by these two genes, catalyzed the conversion of Acetyl-CoA to Propanoyl-CoA. This pathway belongs to 3-HP. Notably, although the abundance was low, rTCA-related genes were detected at low temperature (23−26 °C) in the control groups. Compared with CBB and 3-HP, the rTCA pathway is energy-efficient[71]. It imposes higher energy requirements when RubisCO catalyzes the conversion of ribulose-1,5-bisphosphate into 3-phosphoglycerate[73]. So, it could be considered that, under eutrophic conditions in the experimental groups, rTCA was replaced by CBB in the carbon-fixing pathway. This phenomenon shows that microbes can make better use of resources and adapt to environmental changes flexibly by regulating functional genes.
-
In this research, for the first time, the effects of temperature and cadaver decay on genes involved in carbon cycling were explored. Alpha diversity of carbon-cycling genes was significantly reduced, and beta diversity was altered by rising temperature. Rising temperatures exerted a significant positive effect on the relative abundance of genes involved in carbon cycling. Cadaver decay increased the relative abundance of genes involved in carbon degradation. Corpse decomposition enhanced the fermentation process, inhibited the dark reaction of the Calvin cycle, and promoted the carbon cycle toward the more easily degradable pathway of amylose. This study demonstrates that carbon degradation, rather than carbon fixation, plays a dominant role in corpse decomposition, and that carbon-degrading microorganisms preferentially utilize easily degradable carbon rather than refractory carbon. Although this indoor, controlled experiment cannot fully simulate the field environment, and microplastics produced by the experimental plastic boxes may have affected the decomposition process, it provided new insights into the effects of rising temperatures and carcass decomposition on the aquatic carbon cycle. However, the investigation of resource pulse effects on the carbon cycle, and related carbon-fixing microorganisms in large-scale and diverse environments is limited. More comprehensive studies should be conducted to provide practical management recommendations, and mitigate carbon emissions.
-
It accompanies this paper at: https://doi.org/10.48130/biocontam-0025-0012.
-
All procedures were reviewed and preapproved by the Animal Welfare and Ethics Committee of Lanzhou University, identification number: IRB19033001, approval date: March 30, 2019. All relevant experimental methods and protocols were strictly in accordance with relevant guidelines.
-
The authors confirm their contributions to the paper as follows: Huan Li designed the experiment and provided research funds. Xiaochen Wang and Jie Bi completed the data analysis and wrote the paper. Qiaoling Yu, Xiao Zhang, Yu Shi, Petr Heděnec, Tengfei Ma, and Huan Li also contributed to the revision and proofreading of this paper. All authors reviewed the results and approved the final version of the manuscript.
-
The original 16S rRNA gene and metagenomic data were available at the European Nucleotide Archive by accession number PRJEB52677 and PRJEB52680, respectively.
-
This work was supported by the National Natural Science Foundation of China (32471575), Gansu Province Science and Technology Plan for Youth Science Fund (24JRRA458), and the Natural Science Foundation of Henan Province (222300420036).
-
The authors declare that they have no competing interests.
-
# Authors contributed equally: Xiaochen Wang, Jie Bi
Full list of author information is available at the end of the article. - The supplementary files can be downloaded from here.
- Copyright: © 2025 by the author(s). Published by Maximum Academic Press, Fayetteville, GA. This article is an open access article distributed under Creative Commons Attribution License (CC BY 4.0), visit https://creativecommons.org/licenses/by/4.0/.
-
About this article
Cite this article
Wang X, Bi J, Yu Q, Zhang X, Shi Y, et al. 2025. Animal corpse decomposition under elevating temperature: a metabolic bridge from labile to recalcitrant carbon pools. Biocontaminant 1: e016 doi: 10.48130/biocontam-0025-0012 

Animal corpse decomposition under elevating temperature: a metabolic bridge from labile to recalcitrant carbon pools
- Received: 08 September 2025
- Revised: 02 November 2025
- Accepted: 17 November 2025
- Published online: 05 December 2025
Abstract: Temperature influences the functional genes of microbes associated with carbon (C) cycles. However, the effects of temperature on microbial C cycle genes associated with carcass-contaminated water remain poorly understood. To fill this gap, variations in microbial carbon-cycling genes were explored in polluted water resulting from animal corpse decay at five temperatures (23, 26, 29, 32, and 35 °C) using metagenomic sequencing. Carcass decay increased the total carbon content by 86.6%, but rising temperature had no significant effect. The dominant phyla of C-cycle microbes were Proteobacteria, followed by Actinobacteria, and Bacteroidetes. Approximately half of the carbon-cycling genes, and 37.59% of carbohydrate-active enzyme genes were predicted to be temperature-sensitive, whereas others were not. The alpha diversity of carbon-cycling genes decreased with rising temperature, while beta diversity was affected by both temperature and cadaver decomposition. High temperature led to an increase in genes encoding decomposed starch, carbohydrate esters, pectin, lignin, chitin, cellulose, oligosaccharides, debranching enzymes, and hemicellulose in the control group. Conversely, only carbohydrate ester decomposition increased with temperature in the corpse group. The concentration of total carbon was positively correlated with easily degradable carbon genes (e.g., decomposed starch), but showed no correlation with refractory carbon genes (e.g., cellulose, hemicellulose, and lignin). It was found that carbon degradation, rather than carbon fixation, dominated during animal carcass decay, and microbes may prioritize using the degradable carbon, such as easily degradable amylose. This research demonstrates that carcass decomposition regulates pathways of the carbon cycle and offers insights into predicting changes in these pathways under conditions associated with global warming.