












-
Green tea is a type of tea with the longest processing history and is one of the most widely consumed teas around the world, characterized by its fresh aroma, mellow taste, and bright green liquor color. To produce green tea, there are several essential processing steps that co-determine its final quality, including withering, fixation, rolling, and drying. During withering, fresh tea leaves undergo partial water loss, thus becoming a little soft and primarily releasing the "green" odor[1]. In the fixation step, temperatures higher than 200 °C inactivate the polyphenol oxidase (PPO), thus effectively prohibiting the oxidation of polyphenols into tea pigments, such as theaflavins, thearubigins, and theabrownins, which are strongly associated with the quality of black tea[2]. Meanwhile, due to the fixation step, green tea kept almost the full content of polyphenols as the fresh leaves contained, which contributes greatly to its various bioactivities, including hypoglycemic, anti-inflammatory, and antimicrobial effects[3]. For achieving the final quality of green tea, appropriate drying is also crucial, which particularly characterizes the aroma profiles, such as fresh, chestnut, baked bean, and high-fired aromas. Our previous research showed that both the withering method and drying temperatures greatly affect tea quality[4]. Similarly, other research has reported that with the increase of drying temperature, the content of chlorophyll gradually decreased[5].
Notably, rolling basically shapes tea leaves, disrupts cellular structure, and thus promotes the release and transformation of internal compositions, which accelerates their dissolvation during brewing[6]. To date, relatively limited research has explored the effect of rolling on the formation of tea flavor. In black tea processing, increasing rolling pressure or extending rolling time has been shown to facilitate the formation of theaflavins, thearubigins, and enhance the redness, yellowness, and color saturation of tea infusion, whereas moderate pressure yielded the highest levels of sweetness alongside reduced bitterness in the final liquor[7,8]. In green tea processing, it is reported that under light rolling conditions, extending the rolling time from 0 to 4 min slightly decreased the level of tea polyphenols and weakened the antioxidant capacity of Assam green tea[9]. However, the specific effect of rolling presure on the quality of green tea remains to be fully elucidated.
Conventionally, rolling pressure was controlled by regulating the descending height of the rolling barrel top lid, which is highly reliant on manual supervision and time-consuming. To advance the digitalization of tea processing, a programmable logic controller (PLC) was employed herein to monitor rolling pressures and achieve control of rolling cycles. Previously, PLCs have been extensively applied in industrial automation systems, including food processing and agricultural machinery control[10−12]. In this study, a commercial PLC was adapted for pressure detection in a traditional tea rolling machine, enabling three discrete pressure regimes: low rolling pressure (LRP), medium rolling pressure (MRP), and high rolling pressure (HRP). Then, a comprehensive evaluation by sensory evaluation and chemical compounds analysis on the final products was performed. The aim of this study was to investigate the changes in green tea quality parameters in response to different rolling pressure treatments, thereby providing preliminary insights into controlling rolling pressure and promoting the utilization of PLC in the tea processing industry.
-
In the automation control system of the rolling machine, the PLC serves as the core control unit, responsible for receiving input signals and output control signals to detect the rolling pressures and control the time (Fig. 1). The integration and automation of PLC systems typically consist of the following main components:
(1) Installation of the reversible gear motor (5IK90W-C2F-GU-ZG, HOULE, Zhejiang, China) with an output rotational speed 44–45 r/min at the pole of the rolling machine.
(2) Fix the PLC CPU module (S7-200CN, SIMATIC, Shandong, China), the embedded operation screen (TPC 7022EX, MCGS, Guangdong, China), and the AC contactor (CJX2-1210, CHNT, Zhejiang, China) in the electrical control cabinet. Connection and installation of the input and output modules to the PLC main unit.
(3) Installing a 50 W single-output power supply (LRS-50-24, MEAN WELL, Guangdong, China) that provides a 24 V output voltage line for the PLC and other modules.
(4) Connection of the input device (a sensor installed on the inner side of the lid, TL-Q5MB1-Z, load current ≤ 50 mA, OMRON, Shanghai, China) to the input modules of the PLC, and attach the gear motor to the output modules of the PLC.
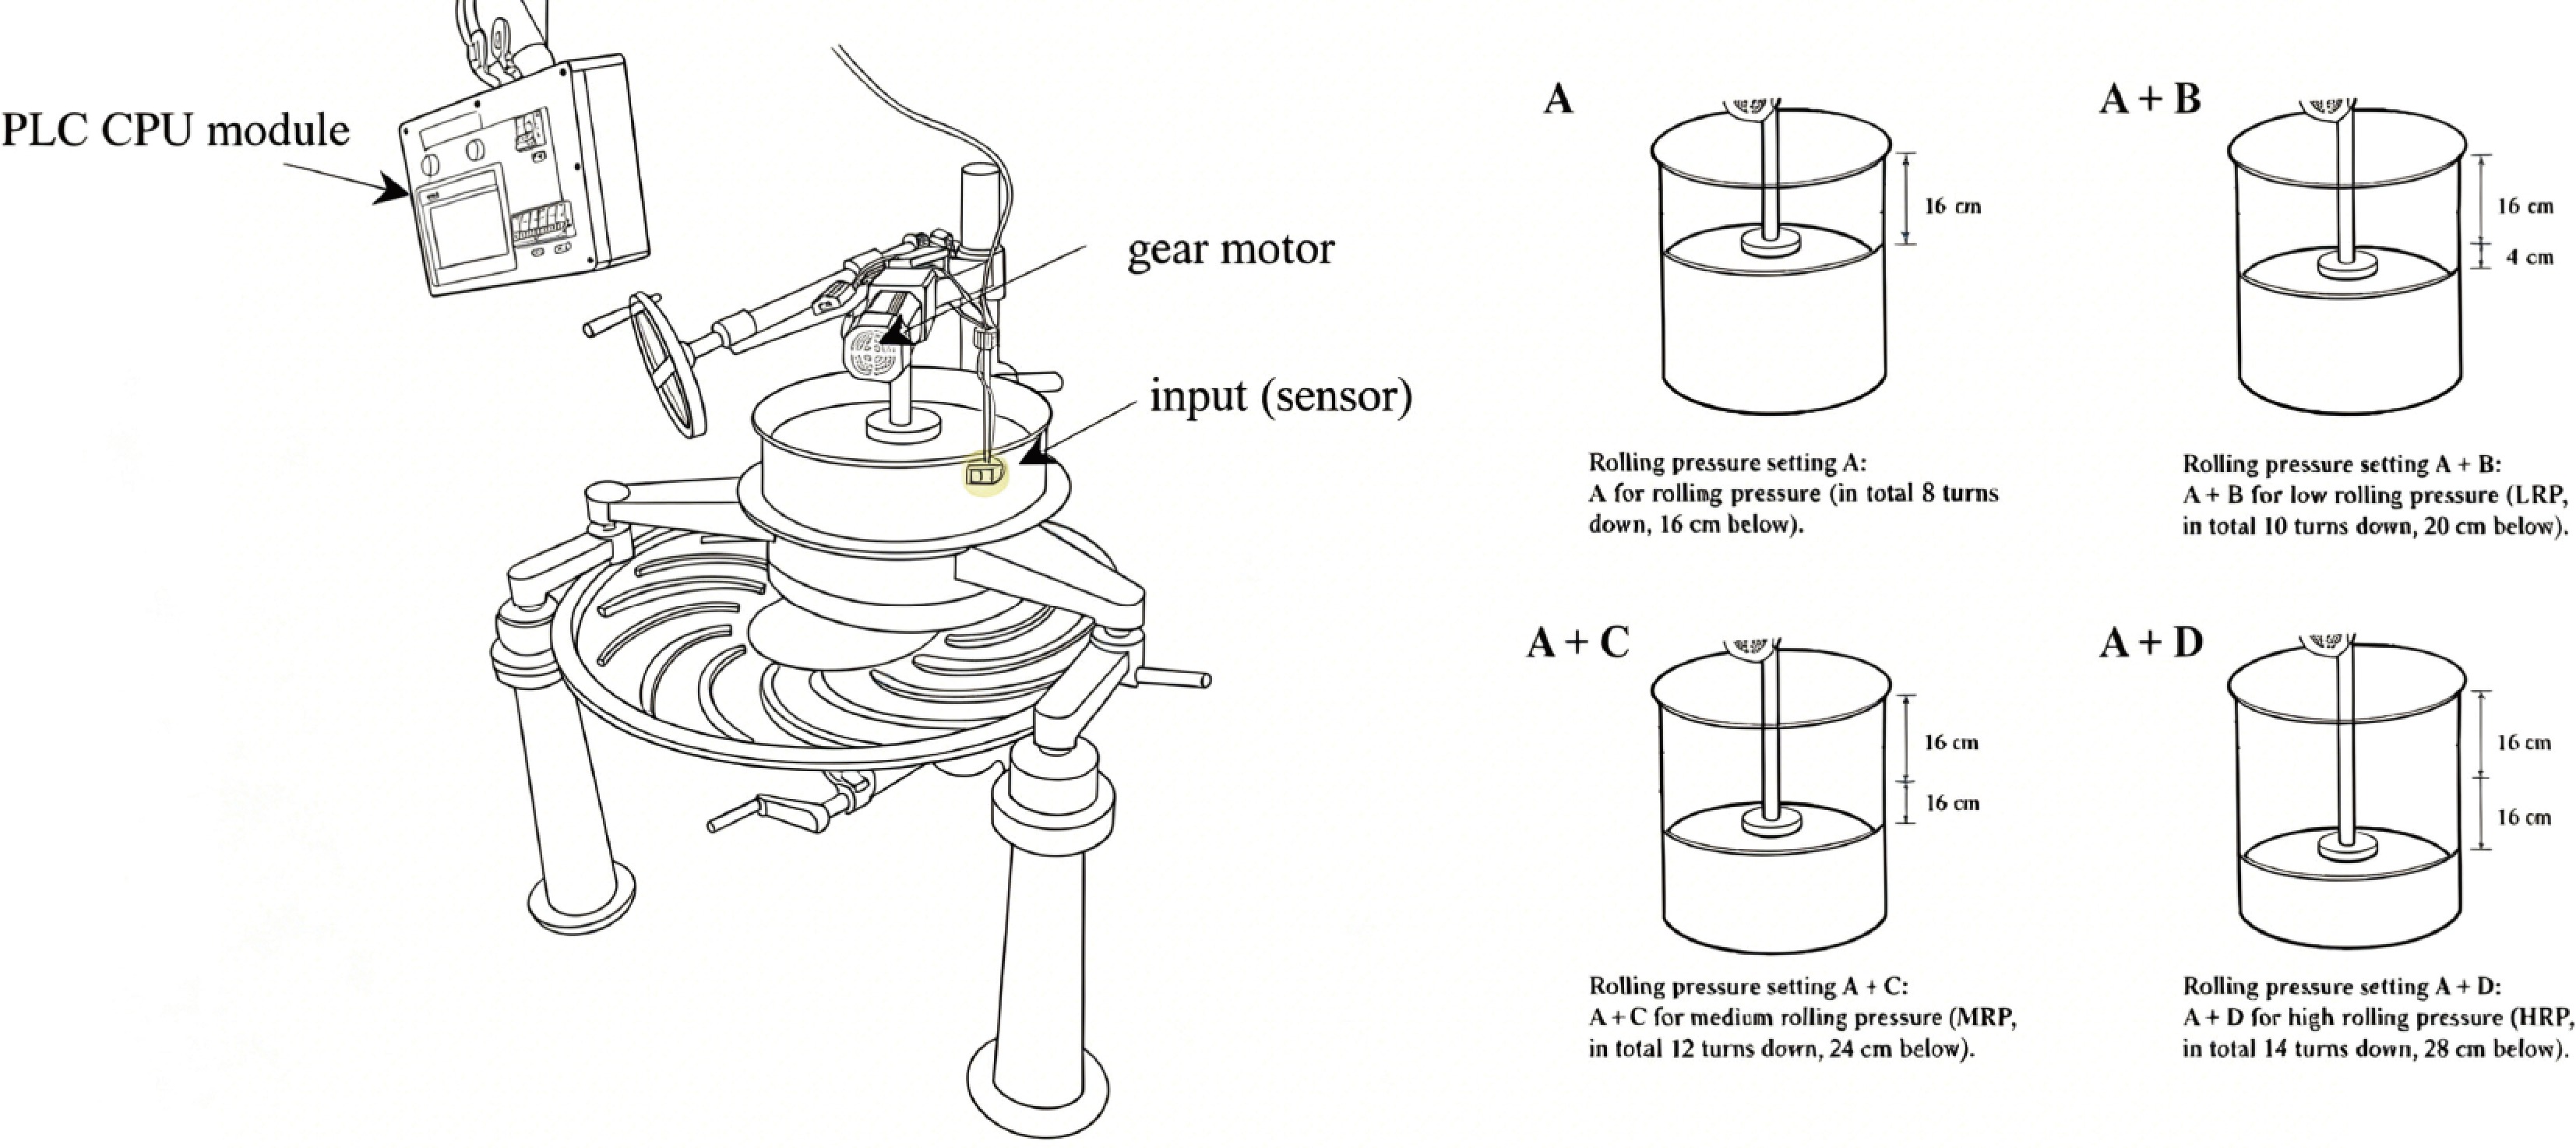
Figure 1.
The integration of programmable logic control (PLC) into the green tea rolling process. The height of the lid descent on the rolling machine barrel is controlled by the PLC and affects the rolling pressure. After basic rolling for 130 min (Stage A, in total eight turns down, 16 cm below, 130 min), three rolling pressures were further developed over the same period (50 min): low rolling pressure (LRP, Stage A + B, in total ten turns down, 20 cm below), medium rolling pressure (MRP, Stage A + C, in total 12 turns down, 24 cm below), and high rolling pressure (HRP, Stage A + D, in total 14 turns down, 28 cm below). YS, green tea processed by YS cultivar; YH, green tea processed by YH cultivar; LJ, green tea processed by LJ cultivar.
Tea sample preparation
-
Three tea cultivars, including 'Yingshuang' (YS), 'Yinhou' (YH), and 'Longjing 43' (LJ), were plucked at the one-bud-two-leaf tenderness stage and provided by Suichang Tiantangyuan Agricultural Cooperative (Zhejiang, China). The fresh leaves were thinly spread on the withering tank for 6 h and then subjected to fixation at 260 °C. Subsequently, leaves were put into the barrel (height: 40 cm) of the rolling machine (6CR-55, Tianming, Zhejiang, China) connected with the PLC equipment. Figure 1 displays the PLC rolling machine settings. Different rolling-pressure combinations were developed by adjusting the lid height. Three different rolling pressure combinations were developed by adjusting the descending height of the lid. After 130 min of basic rolling (Stage A, totaling eight downward turns), the lid was further lowered to generate different rolling pressures, and rolling continued for another 50 min (B/C/D). When the lid had descended an additional 4 cm (reaching approximately 20 cm below the edge of the barrel), this procedure was designated as LRP (Stage A + B, totaling ten downward turns). Similarly, MRP was achieved by lowering the lid to roughly 24 cm below the barrel edge (Stage A + C, totaling 12 downward turns), while HRP was accomplished by lowering the lid to approximately 28 cm below the edge (Stage A + D, totaling 14 downward turns). During rolling, lid pressures were measured by the sensor under both static and rotational conditions. The rolling pressure under static conditions was recorded when the lid descended to a specified height (LRP, MRP, HRP), and the values were determined from three independent replicates. Meanwhile, the pressure readings under rotational conditions during the 50-min continuous rolling were averaged for each test. After rolling, the tea was deblocked and dried at 100 °C for 1 h to achieve a moisture of 6.5%. Samples were then collected and stored at 4 °C for further analysis.
Chemicals and reagents
-
Folin-Ciocalteu reagent (≥ 98% purity), ninhydrin (≥ 98% purity), catechin standards (HPLC grade) including (−)-epigallocatechin gallate (EGCG), (−)-epicatechin (EC), (−)-gallocatechin (GC), (+)-catechin (C), (−)-epicatechin gallate (ECG), (−)-gallocatechin gallate (GCG), (−)-epigallocatechin (EGC), and (+)-catechin (CG) were purchased from Yuan Ye Bio-Technology (Shanghai, China). Methanol, acetonitrile, formic acid, purified water, and propanol (HPLC grade) were purchased from Thermo Fisher Scientific (WA, USA). All other chemical solvents were of analytical grade and were purchased from Sinopharm Group (Shanghai, China).
Sensory evaluation
-
The sensory evaluation of the study was approved by the Academic and Ethics Committee of the Department of Tea Science, Zhejiang Agriculture and Forestry University (T-AEC-2025SE021). Ten highly qualified tea experts performed sensory evaluation of green tea samples according to the Chinese National Official Standard (GB/T 23776-2018) and previous methods[13]. All participants held senior tea evaluator certifications and voluntarily consented to participate in the test, with a commitment to the public disclosure of results. Tea samples (3 g) were placed into a white porcelain cup, infused with 150 mL of boiling water, and steeped for 4 min. The evaluation focused primarily on five attributes, including bitterness, astringency, sweetness, sweet aftertaste, and freshness. Sensory evaluation of the samples was conducted using a ten-point scoring system (1–10). Sensory intensity for each attribute was categorized as weak (1–4), medium (5–7), and strong (8–10). The evaluation was replicated on separate days to enhance the consistency of experimental results.
Chromatic analysis of tea infusions
-
A colorimeter (CR5, 3nh Technology, Shanghai, China) was used to determine color differences among tea infusions[14]. The color of tea infusions was evaluated and indicated by the values of E*, L*, a*, and b*. Among them, E* represents the total color difference, L* represents luminance (+L: lightness; −L: darkness), a* represents differences of redness (+a) and greenness (−a), b* represents differences of yellowness (+b) and blueness(−b), respectively.
Determination of basic chemical content of green tea
-
Tea powder (1.5 g) was weighed into a conical flask and extracted with 150 mL of boiling water for 45 min, with appropriate shaking during the extraction process. After extraction, the supernatant was collected and filtered to prepare the sample for subsequent experiments. Water extract content was measured according to Chinese testing standards, National Standard of China (GB/T 8305-2013)[15]; The total amount of amino acids was determined by the ninhydrin method, with measurements of absorbance at 570 nm[8]. Detection of water-soluble sugars was done by the anthrone-sulfuric acid colorimetric method, with measurements of absorbance made at 620 nm[16]. The content of tea polyphenols was measured by Folin phenol colorimetry with measurements of absorbance made at 765 nm[17].
Determination of green tea catechin content
-
Green tea samples were analyzed using the high-performance liquid chromatography (HPLC) system (1260 quaternary pump VL, series DEABJ01988, Agilent Technologies, CA, USA) according to a previous method with some modifications[2]. The ZORBOX SB-C18 column (250 × 4.6 mm, 5 μm, CA, USA) was used for separation, and the column oven temperature was set at 35 °C. Mobile phase A consisted of acetonitrile, acetic acid, and water at a volume ratio of 3:0.5:96.5 (v/v/v), while mobile phase B consisted of the same solvents at a volume ratio of 30:0.5:69.5 (v/v/v). The gradient program was then performed by a linear gradient: 0–10 min, 100% A; 10–25 min, 100%–68% A, 0%–32% B; 25–35 min, 68% A, 32% B; 35–45 min, 68%–100% A. The flow rate was 1 mL/min, the injection volume of the sample was 10 μL, and the constituents were detected at 278 nm.
LC-MS-based metabolomics analysis
-
According to the earlier method[18], the samples of non-targeted metabolomics were analyzed using an ultra-high-performance liquid chromatography system coupled with a Fourier transform high-resolution mass spectrometer (UHPLC-MS/MS, Thermo Scientific, MA, USA) fitted with an ACQUITY BEH C18 column (100 × 2.1 mm i.d., 1.7 µm; Waters, MA, USA). The mobile phases consisted of 0.1% formic acid in water: acetonitrile (2:98, v/v) (solvent A) and 0.1% formic acid in acetonitrile (solvent B). The flow rate was 0.40 mL/min, and the column temperature was 40 °C. Mass scanning range was set at 70–1,050 m/z, and ion source heating temperature was 350 °C. Progenisis QI (Waters Corporation, MA, USA) was used to identify and align the raw data of peaks produced a variety of data, including retention periods and mass-to-charge ratios. Additionally, the variables with a relative standard deviation (RSD) of quality control (QC) samples greater than 30% were deleted. Lastly, metabolite data were obtained by comparing the mass spectrometry data with the Human Metabolome Database (HMDB) (
www.hmdb.ca ), METLIN (https://metlin.scripps.edu ), and the self-built Majorbio Database (www.majorbio.com ).Statistical analysis
-
SIMCA-P software (version 14.1, Umetrics, Sweden) was used to carry out the variable importance in projection (VIP) and partial least squares-discriminant analysis (PLS-DA). SPSS software (version 25, IBM, IL, USA) was used to perform the one-way analysis of variance, with p < 0.05 indicating a significant difference among groups. Each experiment was conducted independently in triplicate, and results were represented as 'mean ± standard deviation'.
-
In Fig. 1, rolling pressures were controlled by the descending height of the lid, denoted as LRP (ten rolls down of the top lid), MRP (12 rolls down), and HRP (14 rolls down). Herein, pressures at both the static state and their peak values under rotation of each cultivar were recorded by the sensor (Fig. 2). Under static conditions, lid pressures on tea leaves remained relatively stable, with a slight increase as the lid descended. When the machine started rotating, the lid pressures increased markedly compared with the static state. For YS, during rotation, the maximum lid pressures increased from 28.2 N (LRP) and 38.4 N (MRP) to 62.0 N (HRP) with increasing rolling pressure. The maximum pressures of LJ under rotational conditions were relatively higher than those of the other two cultivars, increasing from 32.8 N (LRP) and 47.4 N (MRP) to 70.2 N (HRP). In contrast, YH showed comparatively lower lid pressures. Under the same mechanical settings (descending height of the rolling barrel lid), the variations in actual pressures captured by sensors among cultivars may be attributed to differences in leaf textures. In previous studies, significant differences in leaf quality and leaf morphological characteristics were observed among different tea cultivars[19,20]. In addition, it was demonstrated that the inner diameter of conducting tissue structures in tea leaves changes markedly during processing, a variation that supports the spatial expansion of the leaves[21].
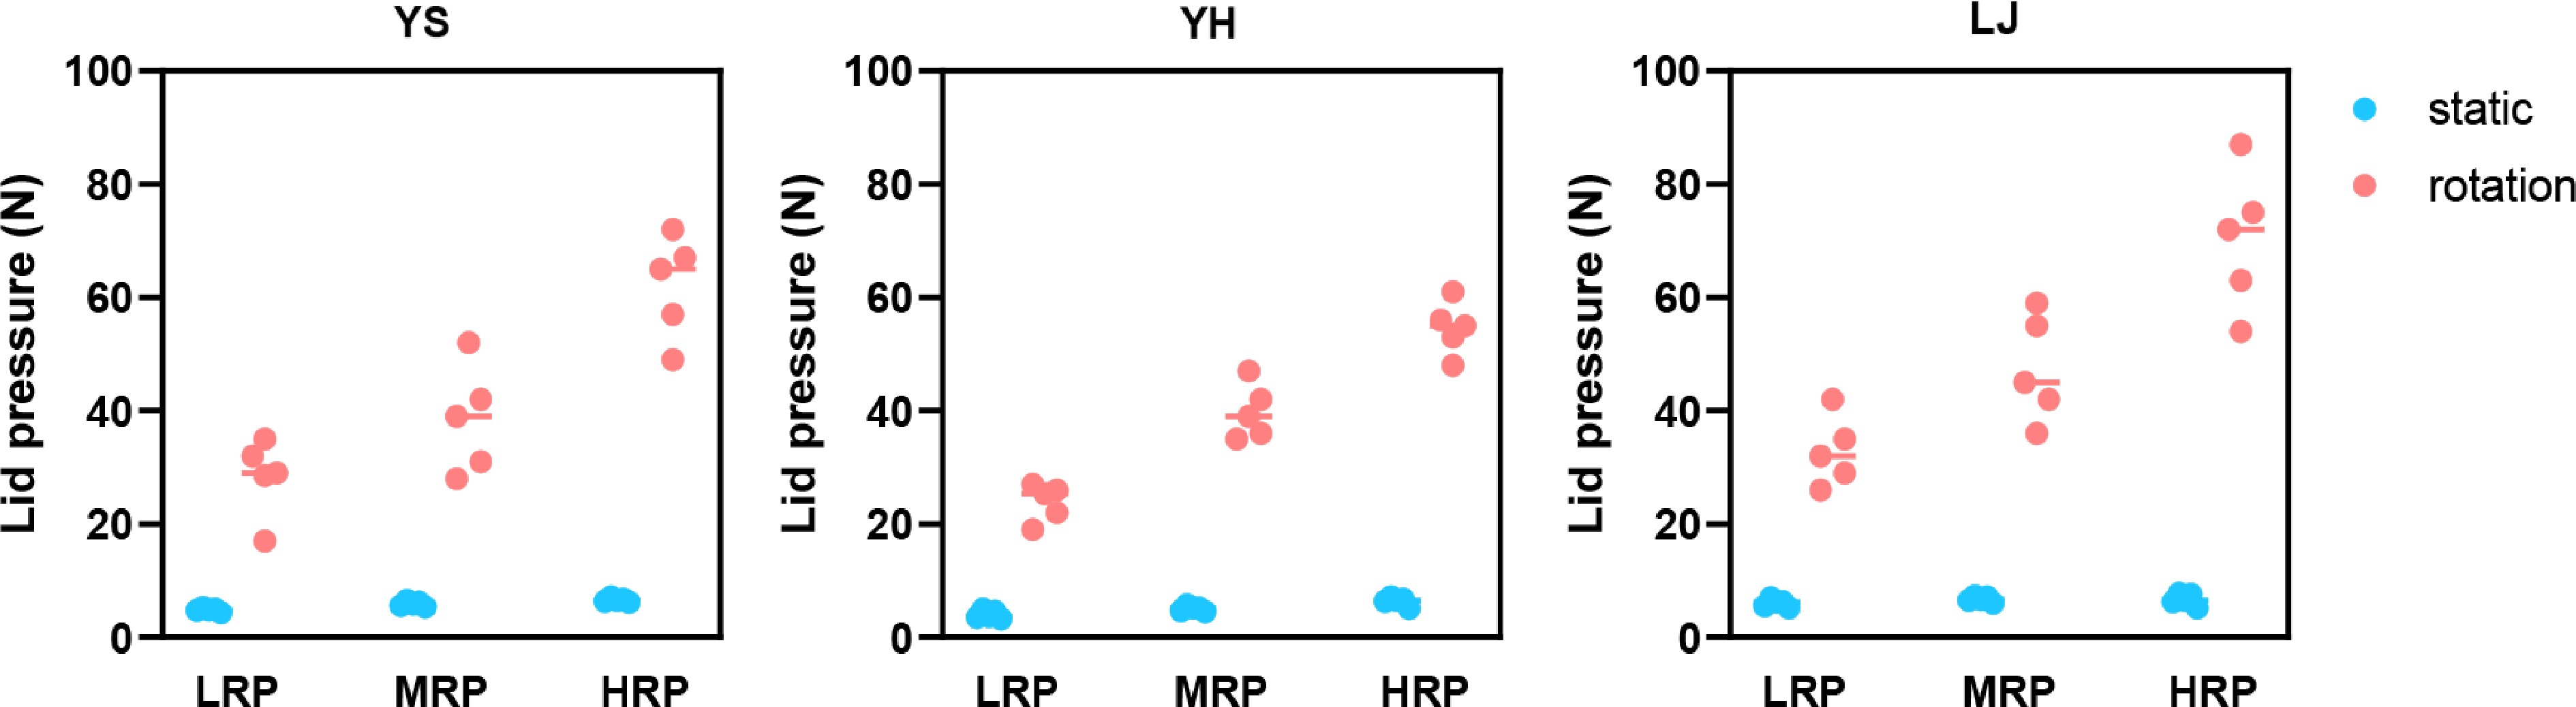
Figure 2.
Lid pressures detected by PLC sensor under static and rotational conditions. YS, green tea processed by YS cultivar; YH, green tea processed by YH cultivar; LJ, green tea processed by LJ cultivar. LRP, green tea processed with low rolling pressure; MRP, green tea processed with medium rolling pressure; HRP, green tea processed with high rolling pressure.
Effect of the rolling pressures on sensory attributes
-
The sensory quality of green tea was shown to be affected by varying rolling pressures as depicted in Fig. 3a. As rolling pressure increased, the tea samples exhibited heightened intensities of bitterness, astringency, and sweet aftertaste, whereas the intensity of sweetness decreased, and freshness showed no obvious variation across different pressure gradients. Among the three cultivars, LJ exhibited the highest level of bitterness, YS had the highest level of astringency, and YH tended to show the highest levels of sweet aftertaste under all three rolling pressure conditions. In congou black tea processing, as the rolling duration increased, the sweetness level was found to increase initially and then decrease; by contrast, rolling time exerted no significant effect on the modulation of bitterness in Assam green tea[9,22].
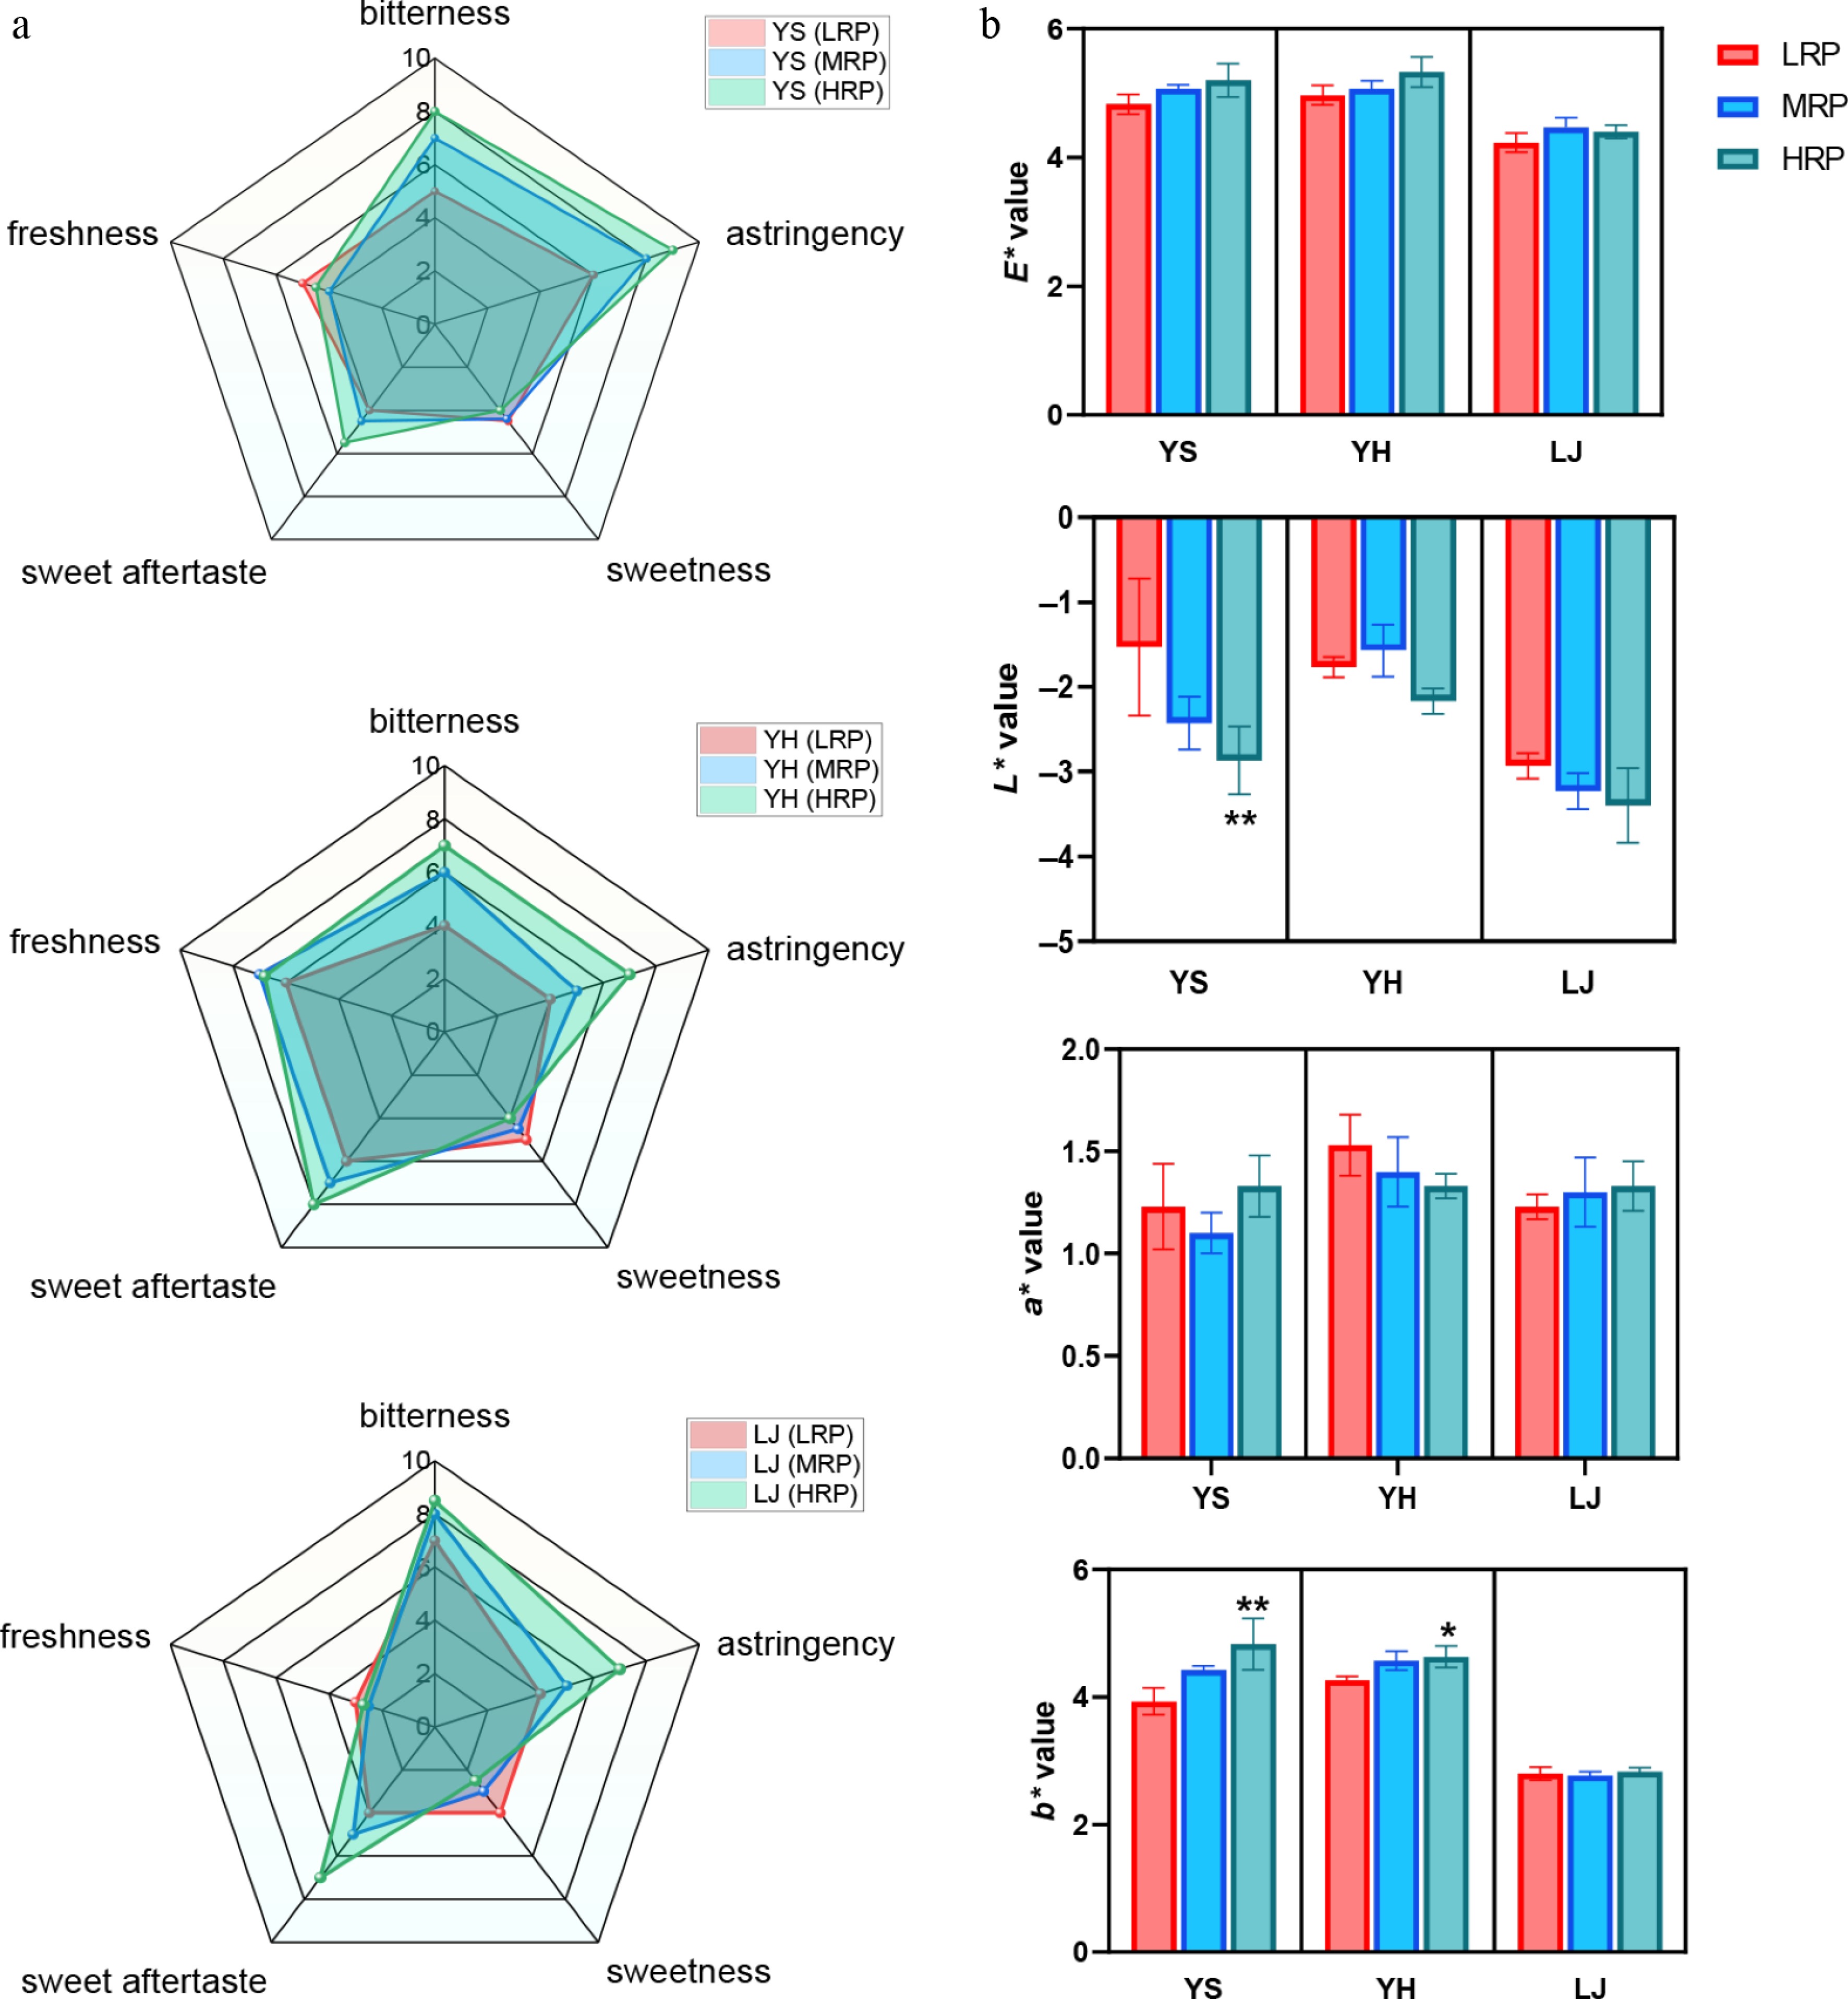
Figure 3.
Sensory evaluation and chromatic analysis of green tea samples with different rolling pressure treatments. (a) Taste attributes of green tea samples. (b) Chromatic difference analysis of green tea samples. * p < 0.05 and ** p < 0.01 indicate that significant differences were observed between groups within each cultivar. YS, green tea processed by YS cultivar; YH, green tea processed by YH cultivar; LJ, green tea processed by LJ cultivar. LRP, green tea processed with low rolling pressure; MRP, green tea processed with medium rolling pressure; HRP, green tea processed with high rolling pressure.
Chromatic analyses were performed to investigate the color characterization among infusions (Fig. 3b). Among the three cultivars, the total color difference (E*) tended to increase, while the lightness (L*) of tea infusions decreased as rolling pressure increased, a trend consistent with previous findings on black tea[7]. For example, as the rolling pressure increased, the value of L* for YS significantly decreased from –1.53 (LRP) to –2.87 (HRP) (p < 0.01). Additionally, no significant changes were observed in a* values among different rolling pressures, while b* values in YS and YH tended to increase, which indicated the tea infusion turned more yellow with the increase of rolling pressures.
Changes in the main chemical compounds under different rolling pressures
-
During processing, green tea is rolled for varying pressures, which causes alterations in the primary quality components. As shown in Fig. 4, the water extract content of samples from each cultivar increased significantly with increasing rolling pressure. The highest water extract contents were found in LJ (432.13 mg/g) and YH (431.51 mg/g) samples treated with the high rolling pressures, respectively. Free amino acids are generally regarded as key components of tea, which positively regulate the taste profile of tea infusions[23]. The three cultivars showed an overall decreasing trend in amino acid content with increasing rolling pressure. The YH cultivar had the highest amino acid contents, and the level decreased from 42.40 mg/g (LRP) to 36.55 mg/g (HRP) with increasing rolling pressure. Similarly, the amino acid content in black tea was found to decrease with the extension of rolling time[24]. Polyphenols play a crucial role in the overall flavor profile of green tea, contributing to the bitterness and astringency[25]. In terms of tea polyphenol contents, the three varieties showed an overall increasing trend with increasing rolling pressure. Among the three cultivars, YH samples exhibited the highest polyphenol content, which increased with increasing rolling pressure from 210.82 mg/g (LRP) to 232.15 mg/g (HRP). A similar trend was observed in the other two cultivars. Prior studies have reported that the rolling process induces the rupture of tea leaf cells, thereby facilitating the reaction between polyphenols and PPO. Consequently, the contents of polyphenol oxidation products, including theaflavins (TFs), thearubigins (TRs), and theabrownins (TBs), are significantly increased[22,24]. Soluble sugars enhance the sweetness and improve the taste of green tea[26]. In the current study, the soluble sugar content of the three cultivars showed a decreasing trend with increasing rolling pressure. An increase in rolling pressure promoted the cell disruption, which may accelerate the Maillard reaction and degradation of amino acids and soluble sugars. During heating, free sugars and amino acids react to generate Amadori rearrangement products, which further decompose into α-dicarbonyl compounds. These key intermediates then participate in Strecker degradation with amino acids, promoting the formation of heterocyclic compounds and Strecker aldehydes that contribute significantly to the characteristic roasted aroma of tea[27,28]. Caffeine is an alkaloid that provides the bitterness of tea liquor and invigorates the spirit[29]. Caffeine amounts remained relatively stable among different rolling pressures for all three cultivars.
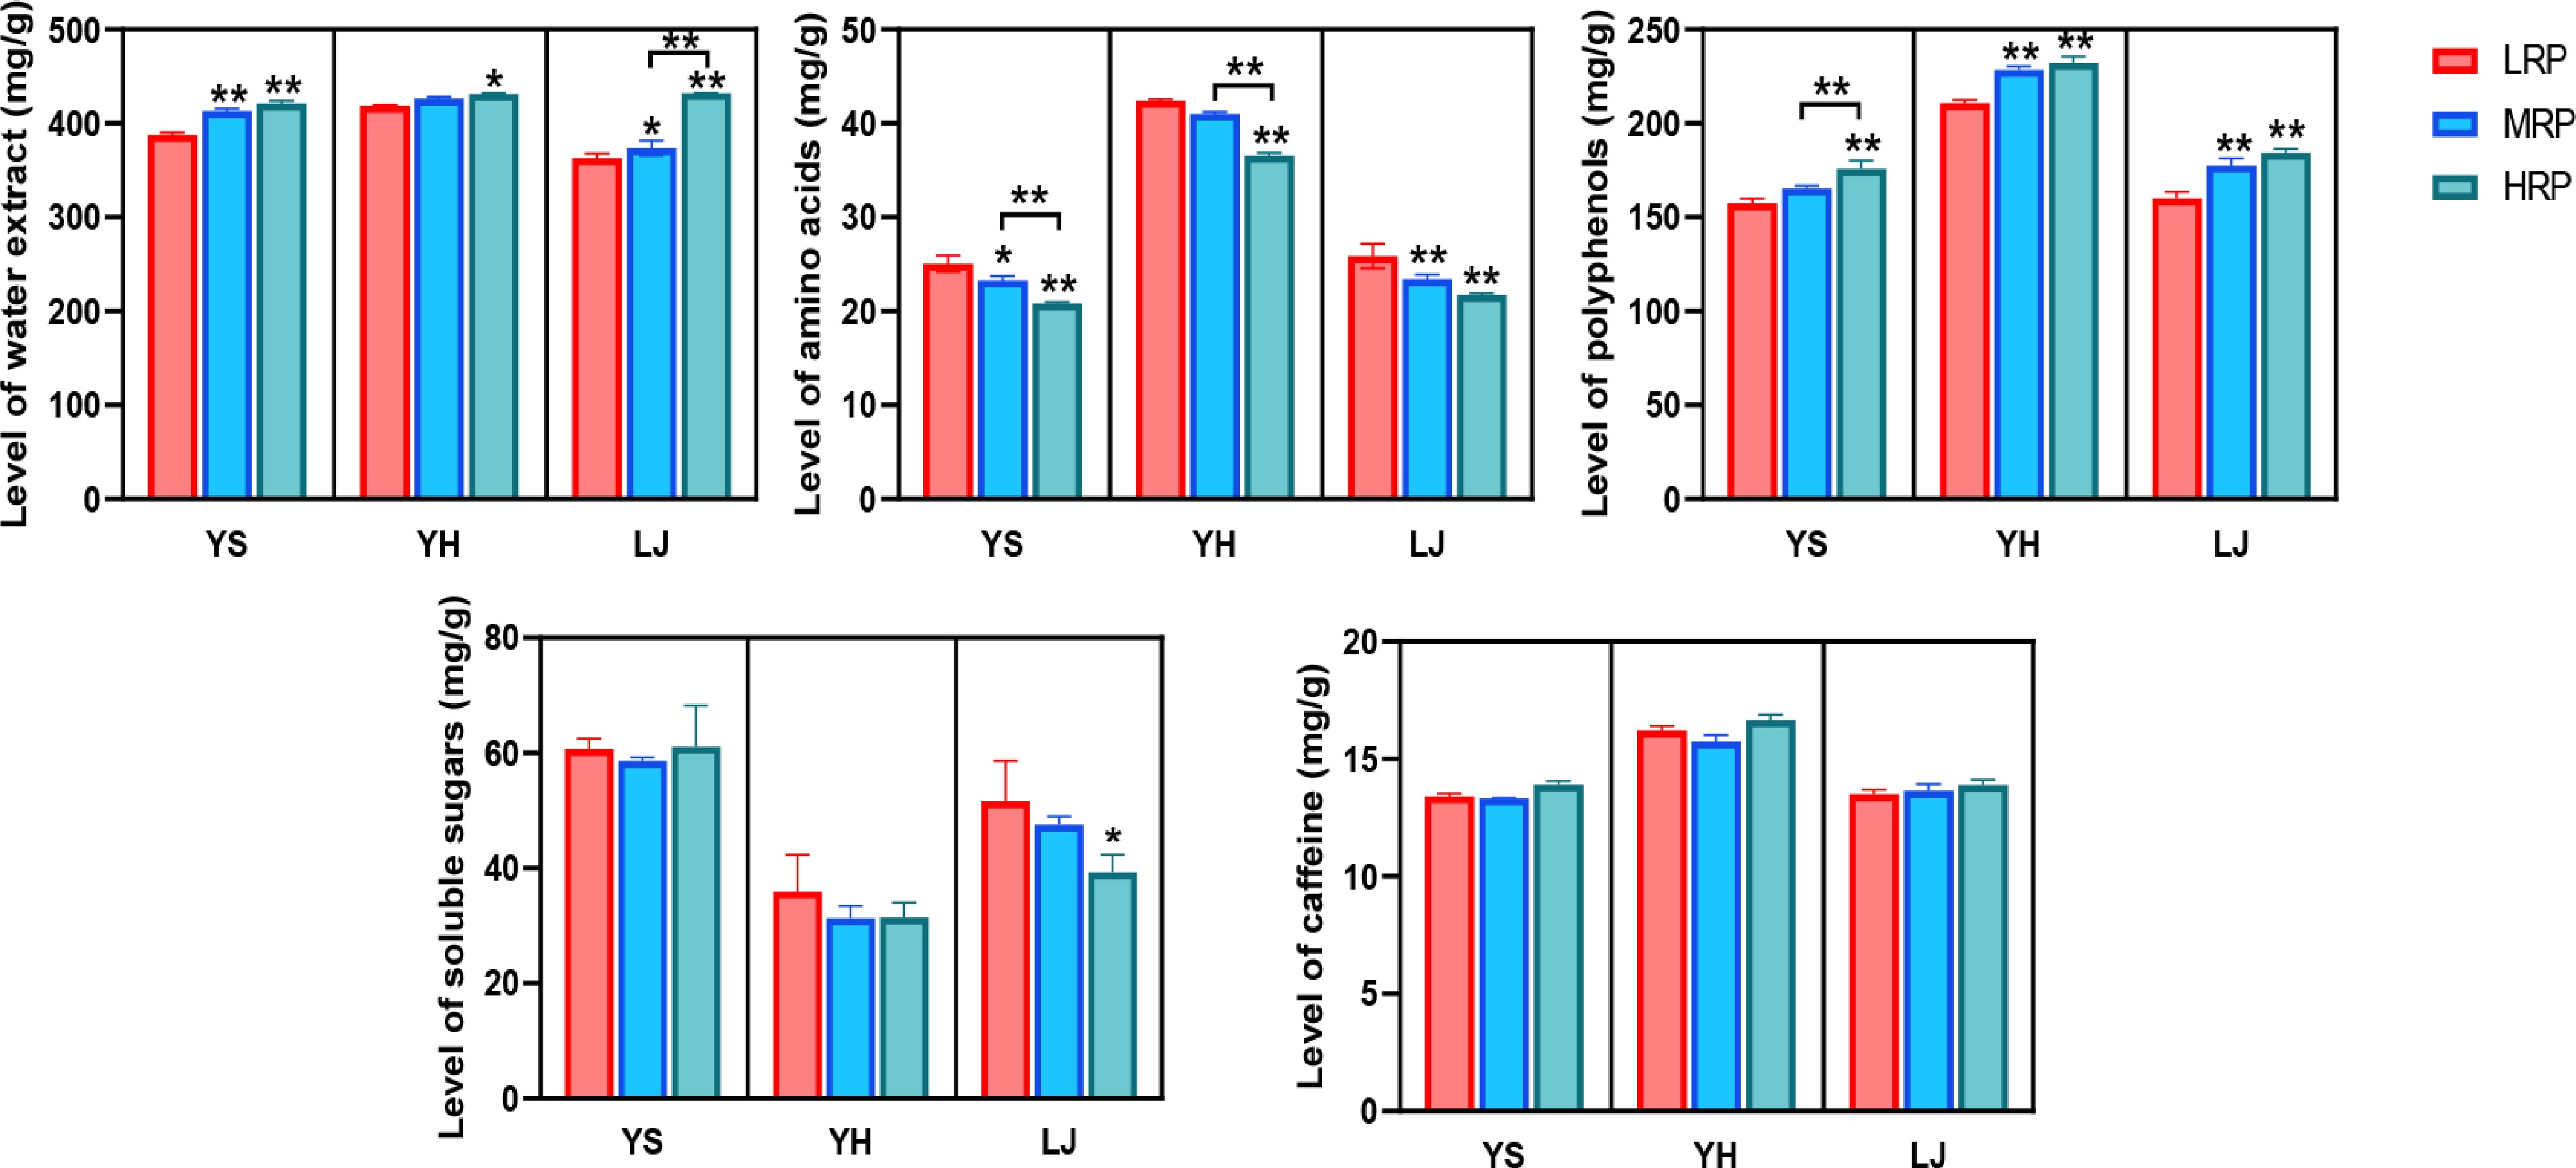
Figure 4.
Contents of basic compounds in green tea samples. * p < 0.05 and ** p < 0.01 indicate that significant differences were observed between groups within each cultivar. YS, green tea processed by YS cultivar; YH, green tea processed by YH cultivar; LJ, green tea processed by LJ cultivar. LRP, green tea processed with low rolling pressure; MRP, green tea processed with medium rolling pressure; HRP, green tea processed with high rolling pressure.
Effect of rolling pressures on catechins
-
The alterations in catechins, the most critical components of tea polyphenols, exhibited significant variations across different rolling pressure treatments among the three tested cultivars (Fig. 5). These catechins primarily include EGCG, EC, GC, C, ECG, GCG, EGC, and CG[25]. Not just to be considered as the main contributors to the bitterness and astringency of tea infusion, a large number of studies have reported that catechins, particularly EGCG, are potential anticancer agents and are associated with the amelioration of post-cancer chemotherapy-derived side effects[30]. Congruent with the previous reports, our findings demonstrated that EGCG was the most abundant of all catechin monomers[4]. Moreover, the relative percentage of EGCG was the highest under high rolling pressure across all cultivars, particularly in YS. Specifically, the EGCG content increased significantly with increasing rolling pressure, from 66.64 mg/g (LRP) to 74.12 mg/g (HRP) in YS (p < 0.01), whereas no significant increase was observed in the YH and LJ cultivars between different rolling pressure treatments. Similarly, the contents of several catechin monomers, including C, GC, CG, and GCG, showed a relatively obvious increasing trend with the elevation of rolling pressure. For instance, the GC content in the YS cultivar rose from 2.05 to 4.76 mg/g, while that in the YH cultivar varied slightly within the range of 5.23 to 5.92 mg/g (p < 0.01). In contrast, the contents of the other three catechin monomers (EC, EGC, and ECG) did not change significantly across different rolling pressure treatments.
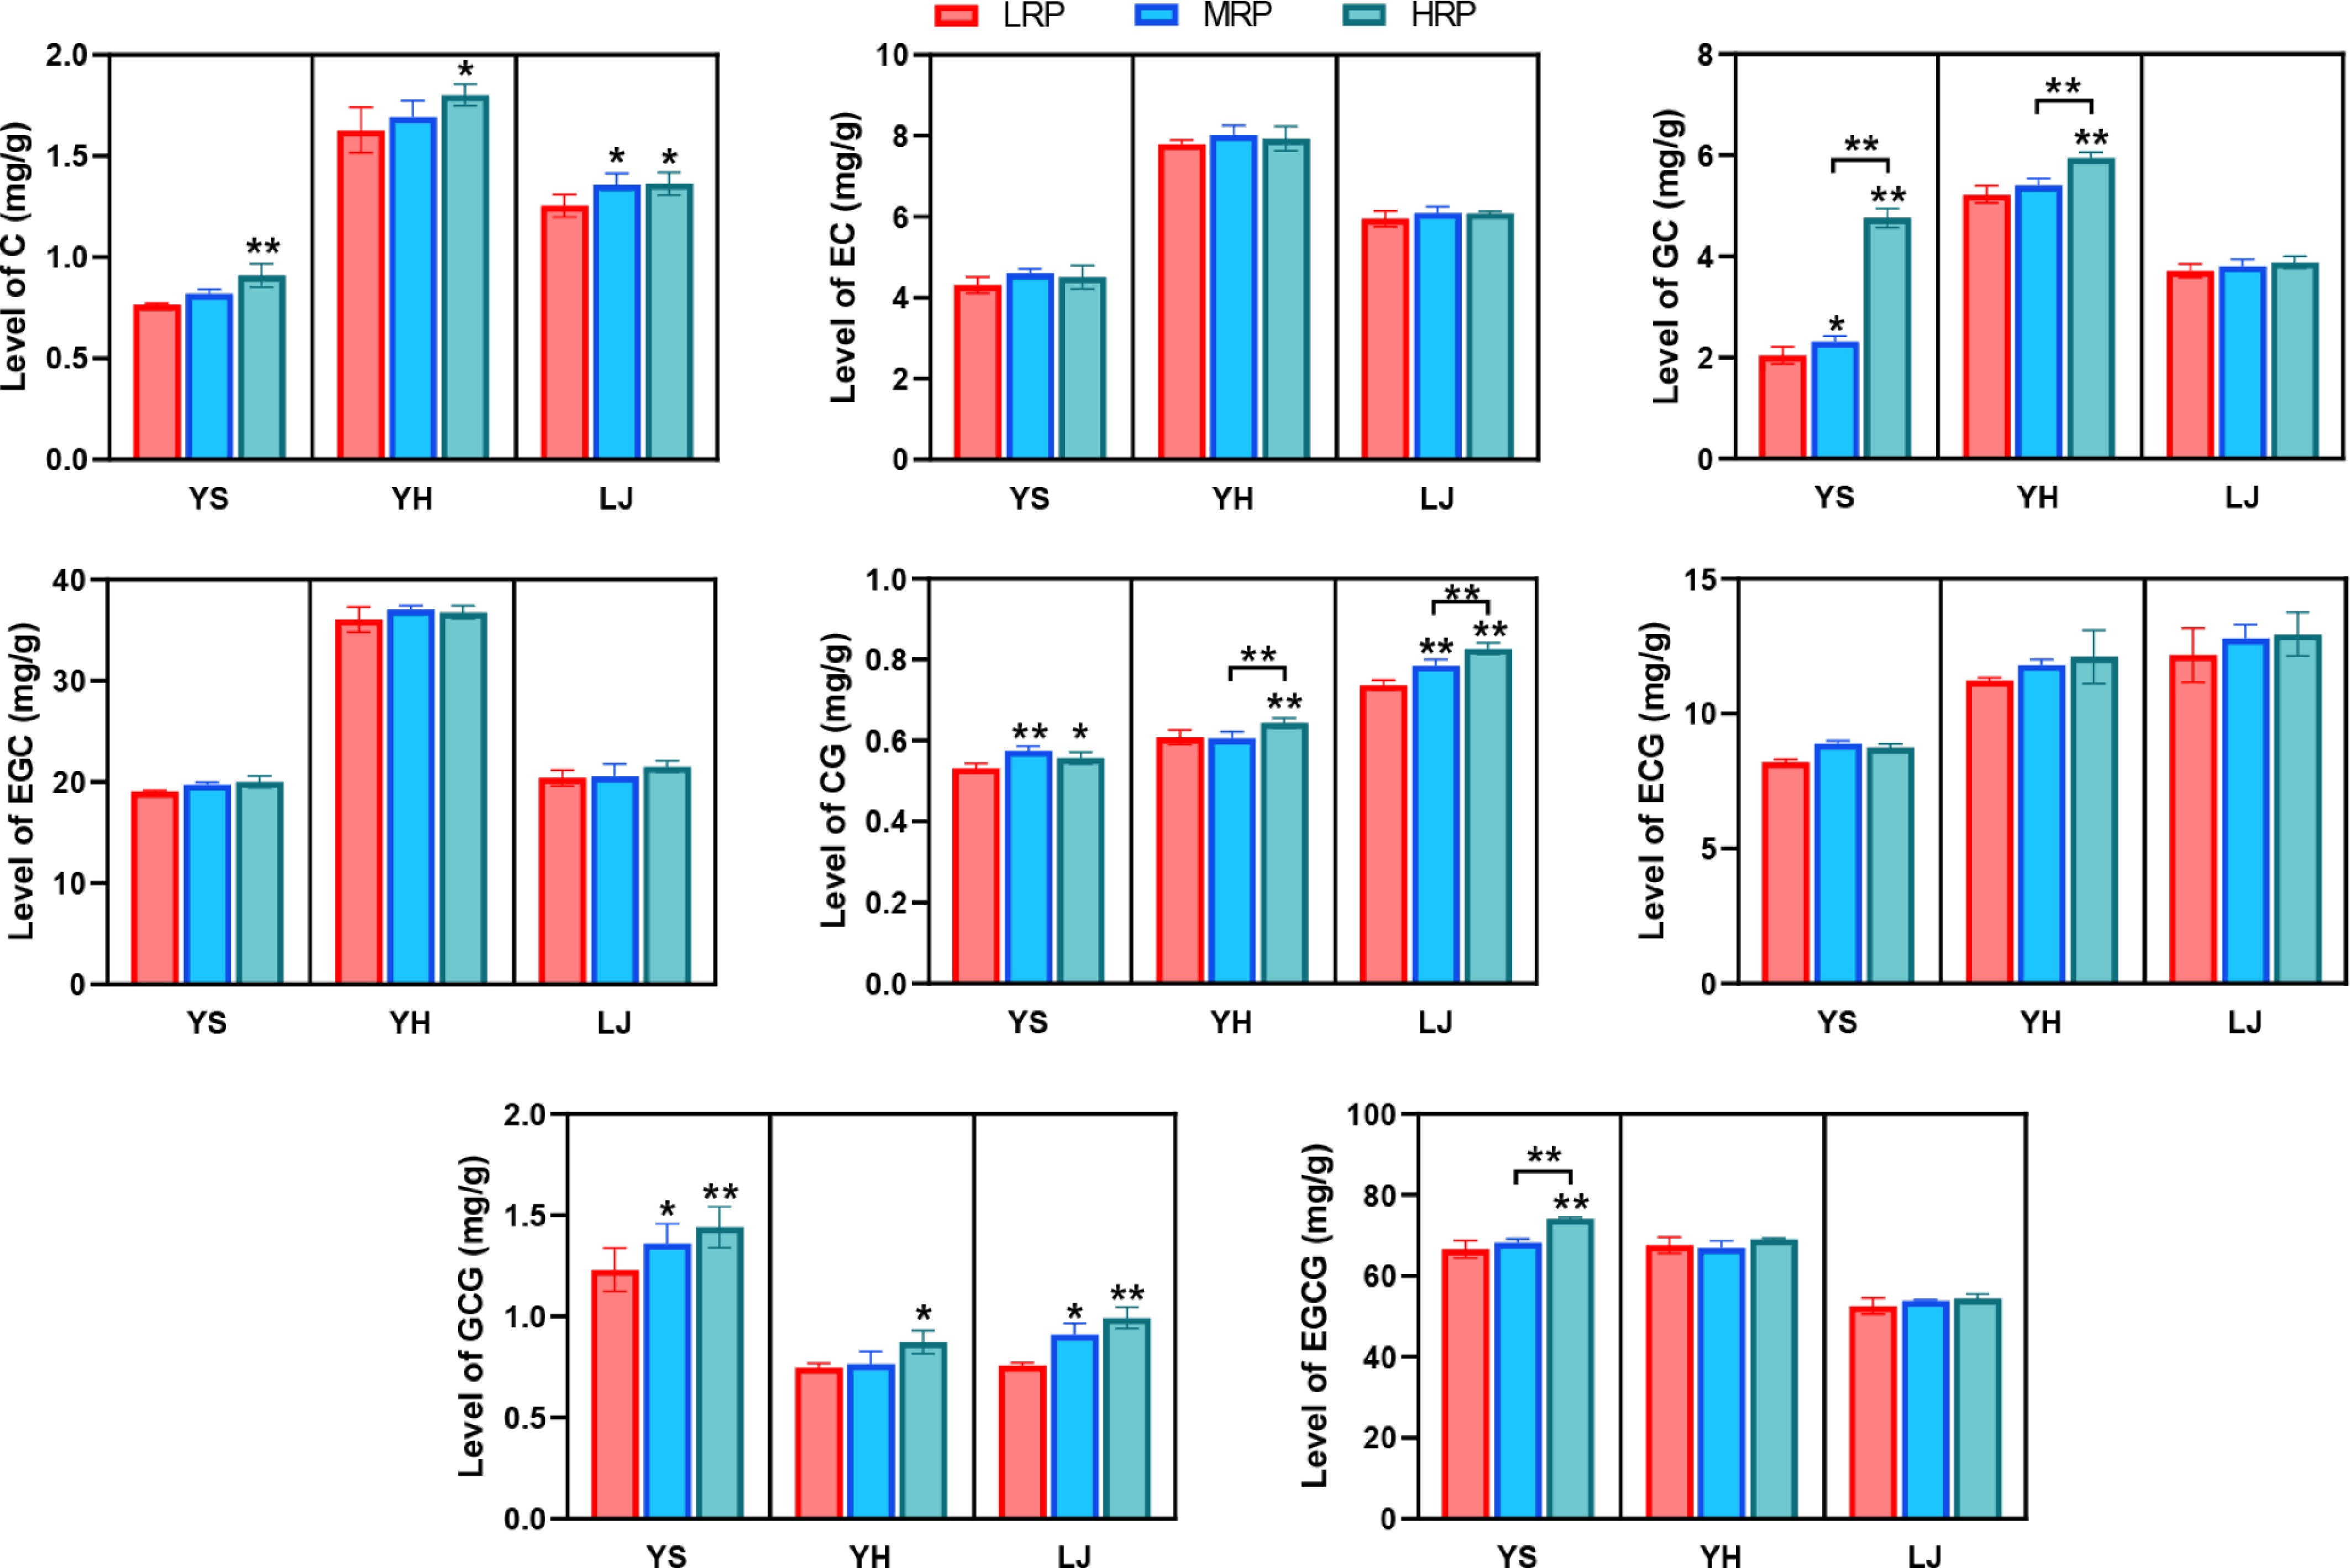
Figure 5.
Levels of catechin monomers in green tea samples. * p < 0.05 and ** p < 0.01 indicate that significant differences were observed between groups within each cultivar. YS, green tea processed by YS cultivar; YH, green tea processed by YH cultivar; LJ, green tea processed by LJ cultivar. LRP, green tea processed with low rolling pressure; MRP, green tea processed with medium rolling pressure; HRP, green tea processed with high rolling pressure.
Dynamic changes of metabolites under different rolling pressures
-
The effect of different rolling pressures on the metabolic profile of YS, YH, and LJ tea samples was further explored. The score plots of the PLS-DA model demonstrated that YS and LJ tea samples subjected to three distinct rolling pressure treatments could be completely differentiated based on their metabolite profiles. In contrast, different rolling pressure treatments did not obviously categorize the metabolites of YH, with particularly less significant differences observed between those of medium and high rolling pressures treatments (Fig. 6a). Therefore, the differences of metabolites in YS and LJ samples under different rolling pressures were subsequently focused on. Key differential metabolites of YS and LJ cultivars were screened with the criteria of VIP > 1 and p < 0.05. The VIP value reflects the contribution of each metabolite to group differentiation, and a threshold of VIP > 1 is widely used to identify metabolites with significant discriminant ability. A p < 0.05 was used to indicate statistically significant differences[31,32]. A total of 48 and 28 key differential metabolites were screened out in YS and LJ, respectively, categorized into amino acids and their derivatives, flavonoids, lipids and lipid-like molecules, and benzenoids (Tables 1 and 2). The abundance of the main differential metabolites in these two cultivars under three rolling pressure treatments is presented in Fig. 6b. In this study, five amino acids and their derivatives showed significant differences under different rolling pressures in either YS or LJ cultivars. Among them, the levels of L-histidine trimethylbetaine, S-prenyl-L-cysteine, and N-feruloylglycyl-L-phenylalanine in YS, and L-norleucine in LJ, were upregulated with increasing rolling pressure, suggesting that moderately increasing rolling pressure can promote the accumulation of bitter-tasting amino acids[33,34]. This aligns with previous findings in black tea[7]. In terms of flavonoids, a total of 18 differentially accumulated flavonoids were identified in YS and LJ, which are primarily characterized by bitter and astringent tastes[35,36]. Samples processed with medium and high rolling pressures in LJ exhibited higher flavonoid levels, including kaempferol, limocitrol 3-glucoside, sakuranetin, apigenin, and narirutin, indicating that higher rolling pressure can partly enhance the bitterness and astringency intensity of tea infusion, which is in accordance with the sensory evaluation results. In the YS samples, the levels of 3,3',4',7-tetrahydroxyflavan, liquiritin, 3,3',5-trihydroxy-4',7-dimethoxyflavanone, and dihydroprudomenin exhibited decreasing trends; the levels of isowertin 2''-rhamnoside and isomargaritene increased; and the levels of isoorientin 2''-[p-coumaroyl-(->6)-glucoside], flavoxate, and kaempferol 3-neohesperidoside-7-(2''-p-coumaryllaminaribioside) first increased and then decreased. It is reported that elevated rolling pressure enhances the disruption of tea leaf cellular structures, thereby expediting the cleavage of glycosidic bonds and hydrolytic reactions, and inducing a decrease in flavonoid glycosides. On the other hand, rolling could in turn promote the accumulation of aglycone and glucose, which may be transformed into flavonoid glycoside during the baking step[37]. The lipid and lipid-like molecules in the YS and LJ samples mainly include fatty acids, prenol lipids, steroids, steroid derivatives, and glycerophospholipids[38]. In the YS samples, gamma-linolenic acid and (9S,10E,12Z)-9-hydroperoxy-10,12-octadecadienoate, with a higher VIP value of 4.9 and 2.6 respectively, are directly involved in linoleic acid metabolism, as well as beta-cubebene with a higher VIP value (4.3), exhibited higher levels in the higher rolling pressure treatments (MRP, HRP)[39]. Herein, increasing rolling pressure may promote the breakup of the wax layer, which is mainly composed of fatty acids and triglycerides[40]. Previous studies have demonstrated that the majority of fatty acids could serve as crucial aroma precursors, which can be converted into volatile compounds, including alcohols, aldehydes, and lactones via oxidation and degradation pathways, thus contributing to the floral and fruity aroma of tea[41]. However, specific fatty acids such as linolenic acid maintain their chemical structure and content during processing, but undergo slow oxidation and may cause an unpleasant smell during storage[42]. In the LJ samples, the levels of methyl epijasmonate and traumatic acid tended to decrease with increasing rolling pressure. Methyl epijasmonate, a key contributor to the orchid-like aroma, has been previously reported to accumulate primarily during withering, while high temperatures may drive its isomerization during fixation and drying stages[43]. Therefore, applying higher levels of rolling pressure can affect the lipid and lipid-like molecule content in tea leaves to some extent, thereby potentially contributing to the aroma formation of green tea. Benzenoids are one of the main categories of volatile organic compounds (VOCs). Herein, nine and two benzenoids were identified in YS and LJ samples, respectively[44]. Notably, the levels of two homologous compounds, 3-methylbenzaldehyde and benzaldehyde, showed opposite changes with increasing rolling pressure in YS samples: 3-methylbenzaldehyde decreased while benzaldehyde increased. Benzaldehyde has a sweet almond-like aroma and showed an increasing trend with prolonged roasting time during oolong tea processing[45,46].
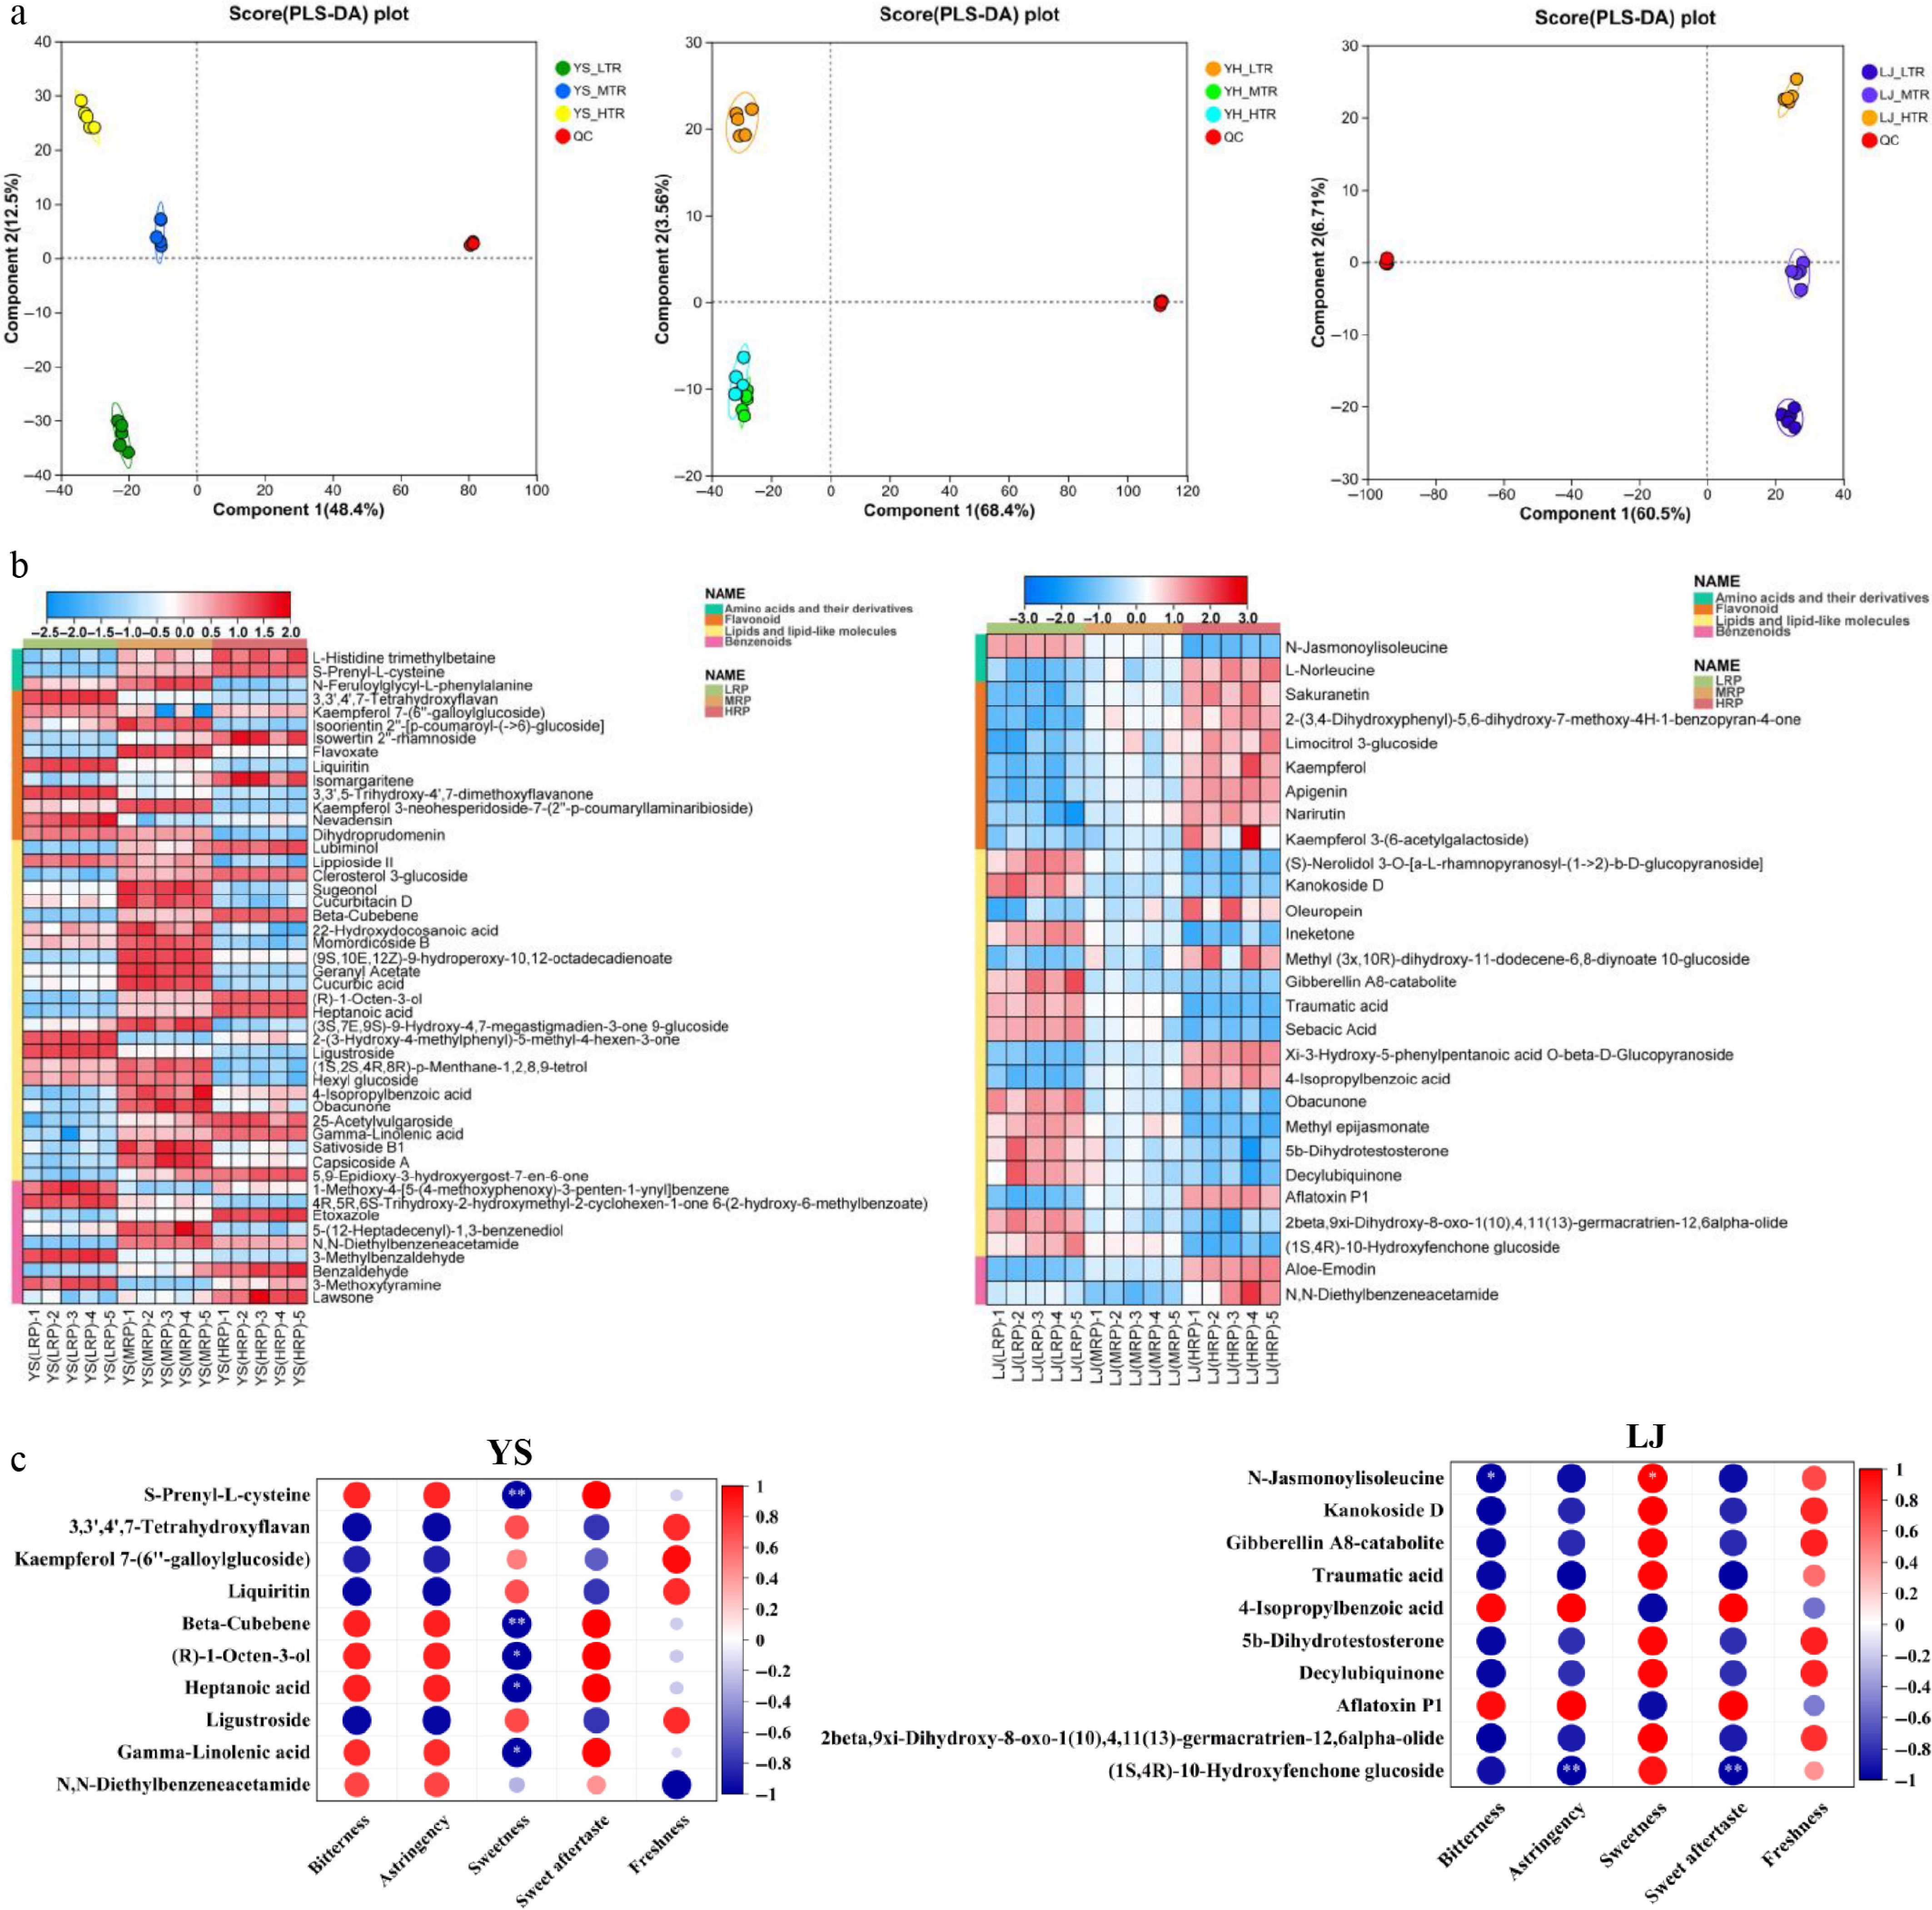
Figure 6.
Non-target metabolomics analysis of green tea samples by different rolling pressures. (a) PLS-DA score plots of metabolites in green tea samples. (b) Heatmap of dynamic changes of key metabolites in YS and LJ. (c) Correlation analysis between top 10 characterized metabolites with taste attributes. YS, green tea processed by YS cultivar; YH, green tea processed by YH cultivar; LJ, green tea processed by LJ cultivar. LRP, green tea processed with low rolling pressure; MRP, green tea processed with medium rolling pressure; HRP, green tea processed with high rolling pressure.
Table 1. Detailed information of 48 key differential metabolites among YS green tea samples treated by different rolling pressures.
No. Metabolites m/z RT/ min p VIP Fragmentation score Amino acids and derivatives 1 L-Histidine trimethylbetaineb 198.1236 0.69 < 0.01 1.5 36.1 2 S-Prenyl-L-cysteineb 377.1541 11.71 < 0.01 4.8 49.8 3 N-Feruloylglycyl-L-phenylalanineb 435.094 5.07 < 0.01 1.7 54 Flavonoids 4 3,3',4',7-Tetrahydroxyflavanb 293.1017 10.38 < 0.01 3.7 31.2 5 Kaempferol 7-(6''-galloylglucoside)b 601.1185 4.31 < 0.01 3.4 79.2 6 Isoorientin 2''-[p-coumaroyl-(->6)-glucoside]b 757.1963 5.11 < 0.01 1.7 66.7 7 Isowertin 2''-rhamnosideb 593.1863 5.75 < 0.01 2.3 76.5 8 Flavoxateb 433.2154 12.57 < 0.01 3.0 32.6 9 Liquiritina 419.1334 10.38 < 0.01 4.0 30.2 10 Isomargariteneb 637.178 5.75 < 0.05 1.9 44.4 11 3,3',5-Trihydroxy-4',7-dimethoxyflavanoneb 331.0823 11.54 < 0.01 2.9 36.8 12 Kaempferol 3-neohesperidoside-7-(2''-p-coumaryllaminaribioside)b 531.1431 4.94 < 0.01 2.2 40.3 13 Nevadensina 343.0824 13.47 < 0.01 2.7 79.3 14 Dihydroprudomeninb 1033.283 5.55 < 0.01 1.2 34 Lipids and lipid-like molecules 15 Lubiminolb 277.1772 7.30 < 0.01 1.5 47.5 16 Lippioside IIb 587.1964 5.18 < 0.01 1.2 52.3 17 Clerosterol 3-glucosideb 616.4628 11.22 < 0.01 2.7 43.3 18 Sugeonolb 298.1799 12.70 < 0.01 1.9 69.7 19 Cucurbitacin Db 549.3469 12.95 < 0.01 1.7 51.2 20 Beta-Cubebeneb 243.149 13.73 < 0.01 4.3 49.6 21 22-Hydroxydocosanoic acidb 374.3625 13.14 < 0.01 1.0 86.2 22 Momordicoside Bb 1012.546 11.59 < 0.01 1.9 54.3 23 (9S,10E,12Z)-9-Hydroperoxy-10,12-octadecadienoateb 353.2584 11.33 < 0.01 2.6 48.7 24 Geranyl Acetatea 215.164 5.28 < 0.01 1.8 42.4 25 Cucurbic acidb 213.1483 4.81 < 0.01 1.7 57.3 26 (R)-1-Octen-3-olb 129.1261 2.68 < 0.01 3.9 36.4 27 Heptanoic acidb 113.095 2.68 < 0.01 3.6 33.3 28 (3S,7E,9S)-9-Hydroxy-4,7-megastigmadien-3-one 9-glucosideb 388.2327 2.56 < 0.01 1.5 59.4 29 2-(3-Hydroxy-4-methylphenyl)-5-methyl-4-hexen-3-oneb 282.1448 1.44 < 0.01 2.0 30.1 30 Ligustrosideb 523.1825 5.77 < 0.01 3.8 70.5 31 (1S,2S,4R,8R)-p-Menthane-1,2,8,9-tetrolb 203.1282 5.09 < 0.01 1.4 39.1 32 Hexyl glucosideb 245.1392 5.09 < 0.01 1.1 71.3 33 4-Isopropylbenzoic acidb 209.0813 8.79 < 0.01 2.0 44.6 34 Obacunoneb 499.1979 8.82 < 0.01 2.0 51.2 35 25-Acetylvulgarosideb 523.2916 10.75 < 0.01 1.2 76.2 36 Gamma-Linolenic acidb 313.1923 12.94 < 0.01 4.9 56.8 37 Sativoside B1b 710.3165 11.85 < 0.01 2.4 31.7 38 Capsicoside Ab 710.3166 11.01 < 0.01 2.2 73.1 39 5,9-Epidioxy-3-hydroxyergost-7-en-6-oneb 479.2929 10.53 < 0.01 1.3 57 Benzenoids 40 1-Methoxy-4-[5-(4-methoxyphenoxy)-3-penten-1-ynyl]benzeneb 327.1588 4.96 < 0.01 1.7 50.2 41 4R,5R,6S-Trihydroxy-2-hydroxymethyl-2-cyclohexen-1-one 6-(2-hydroxy-6-methylbenzoate)b 309.0966 6.11 < 0.01 1.5 84 42 Etoxazolea 360.1766 13.69 < 0.01 1.7 85 43 5-(12-Heptadecenyl)-1,3-benzenediolb 385.2481 12.81 < 0.01 1.7 45.3 44 N,N-Diethylbenzeneacetamideb 192.1384 8.38 < 0.01 3.5 58.9 45 3-Methylbenzaldehydeb 121.065 5.80 < 0.01 3.0 44.4 46 Benzaldehydeb 107.0494 4.58 < 0.01 1.0 30.4 47 3-Methoxytyramineb 150.0913 3.67 < 0.01 1.9 55.8 48 Lawsoneb 393.0621 7.49 < 0.05 1.3 76.2 a and b indicate that the metabolite identification confidence levels correspond to Level 1 and Level 2 based on the Metabolomics Standards Initiative (MSI). Table 2. The detailed information of 28 key differential metabolites among LJ green tea samples treated by different rolling pressures.
No. Metabolites m/z RT/ min p VIP Fragmentation score Amino acids and derivatives 1 N-Jasmonoylisoleucineb 324.2167 9.54 < 0.01 3.9 51.9 2 L-Norleucineb 132.1019 1.09 < 0.01 1.3 63 Flavonoids 3 Sakuranetinb 305.1017 8.78 < 0.01 1.8 41.8 4 2-(3,4-Dihydroxyphenyl)-5,6-dihydroxy-7-methoxy-4H-1-benzopyran-4-oneb 358.0946 12.99 < 0.01 1.9 35.6 5 Limocitrol 3-glucosideb 559.1095 2.95 < 0.01 1.7 48.1 6 Kaempferola 285.0406 6.96 < 0.01 1.5 90.1 7 Apigenina 269.0457 6.76 < 0.01 1.5 86.9 8 Narirutinb 561.1614 5.68 < 0.01 2.3 88.4 9 Kaempferol 3-(6-acetylgalactoside)b 489.1038 5.03 < 0.01 1.8 83.5 Lipids and lipid-like molecules 10 (S)-Nerolidol 3-O-[a-L-rhamnopyranosyl-(1->2)-b-D-glucopyranoside]b 553.2981 10.94 < 0.01 1.4 77.7 11 Kanokoside Db 625.2656 13.59 < 0.01 3.2 60.4 12 Oleuropeinb 579.1498 4.38 < 0.01 1.4 66.9 13 Ineketoneb 351.2526 10.72 < 0.01 1.5 49.6 14 Methyl (3x,10R)-dihydroxy-11-dodecene-6,8-diynoate 10-glucosideb 421.1465 7.06 < 0.01 1.6 50.6 15 Gibberellin A8-cataboliteb 345.1329 6.24 < 0.01 3.6 72.2 16 Traumatic acidb 227.1284 7.91 < 0.01 3.4 54.5 17 Sebacic Acida 201.1125 5.84 < 0.01 1.8 86.6 18 Xi-3-Hydroxy-5-phenylpentanoic acid O-beta-D-Glucopyranosideb 391.119 8.41 < 0.01 2 32.5 19 4-Isopropylbenzoic acidb 209.0813 8.79 < 0.01 2.4 44.6 20 Obacunoneb 499.1979 8.82 < 0.01 2.1 51.2 21 Methyl epijasmonateb 245.118 12.52 < 0.01 2.3 49.9 22 5b-Dihydrotestosteroneb 335.2229 14.52 < 0.01 5.6 39.8 23 Decylubiquinoneb 321.207 14.24 < 0.01 5.5 43 24 Aflatoxin P1b 343.0462 7.10 < 0.01 2.5 59.8 25 2beta,9xi-Dihydroxy-8-oxo-1(10),4,11(13)-germacratrien-12,6alpha-olideb 277.1058 7.05 < 0.01 2.7 52.6 26 (1S,4R)-10-Hydroxyfenchone glucosideb 389.1818 5.79 < 0.01 2.4 48.6 Benzenoids 27 Aloe-Emodina 271.0598 6.75 < 0.01 1.9 71.4 28 N,N-Diethylbenzeneacetamideb 192.1384 8.38 < 0.05 1.4 58.9 a and b indicate that the metabolite identification confidence levels correspond to Level 1 and Level 2 based on the Metabolomics Standards Initiative (MSI). To further explore the contribution of key metabolites to flavor formation, correlation analysis was performed between the top 10 VIP-ranked compounds and taste attributes (Fig. 6c). In YS samples, compounds showed similar correlation patterns with bitterness, astringency, and sweet aftertaste. Specifically, S-prenyl-L-cysteine, beta-cubebene, (R)-1-octen-3-ol, heptanoic acid, gamma-linolenic acid, and N, N-diethylbenzeneacetamide were positively correlated with the intensities of these three taste attributes, whereas 3,3',4',7-tetrahydroxyflavan, kaempferol 7-(6''-galloylglucoside), liquiritin, and ligustroside were negatively correlated with them. Notably, these compounds exhibited opposite effects on sweetness and freshness. In particular, S-prenyl-L-cysteine, beta-cubebene, (R)-1-octen-3-ol, heptanoic acid, and gamma-linolenic acid were significantly negatively correlated with sweetness intensity. Among LJ samples, all compounds except 4-isopropylbenzoic acid and aflatoxin P1 were negatively correlated with the intensities of bitterness, astringency, and sweet aftertaste, but tended to positively contribute to sweetness and freshness. Among these, N-jasmonoylisoleucine was significantly negatively correlated with bitterness and positively associated with sweetness. In contrast, (1S,4R)-10-hydroxyfenchone glucoside was significantly negatively correlated with both astringency and sweet aftertaste.
-
For all three cultivars, increasing rolling pressure resulted in higher intensities of bitterness, astringency, and sweet aftertaste of tea infusions. Meanwhile, under higher rolling pressures, lightness of liquor decreased, and yellowness increased. Moreover, higher rolling pressures also promoted the contents of water-soluble extracts and polyphenols, whereas free amino acid content decreased. In addition, amino acids and their derivatives, flavonoids, lipids, and lipid-like molecules were identified as key metabolites among different treatments. Overall, this study provided new insights and verified the feasibility of the PLC system in the conventional rolling machine. These findings can serve as a reference for the precise and intelligent processing of tea. However, effects of a broader range of rolling parameters on tea quality should be explored under diverse fresh leaf conditions, including different cultivars, shoot tenderness levels, and growing altitudes, to further improve the PLC control system for wider industrial application.
-
The authors confirm their contributions to the paper as follows: study conception and design: Su ZC, Peng JY; investigation: Lv MZ, He MX; formal analysis: Lv MZ; software: Peng JY, Xu MF; resources: Wang C, Xu YQ; draft manuscript preparation: Wei R, Lv MZ, Yasir M; writing–review and editing: Wei R, Zhong XY, Yasir M, Qin FT, Walayat N, Xu YQ; supervision: Zhong XY, Walayat N; project administration: Su ZC; funding acquisition: Wei R, Xu YQ. All authors reviewed the results and approved the final version of the manuscript.
-
All data generated or analyzed during this study are included in this published article.
-
This study was supported by funds of Zhejiang Provincial Key Research and Development Program (Grant No. 2025C01093-13), Zhejiang Provincial Science and Technology Collaborative Project (Grant No. 2023SNJF021) and Zhejiang Province Collaborative Promotion Plan for Major Agricultural Technologies (Grant No. 2024ZDXT05-09) from the Department of Agriculture and Rural Affairs of Zhejiang Province to Ran Wei.
-
The authors declare that they have no conflict of interest.
-
# Authors contributed equally: Ran Wei, Min-Ze Lv
- Copyright: © 2026 by the author(s). Published by Maximum Academic Press, Fayetteville, GA. This article is an open access article distributed under Creative Commons Attribution License (CC BY 4.0), visit https://creativecommons.org/licenses/by/4.0/.
-
About this article
Cite this article
Wei R, Lv MZ, Zhong XY, Yasir M, Qin FT, et al. 2026. Effect of rolling pressure on sensory characteristics and non-volatile compounds profile of green tea. Beverage Plant Research 6: e028 doi: 10.48130/bpr-0026-0009 

Effect of rolling pressure on sensory characteristics and non-volatile compounds profile of green tea
- Received: 15 January 2026
- Revised: 25 February 2026
- Accepted: 18 March 2026
- Published online: 02 July 2026
Abstract: Rolling is the crucial step that controls the shape formation and final quality of curly tea. To further explore the effect of rolling pressure on green tea flavor and promote the application of emerging engineering technologies in traditional tea processing, a programmable logic control (PLC) system was employed to resolve the difficulty in rolling pressure detection, automatically regulate rolling pressure, and analyze its effects on green tea processing. The results indicated that under rotational conditions, the maximum lid pressures of leaves from all cultivars exhibited an obvious increase as the lid descended. As rolling pressure increased, the intensities of astringency, bitterness, and sweet aftertaste were enhanced, while the infusion lightness decreased and yellowness increased across all cultivars. Increased rolling pressure also led to a significant increase in water extract and polyphenols content; however, the amino acid content decreased. Leaves of the 'Yinhou' (YH) cultivar contained the highest levels of polyphenols and amino acids. With increasing rolling pressure, polyphenol content increased from 210.82 to 232.15 mg/g, whereas amino acid content decreased from 42.40 to 36.55 mg/g (LRP). Furthermore, rolling pressure exerted a more pronounced influence on metabolites, including amino acids, flavonoids, and lipids, particularly in the 'Yingshuang' (YS) and 'Longjing 43' (LJ) cultivars. Overall, rolling pressure exerted a significant effect on green tea quality in terms of both sensory characteristics and chemical profiles, and different tea cultivars showed distinct degrees of response to changes in rolling pressure.
-
Key words:
- Programmable logic control /
- Green tea /
- Rolling pressure /
- Non-targeted metabolomics