












-
Water has applications for irrigation in farming, human intake and usage, and even in electric power generation; it is also germane to the growth of both living and non-living things. In fact, there is no living creature that does not use water. This has given the substance an indispensable feature. There exists a strong relationship between electric and water utility needs: water and wastewater utilities need to supply water to their customers or treat sewage before releasing it to water bodies; large quantities of electrical energy are required for the operation of these water and wastewater processes. Electric utilities also require water to generate steam, cool thermoelectric power plants, and transport fossil fuel[1].
Several communities, institutions, and households in Nigeria are experiencing water poverty, whether as a result of the inability to extend national grid facilities to the communities or the high cost of renewable energy necessary for water pumping applications. Countries around the world are seriously looking for every means to abate the emission of greenhouse gases (GHGs) in their water pumping processes; hence, the employability of fossil fuels for water pumping or power generation is receiving less attention from researchers.
It is therefore of great importance to obtain a renewable option with a lower cost of energy and fewer emissions for water pumping in Nigeria. Wind shear is a useful factor in determining the wind speed of a location at a particular wind turbine height, given that the wind speed at an available height is known. The turbine height at which the wind speed is known and the height at which it is unknown must also be known.
Several researchers have attended to the subject of wind/solar/biomass as resources for electricity and water pumping applications. For instance, Olarewaju et al.[2] used 13 different locations in Nigeria to obtain the economic assessment of some proposed grid-integrated solar photovoltaic systems. The study infers that the cost of energy across all the 13 locations varies from
${\$} $ ${\$} $ ${\$} $ ${\$} $ ${\$} $ ${\$} $ ${\$} $ ${\$}$ ${\$} $ ${\$} $ ${\$} $ ${\$} $ ${\$}$ ${\$} $ ${\$} $ ${\$} $ Table 1. Research objective, methods, and evaluation metrics in the literature
S/N Research objective Methods Evaluation metrics 1 Wind energy potential in Yamoussoukro Statistical and analytical method[10] RMSE, MAE, COE, MAPE, R2 2 Economic analysis and capacity configuration of integrated wind-solar-thermal-storage generation system Net profit economic model based on adaptive weight particle swarm algorithm[11] LCoE, Net profit 3 Techno-enviro-economic viability of wind farms in Palestine Numerical and statistical method[12] Power density and average wind speed, capacity factor, wind turbine output energy 4 Wind energy resource potential Statistical and analytical method[14] Wind speed characteristics, power density, Weibull parameters 5 Evaluation of wind shear, roughness coefficient Statistical and analytical method[15] Wind shear coefficients and roughness length 6 Determination of conditions of atmospheric stability and
wind shear coefficient determinationAnalytical method[16] Wind shear coefficient, stability class 7 Surface roughness parameter and wind shear exponent determination Analytical and statistical method[17] Wind shear exponent, Weibull shape (k) and scale (c) parameters 8 Technical-economic analysis of hybrid solar-wind-biomass Statistical and analytical[3] Weibull parameters, LCoE, CO2 saved 9 Assessment of proposed grid-integrated solar Analytical[2] Yr, Ya, Yf, CF, PR, PBP, LCoE 10 Techno-economic analysis of the viability of two standalone water pumping systems Analytical[7] Energy saving ratio, TLCC, NPV, LCoE, CO2 saving, CO2 cost saving The aforementioned literature showed that the technical and economic feasibility of renewable energy resources has been explored for different locations around the world; wind indices such as roughness parameters and wind shear have also been obtained for some locations, and only a few studies exist on renewable energy resources for water pumping applications. Table 1 also revealed that the analytical method is widely accepted by many authors, and diverse parameters are used as evaluation metrics depending on the resources employed for the study. However, this type of investigation is site-specific as there is no one resource best for all locations in a nation. To the best of the authors' knowledge, earlier studies conducted on renewable-energy-based water pumping systems in Nigeria employed only one renewable energy source, which does not allow for a side-by-side comparison with other renewable sources. Furthermore, wind speeds at a turbine hub height are needed to obtain accurate wind power of the turbine at a given site. However, wind speeds at the exact turbine height are seldom available from the meteorological station. In the event of downtime of one of the anemometers in a meteorological station or in the presence of only one anemometer, wind speeds at various hub heights can be obtained given knowledge of the wind shear exponent of the site. Therefore, this study seeks to perform a technical and economic investigation of three renewable resources (solar, wind, and biomass) for water pumping applications in six different locations and to obtain the wind shear exponent values across the 36 state capitals and the Federal Capital of Nigeria. This paper therefore serves as a relevant source of scientific information for renewable energy operators, regulators, and researchers to obtain the technical and economic behaviour of the three resources considered and the knowledge of wind speed obtainable from wind shear at these locations.
-
The data employed for this study were obtained from six different sites in the six geopolitical regions of Nigeria. Each site is a federal university in each state capital, representing the region. The wind data used are daily average wind speeds obtained at 10 and 50 m anemometer hub heights. Both the wind speed and solar irradiation were obtained for a period of 11 years between 2014 and 2024 from the National Aeronautics and Space Administration (NASA). The waste generated, in kg/capital/day was obtained from Ogunjuyigbe et al.[21] and Ayodele et al.[22]. The geographical location of the sites and the waste generation expressed in kg/capital/day were furnished in Table 2. The electrical pumping requirement was obtained from Amusan et al.[3], and this value was then used to extrapolate the energy demand for pumping requirements in each of the six sites in this study. The electrical pumping requirements for each of the sites are shown in Table 3.
$ {P}_{A} $ $ {P}_{B} $ Table 2. Location of study with their geographical location
S/N Geographical region Sites Population Waste (kg/capital/d) Lat. (°N) Long. (°E) S1 Southwest University of Ibadan 33,000 0.51 7.42 3.93 S2 Southeast Alex Ekweme Federal University (Abakaliki) 12,230 0.53 8.29 8.62 S3 South-south University of Benin 45,000 0.50 6.20 5.36 S4 North-central University of Abuja 55,364 0.66 8.58 7.10 S5 Northeast Abubakar Tafawa Balewa University (Bauchi) 18,685 0.22 9.39 10.04 S6 Northwest Federal University, Dutse 4,532 1.00 11.42 9.22 Table 3. Water pump requirements for each site
Pumps Vertical pump
rating (kW)Unit Total (kW) Booster station A $ \left({P}_{A}\right) $ 7.50 4 30.00 5.50 2 11.00 3.00 4 12.00 Booster station B $ \left({P}_{B}\right) $ 2.32 1 2.32 2.29 2 4.58 Submersible pump rating 5.00 2 10.00 Total Power $ \left({P}_{A}+{P}_{B}\right) $ 69.90 Excess for future expansion 30% of $ \left({P}_{A}\;+\;{P}_{B}\right) $ Overall power requirement 91.00 Power requirement for site S1 165.00 Power requirement for site S2 61.00 Power requirement for site S3 226.00 Power requirement for site S4 278.00 Power requirement for site S5 93.00 Power requirement for site S6 23.00 Turbine index Turbine manufacturers Turbine operating speed range (m/s) Rotor diameter (m) Rated power (kW) Hub height (m) $ \boldsymbol{V}_{\boldsymbol {ci}} $ $ \boldsymbol {V}_{\boldsymbol r} $ $ \boldsymbol{V}_{\boldsymbol {co}} $ $ {T}_{1} $ MICON 4.0 14.0 25.0 30.0 200.0 30.0 $ {T}_{2} $ MEPC-MICON 4.0 15.0 25.0 31.0 400.0 30.5 $ {T}_{3} $ ENERCON E-40 2.5 13.0 25.0 44.0 600.0 46.0 $ {T}_{4} $ VESTAS V-47 5.0 15.0 25.0 35.0 660.0 45.0 $ {T}_{5} $ VESTAS V-52 4.0 17.0 25.0 52.0 850.0 55.0 $ {T}_{6} $ MITSUBISHI MWT 4.5 14.4 24.0 29.0 300.0 30.0 $ {T}_{7} $ DW 54 EWT 2.5 7.5 25.0 54.0 250.0 35.0 $ {T}_{8} $ Aeolos-H 100 2.5 10.0 16.0 24.5 100.0 30.0 $ {T}_{9} $ Aeolos-H 30 3.0 9.0 16.0 15.6 30.0 24.0 Table 5. Technical specifications of the best (Panasonic solar) SPV module[27]
S/N SPV module parameters Rating 1 Nominal maximum power (Pmax) 335.00 Wp 2 Opt. operating voltage (Vmp) 59.90 V 3 Opt. operating current (Imp) 5.60 A 4 Open-circuit voltage (Voc) 71.50 V 5 Short-circuit current (Isc) 6.05 A 6 Module efficiency (M%) 20.00% 7 Operating temperature $ ({T}_{\text{op}}(-),{T}_{\text{op}}(+)) $ −40 °C ~ +85 °C 8 Maximum system voltage $ \left({V}_{\text{ms}}\right) $ 1,000 V 9 Max. Series fuse rating $ \left({I}_{\text{msf}}\right) $ 15 A 10 Power tolerance $ \left({P}_{\text{tol}}\right) $ ± 3.00% 11 Cell type Monocrystalline silicon 12 Temperature coefficient (Pmax) $ \left(\gamma \right) $ −0.26%/°C 13 Temperature coefficient (Voc) $ \left(\beta \right) $ −0.24%/°C 14 Temperature coefficient (Isc) $ \left(\alpha \right) $ +0.06%/°C 15 Model number $ \left({N}_{\text{md}}\right) $ VBHN335KJ01 16 Degradation rate 3.00% (first year), 0.45%/year -
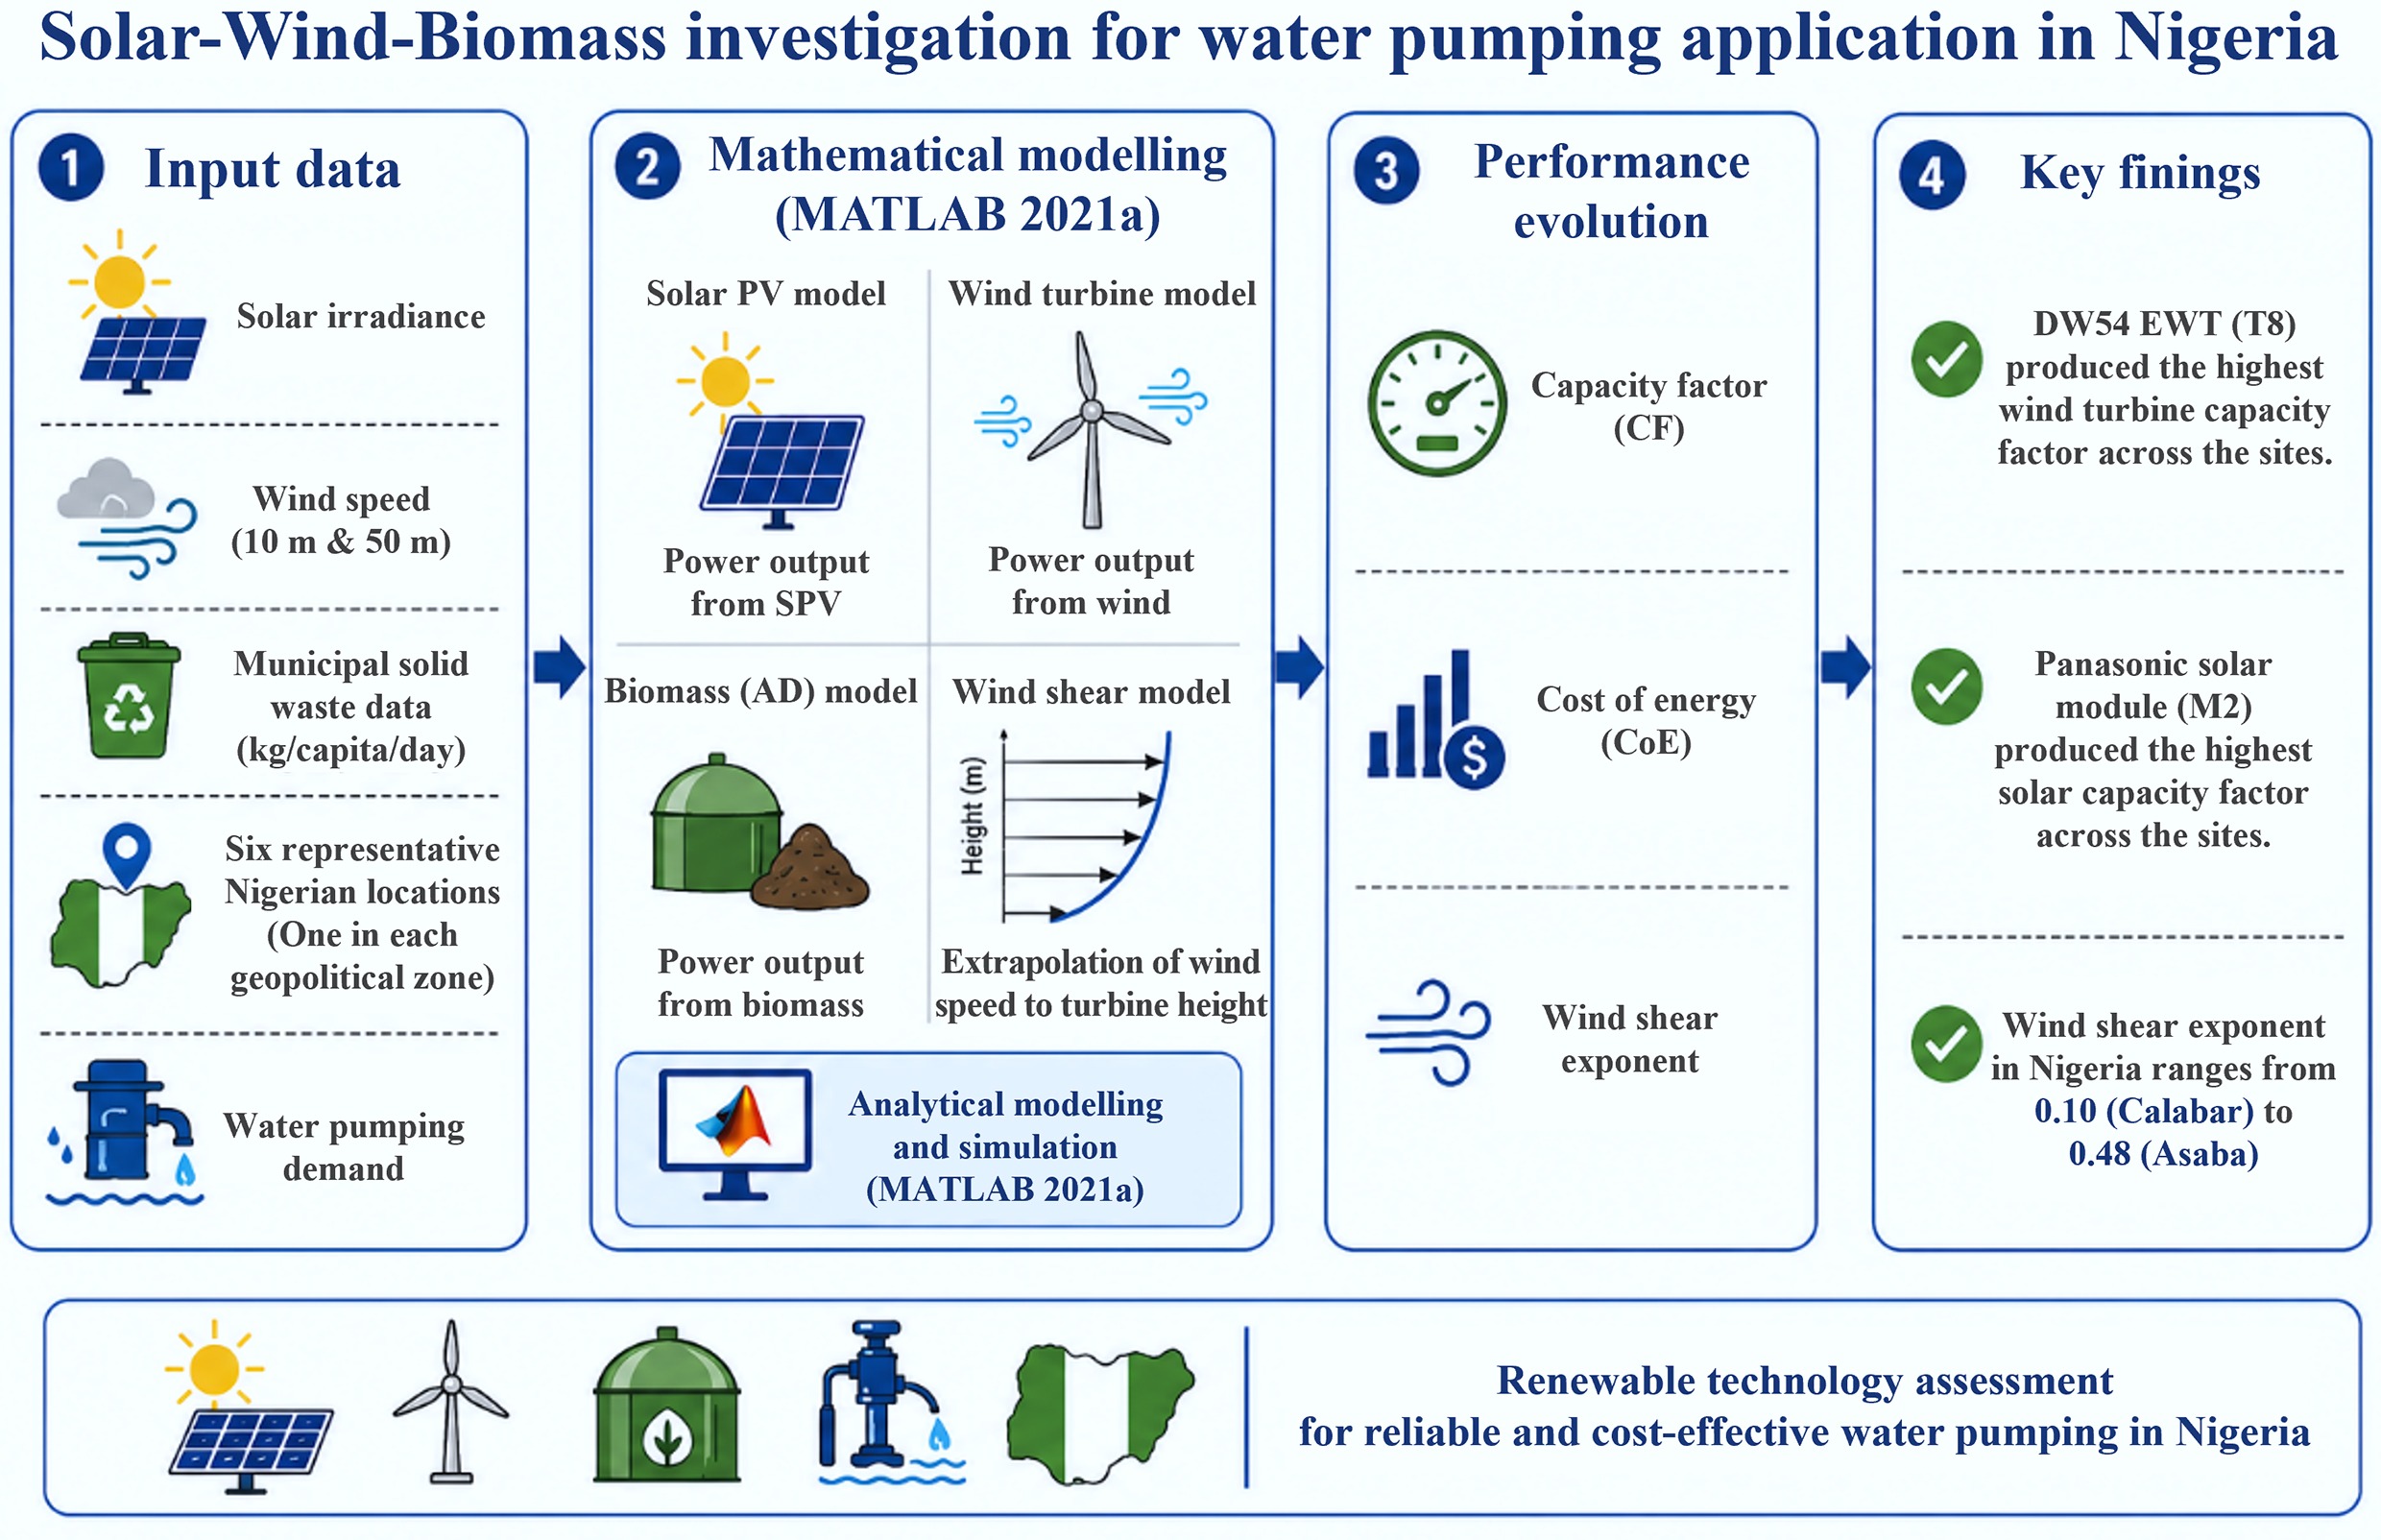
The methodology used in the solar-wind-biomass investigation for water pumping application is presented in this section. All modelling and simulation were performed using MATLAB 2021a.
Water pump power requirement
-
The overall power requirement[3] estimated from two booster stations with power requirements
$ {P}_{A} $ $ {P}_{B} $ $ {P}_{P1}=1.3\left(\sum{P}_{A}+\sum{P}_{B}\right)\left(kW\right) $ (1) The power required for pumping in station
$ {P}_{P2} $ $ P_{P2}=1.3\times\left(\dfrac{1.77P_{op2}\times P_{P1}}{P_{op1}}\right)\left(kW\right) $ (2) where
$ {P}_{op1} $ $ {P}_{p1} $ $ {P}_{op2} $ $ {P}_{p2} $ Solar power harvesting
-
The energy harvestable from solar photovoltaic (SPV)[2] is represented by Eq. (3):
$ \begin{split}{E}_{sys\left(i\right)}=&\left(1-\dfrac{{d}_{mt}}{100}\right)*\left(1-\dfrac{{d}_{tp\left(i\right)}}{100}\right)*\left(1-\dfrac{{d}_{dt}}{100}\right)*\\&G\left(i\right)*{\eta }_{pv,inv}*{\eta }_{inv}*{\eta }_{inv,sw}*{P}_{array}\end{split} $ (3) In Eq. (3),
$ {\eta }_{pv,inv} $ $ {\eta }_{inv} $ $ {\eta }_{inv,sw} $ $ {d}_{mt}$ ${d}_{tp} $ ${d}_{dt} $ $ G\left(i\right) $ Wind power harvesting
-
The amount of wind power[23] that can be obtained from wind is depicted in Eq. (4):
$ {P}_{e\left(v\right)}=\begin{cases} {P}_{r}\dfrac{{v}^{2}-v_{ci}^{2}}{v_{r}^{2}-v_{ci}^{2}};\left({v}_{ci}\leqslant v\leqslant {v}_{r}\right)\\ {P}_{r}=\dfrac{1}{2}\rho A{C}_{p}v_{r}^{3};\left({v}_{ci}\leqslant v\leqslant {v}_{co}\right)\\ 0;\left(v\leqslant {v}_{ci}\;{\rm{and}}\;v\geqslant {v}_{co}\right) \end{cases} $ (4) Here,
$ {v}_{ci} $ ${v}_{r} $ ${v}_{o} $ $ v $ $ \rho $ $ A $ $ {C}_{p} $ Waste generation modelling
-
The extrapolated population
$ \left(P\right) $ $ P=P_O\left(1+r\right)^t $ (5) where
$ {P}_{O} $ $ t $ $ r $ $ \left({M}_{T}\right) $ $ M_T=P\times w_c\times365 $ (6) where
$ {w}_{c} $ The quantity of waste taken to dump site can be obtained as
$ M_F=0.74\times M_T\left(kg/year\right) $ (7) Models of anaerobic digestion technology for energy generation from municipal solid waste (MSW)
-
Biogas is made up of a mixture of carbon dioxide (CO2), methane (CH4), and small traces of other gases. The mass of methane[21] that is obtainable from any potential waste-to-energy project using anaerobic digestion technology is given in Eq. (8):
$ M_{CH4}=\dfrac{16*A_3}{\left(M_c*n\right)+\left(M_H*a\right)+\left(M_O*b\right)+\left(M_N*c\right)}*1,000 $ (8) The model for determining the expected methane yield[28] from anaerobic digestion of organic compounds having a composition of
$ {C}_{n}{H}_{a}{O}_{b}{N}_{c} $ $ C_nH_aO_bN_c+A_1H_2O\Rightarrow A_2CO_2+A_3CH_4+A_4NH_3 $ (9) where
$ {A}_{1} $ ${A}_{2} $ ${A}_{3} $ ${A}_{4} $ $ n, \;a, \;b $ $ c $ $ n=\dfrac{{K}_{c}}{{M}_{c}} $ (10a) $ a=\dfrac{{K}_{H}}{{M}_{H}} $ (10b) $ b=\dfrac{{K}_{O}}{{M}_{O}} $ (10c) $ c=\dfrac{{K}_{N}}{{M}_{N}} $ (10d) $ {K}_{c} $ ${K}_{H} $ $ {K}_{o} $ ${K}_{n} $ $ {M}_{c} $ ${M}_{H} $ ${M}_{o} $ ${M}_{n} $ The mass of CO2 that can be obtained using anaerobic digestion is represented in Eq. (11):
$ {M}_{CO2}=\dfrac{44*{A}_{2}}{\left({M}_{c}*n\right)+\left({M}_{H}*a\right)+\left({M}_{O}*b\right)+\left({M}_{N}*c\right)}*1000 $ (11) where
$ {A}_{1}=\dfrac{\left(4n-a-2b+3c\right)}{4} $ (12a) $ {A}_{2}=\dfrac{\left(4n-a+2b+3c\right)}{8} $ (12b) $ {A}_{3}=\dfrac{\left(4n+a-2b-3c\right)}{8} $ (12c) The volume of methane that can be obtained using anaerobic technology is represented in Eq. (13):
$ {V}_{CH_4}=\dfrac{{M}_{CH_4}}{{\rho }_{CH_4}} $ (13) The volume of CO2 that can be obtained is given in Eq. (14):
$ {V}_{CO_2}=\dfrac{{M}_{{{CO}_{2}}}}{{\rho }_{{{CO}_{2}}}} $ (14) where
$ {\rho }_{CH_4} $ $ {\rho }_{{{CO}_{2}}} $ Equation (15) gives the total volume of biogas available using anaerobic digestion technology:
$ {V}_{bio}=\left({V}_{CO_2}+{V}_{CH_4}\right) $ (15) The electrical energy that can be obtained from the biogas generator is given in Eq. (16):
$ {{{E}_{P}}}_{\left(AD\right)}=\dfrac{\left(0.85*\eta *LHV*{M}_{F\left(AD\right)}\right)}{{C}_{o}} $ (16) The lower heating value (LHV) of methane[29] and higher heating value (HHV)[30] can be represented as given in Eqs (17) and (18), respectively:
$ LHV=HHV-\left(9*{\text{%}} H+{\text{%}} {H}_{2}O\right)*2.44$ (17) $ HHV=0.3491C+1.1783H+0.1005S-0.1034O-0.015N-0.0211A $ (18) where C, H, O, N, S, and A are the carbon, hydrogen, oxygen, nitrogen, sulphur, and ash content of the material.
Equation (19) represents the size of the generator with respect to the estimated biogas, and is given by
$ G_{P\left(AD\right)}=\dfrac{E_{P(AD)}}{8760*CF} $ (19) where
$ CF $ Economic modelling of solar-wind-biomass technology
-
This section discusses the economic models of solar-wind-biomass employed in this study.
Economic models for SPV
-
The unit cost of energy is the aggregate cost of installation and operation of the system measured in
${\$} $ The overall cost/watt
$ \left({C}_{ok}\right) $ ${\$} $ $ {C}_{ok}=1.74{P}_{i} $ (20a) $ {C}_{i\left(pv\right)}=1.16{C}_{ok}$ (20b) $ {C}_{om(pv)}=0.64{C}_{ok} $ (20c) $ {C}_{ib(pv)}=0.07{C}_{ok} $ (20d) $ {C}_{m(pv)}=0.39{C}_{ok} $ (20e) where
$ {P}_{i=1\colon k} $ $ {C}_{i\left(pv\right)} $ $ {C}_{om(pv)} $ $ {C}_{ib(pv)} $ $ {C}_{m(pv)} $ $ i $ $ f $ Equation (21) represents the total cost incurred throughout the lifetime of the system:
$ {C}_{TO(pv)}={C}_{ok}+{C}_{om(pv)}\left(\dfrac{1+f}{i+1}\right)\left[1-{\left(\dfrac{1+f}{1+i}\right)}^{n}\right]+{C}_{i(pv)}+{C}_{m\left(pv\right)}+{C}_{ib\left(pv\right)} $ (21) The unit cost of energy
$ {C}_{uc(pv)} $ $ {C}_{uc(pv)}=\dfrac{{C}_{TO(pv)}}{{P}_{pv}*t} $ (22) Economic models for wind
-
The unit cost of wind energy in a location provides foreknowledge of the economic feasibility of the system at that location. The unit cost is represented as given in Eq. (23):
$ \begin{split} C_{TO(w)}=\; & I+C_{om(w)}\left(\dfrac{1+f}{i+1}\right)\left[1-\left(\dfrac{1+f}{1+i}\right)^n\right]-s_c\left(\dfrac{1+f}{1+i}\right)^n+ \\ &C_{ci(w)}+C_{m(w)}+C_{ib(w)} \end{split} $ (23) where
$ I={C}_{asp}*{P}_{r} $ $ n $ $ {s}_{c} $ $ I $ $ {C}_{ib(w)} $ $ {C}_{m(w)} $ $ {C}_{ci(w)} $ $ f $ $ {P}_{r} $ $ {C}_{asp} $ Hence, the unit cost of energy
$ {C}_{uc(wind)} $ $ {C}_{uc(w)}=\left(\dfrac{{C}_{TO(w)}}{{P}_{avg\left(w\right)}*t}\right) $ (24) Economic models for biomass system
-
The unit cost of energy for a biomass system is furnished as given in Eq. (25)[32]:
$ C_{uc(Bio)}=\left(\dfrac{LCC}{E_{p\left(AD\right)}}\right)*CRF $ (25) where
$ LCC $ $ CRF $ $ {E}_{p\left(AD\right)} $ $ LCC={C}_{inv(i)}+\sum\limits_{n=1}^{N}\dfrac{{C}_{O\& M(i)}}{{\left(1+{d}_{n}\right)}^{n}} $ (26) $ CRF=\dfrac{d_n\left(1+d_n\right)^N}{\left(1+d_n\right)^N-1} $ (27) where
$ C_{inv(AD)}=\left(51827.082*M_{F(AD)}^{0.55}\right) $ (28) $ {C}_{O\& M(AD)}=\left(25340.71553*M_{F(AD)}^{-0.61}\right) $ (29) $ {d}_{n} $ $ {M}_{F(AD)} $ $ {C}_{inv(AD)} $ $ {C}_{O\& M(AD)} $ The economic parameters used in this study are furnished in Table 6 below. Annual operation and maintenance cost (O&M) for solar power systems is taken as 1%–2% of the investment cost[33] over the 25-year lifecycle. The operation and maintenance cost of a biomass[21] system is given in Eq. (29).
Table 6. Economic parameters of the renewable resources
Parameter SPV Wind Biomass Interest rate $ \left(i\right) $ 0.27 0.27 Inflation rate $ \left(f\right) $ 0.22 0.22 0.22 Discount rate $ \left({d}_{n}\right) $ 0.30 O&M cost (Com) $ 0.02{C}_{ok} $ (annually) 0.25 I Eq. (29) Lifetime $ \left(n\right) $ 25 25 15 Installation and civil work $ \left({C}_{ci}\right) $ 0.04 I Battery and inverter $ \left({C}_{ib}\right) $ 0.13 I I shows that operation and maintenance cost of a wind turbine system is 25% of the investment and installation cost. Wind shear model
-
The wind shear exponent of a given site[34] can be obtained as given in Eq. (30):
$ p=\frac{log\left(\dfrac{v_1}{v_2}\right)}{log\left(\dfrac{h_1}{h_2}\right)} $ (30) where
$ {v}_{1} $ $ {v}_{2} $ $ {h}_{1} $ $ {h}_{2} $ $ v_t=v\left(\dfrac{h_d}{h}\right)^p $ (31) where
$ {h}_{d} $ $ h $ $ v $ $ {v}_{t} $ Capacity factor (CF)
-
The capacity factor of an SPV system is the average output power obtained from an SPV over a defined period of time to the power produced when operated at rated capacity over the same defined period of time[34]. In the same vein, the CF of a wind turbine (WT) system is the average power output obtained from the WT system over a definite period of time to the power produced when operated at rated capacity over the same definite period of time. The CF of solar photovoltaic and wind turbine system are furnished in Eqs (32) and (33), respectively:
$ {Cf}_{w}=\dfrac{{P}_{a,w}}{{P}_{r,w}} $ (32) $ Cf_{spv}=\dfrac{P_{a,spv}}{P_{r,spv}} $ (33) where
$ {P}_{a,w} $ $ {P}_{r,w} $ $ {P}_{a,spv} $ $ {P}_{r,spv} $ $ {Cf}_{w} $ $ {Cf}_{spv} $ Environmental models
-
The environmental impact is modelled such that the quantity of coal needed[3] for the complete life cycle of a biomass plant for the generation of electrical power is given in Eq. (34):
$ Q=\dfrac{8760\times E_p\times H_{ie}\times l_c}{1000\times\eta_{bc}\times\eta_{sc}\times HHV}\left(tonnes\right) $ (34) where
$ {E}_{p} $ $ p $ $ {H}_{ie} $ $ {l}_{c} $ $ {\eta }_{bc},{\eta }_{sc} $ $ HHV $ -
This section unveils the results of the solar-wind-biomass for water pumping application and wind shear across different locations in Nigeria. The study was performed using a Federal University site in each of the six geopolitical zones in Nigeria. The wind shear determination was performed using 37 sites, and MATLAB 2021a was employed for simulations in this study.
Panasonic solar module and the EWT DW 54 (T7) wind turbine have the highest capacity factors in all the sites under study, as furnished in Tables 7 and 8, respectively. The site in Dutse possesses the highest SPV capacity factor among all the sites. Even though turbine (T7) has the highest capacity factor among all the sites, its rated power is much higher than some of the applications in this study. Based on the load demand requirements, this study employs turbine (T1) with a rated power of 200 kW for site 1, turbine (T8) with a rated power of 100 kW for site 2, turbine (T7) with a rated power of 250 kW for site 3, turbine (T3) with a rated power of 600 kW for site 4, turbine (T8) with a rated power of 100 kW for site 5, turbine (T9) with a rated power of 30 kW for site 6.
Table 7. Solar PV capacity factor for different modules and sites under study
Sites Parameters Solar module performance M1 M2 M3 M4 M5 M6 M7 M8 M9 M10 S1 Cf (%) 18.18 18.76 18.50 18.20 18.30 18.22 18.25 18.06 18.20 18.15 S2 Cf (%) 16.83 17.38 17.06 16.81 16.92 16.81 16.86 16.61 16.82 16.76 S3 Cf (%) 14.63 15.08 14.85 14.59 14.68 14.63 14.65 14.48 14.61 14.58 S4 Cf (%) 14.09 17.43 17.15 16.86 14.17 16.90 16.91 16.71 16.87 16.83 S5 Cf (%) 17.75 18.33 18.02 17.76 17.86 17.75 17.80 17.56 17.76 17.70 S6 Cf (%) 18.43 19.09 18.72 18.40 18.72 18.44 18.81 18.25 18.25 18.53 The bolded data shows that Solar module M2 gives the highest capacity factor in all the sites. Table 8. Capacity factor of different turbines
Sites Parameters Wind turbine performance T1 T2 T3 T4 T5 T6 T7 T8 T9 S1 Cf/% 7.56 6.51 17.19 4.44 4.98 5.94 40.08 22.72 25.88 S2 Cf/% 5.42 4.66 13.88 2.99 3.57 4.11 32.17 18.10 20.00 S3 Cf/% 0.01 0.01 2.39 0.00 0.01 0.00 3.72 1.98 0.99 S4 Cf/% 0.38 0.33 4.41 0.05 0.25 0.14 9.55 5.09 4.09 S5 Cf/% 8.58 7.39 17.77 5.13 5.65 6.84 43.85 24.42 28.62 S6 Cf/% 1.33 1.14 8.25 0.20 0.87 0.58 17.26 9.21 8.94 The bolded data shows that Wind turbine T7 gives the highest capacity factor in all the sites. Figure 1 shows that at site S1(Ibadan), SPV produces the least cost of energy (
${\$} $ ${\$} $ ${\$} $ ${\$} $ ${\$} $ ${\$} $ ${\$} $ ${\$} $ ${\$} $ ${\$} $ ${\$} $ ${\$} $ ${\$} $ ${\$} $ ${\$} $ ${\$} $ ${\$} $ ${\$} $ ${\$} $ ${\$} $ ${\$} $ ${\$} $ ${\$} $ ${\$} $ 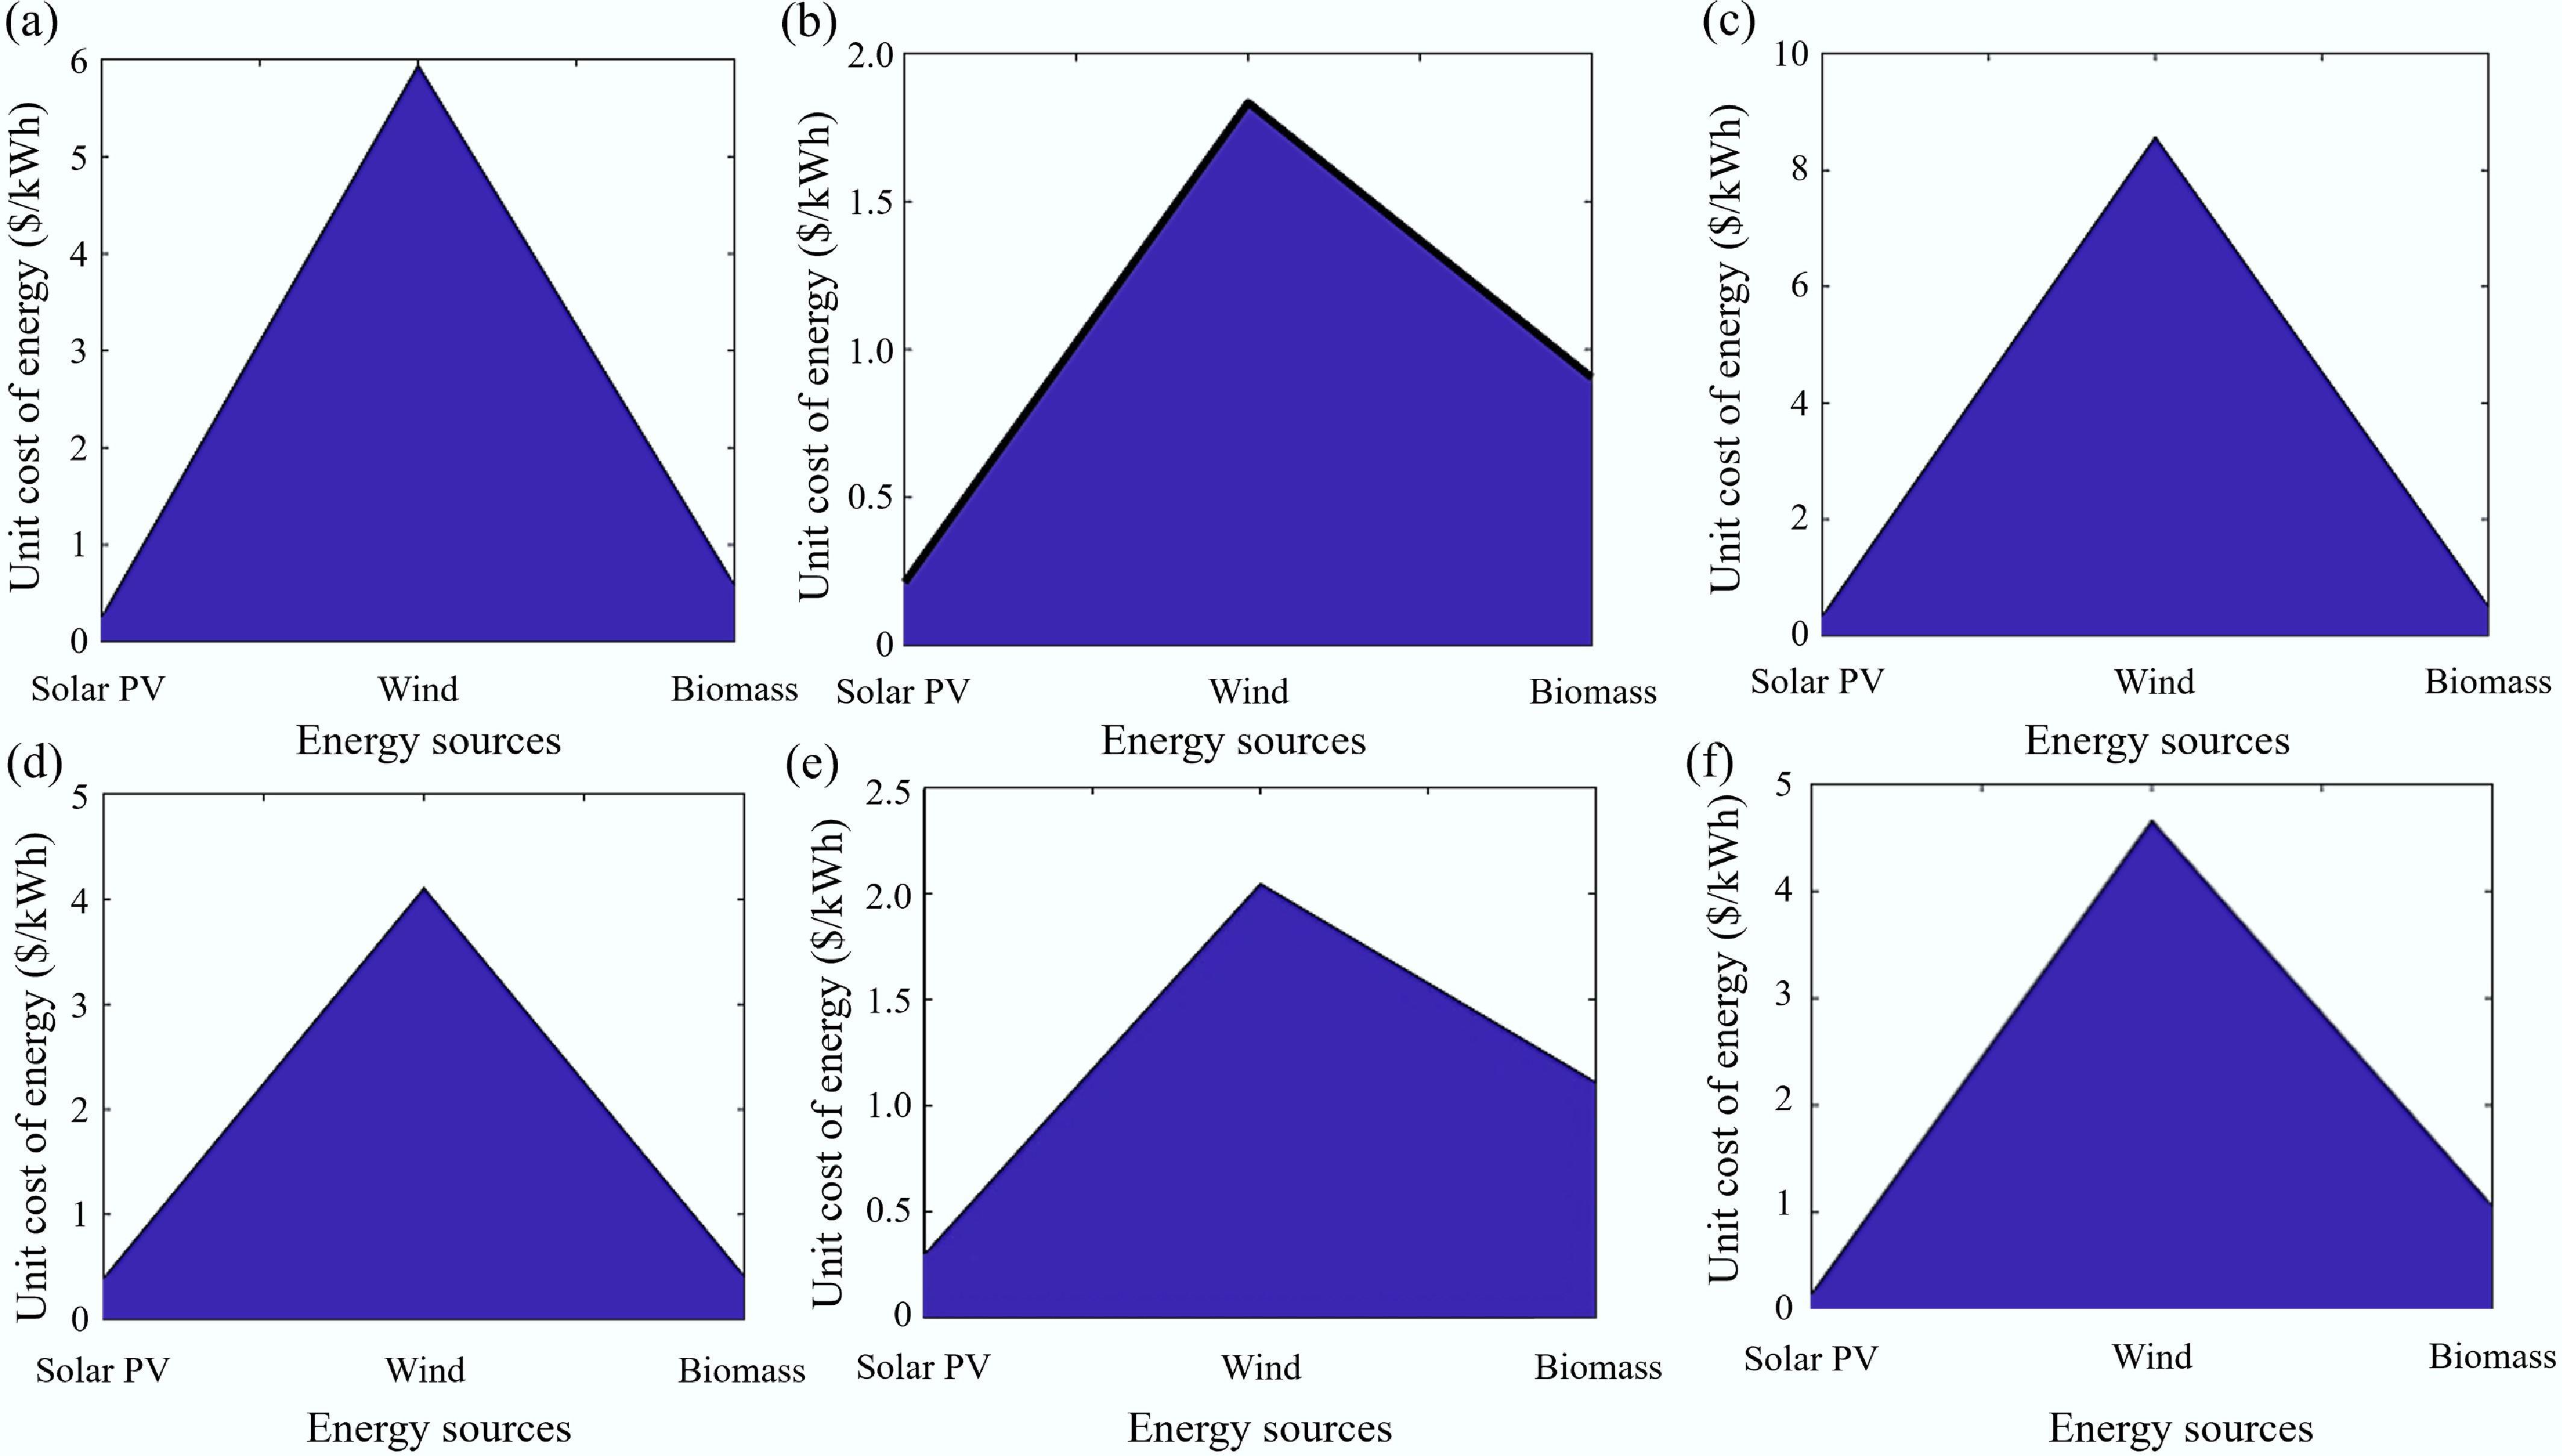
Figure 1.
Unit cost of energy for solar, wind, and biomass in sites S1 to S6.
Table 9. Cost of energy in the literature compared with this study
Country/location LCoE South Africa[3] Wind $ {\$} $26,943/kWh (University of Johannesburg), $ {\$} $50,915/kWh (Zuikerbosh pumping station) SPV $ {\$} $0.33/kWh (L1), $ {\$} $0.66/kWh (L2) Biomass $ {\$} $0.05/kWh (L1), $ {\$} $0.05/kWh (L2) Nigeria Biomass (AD)[22] $ {\$} $0.03–0.07/kWh Biomass (LFG) $ {\$} $0.04–0.05/kWh Wind[36] $ {\$} $0.03–0.71/kWh SPV[2] $ {\$} $0.05–0.06/kWh Chad[7] ORC $ {\$} $0.02/kWh SPV $ {\$} $0.03/kWh 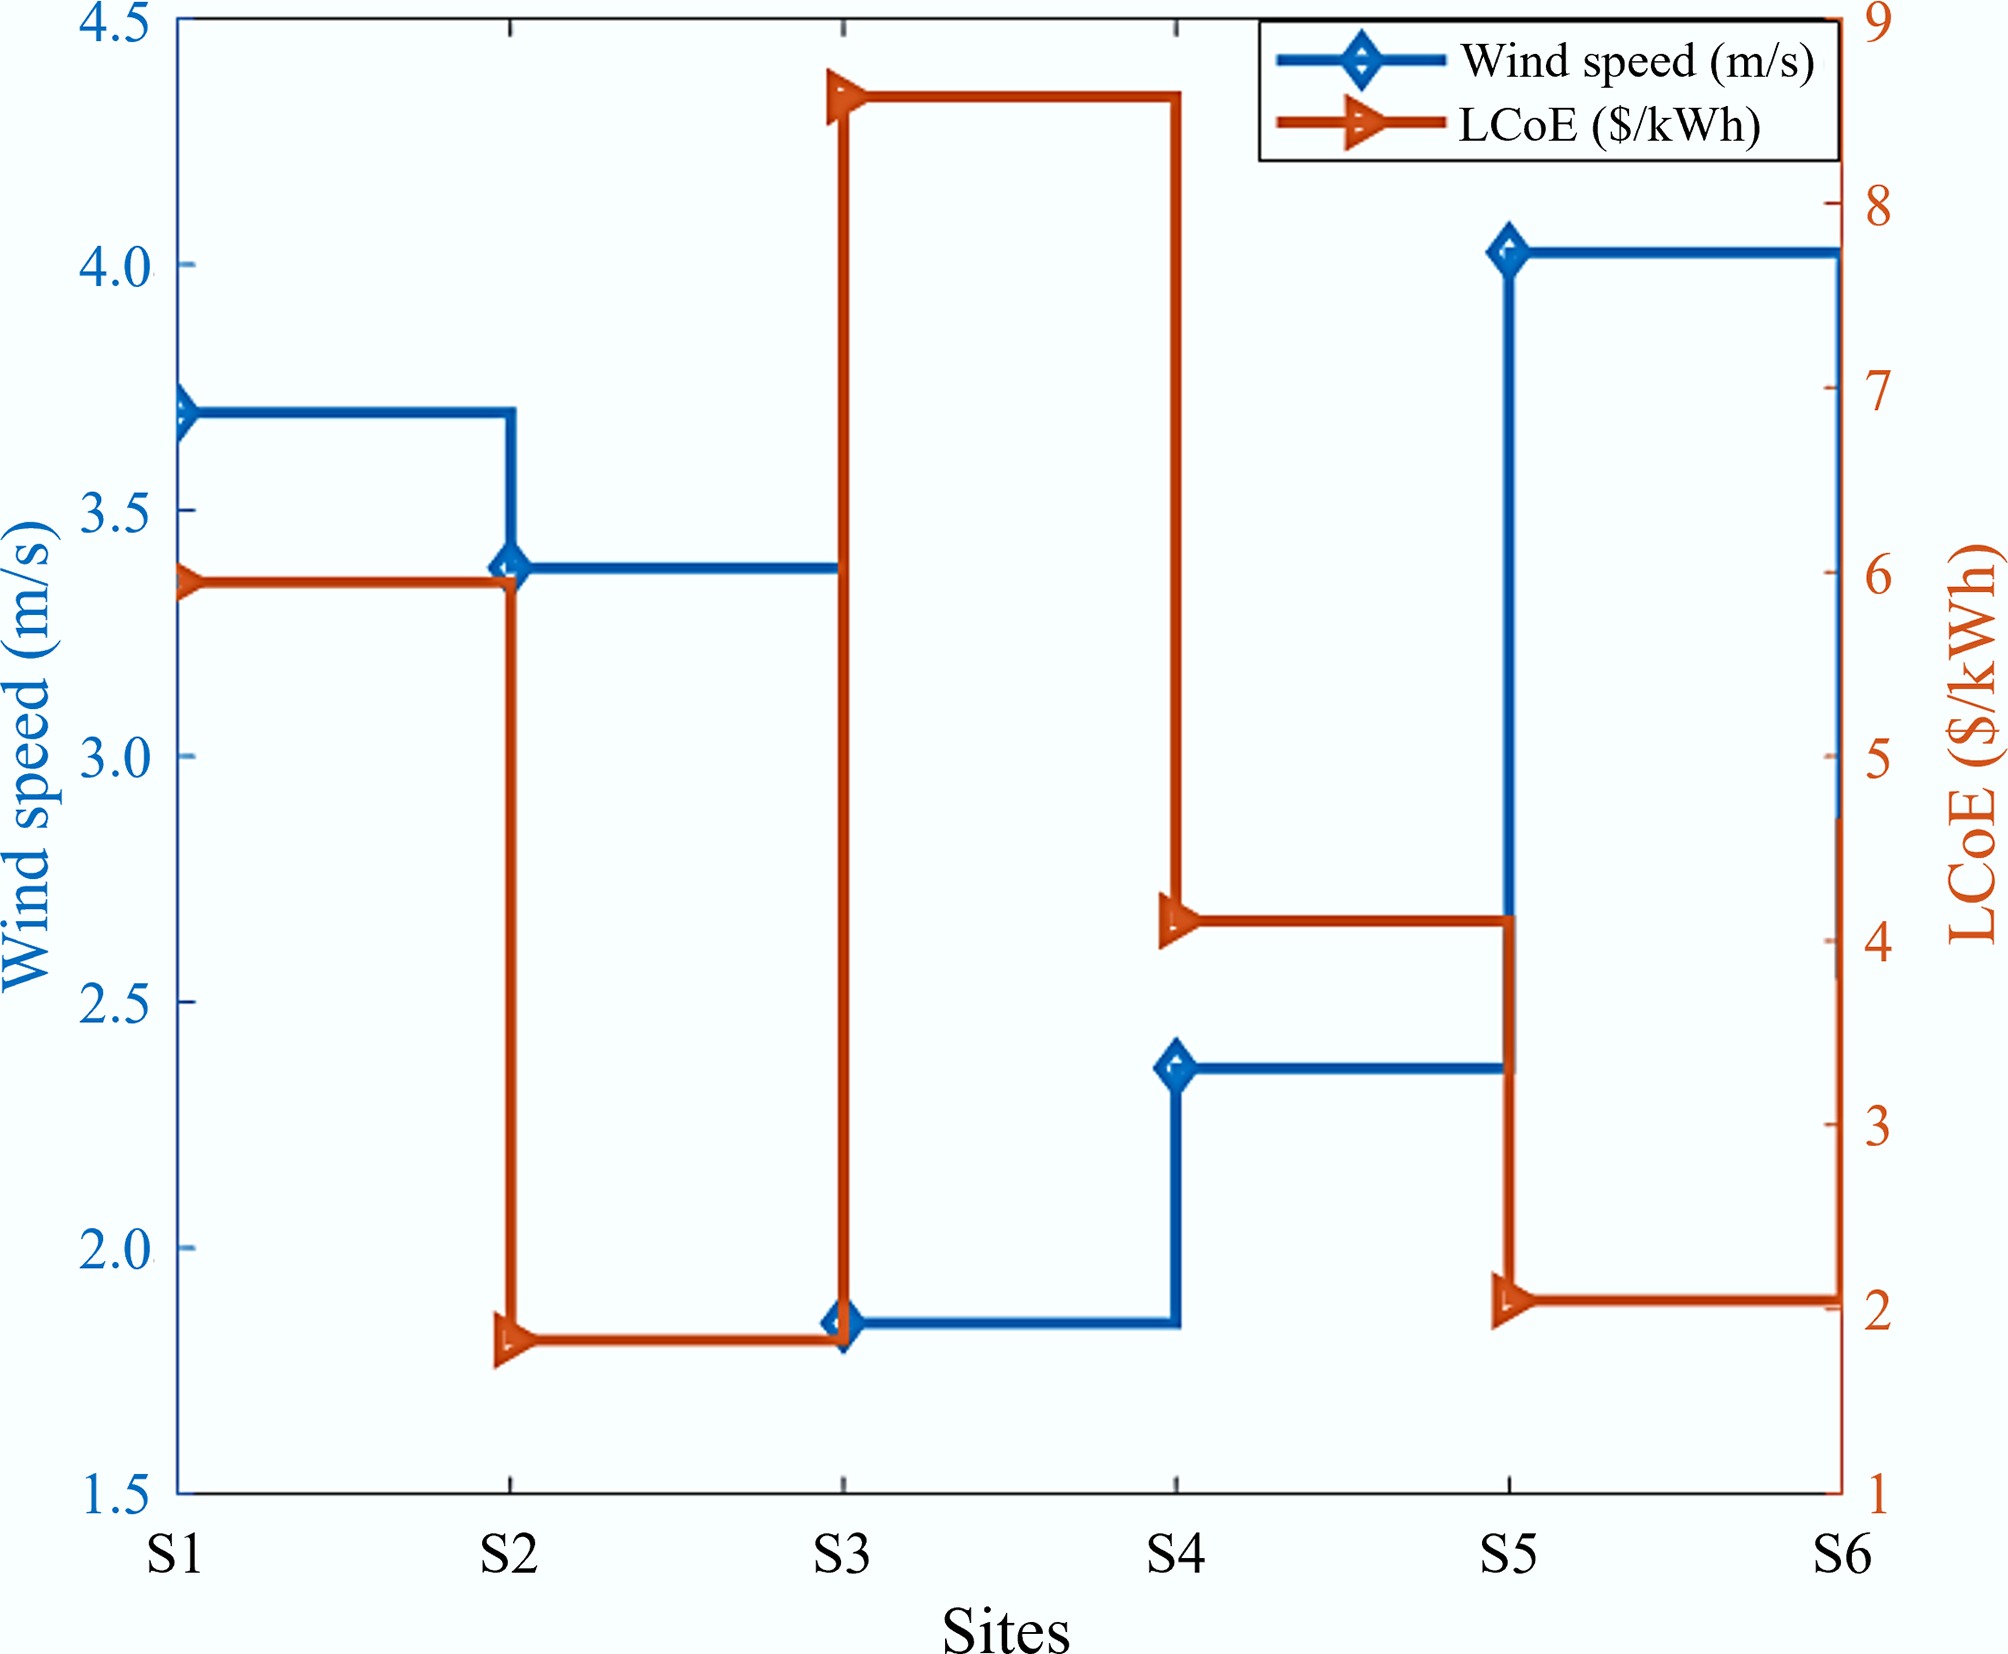
Figure 2.
Relationship between wind speed and LCoE.
The same turbine (turbine 8), with a cut-in wind speed of 2.50 m/s, was used to size site S5 (Bauchi) and was also used to size site S2 (Abakaliki); however, the rated load at Bauchi (93.00 kW) is higher than that at Abakaliki (61.00 kW); therefore, site S2 presents the lowest cost of energy. This depicts that the wind speed of the site, appropriate sizing and selection of the wind turbine, and the load demand are factors that affect the cost of energy of a wind turbine. It is also worthy of note that turbine DW 54 EWT produces the highest capacity factor in all the sites because it has the lowest cut-in wind speed of 2.50 m/s and also produces its rated power at the rated speed of 7.50 m/s (which is the lowest among the turbines considered in this study). Hence, turbines that are characterized by low cut-in wind speed and produce their rated power at a lower wind speed are better candidates to obtain a high capacity factor. To investigate the relationship between the capacity factor and temperature coefficient of power, the site in Ibadan (S1) was used for the study, and the result is furnished in Fig. 3. The figure shows that module M2 (Panasonic solar), which has the lowest temperature coefficient of power (0.26 %/°C), also possesses the highest capacity factor, while module M8 (0.43 %/°C), which has the highest temperature coefficient of power, has the lowest capacity factor. Hence, module M2 was able to produce a higher capacity factor as a result of its lower temperature coefficient of power. Consideration should be given to modules with lower temperature coefficients of power in order to obtain a higher capacity factor.
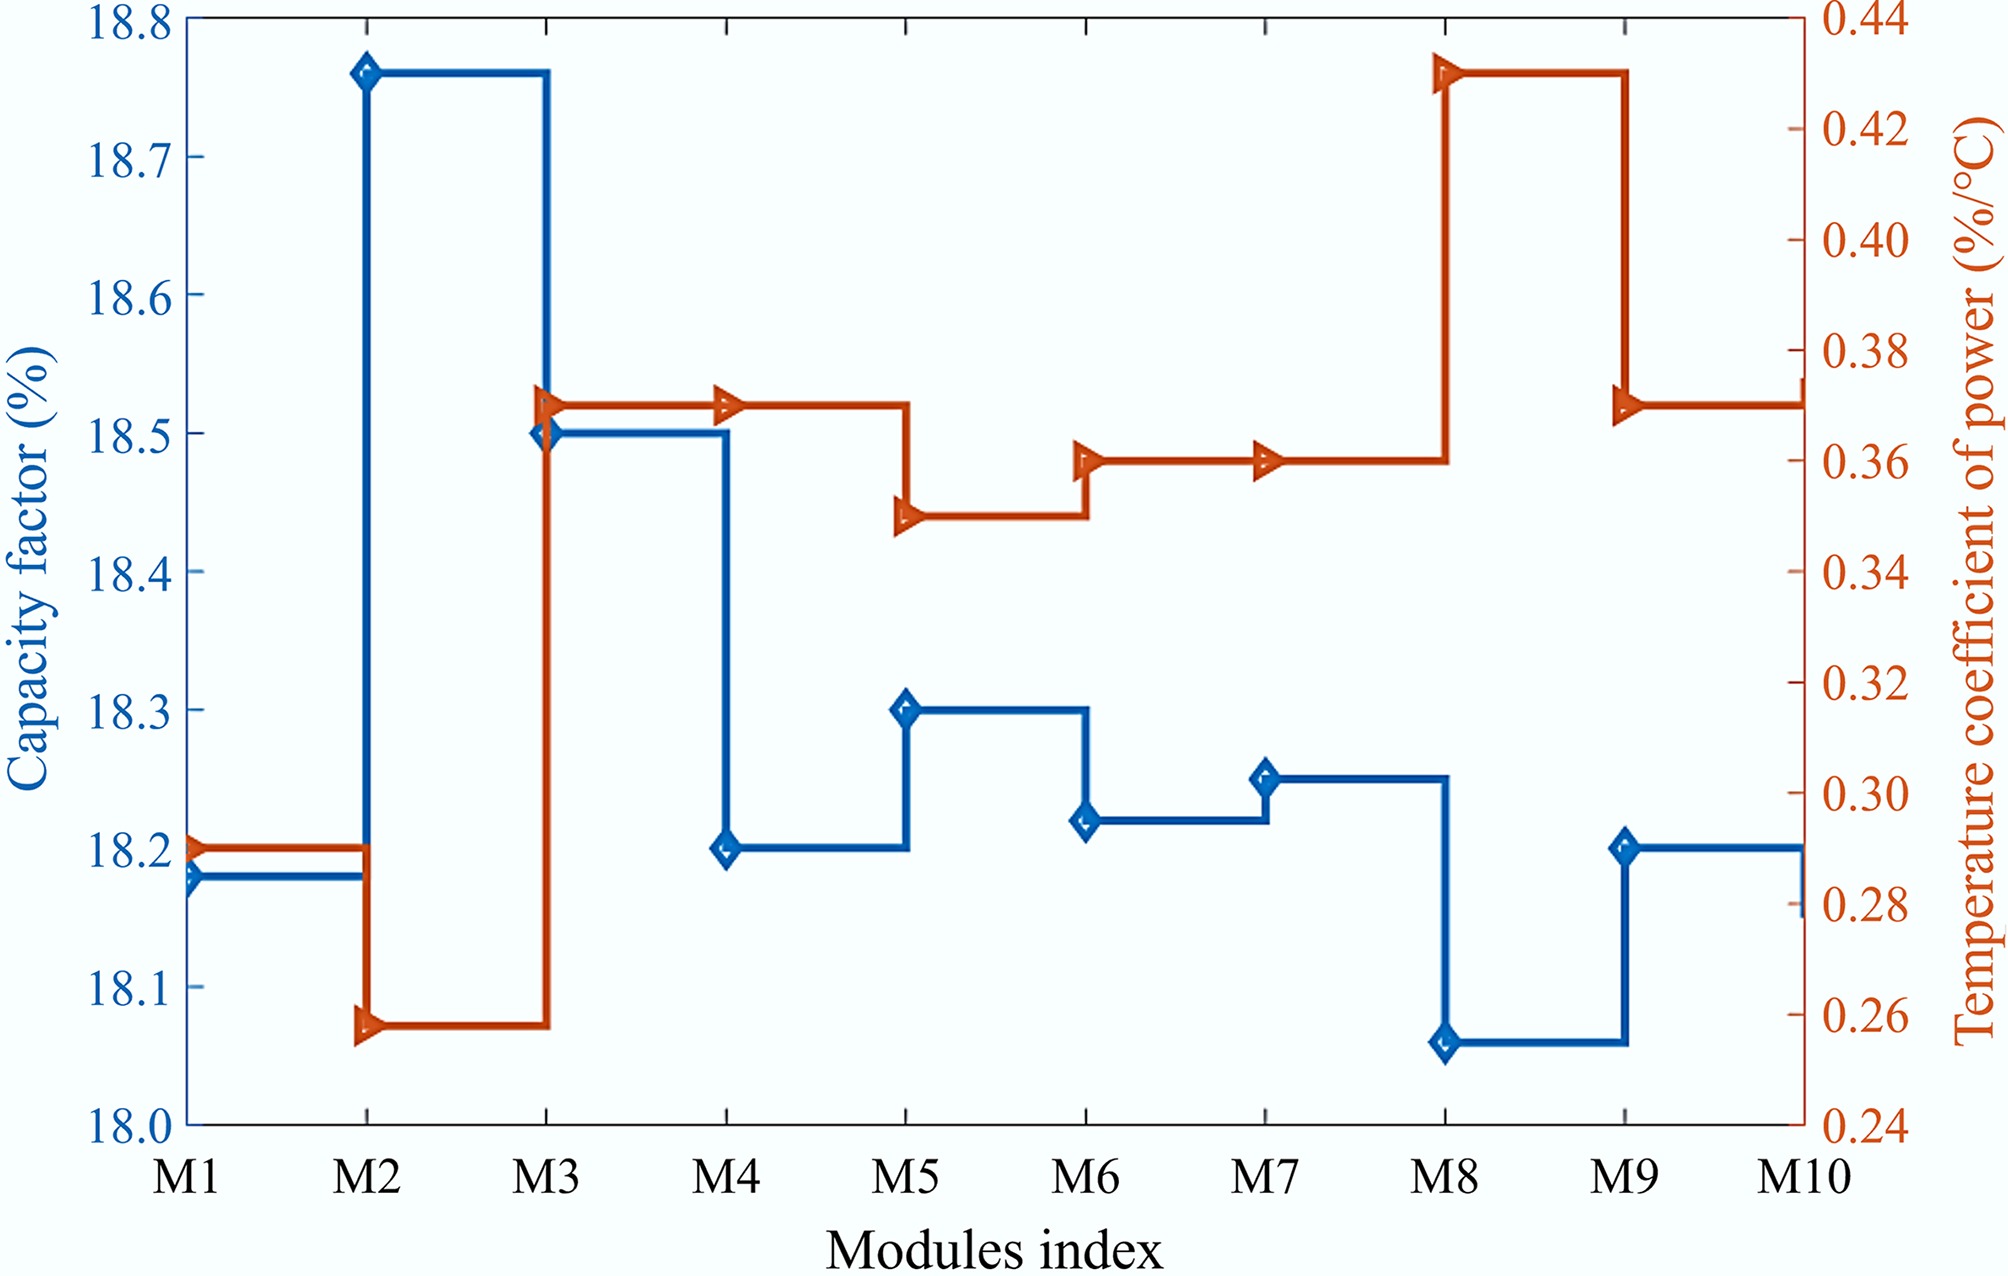
Figure 3.
Relationship between modules temperature coefficient of power and capacity factor.
Effect of wind turbine selection based on maximum capacity factor on the unit cost of energy
-
To investigate the impact of wind turbine selection based on maximum capacity factor on the unit cost of energy, this study employed turbine (T7), which has the maximum capacity factor across all the sites, and used the energy output of the turbine to obtain the cost of energy. The cost of energy obtained is then compared with that obtained when the wind turbine with rated power close to the load demand was used, and the result is furnished in Fig. 4. The figure shows that the cost of energy when the turbine with maximum capacity factor was used is between
${\$} $ ${\$} $ ${\$} $ ${\$} $ 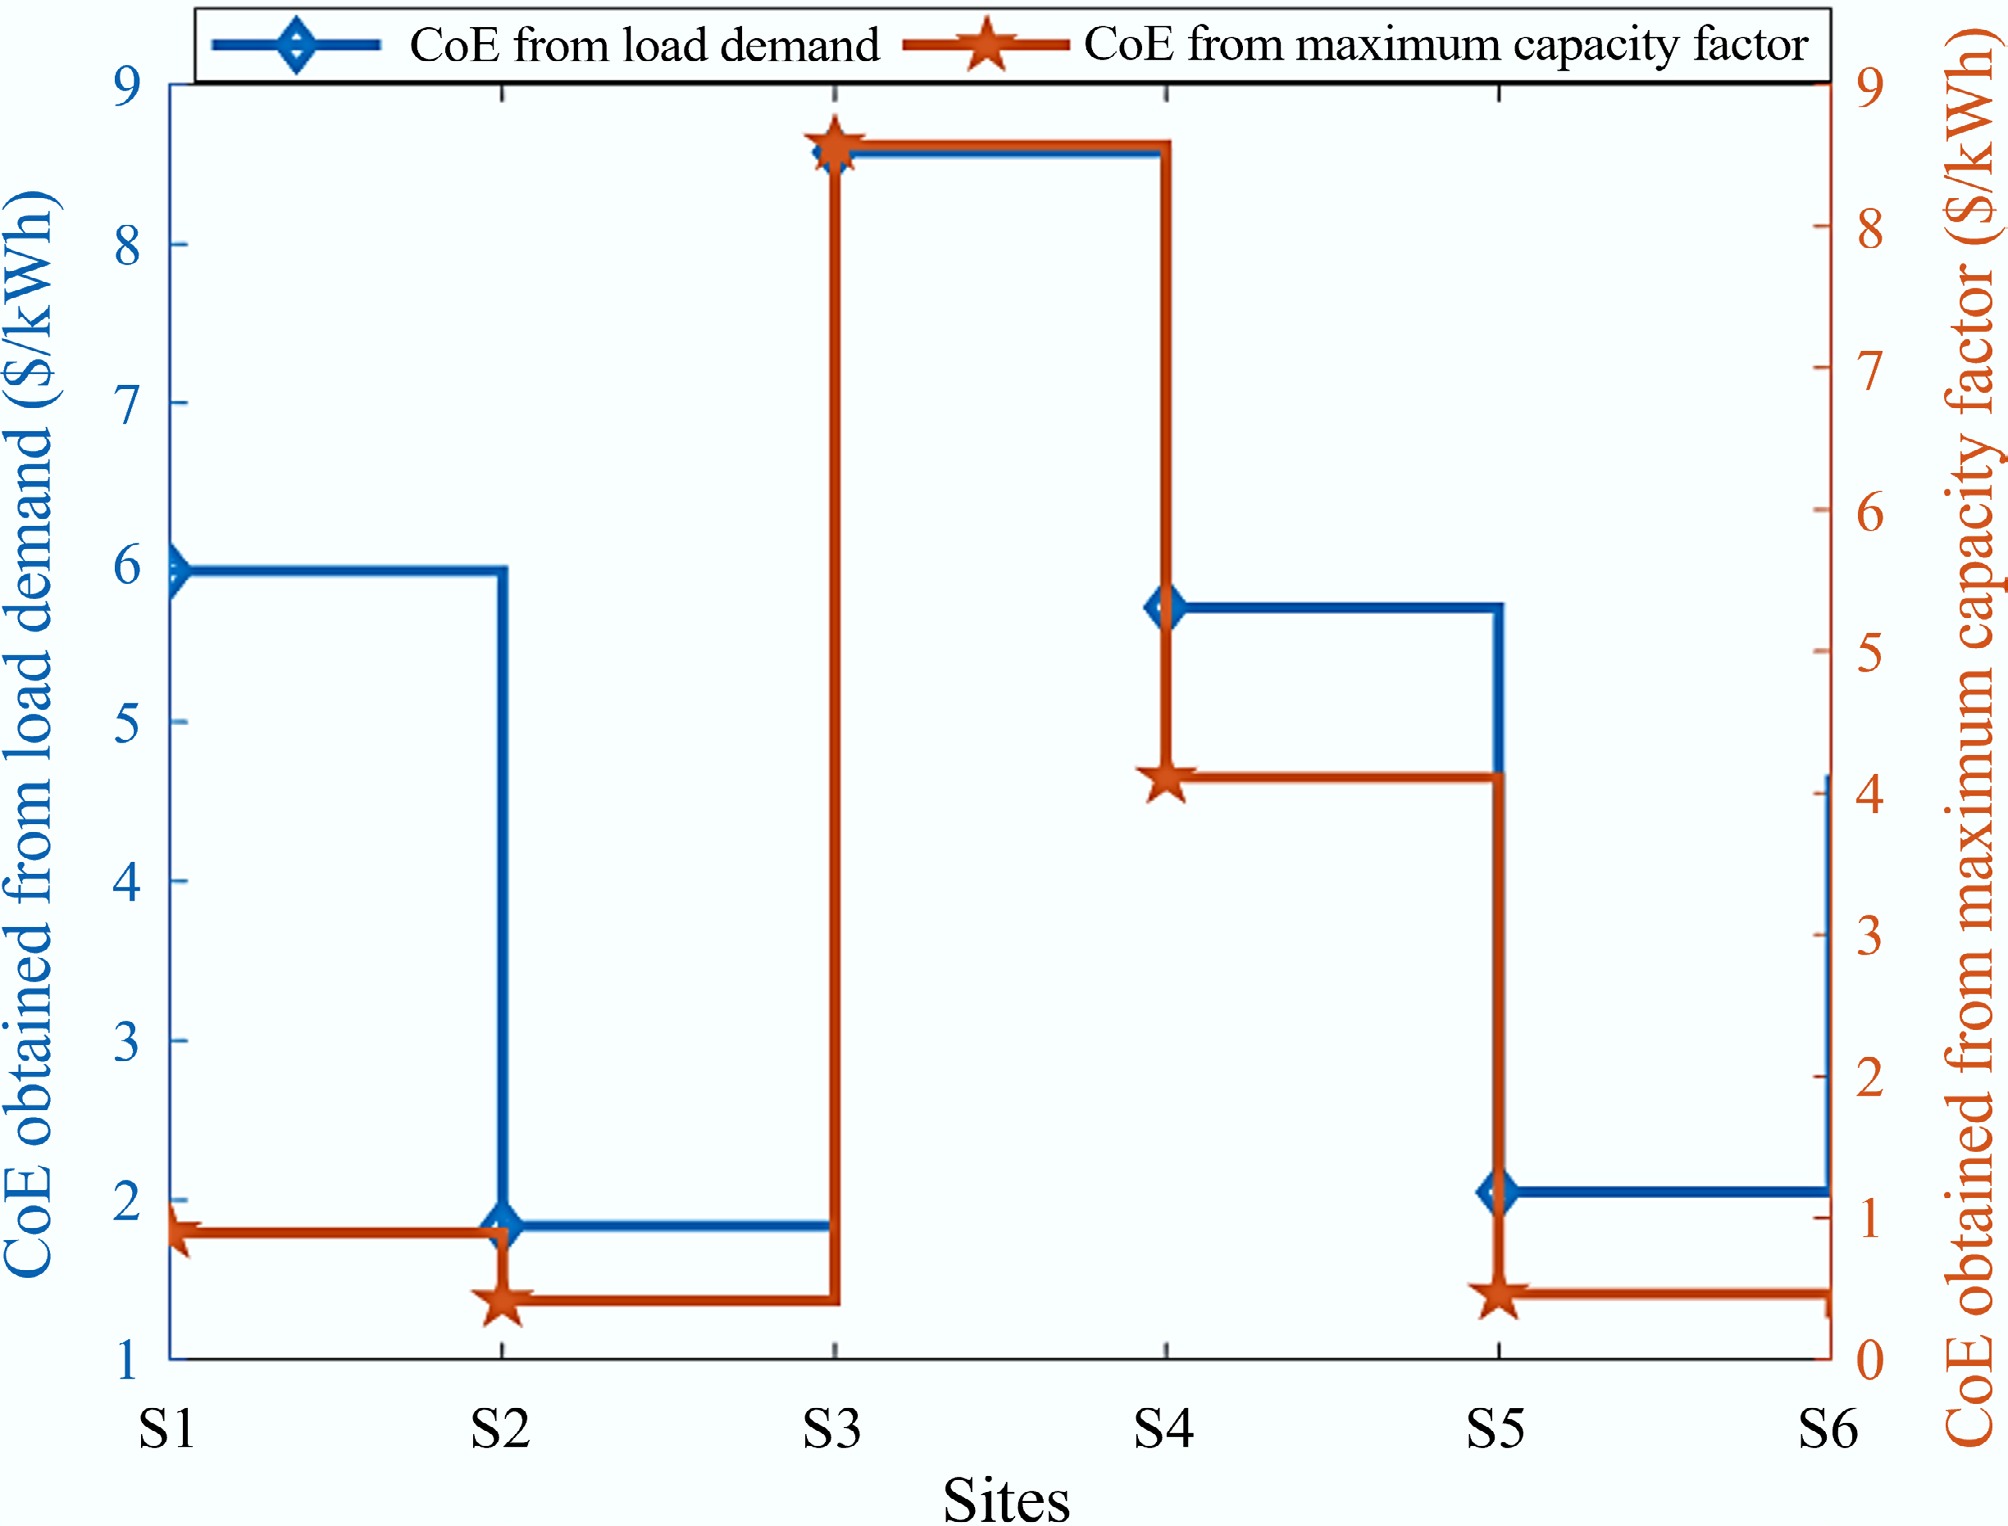
Figure 4.
Cost of energy (CoE) with maximum load demand and CoE with maximum capacity factor at different sites under study.
Environmental analysis
-
The carbon (IV) oxide that was abated by using solar photovoltaic generation instead of coal generation in the six locations under study is furnished in Table 10. The table shows that the amount of carbon (IV) oxide that was abated by using SPV instead of a coal-fired power plant in the six sites is between 7,678.5 tonnes (site 6) and 93,802.0 tonnes (site S4). This shows that solar photovoltaic technology played a key role in abating carbon emissions in the process of electricity generation.
Table 10. Environmental effect of replacing coal with SPV
Parameters Sites S1 S2 S3 S4 S5 S6 CO2 saved (tonnes) 55,911.0 20,721.0 76,243.0 93,802.0 31,658.0 7,678.5 Impact of yearly variation of wind speed on the shear exponent
-
To investigate the impact of yearly variation of the wind shear exponent, 11-year data from 2014 to 2024 was employed at a representative site of the six geopolitical regions of Nigeria, and the results are presented in Fig. 5. The figure shows that wind shear in Asaba is between 0.48 and 0.51, corresponding to 2015 and 2021, respectively. Wind shear in Abeokuta ranges from 0.29 in 2016 to 0.31 in 2021; Awka wind shear logged 0.28 and 0.30 as the minimum and maximum, corresponding to 2024 and 2021, respectively. Wind shear in Dutse is between 0.33 and 0.35, corresponding to 2023 and 2022, respectively. Wind shear in Bauchi ranges from 0.21 in 2024 to 0.23 in 2022; wind shear in Abuja logged 0.24 and 0.26 as the minimum and maximum, corresponding to 2019 and 2023, respectively. Hence, the operating region of wind shear for the six locations throughout the 11-year horizon is furnished in Eq. (35):
$ W_{sh}=\left\{\begin{array}{ll}0.49\pm0.01 & Asaba \\ 0.30\pm0.01 & Abeokuta \\ 0.29\pm0.01 & Awka \\ 0.33\pm0.01 & Dutse \\ 0.22\pm0.01 & Bauchi \\ 0.25\pm0.01 & Abuja\end{array}\right. $ (35) where
$ {W}_{sh} $ 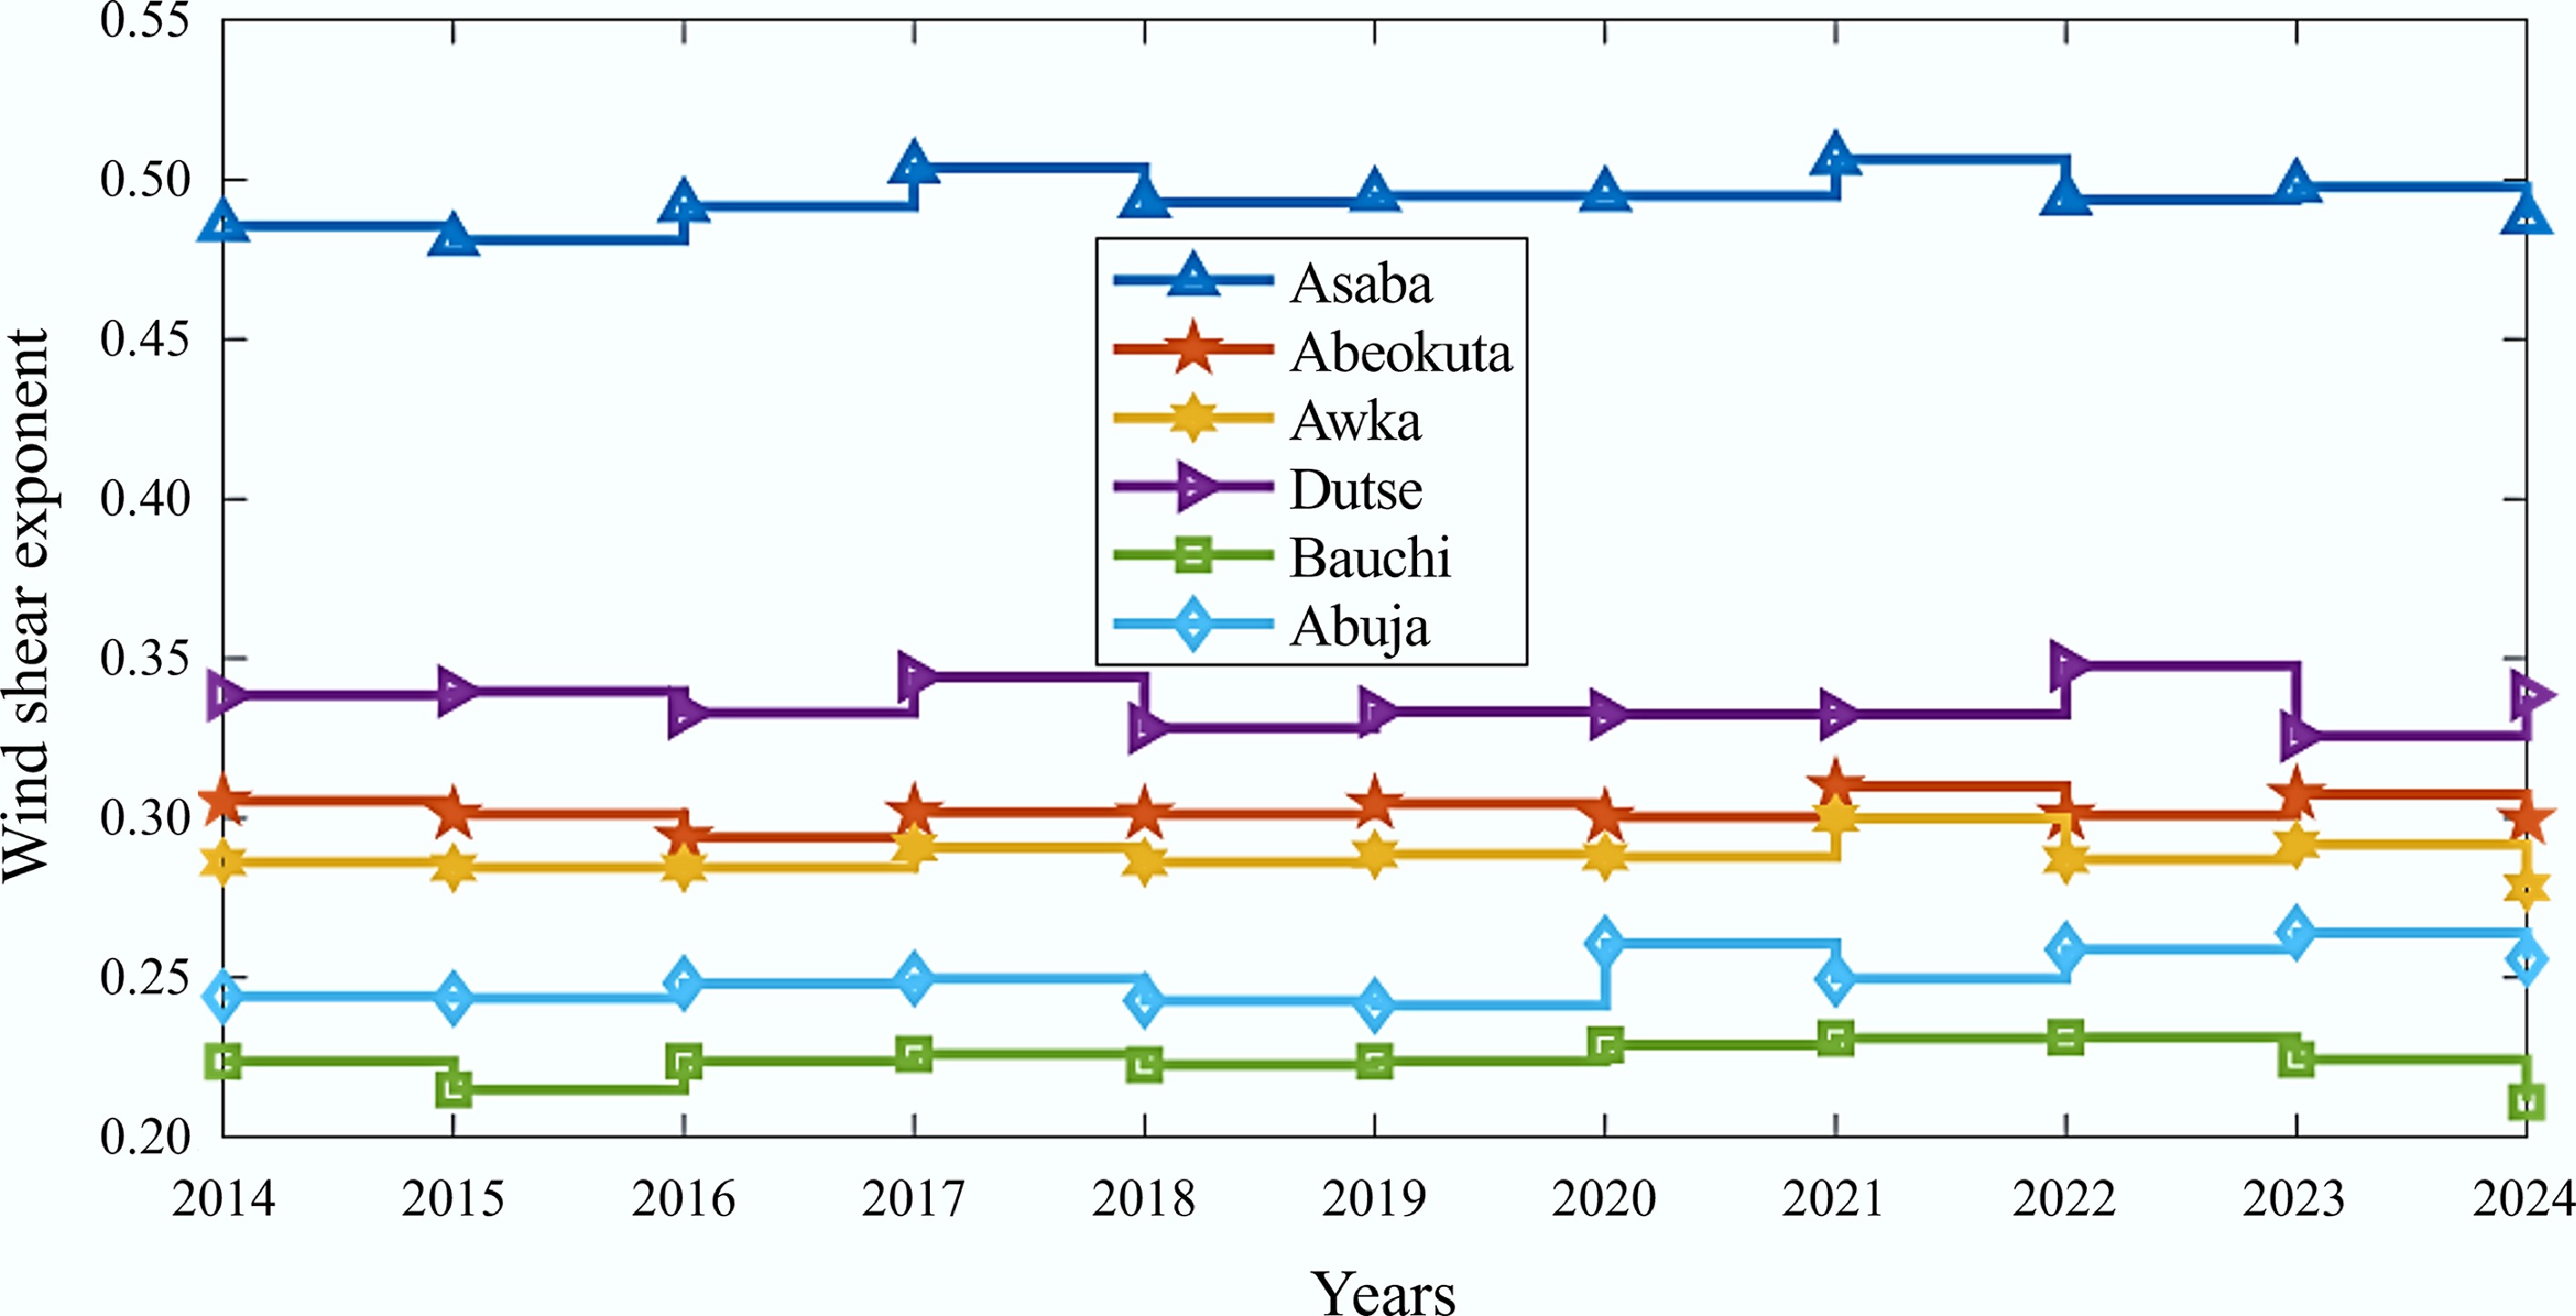
Figure 5.
Yearly variation in wind shear exponent.
Sensitivity of the discount rate on the cost of energy and seasonal variability of variable renewable resources
-
To investigate the impact of the sensitivity of the discount rate on the cost of energy, site S1 (Ibadan) and the biomass model were employed for the analysis, and the results are furnished in Fig. 6. The discount rate was increased from 30.29% (base case) in steps of 10% to 50.29% and was also reduced in steps of 10% to 10.29%. The study obtained the cost of energy between
${\$} $ ${\$} $ 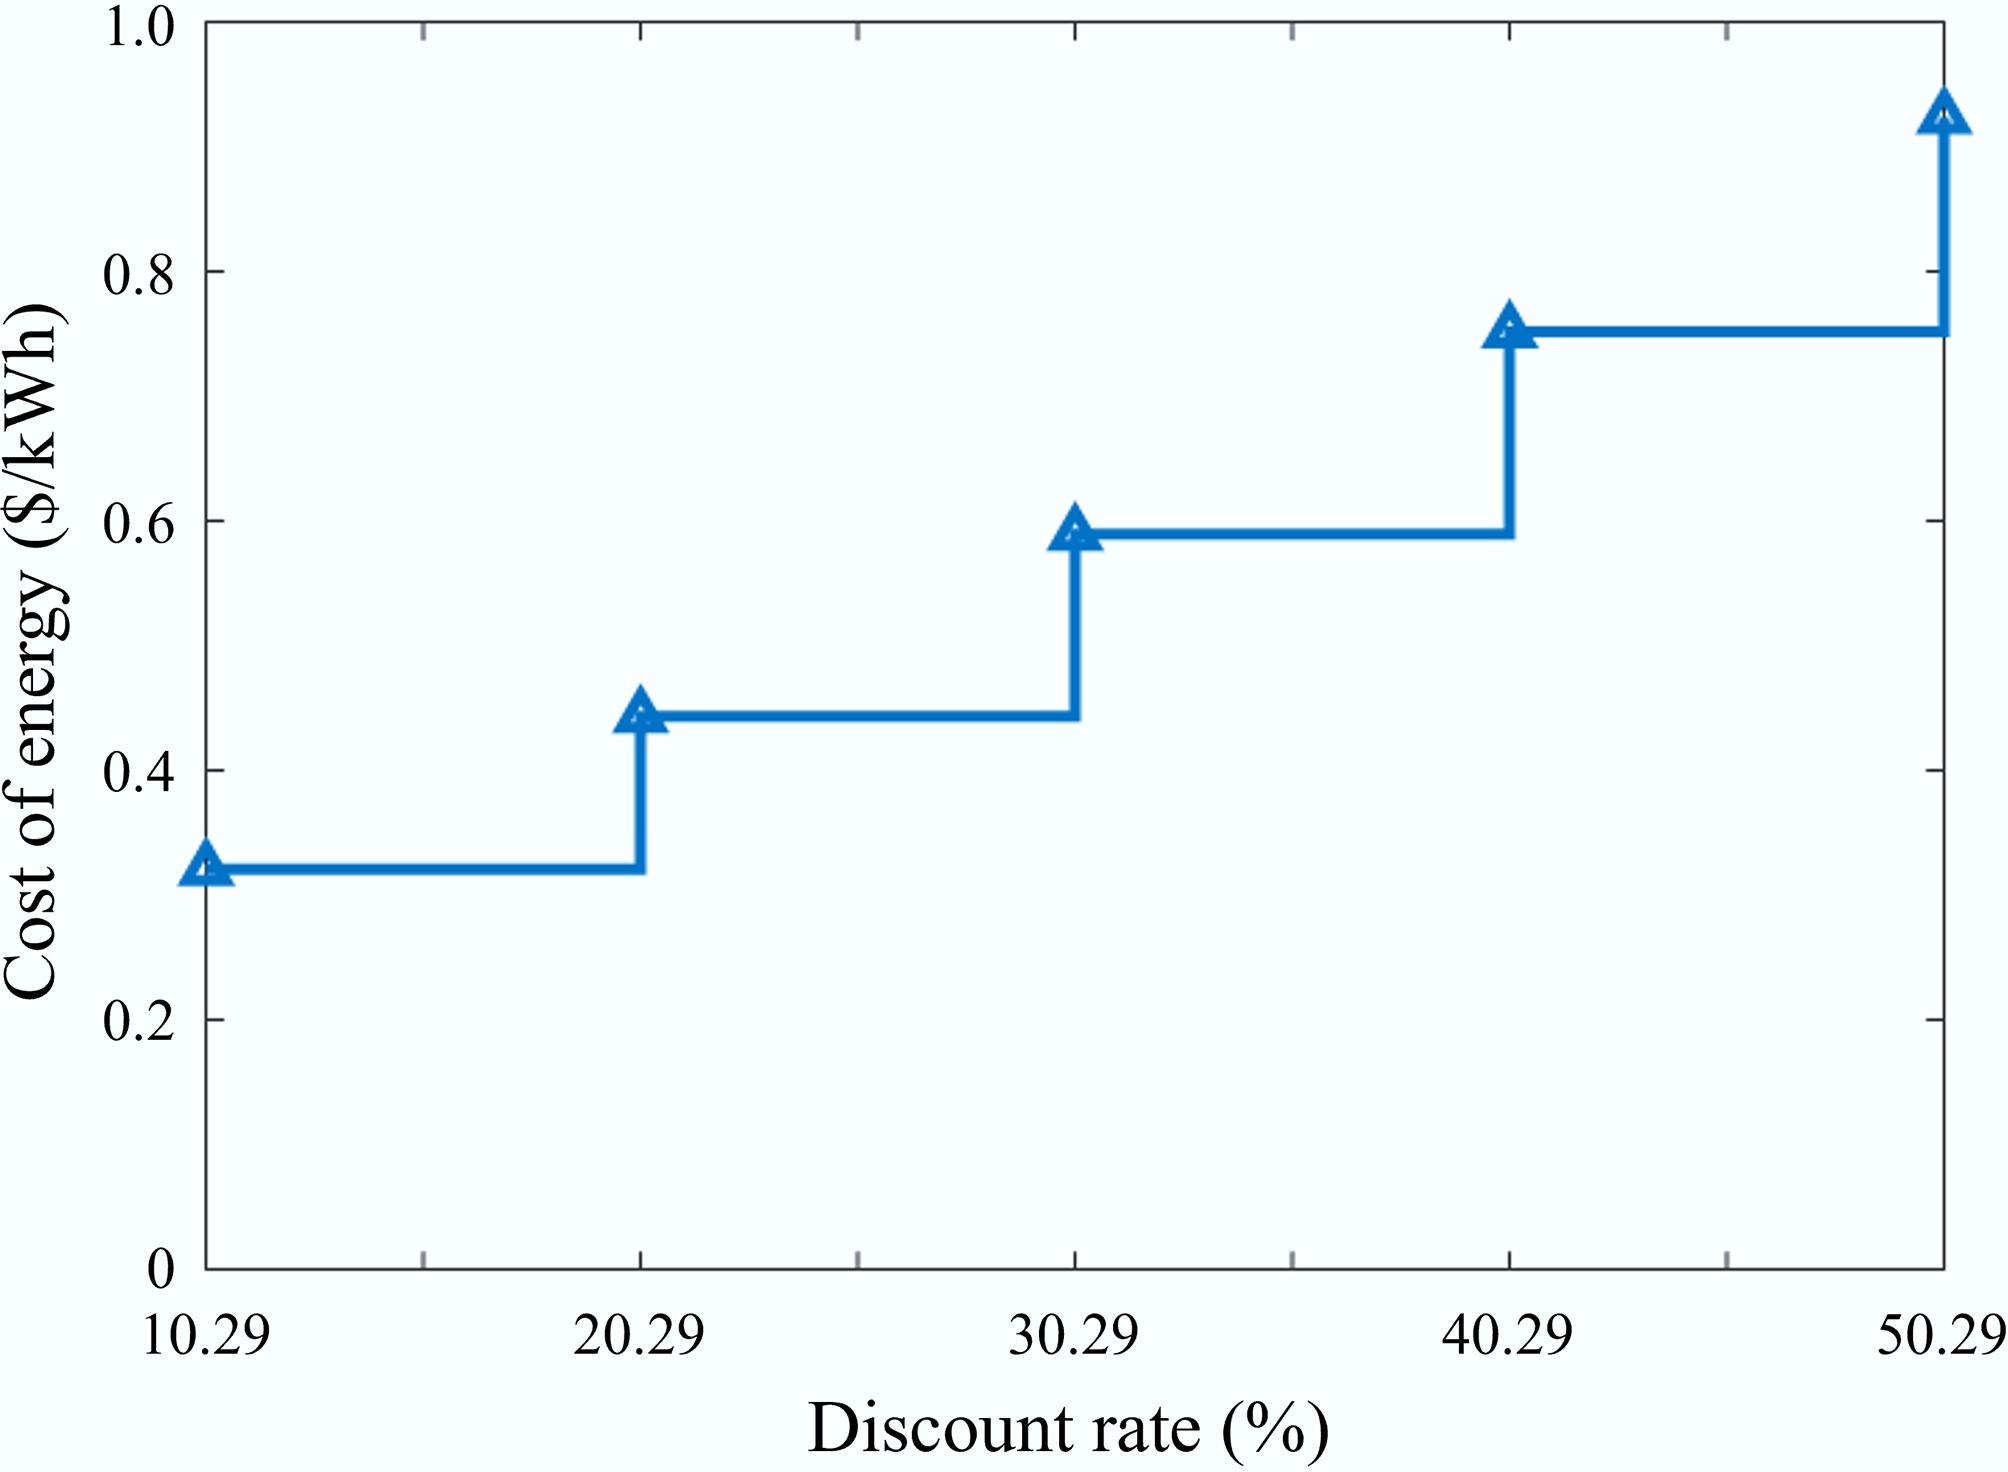
Figure 6.
Influence of increase in discount rate on the cost of energy.
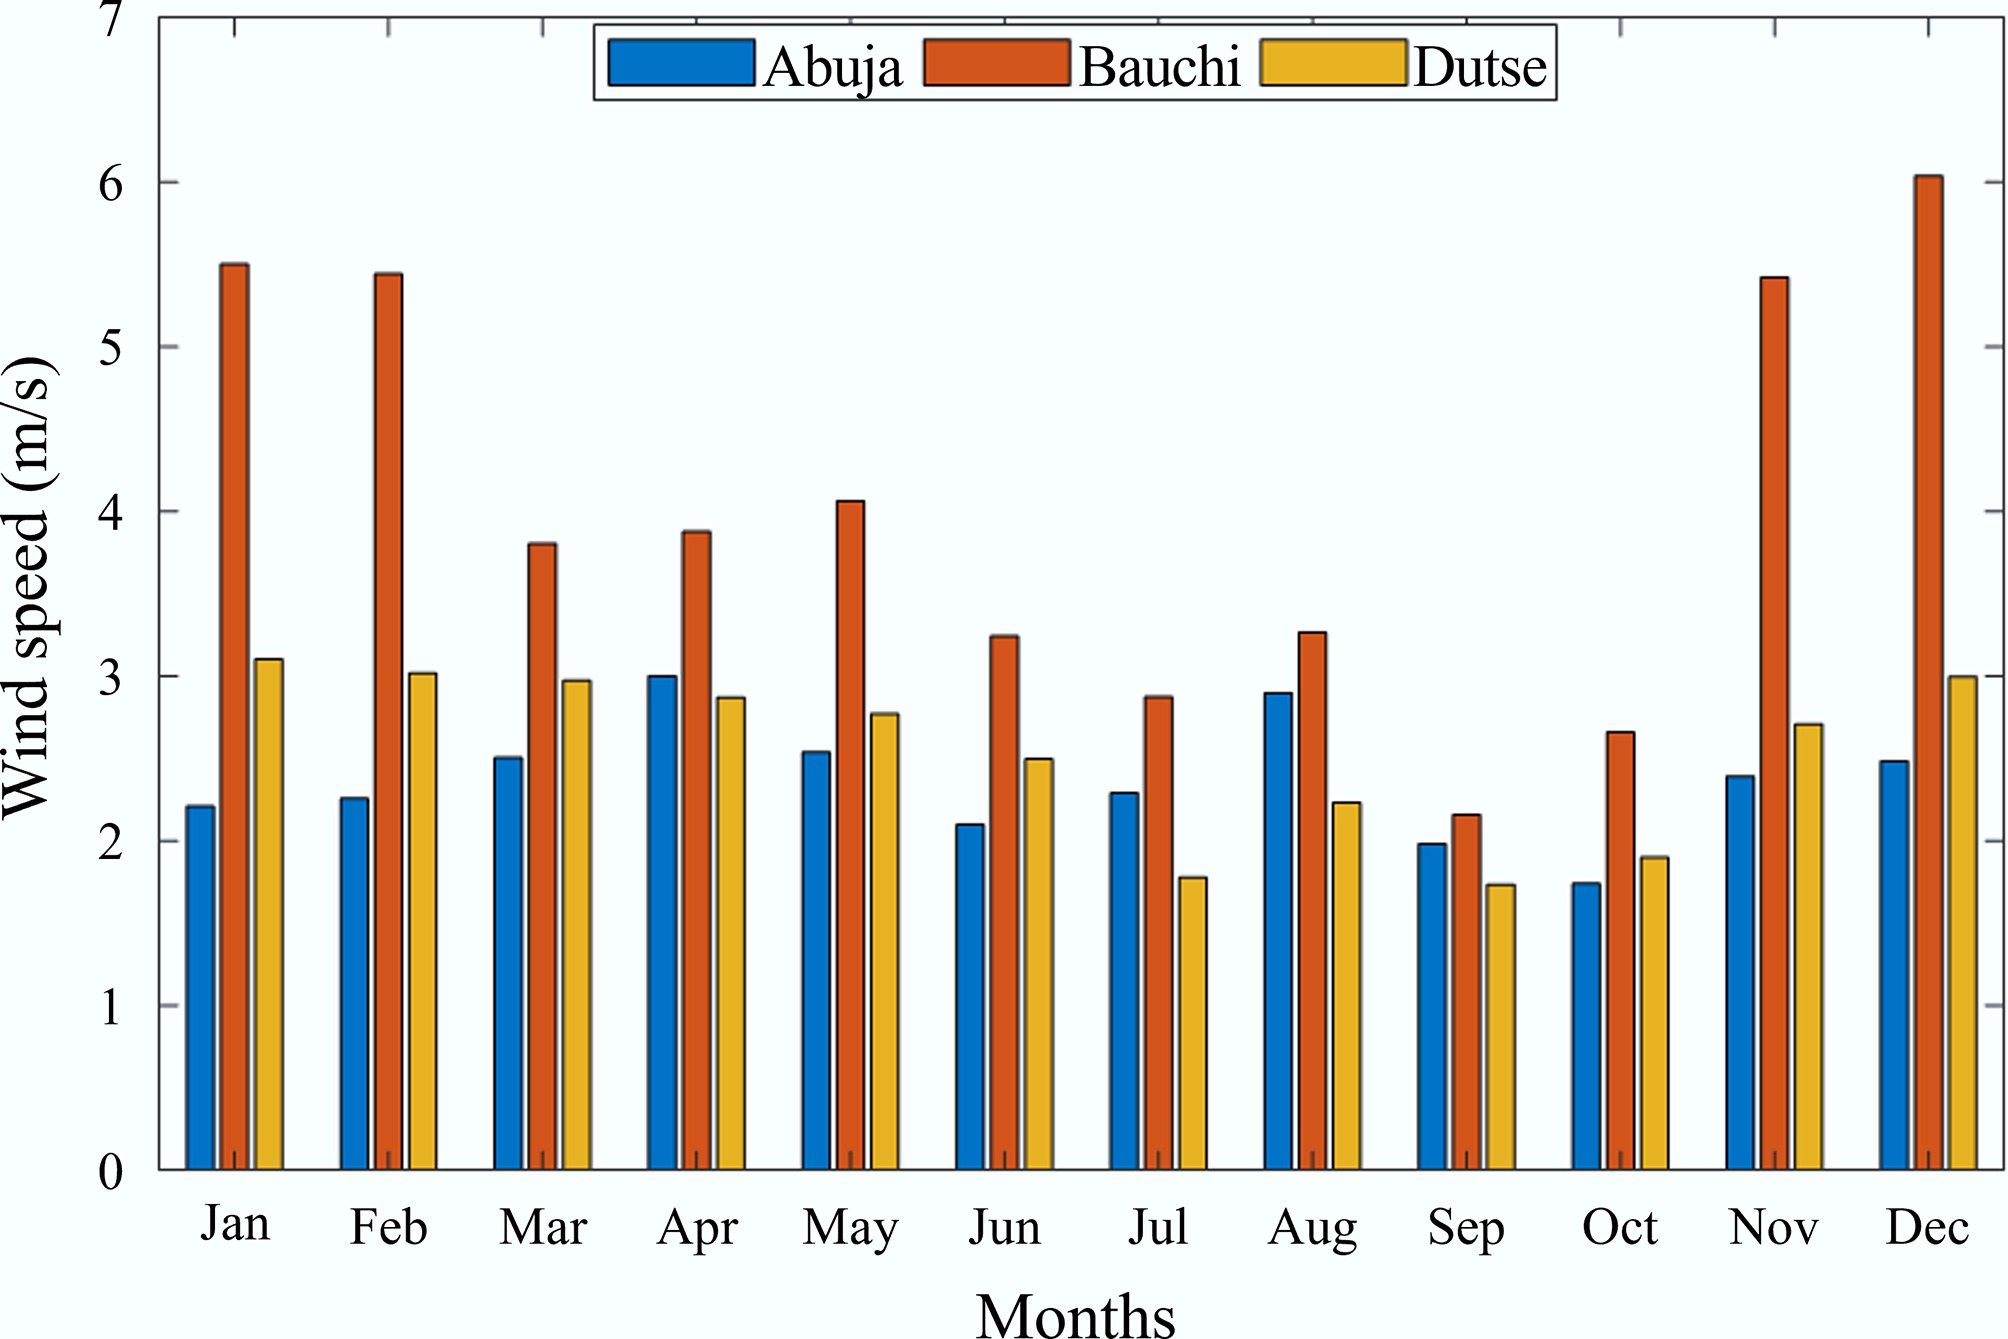
Figure 7.
Wind speed resource variability in the northern regions.
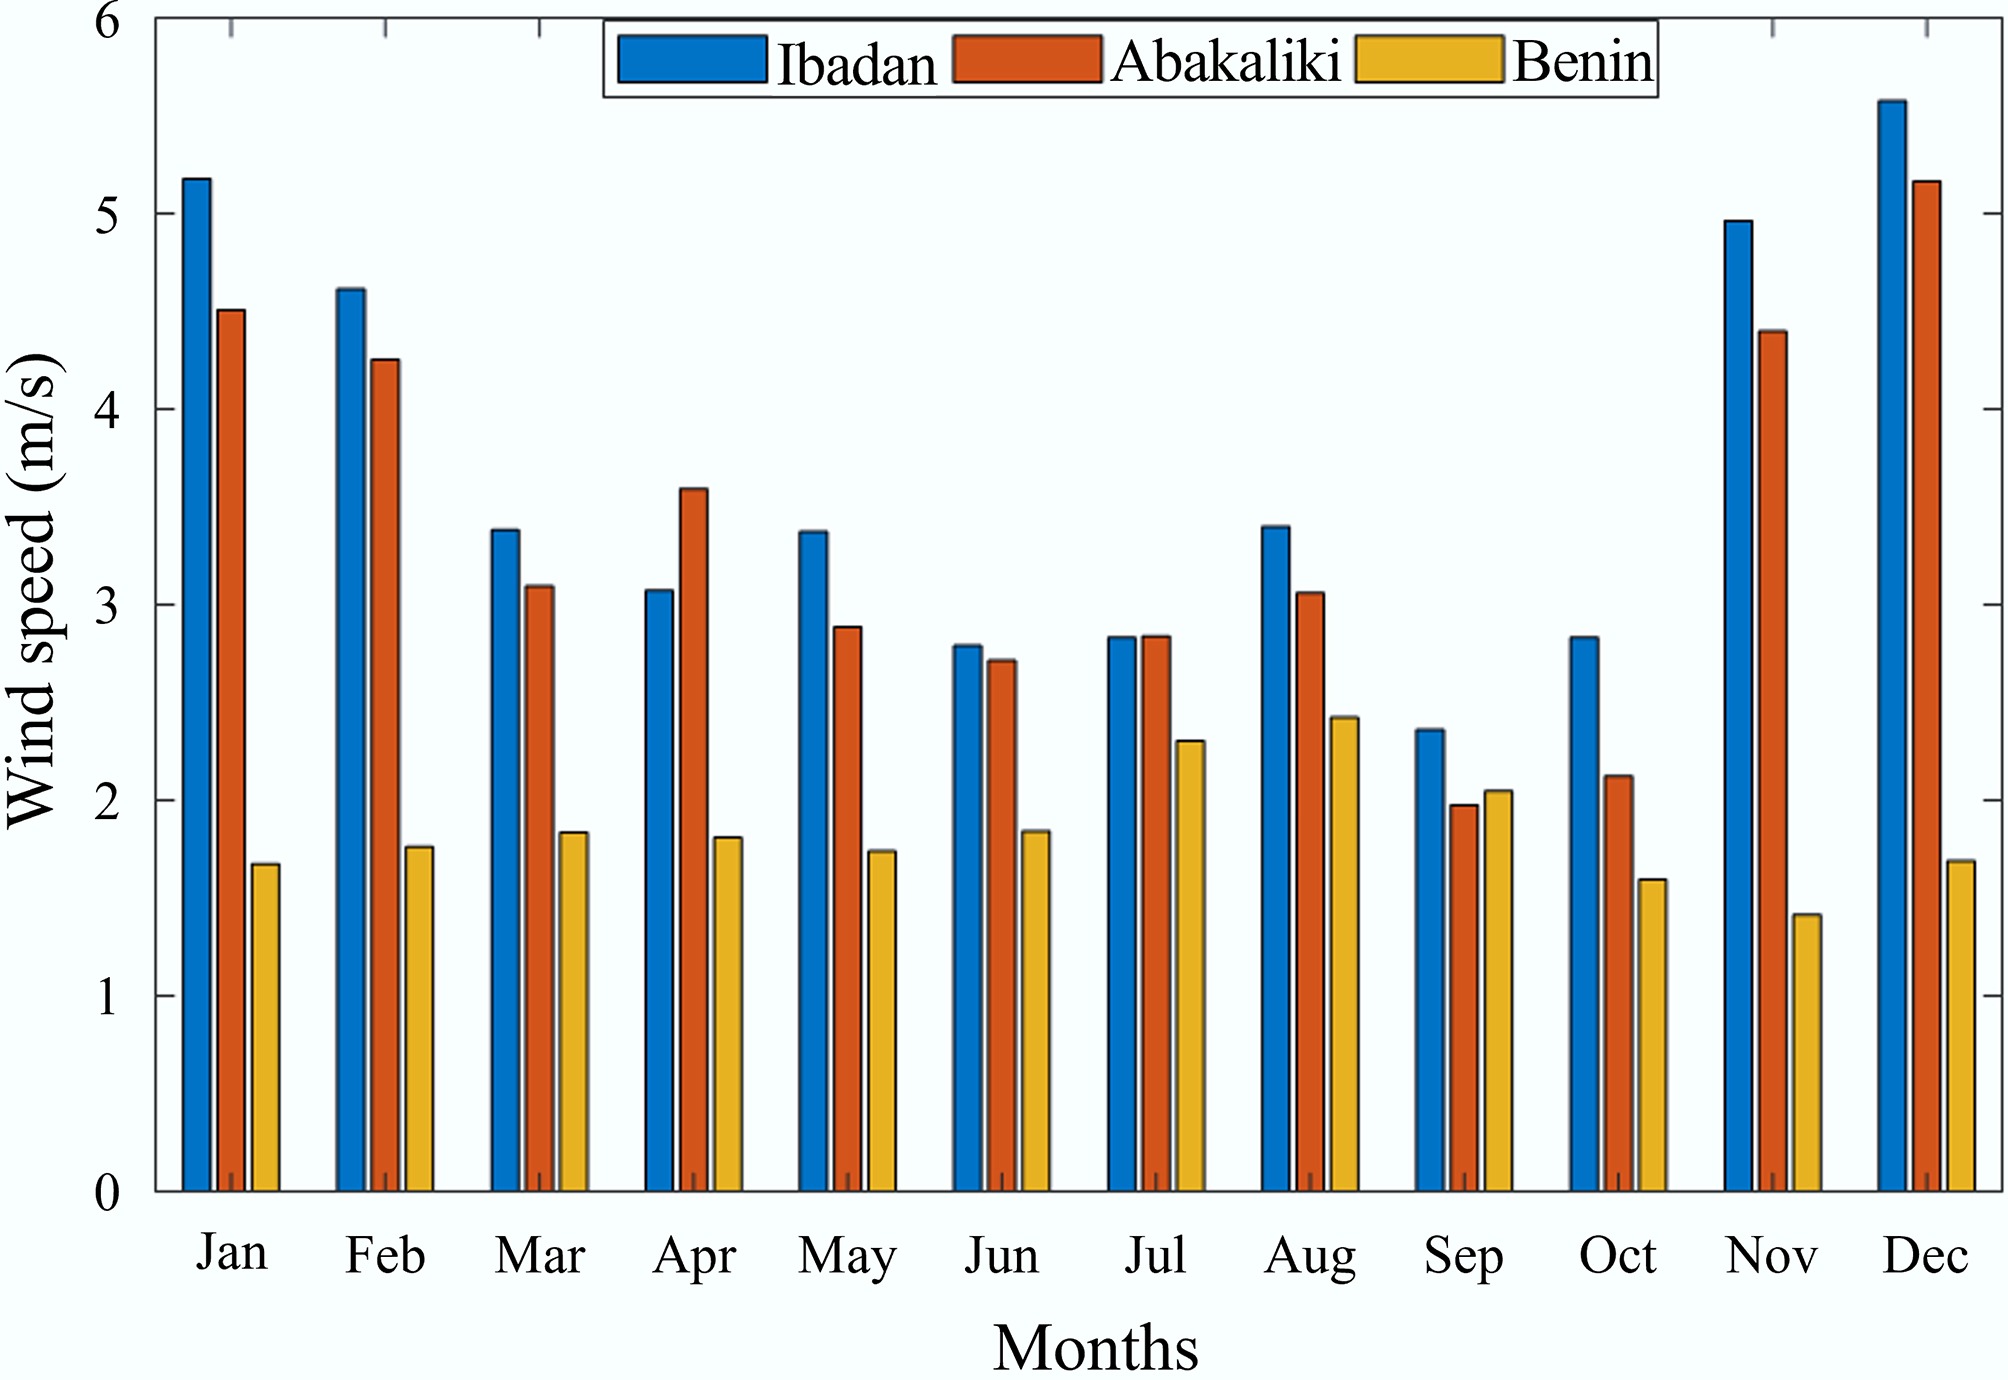
Figure 8.
Wind speed resource variability in the southern regions.
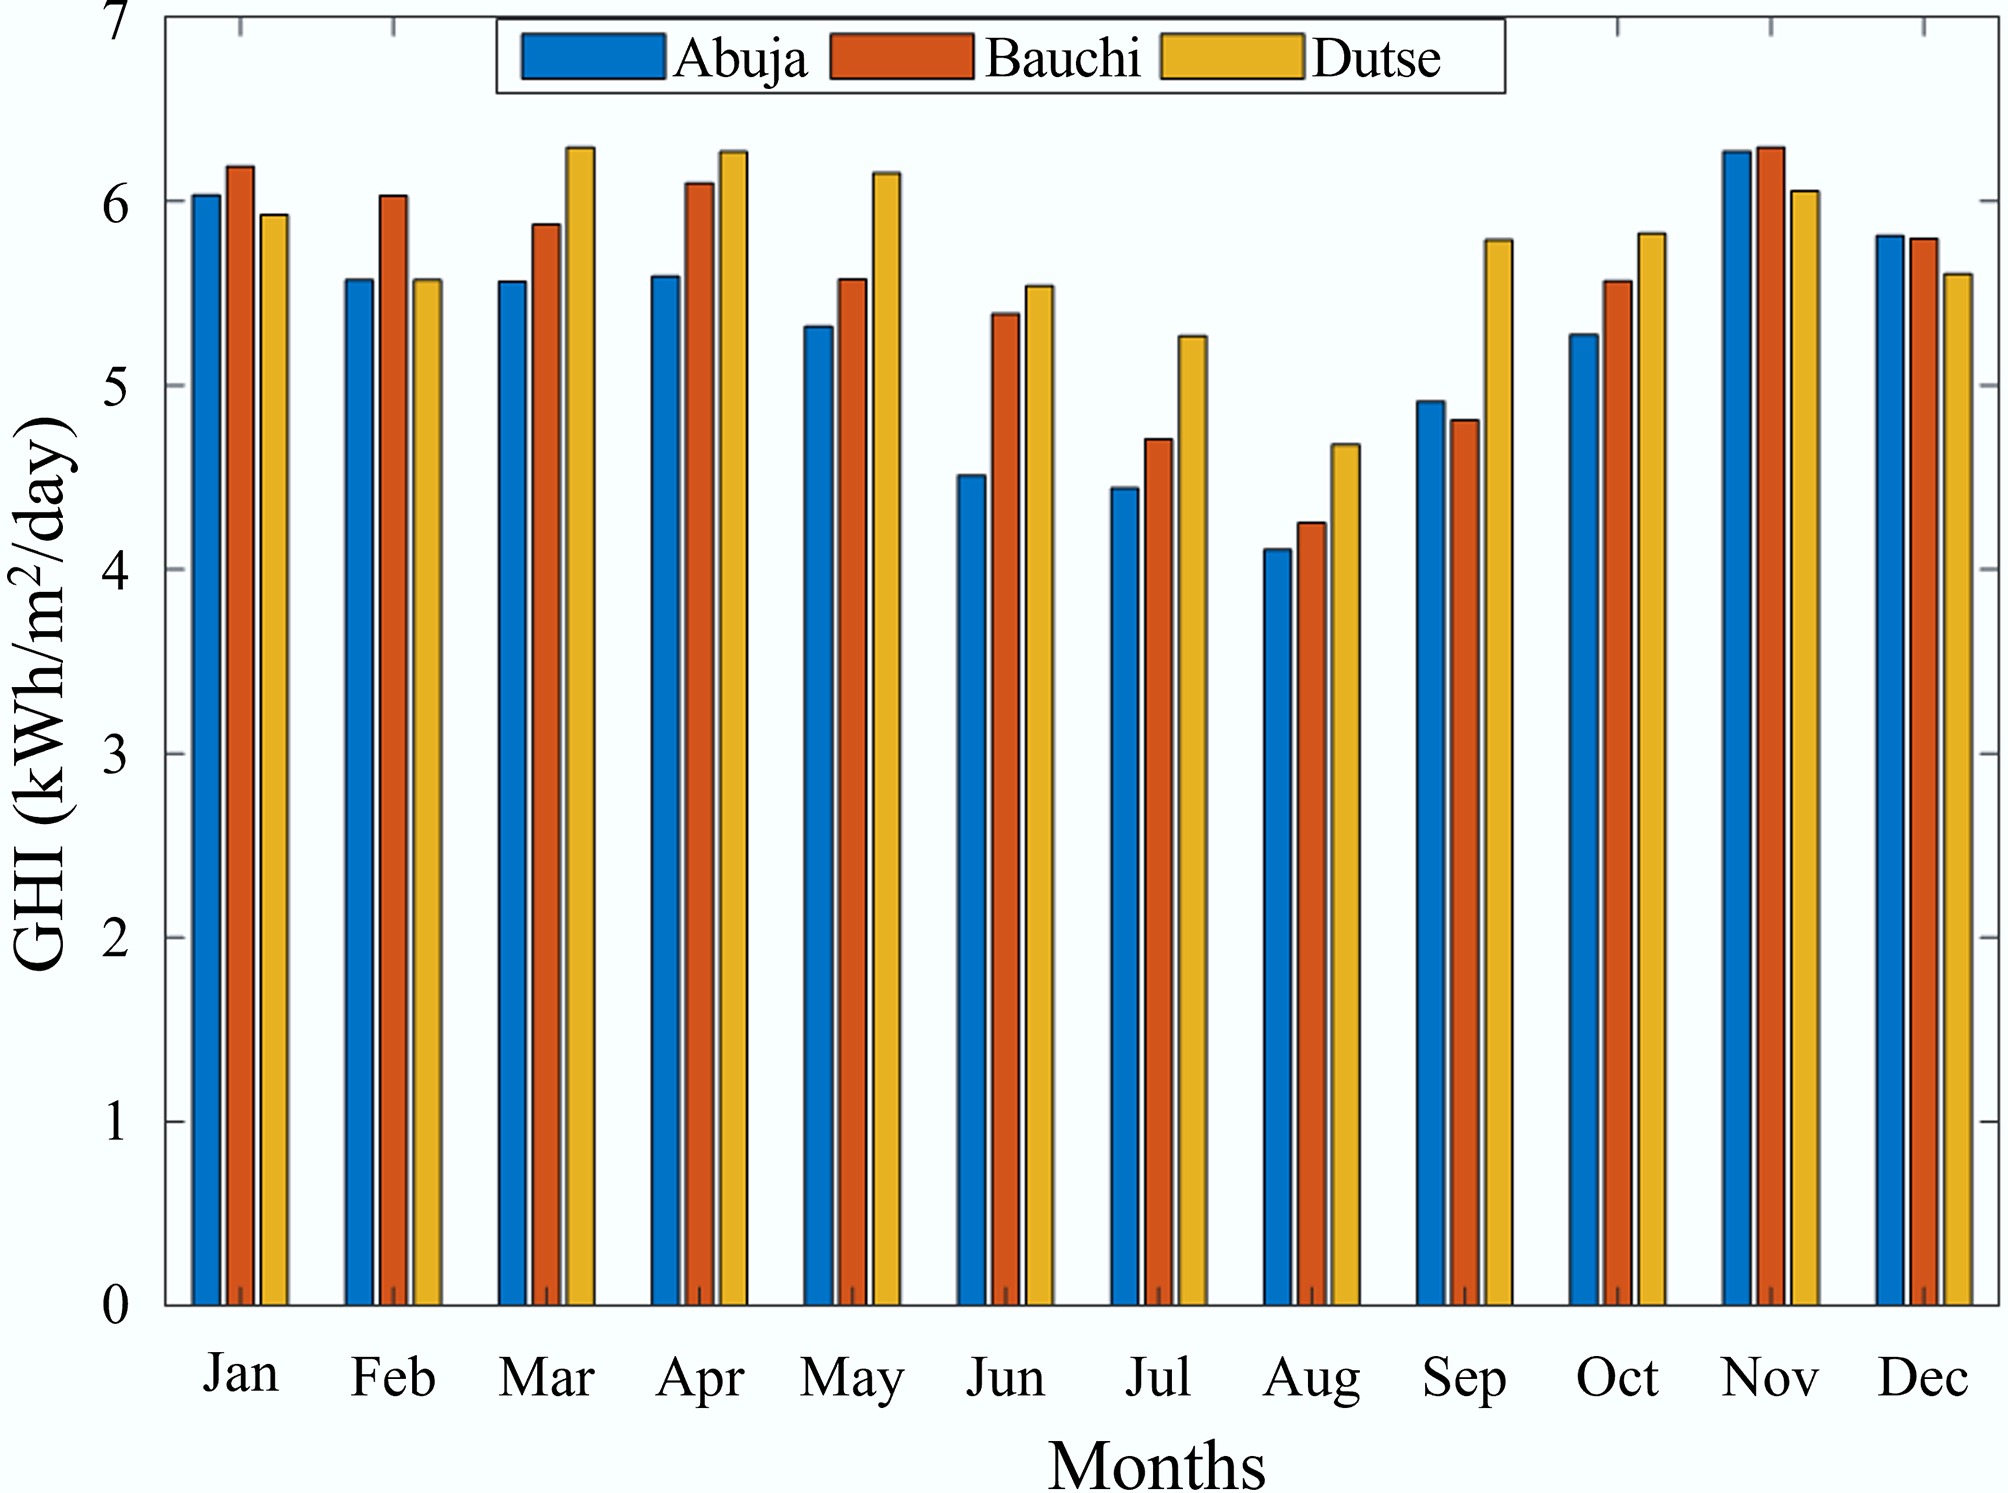
Figure 9.
GHI resource variability in the northern regions.
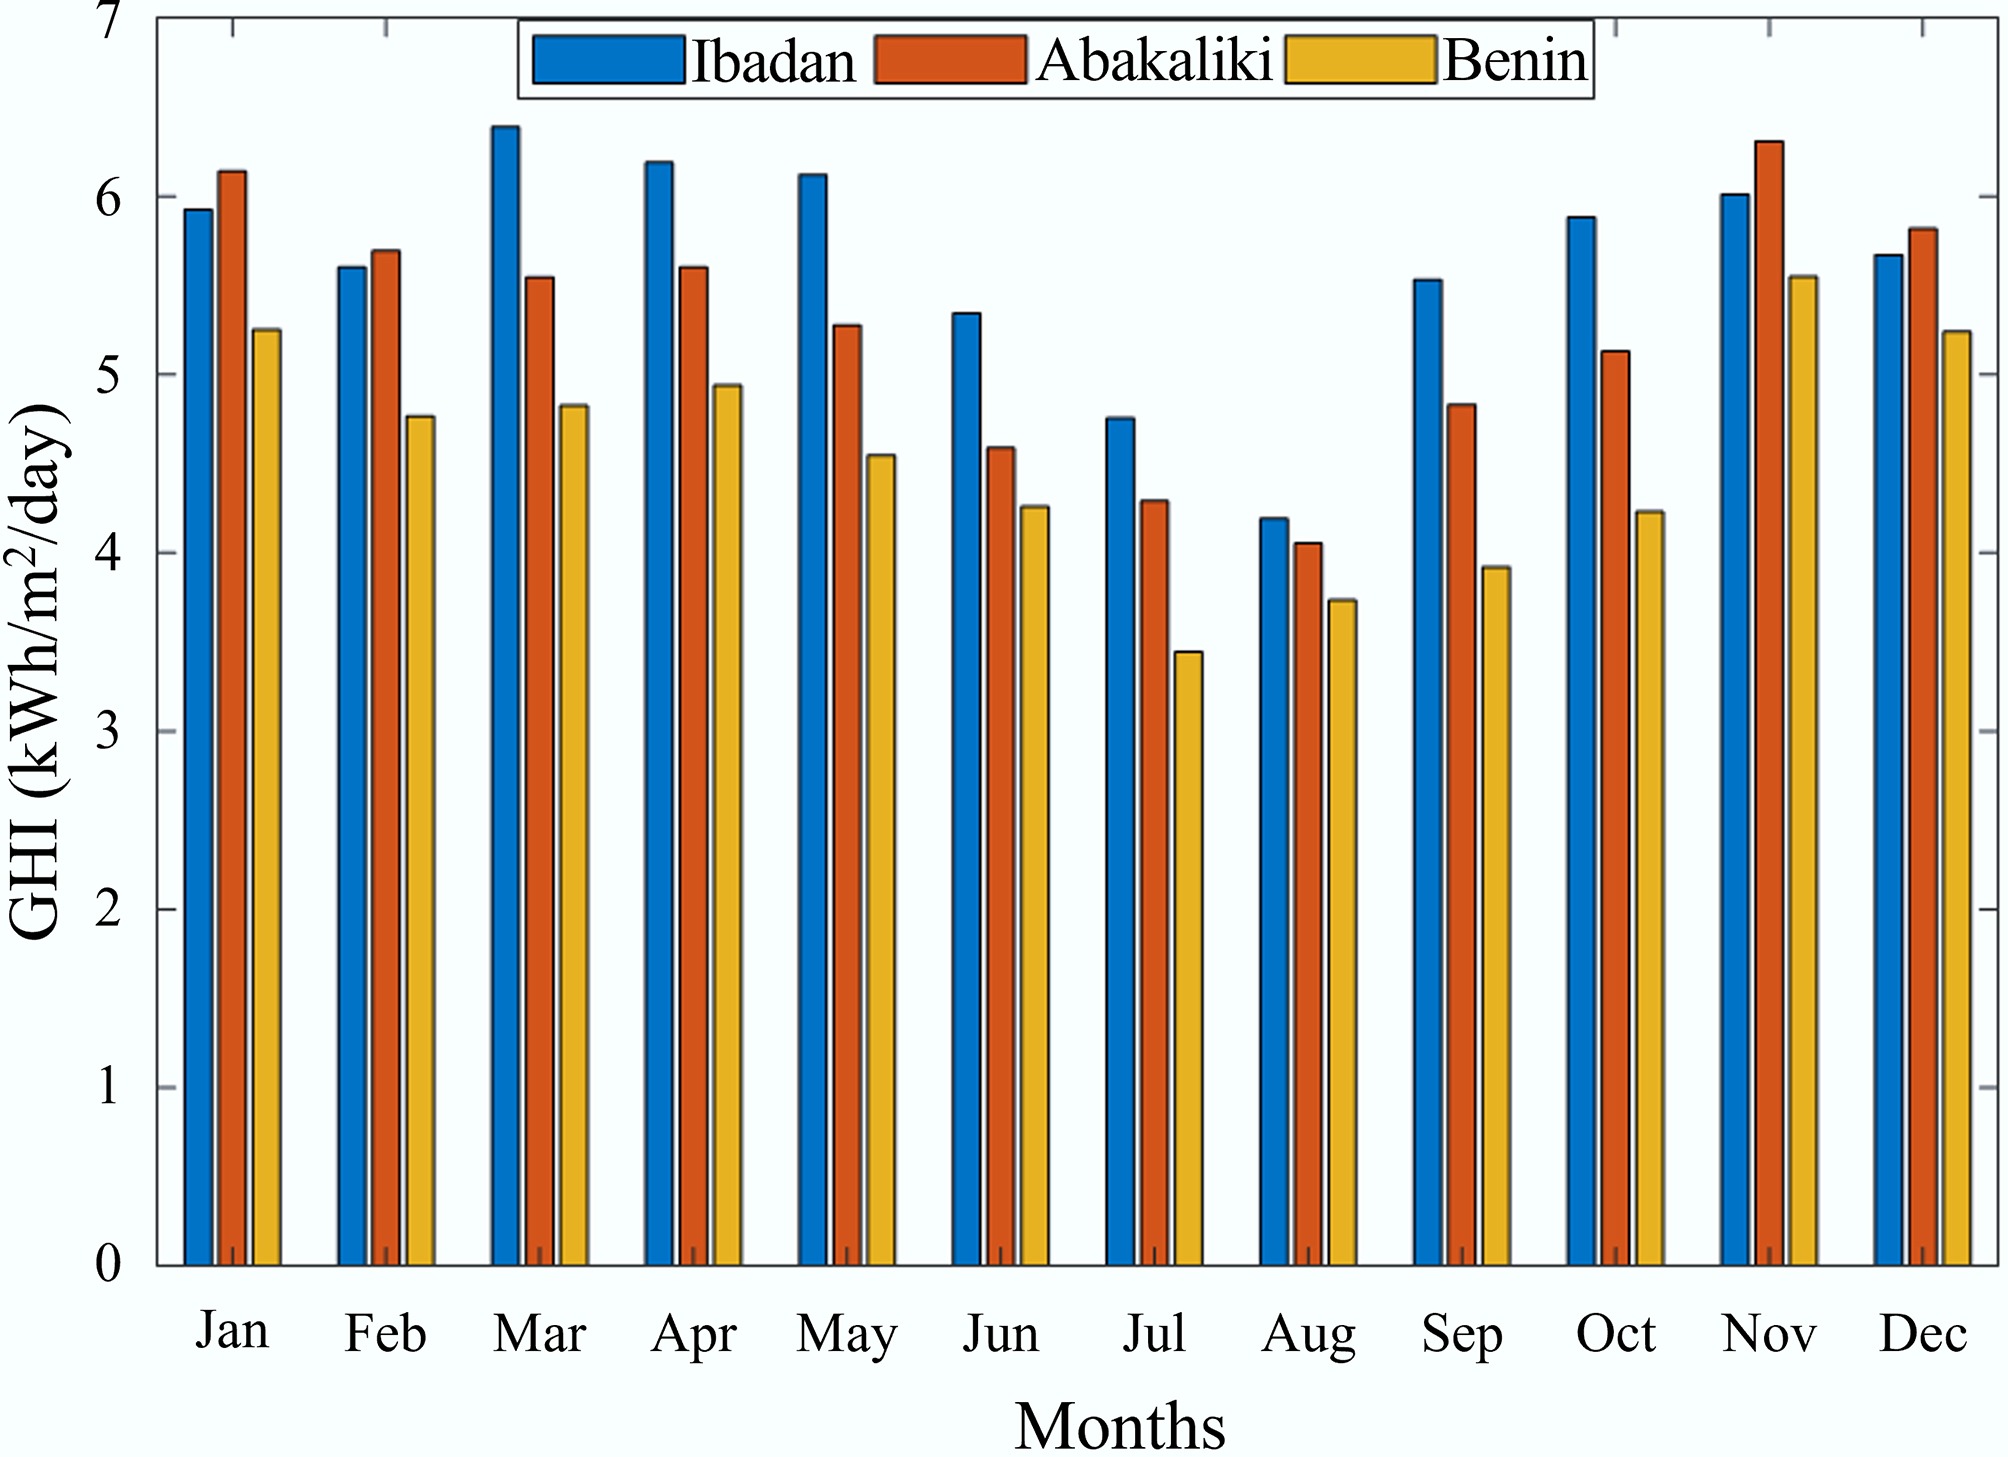
Figure 10.
GHI resource variability in the southern regions.
Determination of wind shear exponent
-
To determine the wind shear exponents of different locations in Nigeria, daily average wind data for 1 year (2024) was employed for 37 locations which are the capitals of each state in the country, together with the Federal Capital Territory (FCT), were used for the investigation, and the results were furnished in Table 11. The table shows that annual wind shear exponent values range from 0.10 (Calabar) to 0.48 (Asaba) in Nigeria.
Table 11. Wind shear exponent for different regions
Region Wind shear exponent (a) North-central region Minna 0.24 Lokoja 0.24 Makurdi 0.26 Jos 0.23 Lafia 0.25 Ilorin 0.24 Abuja 0.25 (b) Northeast region Bauchi 0.21 Maiduguri 0.25 Jalingo 0.25 Yola 0.22 Gombe 0.22 Damaturu 0.25 (c) Northwest region Gusau 0.23 Sokoto 0.23 Kaduna 0.27 Birnin kebbi 0.27 Katsina 0.30 Kano 0.24 Dutse 0.33 (d) Southeast region Enugu 0.24 Owerri 0.30 Abakaliki 0.26 Umuahia 0.30 Awka 0.27 (e) South-south region Yenagoa 0.38 Uyo 0.36 Benin City 0.33 Port Harcourt 0.28 Calabar 0.10 Asaba 0.48 (f) Southwest region Ibadan 0.28 Ado Ekiti 0.29 Oshogbo 0.35 Akure 0.41 Ikeja 0.18 Abeokuta 0.30 -
Solar, wind, and biomass resources have been investigated for water pumping applications in the six geopolitical regions of Nigeria, and wind shear has also been determined for 37 locations in the country. Unit cost of energy and capacity factor were employed as economic and technical indices, respectively. The effect of appropriate wind turbine capacity factor on unit cost of energy, impact of yearly variation of wind speed on shear exponent, influence of increase in installed capacity of wind on capacity factor, the determination of wind shear exponent across 37 locations, and seasonal variability of variable renewable resource (VRR) were performed. The outcome of the study shows that wind turbine DW 54 EWT (T7) and Panasonic solar module (M2) produce the highest capacity factors across the sites. SPV is the best candidate for water pumping applications from the cost of energy point of view. The range of wind shear exponent in Nigeria is between 0.10 (Calabar) and 0.48 (Asaba) for a typical year, and yearly variation in wind shear for Asaba, Abeokuta, Awka, Dutse, Bauchi, and Abuja are 0.49 ± 0.01, 0.30 ± 0.01, 0.29 ± 0.01, 0.33 ± 0.01, 0.22 ± 0.01, and 0.25 ± 0.01, respectively. Seasonal variability of wind speed and solar GHI is low in the rainy season and high during the dry season in Nigeria.
The authors gratefully appreciate the National Aeronautic Space Administration (NASA) for providing the data employed in this study free of charge. The authors also gratefully acknowledge the management of Abiola Ajimobi Technical University and the University of Ibadan for providing an enabling environment for the study.
-
During the preparation of this study, the authors did not use any AI tools for language refinement, data analysis, figure enhancement, or any other purpose. The authors take full responsibility for the integrity and originality of the final manuscript.
-
The authors confirm their contributions to the paper as follows: all authors contributed to the study conception and design. Richard Oladayo Olarewaju: writing − first and final draft. Ayodeji Samson Olatunji Ogunjuyigbe and Temitope Raphael Ayodele: supervision, editorial work, review and writing. Samson Oladayo Ayanlade: literature review, editorial work, review and writing. Ignatius Kema Okakwu: literature review and editorial work. Olusola Kunle Akinde: editorial work, review and writing. All authors reviewed the results and approved the final version of the manuscript.
-
The datasets used or analyzed during the current study are available from the corresponding author upon reasonable request.
-
The authors declare that they have no known competing financial interests or personal relationships that could have appeared to influence the work reported in this paper.
-
Full list of author information is available at the end of the article.
- Copyright: © 2026 by the author(s). Published by Maximum Academic Press, Fayetteville, GA. This article is an open access article distributed under Creative Commons Attribution License (CC BY 4.0), visit https://creativecommons.org/licenses/by/4.0/.
-
About this article
Cite this article
Olarewaju RO, Ogunjuyigbe ASO, Ayodele TR, Ayanlade SO, Okakwu IK, et al. 2026. Investigation of solar-wind-biomass for water pumping application and wind shear determination across different locations in Nigeria. Energy & Environment Nexus 2: e025 doi: 10.48130/een-0026-0019 

Investigation of solar-wind-biomass for water pumping application and wind shear determination across different locations in Nigeria
- Received: 08 May 2026
- Revised: 31 July 2026
- Accepted: 15 September 2026
- Published online: 20 October 2026
Abstract: In this paper, nine different wind turbines (WTs) and ten different solar photovoltaic (SPV) modules from different manufacturers were employed in order to determine the best WT and SPV for water pumping applications across the six geopolitical regions of Nigeria. Capacity factor and unit cost of energy were employed as the technical and economic indices, respectively. The study also determined the wind shear across 37 locations in the country. Relevant results revealed that turbine DW 54 EWT (T8) and Panasonic Solar module (M2) produce the highest capacity factor across the sites considered in this study, with Turbine T7 producing 40.08%, 32.17%, 3.72%, 9.55%, 43.85%, and 17.26% in sites S1 to S6, respectively, and module M2 producing 18.76%, 17.38%, 15.08%, 17.43%, 18.33%, and 19.09% in sites S1 to S6, respectively. The cost of energy produced from wind ranges from ${\$} $1.84 (S2, Abakaliki) to ${\$} $8.58/kWh (S4, Abuja); the cost of energy obtained from biomass is between ${\$} $0.42 (S4) and ${\$} $1.11/kWh (S5), while the cost of energy produced from SPV ranges from ${\$} $0.21 (S2) to ${\$} $0.40/kWh (S4). Wind energy does not produce the best feasible solution for water pumping in any of the sites considered. The results also revealed that wind shear exponent values in Nigeria range from 0.10 (Calabar) to 0.48 (Asaba).
-
Key words:
- Wind turbine /
- Solar photovoltaic /
- Cost of energy /
- Capacity factor /
- Nigeria