













-
African bermudagrass (Cynodon transvaalensis Burtt-Davy) is a diploid (2n = 2x = 18) warm-season grass native to a small area in South Africa[1]. Because of its greater irrigation and fertilizer requirements, poor summer turfgrass quality, and tendency to discolor under cool temperatures, African bermudagrass is not used as a turfgrass to the extent of its allotetraploid relative common bermudagrass (C. dactylon [L.] Pers.)[2]. Instead, the species is desirable for its unique morphological characteristics, such as fine leaf texture, short stem internode length, and high sod density, which are critical for developing high-turfgrass quality hybrid bermudagrass (C. dactylon × C. transvaalensis) (2n = 3x = 27) cultivars[3].
Bermudagrass is susceptible to winterkill when grown in the transitional climatic zone of the United States, particularly at latitudes higher than 36°N[3]. Poor winter survival leads to delayed spring green-up, increased weed invasion, and reduced turf uniformity, particularly following harsh winters or freeze–thaw cycles. Freeze tolerance is a determining factor for winter hardiness in bermudagrass. The lethal freezing temperature (LT50, which kills 50% of the population) has been used to quantify the freezing tolerance of bermudagrass. Anderson et al.[4] first developed the protocol to reliably determine the LT50 of bermudagrass using freezing chambers. Using this approach, the LT50 of bermudagrasses can be determined and differentiated, providing decision-making information to select bermudagrass genotypes with improved freezing tolerance[5]. However, the large-scale evaluation of freezing tolerance remains time-consuming and is often limited by the availability of freezing chambers. Therefore, spring regrowth, including spring green-up and winterkill evaluations have been widely used to indirectly evaluate freezing tolerance in bermudagrass and identifying bermudagrass genotypes with superior winter hardiness[6]. Using winter-hardy bermudagrass cultivars can minimize winterkill issues in the transitional climatic region in the US. One of the major objectives of the bermudagrass breeding program at Oklahoma State University is to improve winter hardiness. The interspecific hybrid bermudagrass cultivars 'OKC3920' and 'OSU1337' were the most recent released cultivars with significantly improved winter hardiness[7,8].
Utilizing winter-hardy bermudagrass parents is important in developing winter-hardy interspecific hybrid bermudagrass. Common bermudagrass has been found on every continent between latitudes 45° S and 53° N[1]. Common bermudagrass is considered to be the contributor to the winter hardiness of hybrid bermudagrass because of its cosmopolitan distribution, which harbors enormous genetic diversity and variation in winter hardiness[2,6]. African bermudagrass is generally considered to be a contributor to the quality traits of turfgrass and has largely been overlooked as a contributor to other traits. However, African bermudagrass can adapt to colder climates beyond its natural distribution. Recent studies demonstrated that substantial genetic variations exist, and moderate to high heritability was observed for winter hardiness in African bermudagrass[1,9,10]. It is likely that the development of winter-hardy hybrid bermudagrass can be enhanced by crossing winter-hardy parents, highlighting the critical need for improving the winter hardiness of this historically overlooked species.
Phenotypic selection, although successfully used in bermudagrass breeding programs, has limitations because it can be influenced by annual fluctuations of multiple environmental factors, such as diseases, pests, and drought, which decreases selection accuracy[11]. Marker-assisted selection (MAS) utilizes DNA markers linked to key genes for targeted traits, enabling the screening of breeding materials for favorable allele combinations before transplanting them into field nurseries. Marker-assisted selection is particularly effective for enhancing genetic gain for traits controlled by major genes. However, MAS requires the developmetn of appropriate populations followed by quantitative trait locus (QTL) mapping, QTL validation, and the development of reliable and breeder-friendly (i.e., polymerase chain reaction [PCR]-based) molecular markers[12]. Several kompetitive allele-specific PCR (KASP) markers have been developed, validated, and used to improve selection accuracy in new cultivar development in crops such as wheat (Triticum aestivum L.)[13,14], rice (Oryza sativa L.)[15], and corn (Zea mays L.)[16]. However, the routinely used molecular marker system in bermudagrass is simple sequence repeat (SSR) markers[17]. Although accurate and reproducible, the relatively low throughput of SSRs limits the linkage map density and subsequent QTL detection[18]. No SSR linked to targeted traits that can be used for MAS is available for improving bermudagrass. Therefore, there is a clear trend of adopting KASP makers over the existing SSR system for MAS in plant breeding not only because KASP markers can be more closely linked to the target genes or QTL, but KASP genotyping is also more productive than SSR systems. Recently, a QTL mapping study using a first-generation selfed (S1) African bermudagrass population identified 10 QTL associated with winter hardiness based on a single nucleotide polymorphism (SNP)-based structured linkage map[10]. Five of the identified QTL were deemed to be consistent and explained up to 36% of the phenotypic variation. Subsequent work further investigated the differentially expressed genes (DEGs) within three consistent QTL regions and found consistent up- and downregulated genes at 12, 24, and 48 hours of cold acclimation in African bermudagrass[19]. Previous studies provide a foundation for developing molecular markers for use in MAS and the improvement of winter hardiness in African bermudagrass.
Compared with MAS, which focuses on a few loci with major effects, genomic selection (GS) uses genome-wide molecular markers to estimate the effect of all markers across the genome, regardless of whether they are significant or not, in order to calculate genomically estimated breeding values (GEBVs) for complex traits[20,21]. Genomic selection relies on a training population with both phenotypic and genotypic data to derive marker effects, which are then used to predict breeding values in populations lacking phenotypic records[20,21]. Genomic best linear unbiased prediction (GBLUP) incorporates genomic markers into linear mixed models to generate precise estimates of breeding values[22]. Traditional GS models, such as GBLUP and ridge regression best linear unbiased prediction (rrBLUP), are most frequently used in GS[23,24]. However, these models may fall short when dealing with nonlinear interactions, epistasis, or the high-dimensional datasets typical of modern sequencing platforms[25]. Recent advances in machine learning (ML) offer a transformative extension of GS by enabling the modeling of complex, nonlinear relationships between genotypes and phenotypes[26,27]. Machine learning develops self-improving algorithms that automatically learn patterns from data to build predictive models, without explicit programming[27]. Tree-based ML genomic selection models, such as random forest (RF), Bayesian additive regression trees, and gradient boosting machines, require no assumptions about the underlying trait (e.g., effect additivity, the number or size of interactions, or interaction depth) and can effectively model complex nonlinear relationships between predictors and the response variable[28]. Introduced by Breiman[29], RF combines bootstrap aggregation (bagging) with random feature selection to improve predictive accuracy while mitigating overfitting, and it has been widely adopted in fields such as ecology and bioinformatics. For example, RF demonstrates superior performance in capturing intricate gene × gene and gene × environment interactions, and is widely used in GS[27,30,31].
Genomic selection was first adopted in dairy cattle breeding[32]. Many papers have reported the potential use of GS in major crops[27,33,34,35]. Compared with annual crops, the application of GS in perennial crops is more appealing for plant breeders, since it can reduce the breeding cycle[36]. Genomic selection has been used in breeding forage-type perennial ryegrass (Lolium perenne L.) for heading date, nutrient quality, forage quality, seed yield, disease tolerance, and forage yield[37,38,39,40,41,42]. However, few empirical data are available for GS for turfgrass traits in turfgrass species. In African bermudagrass, recent genetic and genomic studies provide an opportunity to integrate MAS and GS in breeding. Accordingly, the objectives of this study are to (a) develop KASP markers associated with African bermudagrass's winter hardiness traits and (b) implement GBLUP and RF GS models to predict winter hardiness in African bermudagrass.
-
On the basis of a previous QTL mapping study using a first-generation selfed (S1) population derived from 'OKC1163' African bermudagrass[10], spring green-up was visually rated on a 1 to 9 scale, where 1 represented no green-up and 9 was complete green-up[43]. In addition, digital images were taken using a light box, and percent green cover during spring green-up values were generated by Turf Analyzer 1.01 for spring green-up percent green cover (SGPGC)[44,45]. Winterkill was visually rated as the percentage of ground coverage killed by the low temperatures in winter. A total of seven spring green-up QTL and three winterkill QTL were identified. Three genomic regions overlapping with winter hardiness QTL were consistently identified from at least 2 years and explained up to 36% of phenotypic variations. To further identify candidate genes associated with winter hardiness, a transcriptomic study conducted by Cevallos et al.[19] identified several DEGs, including evm.TU.LG03.4542 (cytochrome P450) and evm.TU.LG03.4609 (ethylene-responsive transcription factor) on chromosome 3, evm.TU.LG01.621 (ethylene-responsive transcription factor) on chromosome 1, and evm.TU.LG09.1271 (ferredoxin-1) on chromosome 9, which were highly upregulated from three consistent QTL regions on chromosome 1 (2.2–4.7 Mbp), chromosome 3 (54.0–55.4 Mbp), and chromosome 9 (15.2–17.6 Mbp) after 12, 24, and 48 h of 8/2 °C day/night cold acclimation treatment. Therefore, these DEGs were considered to be candidate genes and selected for developing KASP markers. In addition, SNP markers with a peak logarithm of odds (LOD) value in each QTL region were also selected for developing KASP markers. Sequences within 300 bp upstream and downstream of each SNP were extracted using Bedtools v 2.27.1 on the basis of the African bermudagrass reference genome[46,47]. KASP markers were designed manually following the rules that the length of primer is around 20 bp, the GC content is 40%–60%, and annealing temperatures are 55 to 60 °C. To increase the success rate, multiple KASP assays were designed for each SNP. The FAM (5′-GAAGGTGACCAAGTTCATGCT-3′) and HEX (5′-GAAGGTCGGAGTCAACGGATT-3′) sequences were added to the 5' ends of the selected sequence with SNPs. Primers were synthesized by Eurofins Scientific (Luxembourg City, Luxembourg). All KASP assays were tested using the DNA of a set of randomly selected 23 genotypes from the S1 OKC1163 population and a water as blank control. DNA was extracted according to the procedures described by Yu et al.[48]. The Opentrons OT2 robotic platform (Opentrons Labworks Inc., Long Island City, NY) was used to prepare KASP assays with a 4-μL reaction mix containing 20 ng of genomic DNA, 2 μL of PACE 2.0 Genotyping Master Mix with low Rox (3CR Bioscience Ltd, Cambridge, UK), 3.6 μM of each allele-specific primer, and 9 μM of common primer. The assays were performed in a QuantStudio 6 Flex Real-Time PCR system (Thermo Fisher Scientific, Waltham, MA). PCR began at 30 °C for 1 min and 94 °C for 15 min, followed by 40 cycles of 94 °C for 20 s and 60 °C for 1 min, and ended with a final step of 30 °C for 1 min to collect fluorescence signal[13]. KASP data were visualized using the QuantStudio 6 Flex Real-Time PCR system's software. The observed genotypes were compared with the SNP marker data of each plant from initial sequencing to determine whether the KASP markers were diagnostic. According to the phenotypic data from Yu et al.[10], the mean value of each winter hardiness trait was compared across the three allele types within every marker. Comparisons were performed using pairwise t-tests (p < 0.05), and the results were visualized with GraphPad Prism (v.9.2, GraphPad Software Inc.).
Genomic prediction
-
Genomic prediction was conducted using spring green-up data collected from 2018 to 2020 and winterkill data collected from 2018 to 2021, as reported by Yu et al.[10], similar to the data described above for KASP marker development. In total, 94,909 SNP markers were generated from this population using genotyping-by-sequencing[48]. Genomic data were filtered to remove all missing values. A marker dataset containing 19,460 SNPs without missing data was used for GS. Based on the preliminary results, the prediction accuracies were low, which could be caused by the low quality of the genotypic data. We subsequently filtered out the low-quality SNP markers and created two more datasets. This first dataset converted a read depth of 1 for each allele based on the hmc file into missing data and subsequently removed all SNPs with missing data. The second dataset converted read depths ≤ 2 for each allele into missing data and subsequently removed all SNPs with missing data. The best linear unbiased estimate (BLUE) values of winter hardiness traits were estimated using the R package lme4, where genotype was considered as the fixed effect and year was considered as a random effect for year-to-year variance. The BLUE values of winter hardiness traits were used for prediction using the GS models GBLUP in the R package rrBLUP[23] and RF in Python using the Scikit-learn package[49]. The GBLUP model was implemented as y = 1μ + Zg + ε, where y is a vector of the winter hardiness phenotype, 1 is a vector of ones, μ is the mean, Z is an incidence matrix relating the observations to the random effects, g is a vector of random additive genetic effects representing the GEBV for each genotype, and ε is a vector of the residuals. The RF model was implemented as y = f(x), where y is a vector of the winter hardiness phenotype, x is the SNP marker score, and f is the fitted mapping function.
To assess the prediction accuracy of GBLUP and RF, 100 rounds of fivefold and leave-one-out cross-validation (LOOCV) were used for each winter hardiness trait. For the fivefold method, the population was randomly divided into five subsets, and then the GBLUP and RF models were trained on four of the five subsets (training sets, 80% of the population size) to predict the fifth subset (testing set, 20% of the population size). In each replicate, the prediction accuracy was calculated as the mean of Spearman's correlation coefficient between the GEBV predicted by the GBLUP and RF models and the observed phenotypic values of the testing set. The overall prediction accuracy was averaged across 100 replicates. In the LOOCV, one individual was excluded from the training population (108 plants), and the GEBV of the same plant was predicted by the GBLUP and RF models trained from the remaining plants. This was done for all 109 plants, and the predicted accuracy of the 109 predictions was calculated as the correlation between the predicted GEBVs and the observed phenotypic values. All predictions were performed using three SNP marker datasets, two GS models, and two validation approaches.
-
In total, 192 primers paired in 96 KASP assays were synthesized, based on 30 SNPs. After screening 23 randomly selected genotypes from the population, 64 (66.7%) KASPs were able to be amplified. Eight (8.3%) KASPs based on six SNPs from the three targeted winter hardiness QTL regions were used as diagnostic markers to genotype the randomly selected African bermudagrass genotypes with less than one incorrect genotype compared with the sequencing data (Table 1, Supplementary Fig. S1). We also conducted a phenotypic analysis using the across the years for mean values of winterkill, spring green-up, and SGPGC to determine which allele corresponds to better winter hardiness (Fig. 1). For winterkill, the markers TP183580, TP16800, and TP21857 showed a significant difference among allele genotypes. Although it was not statistically different, we observed a numerical difference in the phenotype means for the other markers. For spring green-up, all markers showed a significant difference among the three allele genotypes and can be used to screen African bermudagrass to select more winter-hardy genotypes. A similar trend for the phenotypic means of SGPGC was observed for each marker, but the phenotypic means of different alleles of the markers TP83433 and TP12397 were not statistically different. According to the phenotype analysis, homozygous A of TP183580, homozygous A of TP16800, homozygous G of TP48420, and homozygous G of TP21857 consistently showed more winterkill and delayed spring green-up.
Table 1. A list of primers for SNP-based KASP that were tightly linked to winter hardiness QTL and their putative physical locations in the African bermudagrass reference genome.
KASP markera QTLb Chromosome Position Allele Allele-specific primerc Non-allele-specific primer TP183580-KASP1 QCTSG3/QCTWK2 3 56,078,869 A/G ACGCCACTGCCGTAAGAGCTGa/g ACCTGCGGTACCAGATGCTTCT TP16800-KASP1 QCTSG1/QCTWK1 9 16,202,201 A/C AGTCGTCGGGCAGCACGGGa/c CGGTCGTCCACCATCCCTGCATT TP16800-KASP3 QCTSG1/QCTWK1 9 16,202,201 A/C GAGTCGTCGGGCAGCACGGGa/c GCGCTGTCTTCAGGTCACAGT TP83433-KASP1 QCTSG3/QCTWK2 3 55,932,542 A/G AGTCCGGACGCAAATGGCTGAa/g CGCTGCAGCGCGATTCATGATG TP83433-KASP3 QCTSG3/QCTWK2 3 55,932,542 A/G CGGATTTTTGCGGTTGGATGTt/c ACCAAAGCCTACGCTCCTGAC TP48420-KASP2 QCTSG2 1 8,390,517 C/G CACGGAAGACAAACCGTAATTCCc/g CGCCTCCGTTCTTTGGTAAGTCGTT TP48420-KASP3 QCTSG2 1 8,390,517 C/G GTGATAAAAAGGGTCCAGCGAc/g CCAGAAATAATTCCACGGCC TP48420-KASP4 QCTSG2 1 8,390,517 C/G GTGATAAAAAGGGTCCAGCGAc/g CGAAAGCAACGTCTGGTACTG TP4427-KASP2 QCTSG2 1 8,174,024 C/T CACCACCACGTAGCTCCCc/t CAGACCGGAACTGACAAAACTCGC TP21857-KASP1 QCTSG1/QCTWK1 9 16,588,718 A/G GCCCGGAAGAGCTAGCGCTt/c TCAAGTGCCTGGAGACGAGAG TP21857-KASP3 QCTSG1/QCTWK1 9 16,588,718 A/G GGCCCGGAAGAGCTAGCGCTt/c AGATGTTCACGTGGGGCACGT TP12397-KASP3 QCTSG3/QCTWK2 3 54,083,563 A/G AGCACCACGTTGTGCTCGGAc/t GCTTCAACGAGAGCCTGCTCT TP12397-KASP5 QCTSG3/QCTWK2 3 54,083,563 A/G AGCACCACGTTGTGCTCGGAc/t TCCGTGGCCATACTCTTGGATC a Markers were designed based on the SNP sequences published in Yu et al.[10]. Multiple primer pairs were designed for each SNP. b The designed KASP markers are located within the QTL regions identified by Yu et al.[10]. c The last two letters separated by a backslash are the SNP. 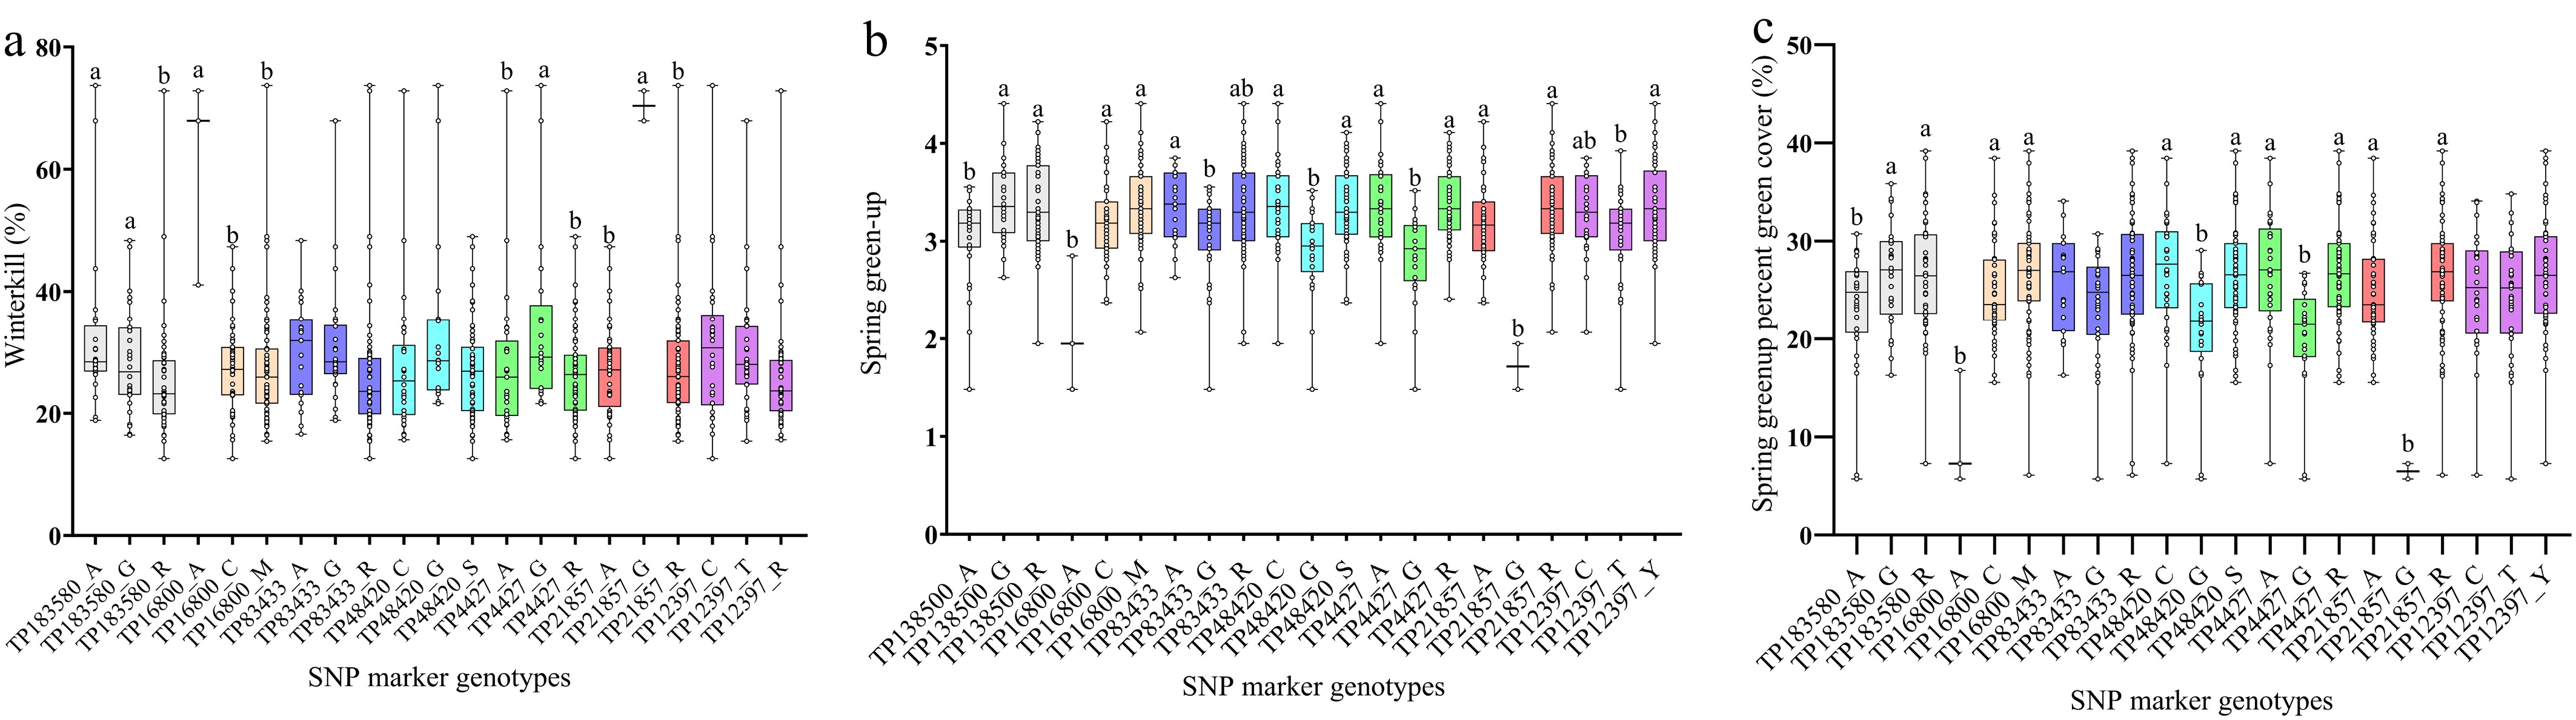
Figure 1.
Phenotype analysis of SNP markers for winterkill (a), spring green-up (b), and spring green-up percent green cover (c) based on the winter hardiness data reported by Yu et al.[10]. The x-axis is the SNP marker alleles, and the y-axis is the mean phenotype of each trait. Dots in bars indicate the phenotypical value of plants. Within each SNP marker, different letters indicate that the mean phenotypical values of each allele type are significantly different at the 0.05 probability level according to a pairwise t-test.
Genomic prediction
-
Three SNP marker datasets were utilized for GS. The dataset without quality control had 19,460 SNPs, and 19,298 were aligned to the reference genome. The second dataset had 609 SNPs, and 597 were aligned to the reference genome. The third dataset had 153 SNPs, and 148 were aligned to the reference genome and distributed across the genome with larger gaps (Supplementary Fig. S2). Using GBLUP, a wide range of prediction accuracies were observed for winterkill, spring green-up, and SGPGC using fivefold cross-validation and LOOCV (Table 2, Supplementary Figs. S3, S4). The prediction accuracies of winterkill were low (−0.10 to 0.14), and the accuracy increased with improvements in the quality of the markers (Table 2). The prediction accuracy of using LOOCV was negative using the datasets with 19K and 153 SNPs. Prediction accuracies were higher for spring green-up and SGPGC (0.18–0.43). Compared with digital image analysis, prediction accuracies for spring green-up were higher for visually rated data. In addition, for LOOCV, the prediction accuracies were lower than those of fivefold cross-validation across all datasets. Unlike winterkill, the higher prediction accuracy for spring green-up and SGPGC was achieved using higher numbers of markers. For the RF model, prediction accuracies ranged from 0.22 to 0.56 (Table 2, Supplementary Figs. S5, S6). Unlike GBLUP, the prediction accuracies for winterkill were significantly increased, especially when using a smaller number of markers. However, for SGPGC, the prediction accuracies decreased when using fewer markers. Generally, prediction accuracies were higher using LOOCV in the RF model, but in the GBLUP model, higher prediction accuracies were achieved using fivefold cross-validation among all winter hardiness traits.
Table 2. Genomic prediction accuracies for winter hardiness measured by winterkill (WK), spring green-up (SG), spring green-up percent green cover (SGPGC) using genomic best linear unbiased prediction (GBLUP) and random forest (RF) models, based on three marker datasets.
Dataseta Traitb Cross-validationc GBLUP RF 19K WK Fivefold 0.11 ± 0.06 0.24 ± 0.06 LOO −0.10 0.22 SG Fivefold 0.43 ± 0.04 0.48 ± 0.06 LOO 0.43 0.52 SGPGC Fivefold 0.29 ± 0.05 0.38 ± 0.06 LOO 0.25 0.42 609 WK Fivefold 0.14 ± 0.06 0.35 ± 0.05 LOO 0.00 0.37 SG Fivefold 0.43 ± 0.04 0.50 ± 0.05 LOO 0.43 0.56 SGPGC Fivefold 0.30 ± 0.05 0.39 ± 0.05 LOO 0.26 0.42 153 WK Fivefold 0.13 ± 0.05 0.47 ± 0.04 LOO −0.06 0.53 SG Fivefold 0.36 ± 0.04 0.37 ± 0.05 LOO 0.35 0.35 SGPGC Fivefold 0.23 ± 0.05 0.30 ± 0.05 LOO 0.18 0.30 a Three datasets represent low, medium, and high-quality SNP markers that comprise 19,460, 609, and 153 SNPs, respectively. b Winterkill was visually rated on a scale from 0% to 100%, where 0 = no winterkill and 100% = complete winterkill. Spring green-up was visually rated on a scale from 1 to 9 where 1 = dormant turf and 9 = fully green turf. Spring green-up percent green cover measured by digital image analysis, calculating the percentage of live cover on a scale from 0% to 100%, where 0% = no green cover and 100% = the whole plot is green. All data are derived from Yu et al.[10]. c Fivefold and leave-one-out (LOO) cross-validation was used to determine the predictive accuracy. -
An uncertain climate poses threats to turfgrass management and creates demand for developing more climate-resilient turfgrass cultivars. There is a demand for breeding winter-hardy bermudagrasses to be utilized in the transitional climatic zone. Phenotypic selection for spring green-up and winterkill has been most commonly used for improving winter hardiness. Though effective, this selection method is time-consuming, requiring multiple selection cycles to achieve significant genetic gains. Yu et al.[50] reported that the genetic gain from the last decade of breeding for early spring green-up (the most important indicator of winter hardiness) was 12% compared with the long-term industry standard Tifway, which was released in the 1960s, indicating the low genetic gain for improving winter hardiness in bermudagrass. The expeditious emergence of DNA sequencing technology has allowed the development of several DNA marker-based genotyping systems and the development and implementation of GS models in plant breeding[51]. This breakthrough allows plant breeders to select plants on the basis of their genetic and genomic compositions rather than solely on their phenotypic performance, which is prone to several limitations in selection efficiency and intensity. In this study, we developed KASP markers closely linked to winter hardiness QTL and investigated the potential of integrating GS for predictive breeding and selection for winter-hardy African bermudagrass.
Marker-assisted selection has become an increasingly popular and powerful tool for the genetic improvement of major crops. With the rapid development of genotyping and phenotyping techniques, more than 4,000 primers have been designed and validated for genotyping applications in rice[52]. In bermudagrass, SSRs are the most widely used marker system. Several labs have developed SSR markers that can accurately genotype bermudagrasses, assess populations' genetic diversity, and construct linkage maps[17,18,53]. Although SSR-based QTL mappings have been reported for establishment rate and morphological traits in common bermudagrass[18,53], the relatively large marker intervals and incomplete genome coverage have limited their utility. Consequently, no SSR markers from these studies are sufficiently reliable for MAS. Bermudagrass breeders urgently seek a new marker system for crop improvement. In this study, the successful development of trait-linked KASP provides an example of deploying favorable winter hardiness QTL alleles in MAS for improving winter hardiness in African bermudagrass. The first discovery of winter hardiness QTL was derived from the S1 African bermudagrass population. However, the QTL regions were large, primarily because of the high environmental variance of winter hardiness and inconsistent marker density, complicating the selection of markers for development[10]. Using the transcriptomic approach, several genes within these QTL regions were found to be differentially expressed under cold acclimation conditions[19]. TP183580-KASP1 was designed on the basis of a high-quality SNP (with high read depth for each individual), which was 304 bp away from the selected gene evm.TU.LG03.4609 and annotated as an ethylene-responsive transcription factor[19]. The other KASP markers developed in this region were based on the SNPs with peak LOD values in the QTL analysis using individual years' data. The accuracy of TP183580-KASP1 is higher than other sets of KASP markers in this region (Fig. 1), suggesting that combining QTL mapping and transcriptomic approaches is more effective in determining the candidate genes and developing KASP markers linked to the gene. Besides the marker accuracy, the success rate of converting SNPs to diagnostic KASP is low (8.3%). Primer pair design is a critical step in developing KASP assays, often determining its ultimate success or failure. We have compared our manually designed primers with primers designed by Primer 3.0 (
http://bioinfo.ut.ee/primer3-0.4.0 ), and most of the primers overlapped with only a few base pairs mismatching. We observed that some SNPs can be more easily converted to KASP markers than other SNPs. It is likely that the genomic redundancies and specific genotypes that are different from the reference genome create inherent difficulties in converting sequencing-based SNPs to KASP. Further investigations using Sanger sequencing are needed to understand why certain SNPs are difficult to convert to KASP markers, and why some KASP markers cannot correctly genotype plants.TP183580, TP16800, and TP48420 were three SNPs that were found to be very effective in selecting winter-hardy African bermudagrasses from the OKC1163 population. These markers can be used individually and together in MAS to improve selection efficiency for winter hardiness. Clearly, allele A of TP183580 and TP16800 and allele G of TP21857 would be the genotypes to avoid in future MAS. African bermudagrass has been extensively used in crossing with common bermudagrass to create hybrid bermudagrass. The ideal KASPs need to genotype hybrid bermudagrass, especially to differentiate its subgenomes. Hybrid bermudagrass has one chromosome from African bermudagrass, and common bermudagrass is an allotetraploid species with one genome that shows higher similarity to African bermudagrass[54,55]. Therefore, future work is needed to ensure the KASP design uses genome-specific markers based on these three SNPs to differentiate the alleles on each subgenome of hybrid bermudagrass. More genetic dissection work is needed for bermudagrass, especially common bermudagrass, because of its substantial variation in winter hardiness[56]. However, genetic resources associated with winter hardiness for common bermudagrass are largely underexplored. Thus far, only Yu et al.[57] have reported nine spring green-up QTL for common bermudagrass, providing a foundation to develop KASP markers in MAS for improving bermudagrass. In addition, no scientific evidence is available to show how alleles from African bermudagrass and common bermudagrass affect the winter hardiness of hybrid bermudagrass. The development of genome-specific KASP markers could provide genetic insight into how genome composition affects the performance of hybrid bermudagrass and benefits bermudagrass breeding.
Genomic prediction in this study has demonstrated sufficient accuracy to justify implementing GS for boosting the rate of genetic gain in breeding winter-hardy African bermudagrass. Using genotypic and phenotypic data from the OKC1163 S1 population, the highest prediction accuracy was 0.53 for winterkill, 0.56 for spring green-up, and 0.42 for SGPGC. The prediction accuracies were moderate for winter hardiness traits. Tihou et al.[58] reported that the prediction ability for switchgrass (Panicum virgatum L.) winter survival was 0.52 using within-family and 0.72 using progeny-based cross-validation methods. In addition, Poudel et al.[59] found that the prediction accuracy of lowland switchgrass winter survival ranged from 0.02 to 0.91. Cao et al.[60] reported that the prediction accuracy of chilling tolerance in maize at the germination stage was 0.44, whereas the prediction accuracy for cold tolerance in wheat was 0.83[61]. The lower prediction accuracy for African bermudagrass may be caused by factors such as lower heritability for winter hardiness, marker density, population diversity and size, and GS models.
The heritability for winter hardiness in this population ranged from 0.36 (spring green-up) to 0.54 (winterkill)[10]. The heritability for winter hardiness varies among different populations and experimental setups. In a study that evaluated the spring green-up of 34 elite bermudagrass genotypes for 3 years at eight southern US locations, the reliability of spring green-up was high at 0.8[50]. However, when subjected to more severe low-temperature stress in winter and drought stress in summer, spring green-up's reliability decreased to 0.13[11]. The relatively low heritability for winter hardiness in African bermudagrass may decrease genomic prediction accuracy. On the other hand, low-heritability traits and smaller marker effects are more suitable for genomic prediction because high-heritability (less complex) traits can be predicted by a few markers with large effects[51]. Besides heritability, the population size also positively influences prediction accuracy. This study used a selfed population from OKC1163. Because of the severe seed shattering and self-depression in African bermudagrass, the relatively low number of plants in this population limited the size of the training population. We observed substantial variations in prediction accuracy in each iteration of fivefold cross-validation (Supplementary Figs. S3, S5), indicating that optimization of the training population could increase the prediction accuracy but was limited by the population size in this study. It has been documented that the training population should include individuals with diverse genetic backgrounds to encompass a broad range of allelic variation for the traits of interest to capture the genetic effects and make reliable predictions[62]. Since OKC1163 is a winter-hardy African bermudagrass, the genetic relatedness of these segregated individuals in the population could skew the prediction accuracy towards improved prediction. However, increasing the diversity with non-winter-hardy individuals that are genetically distant from the winter-hardy training population would negatively affect the prediction accuracy[63]. African bermudagrass has not been widely domesticated and improved for turfgrass usage, so little information is available regarding genetic diversity in this species. Future studies with larger diverse panel populations conducted in diverse climatic conditions are needed to understand the relationship among climatic conditions, heritability, and prediction accuracy in African bermudagrass.
In this study, the density and distribution of markers affect prediction accuracy. In outcrossing crops, the linkage disequilibrium decays rapidly, which requires highly dense SNP markers, especially markers contributing to QTL to achieve optimum prediction accuracy[64]. Selecting optimal subsets of markers for specific traits has been a promising approach to increase the accuracy in GS[65]. Filho et al.[66] found that higher prediction accuracy could be achieved using a smaller subset of highly significant markers from a GWAS study. In this study, three subsets of markers with different quality were used for genomic prediction. The lowest prediction accuracy was observed using an unfiltered low-quality dataset with a large number of SNPs for WK under GBLUP model. However, using this dataset, the highest SGPGC prediction accuracy was observed using GBLUP model. Generally, there is a slight increase in prediction accuracy using the medium quality marker subset. We filtered the SNP dataset using a less stringent criterion but removed all SNP with missing genotype compared with the marker subset for linkage analysis[48]. This medium-quality marker subset with 49% of SNPs in the linkage map likely had SNPs located within the previously identified QTL region. There is a slight decrease in prediction accuracy using the high-quality dataset, likely to be due to more SNPs within the QTL interval being removed. Our results are generally consistent with the previous finding that optimizing marker density and selecting optimal subset of markers are beneficial to increase the prediction accuracy[65,67].
In this study, we utilized two genomic selection models, GBLUP and RF, showing different prediction performance. Using GBLUP, the prediction accuracy for spring green-up was higher than for WK, suggesting that for winter hardiness, a trait-specific prediction model should be used to achieve the highest prediction accuracy. As a benchmark model for GS, GBLUP generates precise estimates of breeding values, particularly for traits governed primarily by additive genetic effects[22]. The higher prediction accuracy may be due to the QTL associated with spring green-up showing more additive genetic effects while the previous reported QTL for WK showed more dominant genetic effects[10]. Using the RF model, a trend of increased prediction accuracy was observed, especially outperforming GBLUP in WK prediction. Similar observations were reported by Montesinos-López et al.[22] that ML-based models generally perform better than GBLUP in prediction accuracy. The superior ranking accuracy of ML demonstrates its enhanced ability to model complex, nonlinear genomic interactions and detect subtle patterns that conventional methods like GBLUP often miss. In the last 20 years, more than 37 GS models have been developed, and more models are being proposed to improve the accuracy[51,68]. According to the 'no-free-lunch' theorem, no single statistical machine-learning model can be superior to other available algorithms, and the highest possible prediction accuracy should be verified by empirical research[69]. More GS models should be tested for more complex traits in African bermudagrass for more accurate prediction.
-
The results of this study highlight the development and implementation of MAS and GS in selecting superior winter-hardy African bermudagrass. On the basis of the QTL mapping and transcriptomic results, KASP markers linked to seven genomic regions were developed that differentiate winter-hardy and winter-sensitive African bermudagrass genotypes. In addition, low to moderate prediction accuracies of two GS models for three winter hardiness traits were observed. GBLUP performed poorly for predicting winterkill. Generally, RF slightly outperformed GBLUP for most traits studied. Greater prediction accuracies can be obtained with a larger population size, moderate marker densities, and different validation methods, depending on the model and trait. The results obtained in this study suggest the potential application of MAS and GS for winter hardiness in breeding African bermudagrass in order to increase genetic gain, reduce phenotyping costs, and, more importantly, to speed up cultivar development.
-
The authors confirm their contributions to the paper as follows: conceptualization, data curation, formal analysis, funding acquisition, investigation, methodology, software, validation, visualization, writing − original draft: Yu S; investigation, methodology, software, writing − review and editing: Shi Z; methodology, software, writing − review and editing: Aoun M; conceptualization, writing − review and editing: Xiang M; conceptualization, funding acquisition, resources, writing − review and editing: Wu Y; methodology, software, writing − review and editing: Fang T; conceptualization, writing − review and editing: Fontanier C; formal analysis, software, visualization, writing − review and editing: Prakash LPY. All authors reviewed the results and approved the final version of the manuscript.
-
The raw data and R/Python scripts supporting the findings of this study are available from the corresponding author upon reasonable request.
-
This work was partially supported by the Oklahoma State University Turfgrass Royalty Funds and the Oklahoma Agricultural Experimental Station.
-
The authors declare no conflicts of interest.
-
accompanies this paper online at: https://doi.org/10.48130/grares-0026-0007.
- Supplementary Fig. S1 Allele distributions of a set of 23 randomly selected African bermudagrass genotypes from OKC1163 S1 population and a water at kompetitive allele specific polymorphic (KASP) marker TP183580_KASP1 (a), TP16800_KASP1 (b), TP83433_KASP1 (c), TP83433_KASP3 (d), TP48420_KASP2 (e), TP48420_KASP3 (f), TP21857_KASP1 (g), and TP12397_KASP5 (h). Red dot, blue dot, green dot, and black check mark 'X' represents homozygous allele 1, homozygous allele 2, heterozygous allele and undetermined allele, respectively.
- Supplementary Fig. S2 Density and distribution of 19,460 (a), 609 (b), and 153 (c) SNP markers from 3 datasets based on different filter standard used for genomic selection based on African bermudagrass reference genome.
- Supplementary Fig. S3 Prediction accuracy of spring green-up using genomic best linear unbiased prediction genomic selection model and 5-fold cross validation based on 19K (a), 609 (b), and 153 (c) SNP markers, spring green-up percent green cover based on 19K (d), 609 (e), and 153 (f) SNP markers, and winterkill based on 19K (g), 609 (h), and 153 (i) SNP markers. Left side of image is the distribution of prediction accuracy of each replication. Right side of image is the distribution of root mean square error (RMSE) of each replication. Red dash line is the mean of prediction accuracy and RMSE of 100 replications.
- Supplementary Fig. S4 Scatter plots of predicted and actual value, prediction accuracy based on Spearman correlation, and root mean square error of winterkill using genomic best linear unbiased prediction genomic selection model and leave-one-out cross validation based on 19K (a), 609 (b), and 153 (c) SNP markers, spring green-up based on 19K (d), 609 (e), and 153 (f) SNP markers, and spring green-up percent green cover based on 19K (g), 609 (h), and 153 (i) SNP markers.
- Supplementary Fig. S5 Prediction accuracy of spring green-up using random forest genomic selection model and 5-fold cross validation based on 19K (a), 609 (b), and 153 (c) SNP markers, spring green-up percent green cover based on 19K (d), 609 (e), and 153 (f) SNP markers, and winterkill based on 19K (g), 609 (h), and 153 (i) SNP markers. Left side of image is the distribution of prediction accuracy of each replication. Right side of image is the distribution of root mean square error (RMSE) of each replication. Red dash line is the mean of prediction accuracy and RMSE of 100 replications.
- Supplementary Fig. S6 Scatter plots of predicted and actual value, prediction accuracy based on Spearman correlation, and root mean square error of winterkill using random forest genomic selection model and leave-one-out cross validation based on 19K (a), 609 (b), and 153 (c) SNP markers, spring green-up based on 19K (d), 609 (e), and 153 (f) SNP markers, and spring green-up percent green cover based on 19K (g), 609 (h), and 153 (i) SNP markers.
- Copyright: © 2026 by the author(s). Published by Maximum Academic Press, Fayetteville, GA. This article is an open access article distributed under Creative Commons Attribution License (CC BY 4.0), visit https://creativecommons.org/licenses/by/4.0/.
-
About this article
Cite this article
Yu S, Shi Z, Aoun M, Xiang M, Wu Y, et al. 2026. Development of kompetitive allele-specific polymerase chain reaction markers and genomic prediction for winter hardiness in African bermudagrass. Grass Research 6: e010 doi: 10.48130/grares-0026-0007 

Development of kompetitive allele-specific polymerase chain reaction markers and genomic prediction for winter hardiness in African bermudagrass
- Received: 15 December 2025
- Revised: 29 January 2026
- Accepted: 17 March 2026
- Published online: 06 May 2026
Abstract: Identification of winter hardy turf-type bermudagrass solely relies on phenotypic selection. Although effective, this method takes multiple years of field evaluation before we can reliably select superior genotypes. More efficient and precise selection methods are needed by breeding programs. African bermudagrass (Cynodon transvaalensis Burtt-Davy) has shown variations in winter hardiness and is routinely used for the development of turf-type interspecific hybrid cultivars (C. dactylon × C. transvaalensis). The objectives of this study were to develop kompetitive-allele specific polymerase chain reaction (KASP) markers linked to winter hardiness quantitative trait loci (QTL) and to implement genomic prediction for winter hardiness in African bermudagrass. On the basis of previous genomic information associated with winter hardiness, seven KASP markers linked to winter hardiness traits were developed and validated from three previously identified QTL regions. In addition, through the use of traditional genomic best linear unbiased prediction and machine learning-based random forest selection models, the highest prediction accuracy was 0.52 for winterkill, 0.50 for spring green-up, and 0.40 for spring green-up percent green cover. This study is the first report of polymerase chain reaction (PCR)-based, closely trait-linked molecular marker development and genomic selection in African bermudagrass, providing a foundation for the implementation of advanced methods for improving the selection accuracy and efficiency in winter hardiness improvement of African bermudagrass.
-
Key words:
- Marker-assisted selection /
- Genomic selection /
- Winter hardiness /
- Bermudagrass