













-
Phosphorus (P) is an indispensable macronutrient for plants' growth and development, as it plays a central role in key physiological processes such as carbohydrate metabolism, protein metabolism, and lipid metabolism, and also significantly influences plants' stress resistance and crop yield[1]. However, the availability of phosphorus in soils is generally low; most phosphorus exists in organic forms or as insoluble calcium phosphate, iron phosphate, and aluminum phosphate, which are difficult for plants to utilize directly[2]. This limitation stems from the uneven distribution, high fixation rate, and slow diffusion of inorganic phosphate (Pi) in soils, making it a major factor restricting crop growth[3]. To address this challenge of low soil P availability, plants have evolved a variety of adaptive strategies to improve their phosphorus use efficiency, including modifying the root architecture, excreting organic acids, and inducing the secretion of acid phosphatases[1]. The expression and activity of acid phosphatases, which are hydrolases catalyzing the hydrolysis of orthophosphoric monoesters to release inorganic phosphorus, are significantly enhanced under phosphorus deficiency, serving as a key adaptive mechanism for plants to maintain growth and optimize phosphorus uptake and utilization efficiency[4,5]. Purple acid phosphatases (PAPs), key metallophosphatases, feature a highly conserved active center with a binuclear metal ion pair (typically Fe3+–Zn2+ or Fe3+–Mn2+ in plants) and five motifs comprising seven metal-binding residues that are essential for catalysis[6]. Under acidic conditions (pH 4.0–7.0), PAPs exhibit broad substrate specificity and can hydrolyze various phosphoesters (e.g., adenosine triphosphate, sugar phosphates, phytic acid) and are strongly induced under phosphorus-deficient conditions in plants, promoting the mineralization and reuse of organic phosphorus[7]. They play a key role in phosphorus acquisition and recycling under phosphorus starvation[8].
To date, the PAP gene family has been identified in a variety of plants, including 29 members in Arabidopsis thaliana[9], 26 in rice (Oryza sativa)[10], 38 in soybean (Glycine max)[11], 33 in maize (Zea mays)[12], 105 in wheat (Triticum aestivum)[13], 25 in tomato (Solanum lycopersicum)[14], 19 in tea plant (Camellia sinensis)[15], 31 in apple (Malus pumila)[16], 17 in moso bamboo (Phyllostachys edulis)[17], and 29 in potato (Solanum tuberosum)[18]. According to their structure and function, most plant PAPs can be divided into three major subfamilies: Subfamily Ia (secretory, e.g., AtPAP12 and AtPAP26, involved in extracellular hydrolysis of organic phosphorus), Subfamily Ib (phytase activity, e.g., GmPAP14 and OsPAP15, decomposing phytic acid to release phosphorus), and Subfamily IIIb (low molecular weight, with unclear functions)[9,11]. Studies have shown that PAPs respond to phosphorus starvation, for instance, AtPAP10 promotes root phosphorus uptake, whereas AtPAP26 regulates phosphorus remobilization in senescent leaves[19]. Some PAPs (e.g., SlPAP1 in tomato) exhibit tissue-specific expression, which also suggests their regulatory roles at different plant developmental stages[20].
Furthermore, studies have highlighted the role of PAP genes in responding to various abiotic stresses such as salt, alkalinity, drought, and cold[5,19,21]. Specifically, under salt stress, the overexpression of AtPAP genes (e.g., AtPAP10, AtPAP17, AtPAP26) enhances tolerance in A. thaliana by improving phosphorus metabolism and reinforcing antioxidant defenses and ion homeostasis[9,22]. Under alkaline stress, rice OsPPa6, a PAP family homolog, is markedly upregulated, and its mutation leads to decreased proline content and an increased Na+/K+ ratio, significantly impairing alkaline tolerance[23]. Under drought stress, the expression of ZmPAP26b in maize decreases, exhibiting a negative regulatory pattern[24], although most PAP genes in apple leaves and roots are significantly upregulated[16]. Under cold stress, studies on wheat (TaPAPs) and potato (StPAPs) have highlighted the critical role of PAP genes in cold stress responses, with the potato study specifically identifying StPAP12 and abscisic acid as key regulators[13]. Collectively, these findings underscore the pivotal role of PAP genes in plants' adaptation to diverse abiotic stresses.
Alfalfa (Medicago sativa), a perennial leguminous crop native to the Mediterranean region and southwestern Asia, is currently widely cultivated worldwide and is known as the "king of forages"[25]. As an important forage crop, alfalfa has high nutritional value and significant economic benefits, and also possesses multiple ecological functions such as nitrogen fixation, soil improvement, and salt reduction, occupying a crucial position in animal husbandry and sustainable agriculture[26]. Under phosphorus-deficient conditions, alfalfa exhibits abnormal root development and reduced nodule nitrogen-fixing capacity. PAPs are the core enzymes involved in its organic phosphorus utilization[27]. Studies have confirmed that under phosphorus deficiency stress, the PAP activity in alfalfa roots increases significantly[28]. Although PAP genes have been extensively studied in model plant species or crops such as A. thaliana and rice, research on PAPs in alfalfa remains scarce.
This study aimed to elucidate the genetic evolution and molecular specificity of the MsPAP gene family and to provide genetic resources for improving stress tolerance and phosphorus use efficiency in alfalfa. Through a comprehensive genomic analysis, we identified 30 MsPAP genes and systematically characterized their chromosomal locations, physicochemical properties, phylogenetic relationships, and expression profiles across various tissues as well as abiotic stresses. These findings establish an important theoretical foundation for future functional study of PAP genes in alfalfa, which lays a basis for the molecular breeding of stress-tolerant alfalfa and other plant species.
-
The plant material used for transcriptional expression analysis in this study was alfalfa (M. sativa cv. Zhongmu-4), preserved by the Forage Breeding and Cultivation Innovation Team, Institute of Animal Sciences, Chinese Academy of Agricultural Sciences. Seeds were sterilized with 75% ethanol for 5 min, rinsed five times with distilled water, and spread on Petri dishes lined with three layers of moist filter paper. After vernalization at 4 °C for 2 d, the seeds were transferred to an artificial climate chamber for germination. The culture conditions were set as follows: A light/dark cycle of 16/8 h, a day/night temperature of 26/22 °C, a relative humidity of 60%, and a light intensity of 80%. After seven days, the seedlings were transferred to a half-strength Hoagland nutrient solution for hydroponic cultivation, and the solution was replaced every four days. Four-week-old alfalfa seedlings with uniform growth were selected for the experiment. The group supplied with a modified low-P Hoagland solution (50 μmol·L−1 KH2PO4) was set as the low-P treatment, whereas the group supplied with a half-strength Hoagland nutrient solution (500 μmol·L−1 KH2PO4) was set as the control. Leaf tissues of both the control and treatment group were collected at 0 and 1 h, and 1, 3, 5, and 7 d after the start of the treatment, with each sample weighing 0.1 g and including three biological replicates. These time points were selected to capture both early signaling events (1 h) and mid-to-late physiological adaptations (1–7 d) in response to phosphate starvation). All samples were quickly frozen in liquid nitrogen and stored at −80 °C for subsequent use.
Identification of MsPAP gene family members in alfalfa
-
The reference sequences of AtPAP proteins from A. thaliana[9] and MtPAP proteins from M. truncatula[29] were used to identify candidate members of the MsPAP family in the genome of alfalfa cv. Zhongmu-1[27] using the local BLAST program of TBtools (v1.098722)[30] with an E-value threshold set to 1.0 × 10⁻⁵. The candidate members were screened further on the basis of the characteristic domain of PAP proteins. To avoid missing any members, candidate genes obtained in the preliminary screening were further validated using the Pfam (
http://pfam.xfam.org ) and SMART (http://smart.embl-heidelberg.de ) databases to confirm the presence of a complete PF00149 (PAP) domain. ClustalW multiple sequence alignment was performed to examine whether the candidate proteins contained the characteristic five conserved metal-binding motifs of the PAP family (i.e., D-X-G, G-D-X-X-Y, G-N-H-(D/E), V-X-X-H, and G-H-X-H), which constitute the core functional sites for phosphoester hydrolysis catalyzed by PAPs. In these motifs, D, G, Y, N, H, E, and V represent aspartic acid, glycine, tyrosine, asparagine, histidine, glutamic acid, and valine, respectively; X represents any amino acid residue, and D/E indicates either aspartic acid or glutamic acid.Chromosomal localization and gene structure analysis of MsPAP genes in alfalfa
-
On the basis of the genome annotation file (GFF3 format) of alfalfa, the chromosomal location of each family member and the full-length information of the chromosomes were extracted. TBtools (v1.098722) software was used to perform chromosomal localization analysis and the associated mapping, as well as for gene structure analysis and drawing the structural map. For chromosomal localization, the "Gene Location Visualize from GFF" function within TBtools (v1.098722) was used to map the physical positions of all 30 MsPAP genes onto the alfalfa chromosomes. The output image was then manually edited to clearly indicate the chromosome numbers and the scale bar (in Mb). For gene structure analysis, the "Gene Structure View (Advanced)" function in TBtools (v1.098722) was used. By uploading the GFF3 annotation file and the coding sequence (CDS) for each MsPAP gene, the software automatically generated a comparative schematic diagram illustrating the exon–intron organization (exons are shown as filled green boxes, introns as black lines) and untranslated regions (UTRs, shown as yellow boxes) for each MsPAP family member.
Prediction of the physicochemical properties, subcellular localization, and phylogenetic analysis of MsPAP proteins in alfalfa
-
The protein sequences corresponding to each MsPAP family member were extracted on the basis of their IDs (Supplementary Table S1). The EXPASY online tool (
www.expasy.org )[31] was used to analyze the physicochemical properties of the proteins, including the number of amino acids, the isoelectric point (pI), molecular weight, instability index, aliphatic index, and hydrophilicity/hydrophobicity. The Plant-mPLoc tool on the Cello website (www.csbio.sjtu.edu.cn/bioinf/plant-multi )[32] was used to predict the subcellular localization of the proteins. Multiple sequence alignment of MsPAP and outgroup proteins was performed using MUSCLE with the default parameters. The best-fit substitution model was selected using ModelTest-NG under the Bayesian information criterion (BIC). Maximum likelihood phylogenetic reconstruction was conducted using RAxML v8.2.12 with the General Time Reversible model with gamma-distributed rate heterogeneity and invariant sites (GTR + G + I) model, and node support was assessed via 1,000 bootstrap replicates. The AtPAP protein sequences were used as an outgroup for rooting the tree.Phylogenetic and collinearity analysis of MsPAP genes in alfalfa
-
PAP protein sequences of A. thaliana were obtained from the TAIR database (
www.arabidopsis.org ). These were combined with the PAP sequences of M. truncatula and alfalfa, and MEGA11 (v11.0.13)[33] software was used for sequence alignment and construction of the phylogenetic tree construction. The phylogenetic tree was visualized and optimized using the iTOL (v6) online tool (https://itol.embl.de )[34]. MCScanX (v2.0)[35] software was used to analyze the duplication events of MsPAP genes and the collinear relationships among the PAP families of alfalfa, A. thaliana, and M. truncatula. Information on gene functions and chromosomal locations was obtained using TBtools (v1.098722) software.On the basis of the MCScanX collinearity results, gene duplication events were further inferred. When two or more MsPAP genes are located in close proximity on the same chromosome (separated by ≤10 intervening genes), they are defined as tandem duplication (TD) events. When MsPAP gene pairs are located on different chromosomes or nonadjacent regions of the same chromosome but within syntenic chromosomal blocks, they are defined as segmental duplication (SD) events.
Prediction of MsPAP protein domains in alfalfa
-
Conserved motifs of MsPAP proteins were extracted using the MEME (v5.5.5) online program (
http://meme.nbcr.net/meme/intro.html ), with the parameter settings as follows: Motif width = 6−200; maximum number of motifs = 10. The 2,000-bp sequence upstream of each MsPAP gene was selected as the promoter region for prediction analysis.Acquisition and analysis of MsPAP genes' transcriptome data in alfalfa
-
Transcriptome data of MsPAP genes from six tissues (flower, leaf, elongated stem, unelongated stem, root nodule, and root) were obtained from the NCBI database (accession number: SRP055547)[36]. Adapter sequences and low-quality reads were removed using Trimmomatic (v0.39). The cleaned reads were aligned to the "Zhongmu-1" reference genome using HISAT2 (v2.2.1). Gene expression levels were quantified and normalized to fragments per kilobase million (FPKM) using featureCounts (v2.0.1). Heatmaps were generated using TBtools (v1.098722). The transcriptome data of MsPAP genes under three stress treatments (salt, drought, cold) were obtained from the NCBI database (accession numbers: SRR7091780–SRR7091794 and SRR7160313–SRR7160357)[37]. The alkaline stress experiment and the subsequent transcriptome data were derived from a previous study[38]. Specifically, 28-day-old alfalfa seedlings were subjected to an alkaline stress treatment with 50 mmol·L−1 NaHCO3, and root tissue samples collected at 0, 4, 8, 12, and 24 h after the stress treatment were used. TBtools (v1.098722) software was used to generate and analyze the gene expression heatmap.
Expression analysis of MsPAP genes in alfalfa under low-phosphorus stress
-
Alfalfa samples treated with low-P and stored at −80 °C were placed in grinding tubes and ground into powder under liquid nitrogen. Total RNA was extracted according to the instructions of the RNA extraction kit (Promega Biotechnology Co., Ltd., Beijing, China). Total RNA was reverse-transcribed into cDNA using HiScript IV All-in-One Ultra RT SuperMix for quantitative polymerase chain reaction (catalog number: R433-01, Vazyme, Nanjing, China). The reverse transcription reaction was performed following the kit instructions and the obtained cDNA was stored at −20 °C for subsequent use. Quantitative real-time polymerase chain reaction (RT-qPCR) was performed using Taq Pro Universal SYBR qPCR Master Mix (catalog number: Q712-02, Vazyme, Nanjing, China). Primers were designed for the target genes (members of the MsPAP family: MsPAP2, -9, -20, -23, -25, and -26) and the reference gene (MsActin) (Table 1) using Primer3 (v4.1.0) software. The RT-qPCR assay was performed using a Bio-Rad CFX96 system, and the cycle threshold (Ct) values were obtained and extracted. Melting-curve profiles for qPCR amplification of six MsPAP gene family members under low-P stress were shown in Supplementary File 1. The relative expression levels of genes were analyzed in accordance with the 2−ΔΔCᴛ method[39].
Table 1. Primer sequences used for RT-qPCR analysis.
Gene name Gene ID Forward primer (5'→3') Reverse primer (5'→3') MsActin MS.gene75631 CAAAAGATGGCAGATGCTGAGGAT CATGCACCAGTATGACGAGGTCG MsPAP25 MsG0880042857.01.T01 TGACTTCTGCGGCAAGCTAA AGATGCTGATCATCGAGGCG MsPAP9 MsG0380016120.01.T01 AAAAGCTTCCGTGGAAACGC ACTCTTGGGGCCTGAAACTG MsPAP2 MsG0180006046.01.T01 CAGCCTGCTCCAGAGAACAA TCCAGAGAACGCAATCCACC MsPAP26 MsG0880044980.01.T01 TGCCCAGCTGAAAACAGACT CGCCCCCATTCAACAAAAGG MsPAP20 MsG0680034704.01.T02 GACTGGGGAAGGAGAGGTGA CTGCCCCACTAACCAGGAAC MsPAP23 MsG0780041115.01.T01 ACTGCCACATTCCAACCACT CCATGAGAGCCAAACGGAGT Statistical analysis
-
Microsoft Excel was used for preliminary data calculation and analysis, and GraphPad Prism 10 software was used for statistical analysis and graphing. Two-way analysis of variance (ANOVA) was applied to analyze the combined effects of bivariate factors (low-P treatment × control) on the parameters. The significance of differences between groups was determined using Tukey's multiple comparison test. A p-value of < 0.05 was considered to be statistically significant, and the results were denoted by asterisks as follows: *, 0.01 < p ≤ 0.05; **, 0.001 < p ≤ 0.01; ***, p ≤ 0.001; ****, p ≤ 0.000, extremely significant.
-
To identify the MsPAP gene family members in alfalfa and systematically analyze the characteristics and subcellular localization of their encoded proteins, a series of bioinformatics analyses were performed on the alfalfa genome database. In total, 30 MsPAP gene family members were confirmed and identified (named MsPAP1–30), as shown in Table 2. The properties of these proteins were predicted using EXPASY software, and the results showed that the precursor proteins of MsPAP had amino acid (aa) lengths of 169−1066 aa, relative molecular weights of 18.7−120.1 kDa, pIs of 4.87−9.96, instability indices of 31.07−47.35, and aliphatic indices of 60.18−91.34. Their grand average of hydropathicity (GRAVY) values ranged from −0.829 to −0.085, indicating that all MsPAP proteins are hydrophilic. The subcellular localization of MsPAP proteins were predicted to be mainly localized in the nucleus, chloroplast, vacuole, and cytoplasm. The specific distribution is detailed as follows: 11 proteins were localized to the nucleus, 2 to the chloroplast, 6 to the vacuole, and 5 to the cytoplasm; 3 proteins were dual-localized to both the nucleus and chloroplast, 1 to both the vacuole and cytoplasm, 1 to both the nucleus and cytoskeleton, and 1 to both the nucleus and cytoplasm.
Table 2. The physicochemical characteristics of 30 members in the alfalfa MsPAP gene family.
Gene ID Gene name No. of amino acids pI Molecular weight (kDa) Instability index Aliphatic index GRAVY Subcellular localization MsG0180003365.01.T01 MsPAP1 378 5.54 43.48 38.71 70.16 −0.604 Nucleus MsG0180006046.01.T01 MsPAP2 768 6.09 89.91 45.96 60.18 −0.829 Nucleus MsG0280008275.01.T01 MsPAP3 613 5.87 70.21 47.21 81.45 −0.521 Nucleus MsG0380014130.01.T01 MsPAP4 875 6.29 99.50 40.31 79.22 −0.432 Cytoplasm MsG0380014132.01.T02 MsPAP5 394 5.71 44.54 37.1 72.94 −0.469 Chloroplast, nucleus MsG0380014132.01.T01 MsPAP6 394 5.71 44.54 37.1 72.94 −0.469 chloroplast, nucleus MsG0380015680.01.T01 MsPAP7 588 6.32 66.70 31.07 66.85 −0.445 Vacuole MsG0380015682.01.T01 MsPAP8 620 6.42 69.64 35.58 67.02 −0.416 Nucleus MsG0380016120.01.T01 MsPAP9 543 5.3 61.13 38.53 74.07 −0.31 Extracellular space MsG0380016121.01.T01 MsPAP10 194 5.87 22.35 47.35 91.34 −0.287 Cytoplasm MsG0480019730.01.T01 MsPAP11 293 9.96 34.38 46.2 85.8 −0.324 Chloroplast MsG0480019732.01.T01 MsPAP12 931 7.18 106.78 33.67 81.46 −0.25 Nucleus, cytoplasm MsG0480019733.01.T01 MsPAP13 459 6.31 53.09 35.65 67.65 −0.441 Cytoplasm, vacuole MsG0480022236.01.T01 MsPAP14 727 5.39 81.34 36.25 72.85 −0.45 Nucleus MsG0480022238.01.T01 MsPAP15 456 9.17 51.70 32.09 83.99 −0.335 Cytoplasm MsG0480022891.01.T01 MsPAP16 409 4.87 46.74 35.7 90.49 −0.179 Cytoplasm MsG0580026511.01.T01 MsPAP17 317 5.27 36.15 40.86 66.47 −0.416 Nucleus MsG0680030857.01.T01 MsPAP18 548 5.79 61.07 44.46 71.35 −0.21 Vacuole MsG0680034704.01.T01 MsPAP19 331 5.36 37.47 37.2 80.94 −0.236 Extracellular space MsG0680034704.01.T02 MsPAP20 379 5.81 42.91 35.44 82.77 −0.194 Cytoplasm MsG0780038493.01.T01 MsPAP21 506 5.03 57.51 44.81 72.59 −0.293 Chloroplast, nucleus MsG0780041108.01.T01 MsPAP22 341 6.38 38.03 37.88 87.42 −0.085 Vacuole MsG0780041115.01.T01 MsPAP23 427 5.73 47.88 44.24 73.68 −0.371 Peroxisome MsG0880042856.01.T01 MsPAP24 1,066 6.32 120.13 39.49 86.41 −0.264 Plasma membrane MsG0880042857.01.T01 MsPAP25 449 7.16 49.54 36.85 77.75 −0.262 Mitochondria MsG0880044980.01.T01 MsPAP26 615 6.26 69.24 33.97 74.21 −0.342 Chloroplast MsG0880046225.01.T01 MsPAP27 555 6.98 62.13 32.36 75.17 −0.245 vacuole MsG0880046835.01.T01 MsPAP28 169 5.4 18.70 34.77 73.2 −0.322 Nucleus, cytoskeleton MsG0880046836.01.T01 MsPAP29 479 6.68 55.38 39.9 71.19 −0.405 vacuole MsG0880046836.01.T02 MsPAP30 479 6.68 55.38 39.9 71.19 −0.405 Vacuole Chromosomal localization analysis of the MsPAP gene family in alfalfa
-
To clarify the distribution of the positions of MsPAP gene family members on the alfalfa chromosomes, a schematic diagram of the chromosomal locations of MsPAP gene family members was constructed (Fig. 1). Chromosomal localization analysis showed that the 30 genes were distributed on 8 chromosomes. The 30 genes were named MsPAP1 to MsPAP30 according to their distribution on the chromosomes. Among them, MsPAP19 and -20, MsPAP22 and -23, and MsPAP24 and -25 were paired on chromosomes 6, 7, and 8, respectively. MsPAP4-6, MsPAP7-10, MsPAP11-13, MsPAP14-16, and MsPAP27-30 were clustered with intervals between the genes (e.g., the distance between MsPAP6 and MsPAP7).
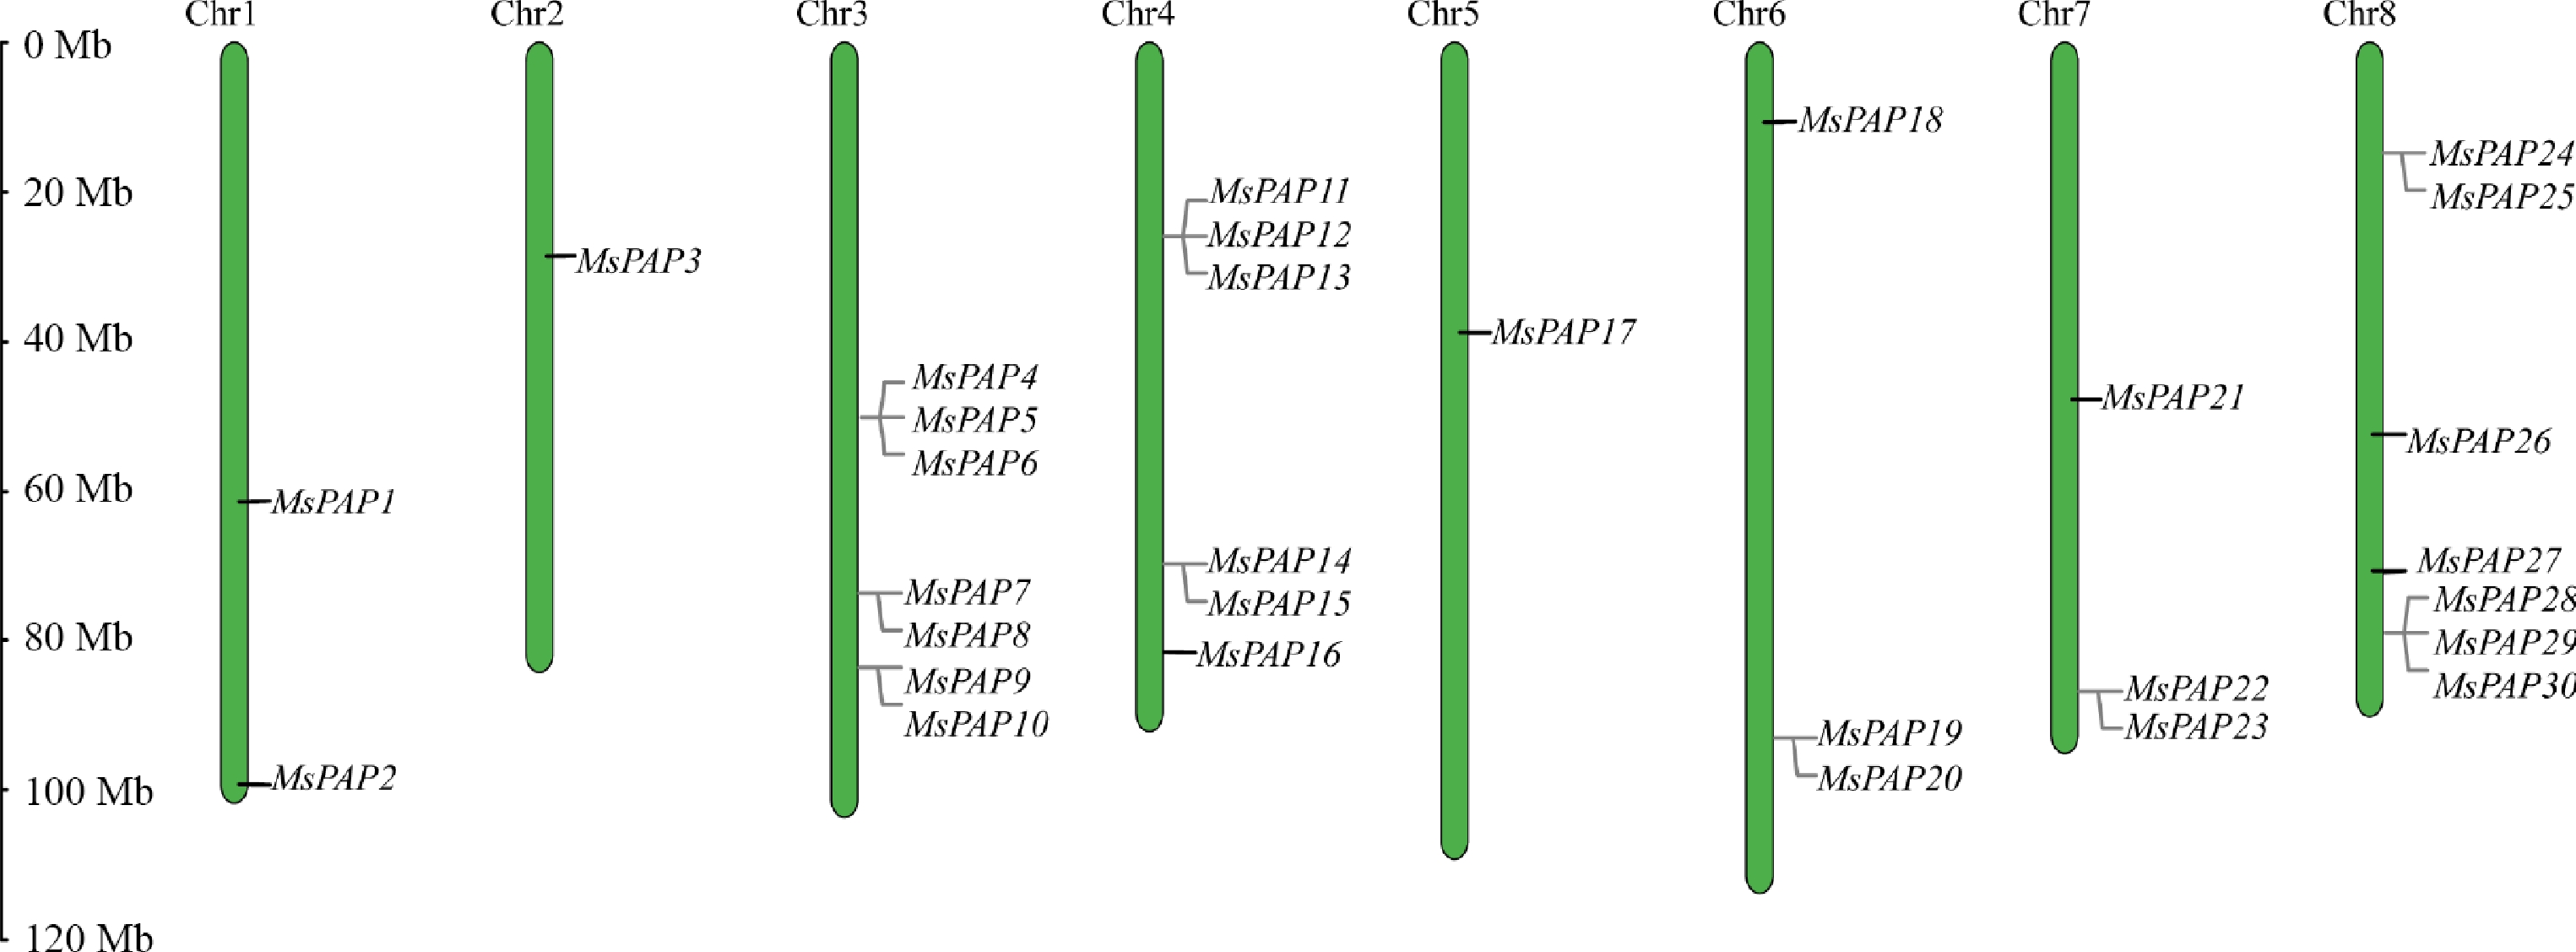
Figure 1.
The distribution of the MsPAP gene family on alfalfa chromosomes.
The chromosome localization is based on the physical location (the scale bar represents the length of alfalfa chromosomes in Mb), with the chromosome number depicted at the top of each chromosome. The names of the corresponding MsPAP genes are shown to the right of each chromosome. The bars on the chromosomes indicate the positions of the MsPAP genes.
Analysis of gene structure and conserved protein motifs of the MsPAP gene family in alfalfa
-
To characterize the structures of MsPAP genes, gene structure analysis was performed. The results showed that the exons of the MsPAP gene family ranged from 3 to 14. The exon number, length, and arrangement varied among the MsPAP gene family members, reflecting the diversity in their exon distribution and structure (Fig. 2). Prediction and analysis of the conserved motifs was conducted. In the results, 10 conserved motifs were identified and named Motifs 1−10 ranging from 21 amino acids (Motif 8/Motif 9) to 50 amino acids (Motif 5) (Fig. 3). The three most frequently occurring conserved motifs were Motifs 1, 2, and 9, which are present in 24, 23, and 21 MsPAP genes, respectively. These three motifs are highly conserved among MsPAP members, whereas Motifs 5, 6, and 7 are specifically distributed in 12, 14, and 5 MsPAP genes, respectively, reflecting the conservation and specificity of the motifs' distribution among MsPAP family members.
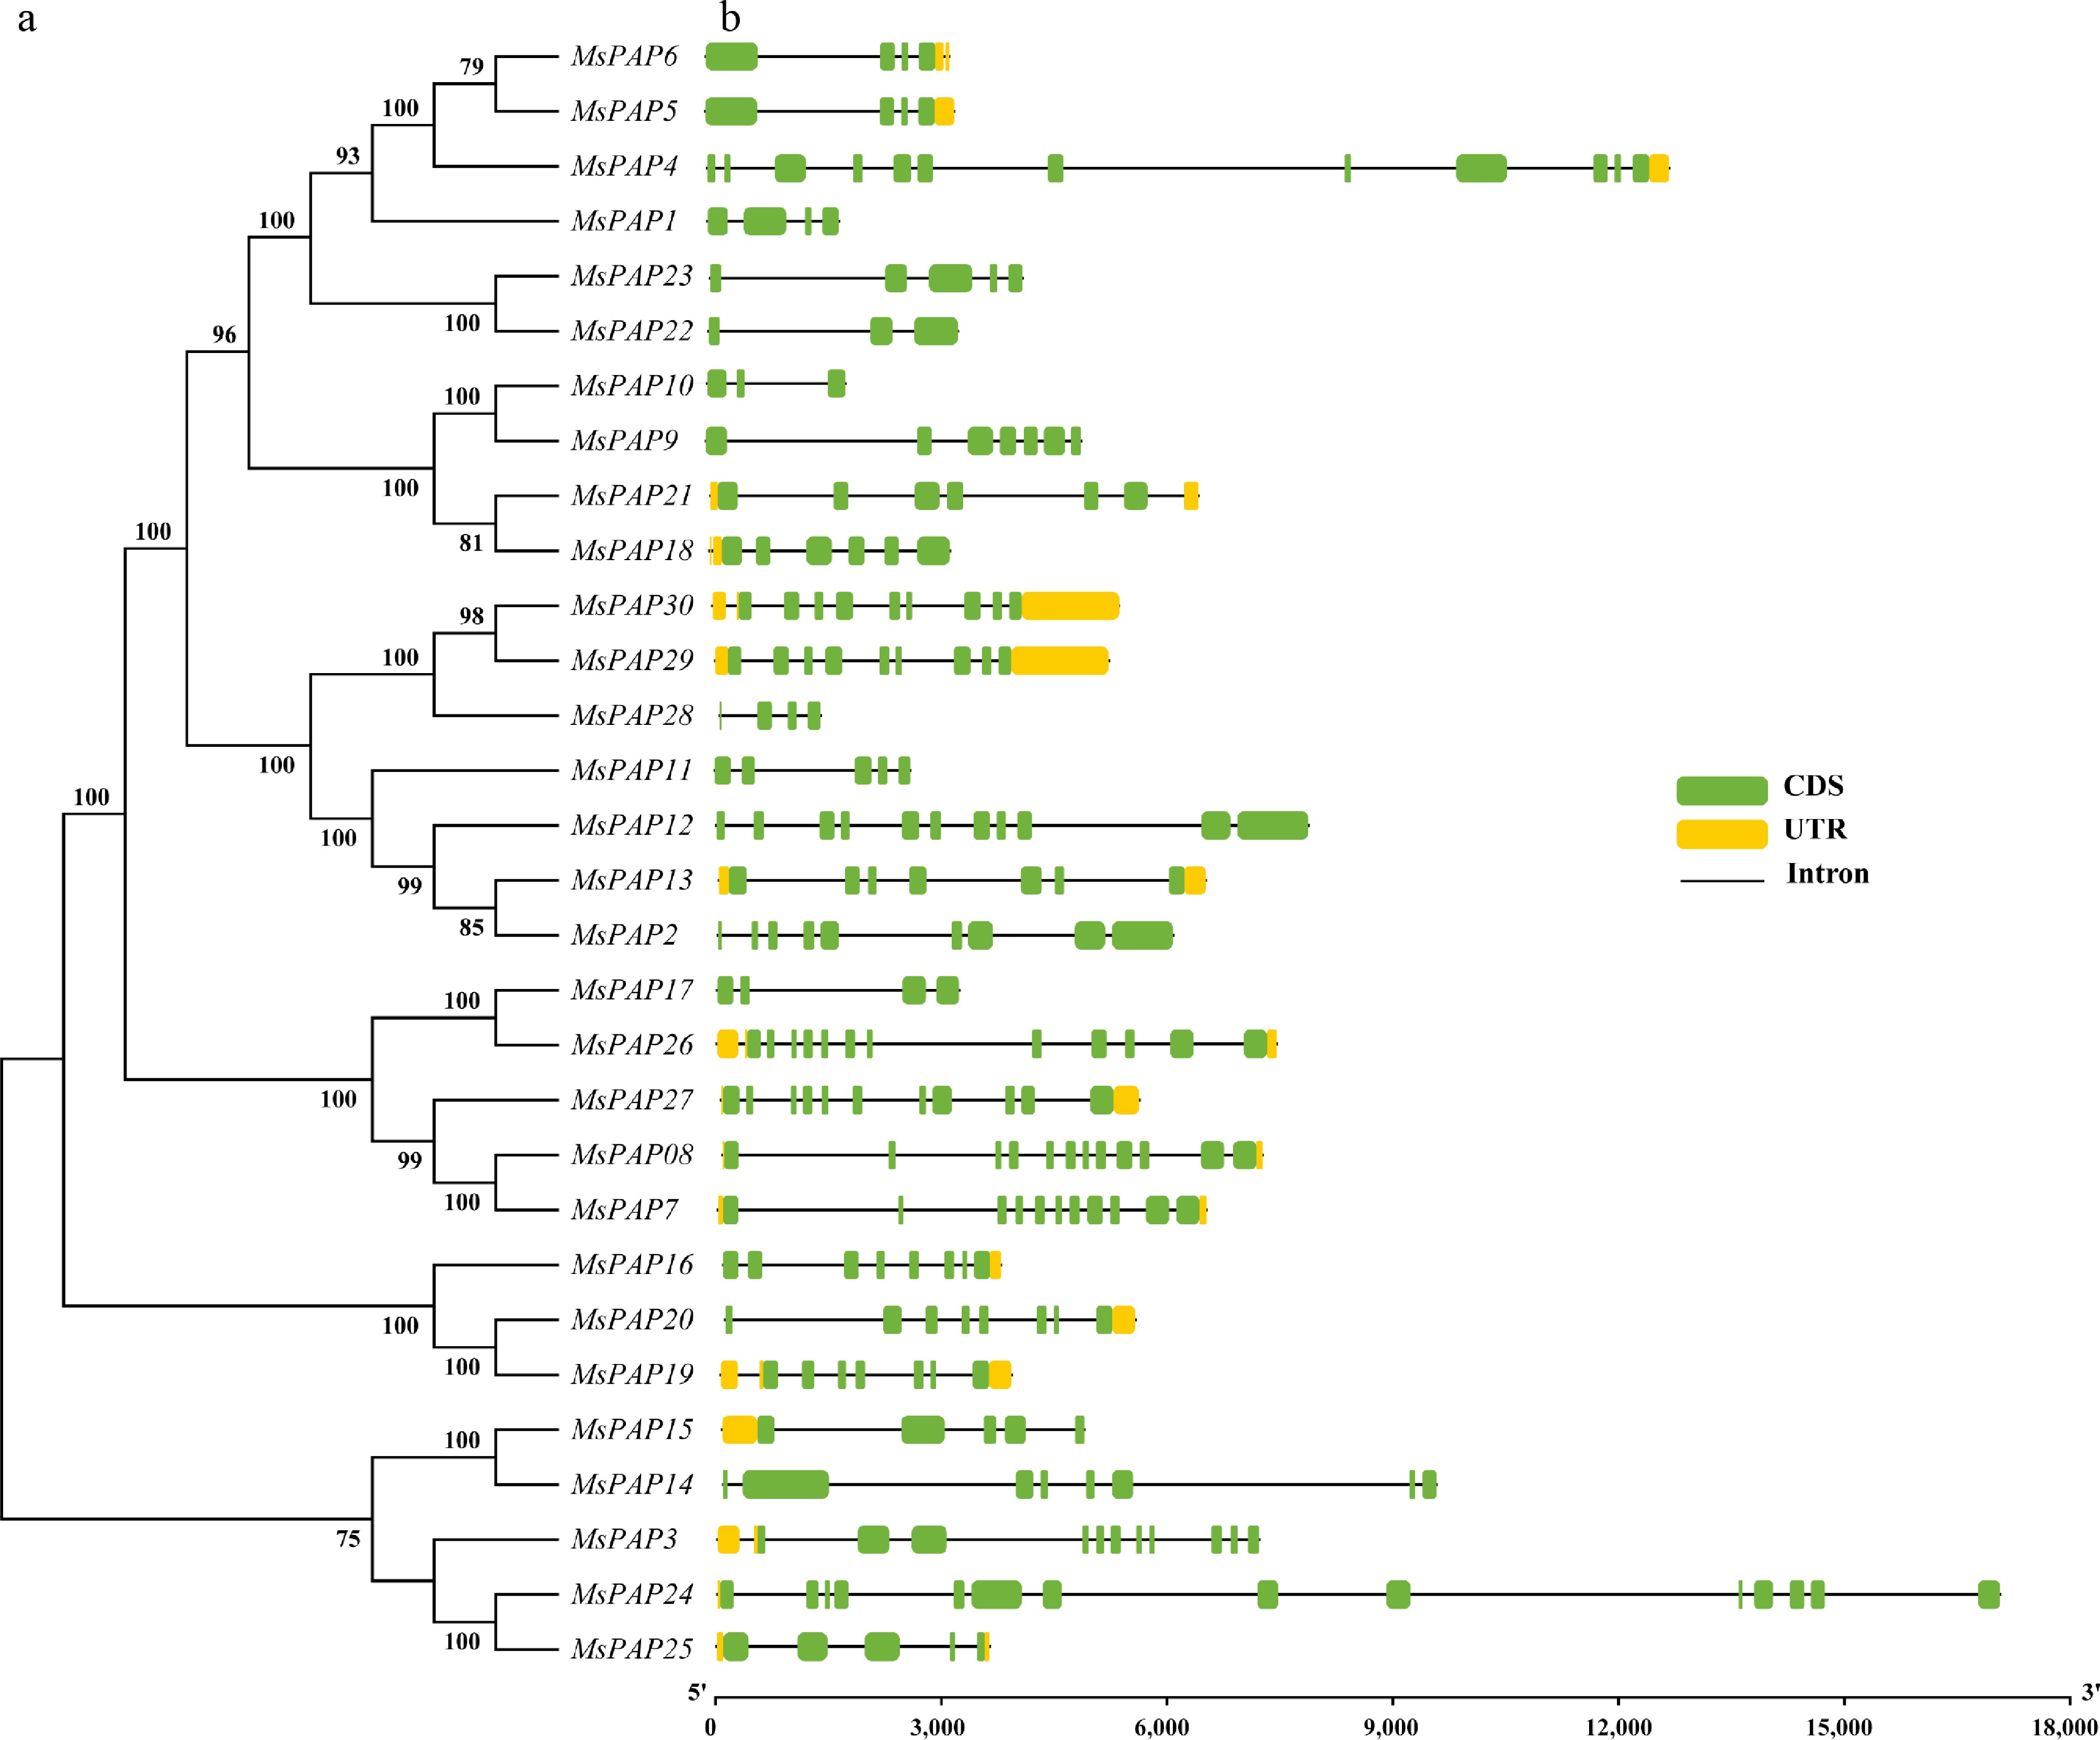
Figure 2.
Structures of MsPAP genes in alfalfa. (a) Phylogenetic tree of MsPAP proteins. (b) Schematic diagram of gene structure. Green boxes represent exons (CDS), black lines represent introns, and yellow boxes represent untranslated regions (UTRs). The lengths of exons and introns of each gene are displayed proportionally.
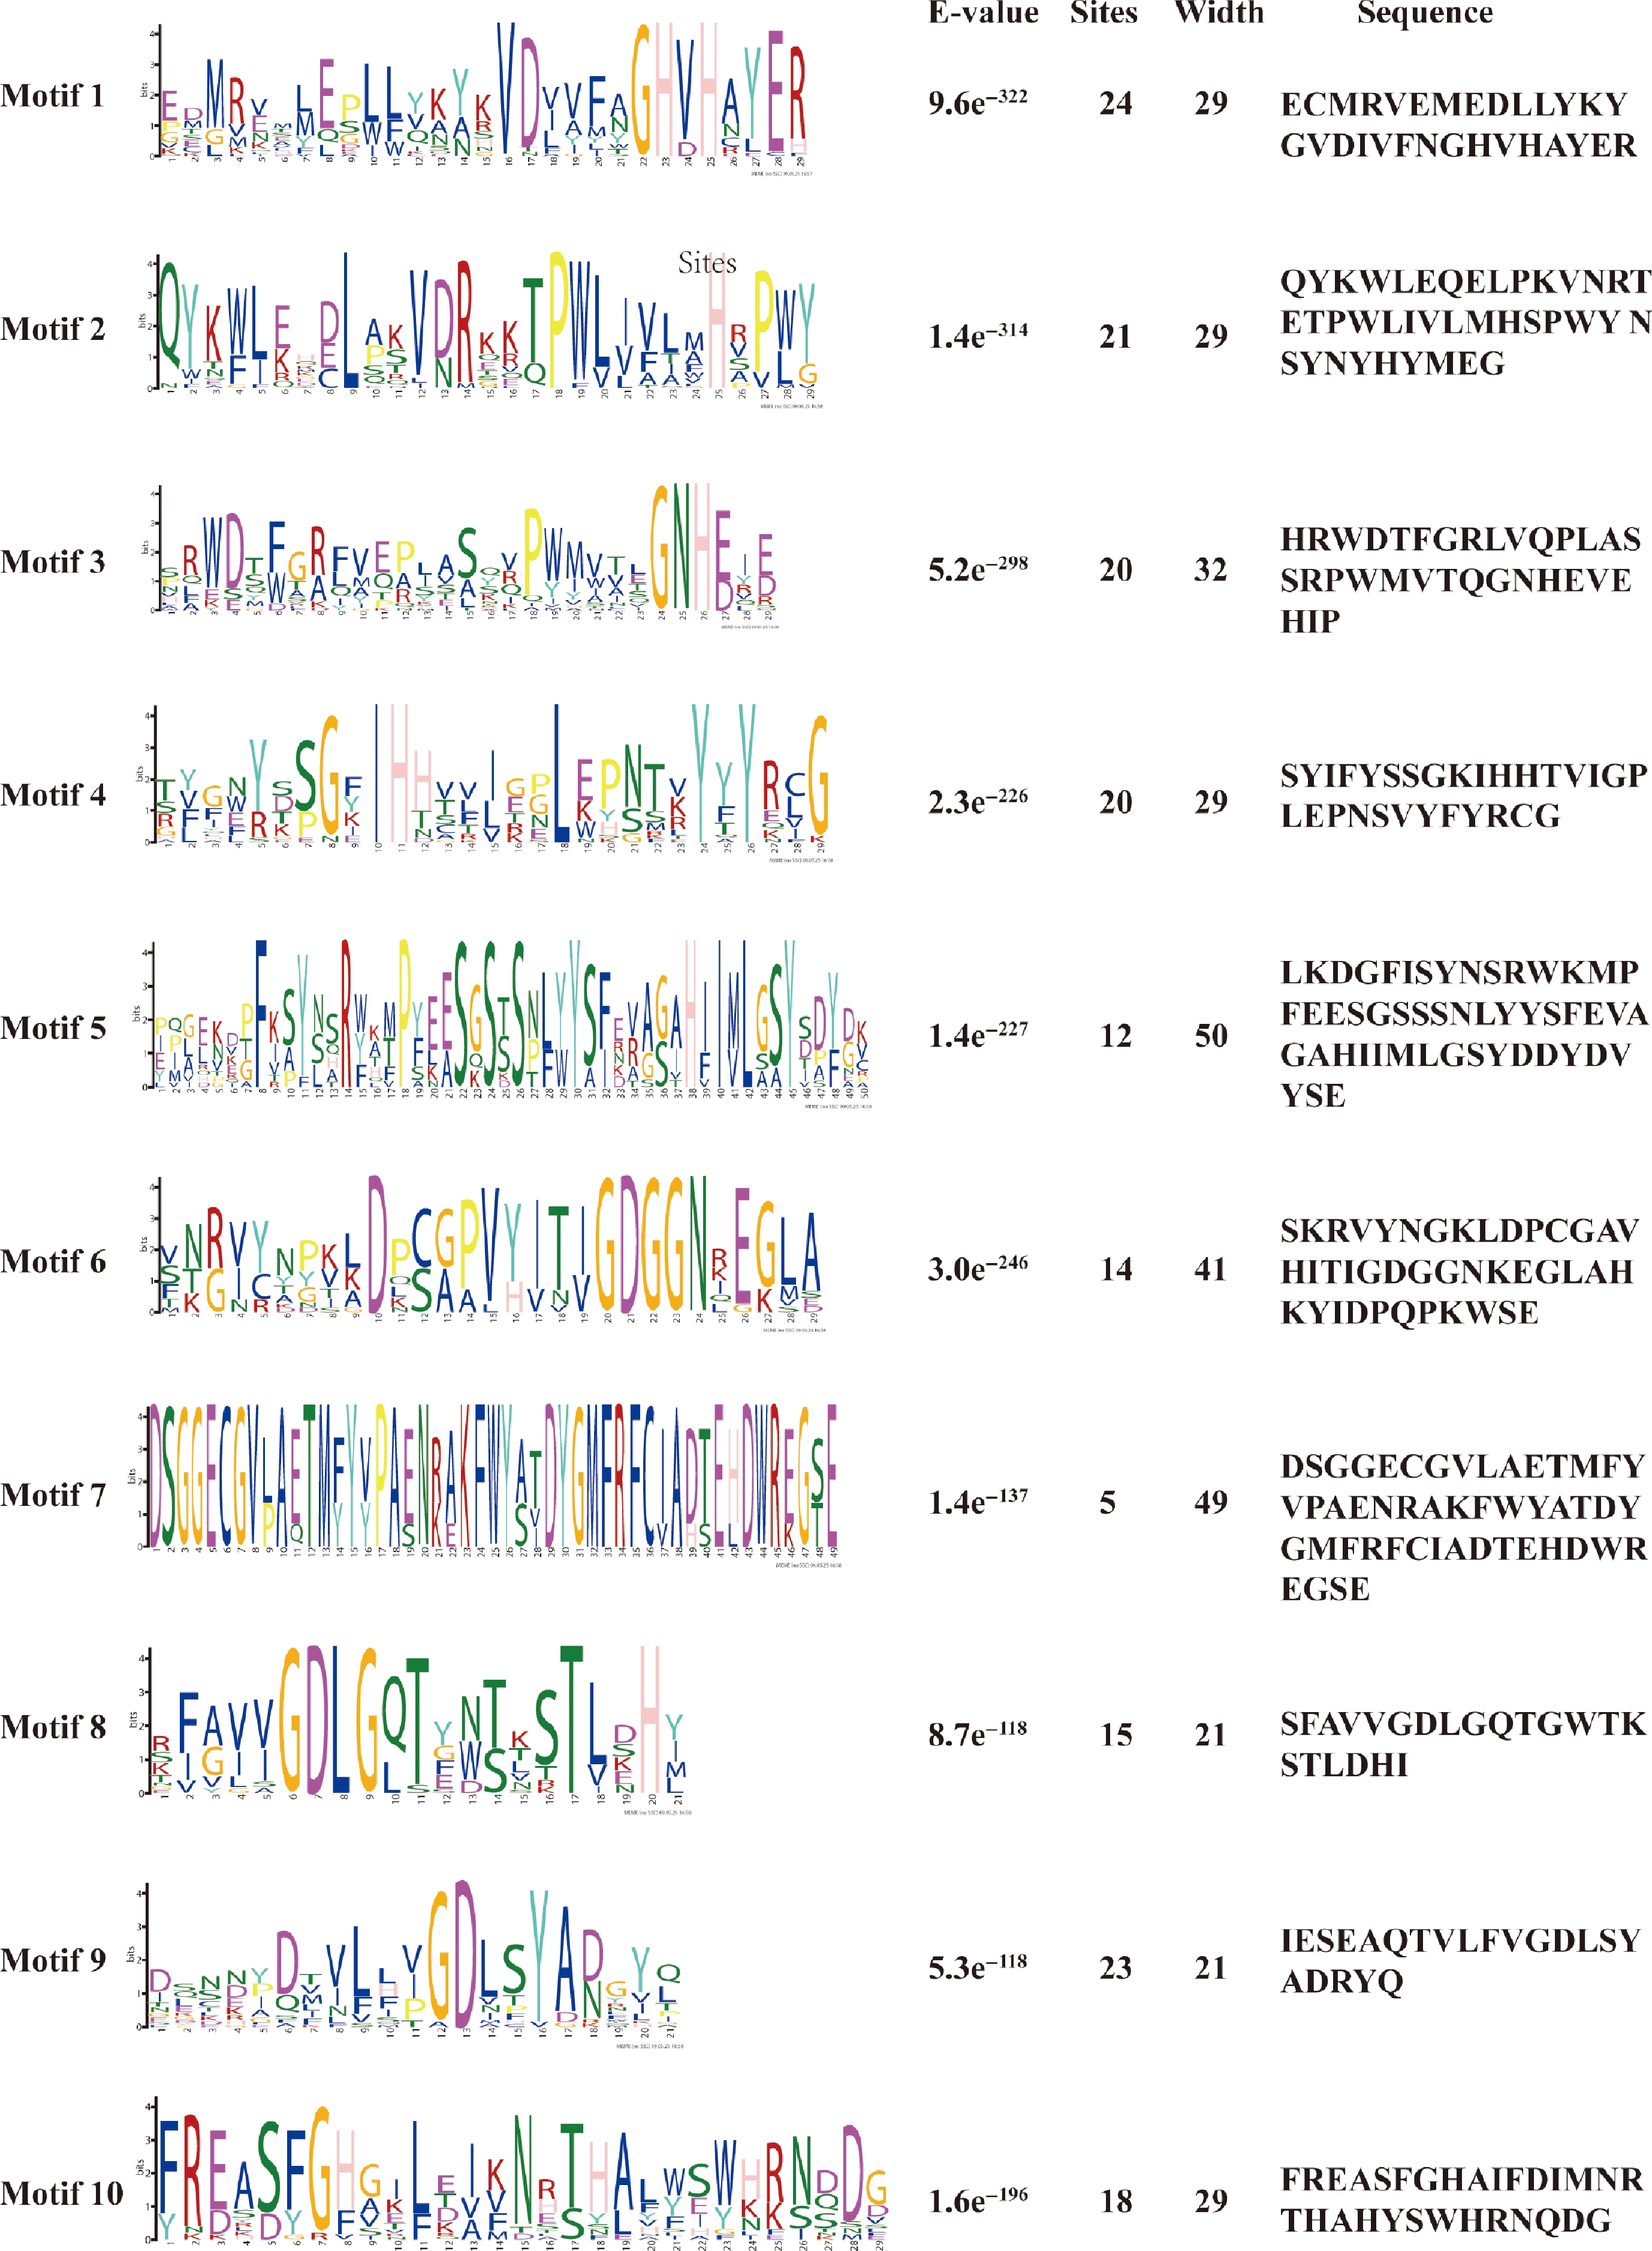
Figure 3.
Conserved protein motifs of the MsPAP gene family in alfalfa.
Ten distinct motifs (Motif 1−10) are represented by colored boxes. The table details the amino acid sequence, length (width), number of occurrences (sites), and statistical significance (E-value) for each motif.
Evolutionary relationship and collinearity analysis of MsPAP family members in alfalfa
-
To understand the evolutionary relationships among PAP gene family members in alfalfa, the amino acid sequences of PAP proteins from A. thaliana, M. truncatula, and alfalfa were aligned and analyzed, and a phylogenetic tree of the three was constructed. In total, 29 PAP members from A. thaliana, 15 from M. truncatula, and 30 from alfalfa were divided into six groups (I, II, III, IV, V, VI) (Fig. 4). Group VI contained the most PAP genes, including 10 MsPAPs, 10 AtPAPs, and 6 MtPAPs. Group I had only one MsPAP10. Group II contained three MsPAPs, Group III contained three MsPAPs, and both Group IV and Group V contained six MsPAP members each.
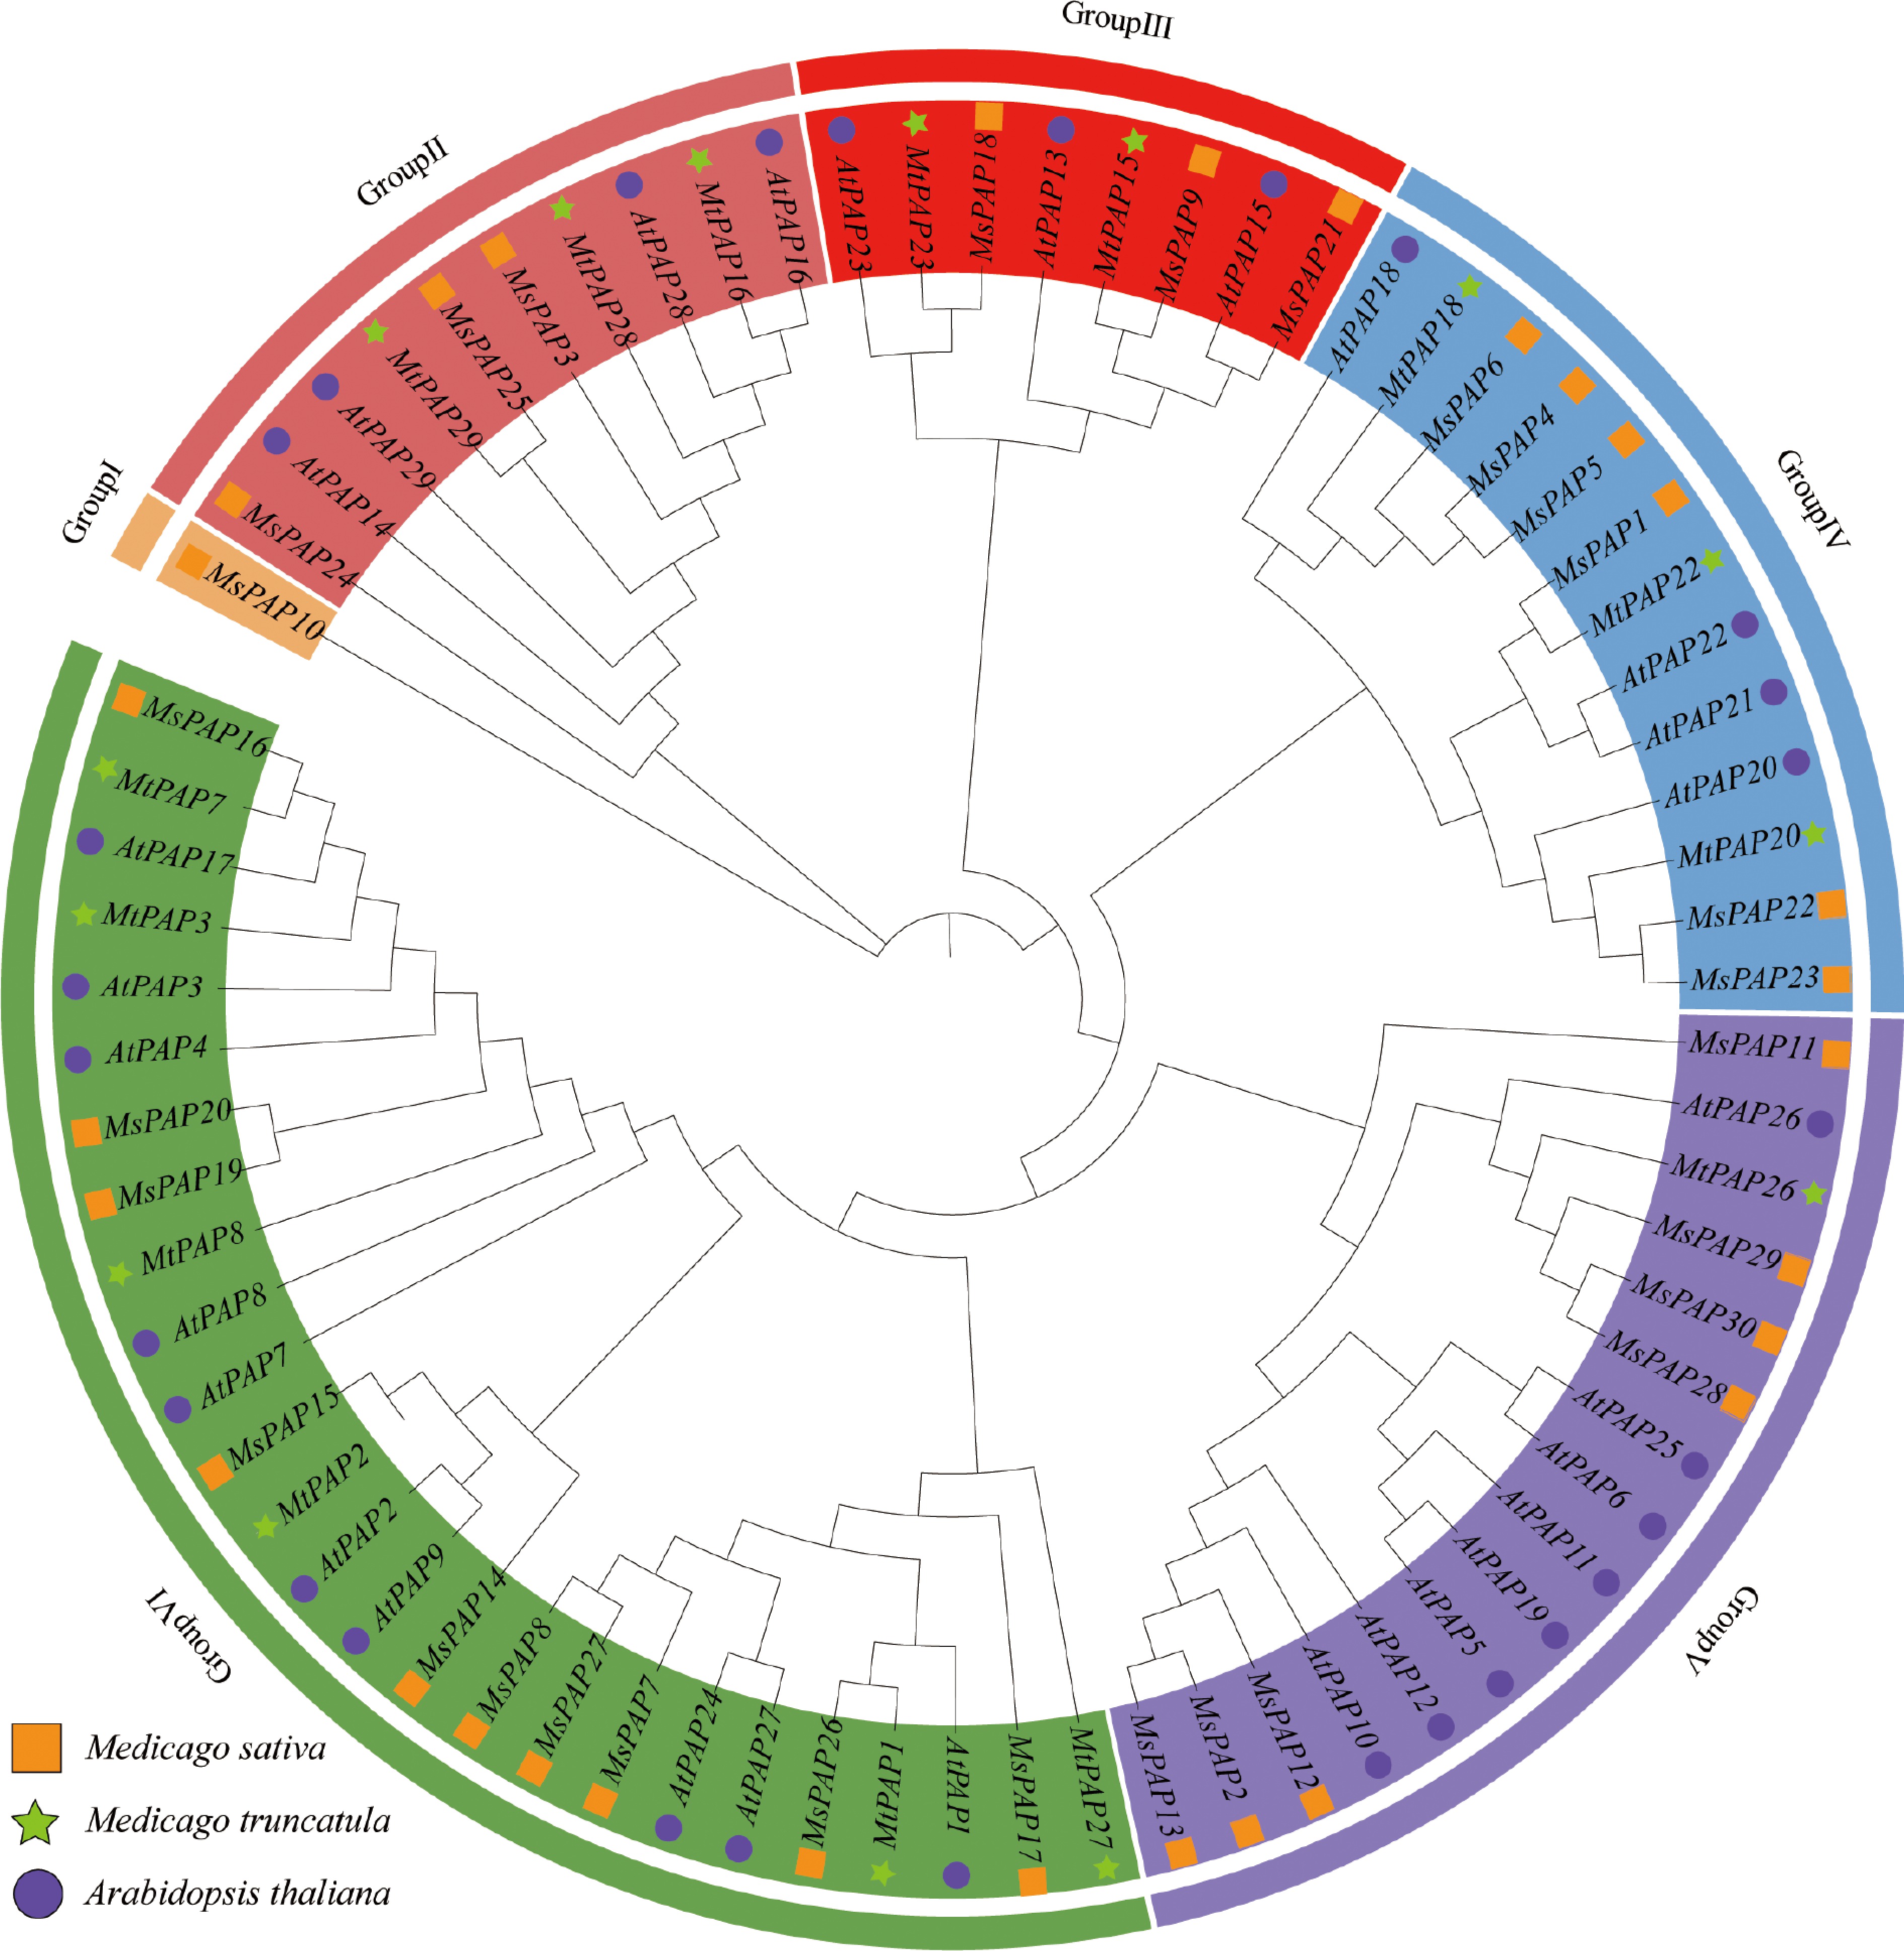
Figure 4.
Phylogenetic analysis of PAP proteins from A. thaliana, M. truncatula, and alfalfa.
By comparing the results with functionally characterized PAP proteins from A. thaliana, this study further established the correspondence between the phylogenetic grouping and classical functional subfamilies. Group VI corresponds to Subfamily Ia (secretory PAPs), given that AtPAP12 and AtPAP26 (both reported as secretory PAPs) cluster within Group VI, and the MsPAP members in this group (e.g., MsPAP20 and MsPAP26) exhibit induction expression patterns under low-P stress, consistent with secretory PAPs. Group IV and Group V correspond to Subfamily Ib (phytase-active PAPs), according to the fact that GmPAP14 (confirmed to have phytase activity) clusters within this branch, and MsPAP23 shows strong expression induced by low phosphorus (over sevenfold upregulation at Day 5). Groups I, II, and III correspond to Subfamily IIIb (low-molecular-weight PAPs), according to the fact that AtPAP17 (a representative member of low-molecular-weight PAPs) clusters within Group II, and MsPAP members in these groups predominantly show downregulation or no significant response under low-P stress.
The proportion of PAP gene family members between alfalfa and A. thaliana was consistent, suggesting that the PAP gene family has maintained high homology during the evolution of alfalfa. This grouping–function correspondence provides an important reference for subsequent functional studies based on subfamily-specific characteristics.
Phylogenetic analysis was performed on 30 MsPAP proteins from alfalfa (yellow squares), 29 AtPAP proteins from A. thaliana (purple circles), and 15 MtPAP proteins from M. truncatula (green pentagrams) using the maximum likelihood method. These proteins were divided into six groups according to their genetic relationships. Group I (yellow), Group II (pink), Group III (red), Group IV (blue), Group V (purple), and Group VI (green) contained 1, 10, 8, 13, 16, and 26 PAP proteins, respectively.
The correspondence between the phylogenetic grouping and classical functional subfamilies is indicated by the branches' colors and annotations. Group VI (green branch) corresponds to Subfamily Ia (secretory PAPs). Representative members include AtPAP12 and AtPAP26 (A. thaliana) and MsPAP20 and MsPAP26 (alfalfa), which are involved in extracellular hydrolysis of organic phosphorus and recycling. Group IV (blue branch) and Group V (purple branch) correspond to Subfamily Ib (phytase-active PAPs). Representative members include GmPAP14 (soybean) and MsPAP23 (alfalfa), which function in degrading phytic acid for releasing phosphorus. Group I (yellow branch), Group II (pink branch), and Group III (red branch) correspond to Subfamily IIIb (low-molecular-weight PAPs). Representative members include AtPAP17 (A. thaliana) and the corresponding MsPAP members, whose functions remain to be further characterized.
Values at the nodes indicate bootstrap support percentages (≥ 50%). The scale bar represents genetic distance.
Collinearity analysis of MsPAP family members in alfalfa
-
To further explore the evolutionary relationships of PAP members in alfalfa, M. truncatula, and A. thaliana, collinearity analysis was performed (Fig. 5). The results showed that 12 and 22 MsPAP genes exhibited collinearity with A. thaliana and M. truncatula PAP genes, respectively, and the genes involved in duplication events differed. Between A. thaliana and alfalfa, the duplication events mainly occurred on chromosomes 1, 2, 3, 4, 7, and 8. Between M. truncatula and alfalfa, the duplication events occurred on all chromosomes (1−8), with the most frequent events (five genes each) on chromosomes 3 and 8. In total, six TD events and eight SD events were identified within the MsPAP gene family.
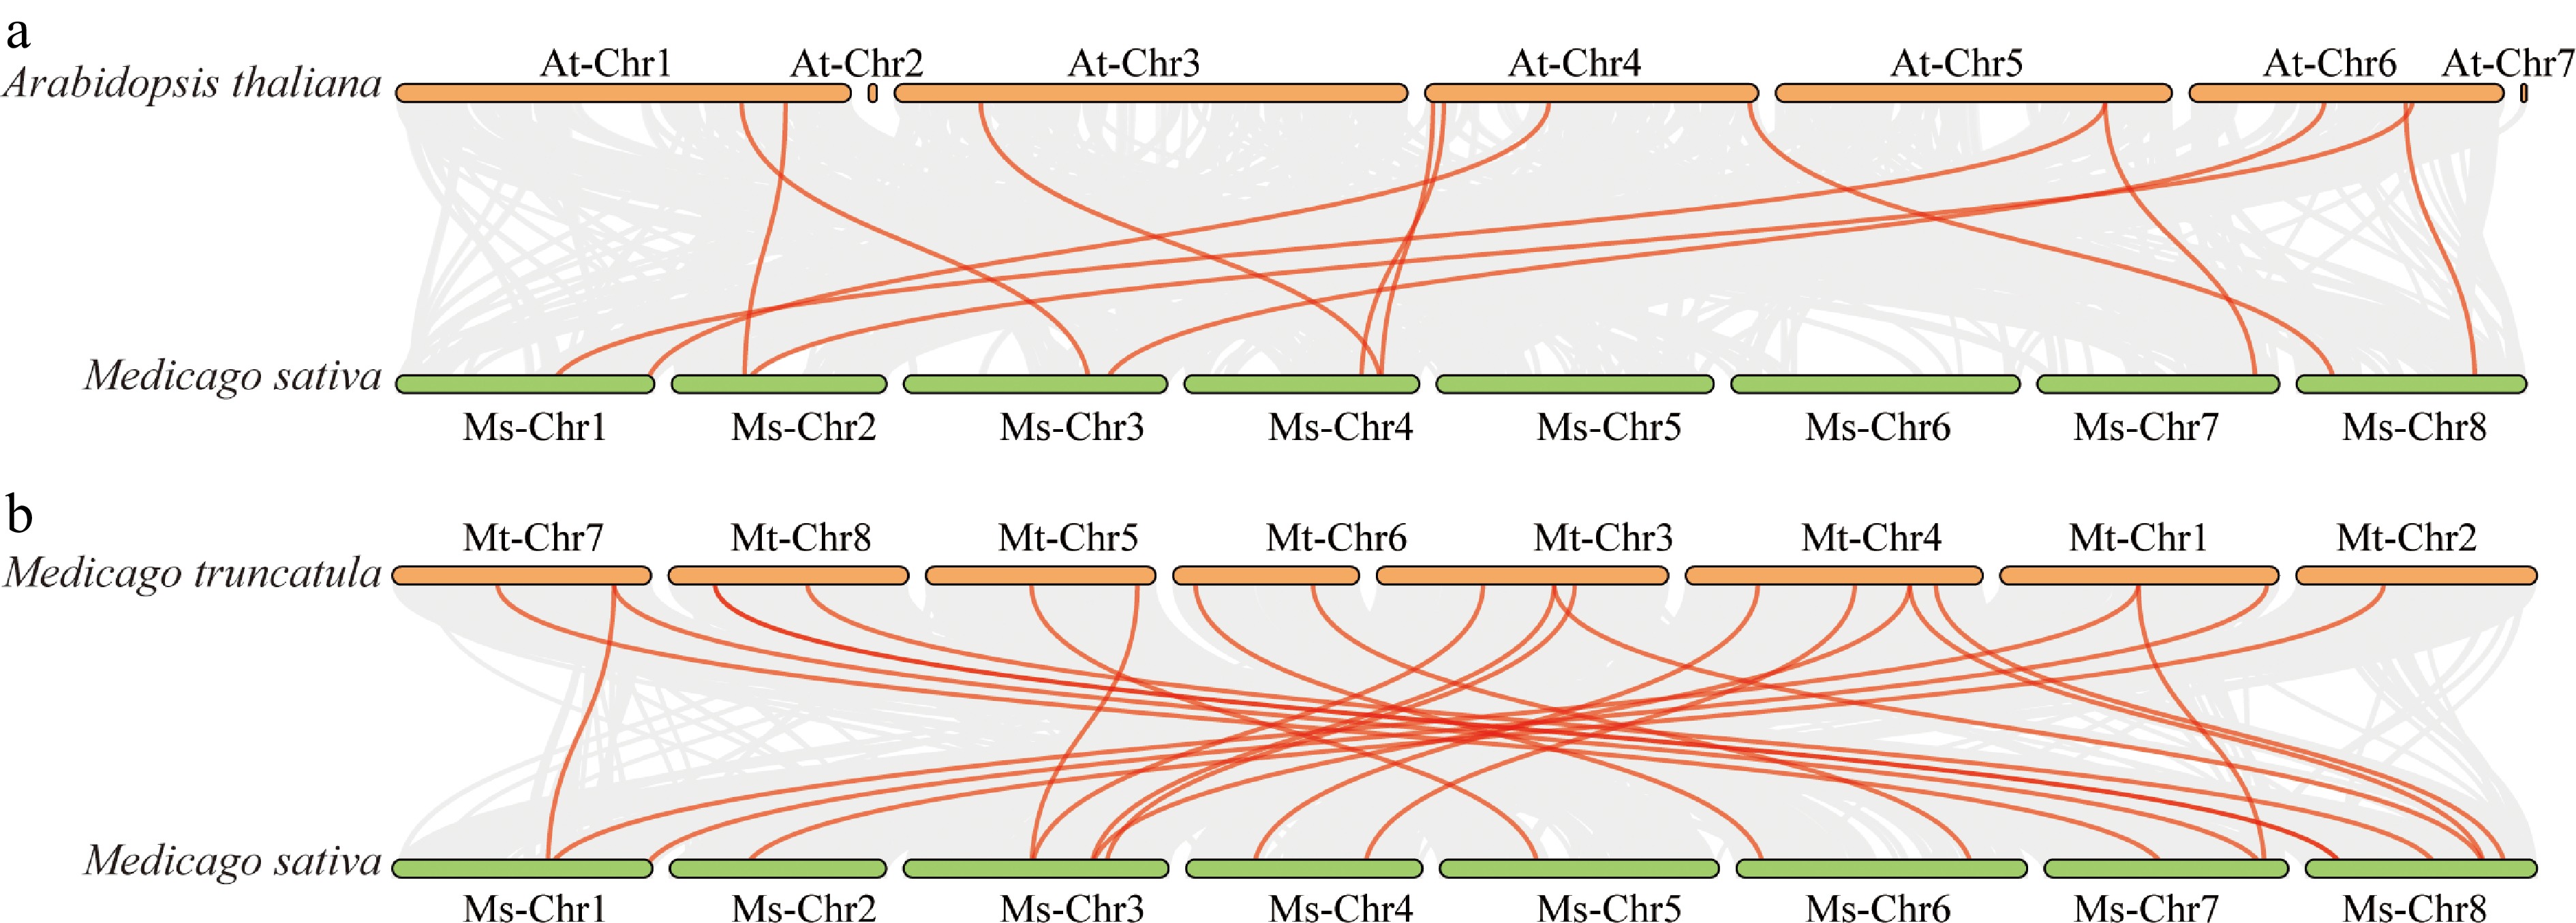
Figure 5.
Syntenic relationships of the PAP gene family in A. thaliana, M. truncatula, and alfalfa. (a) Syntenic relationships of MsPAP and AtPAP; (b) syntenic relationships of MsPAP and MtPAP.
Tissue-specific expression of the MsPAP gene family in alfalfa
-
To clarify the tissue-specific expression patterns of the MsPAP gene family in alfalfa, a heatmap was generated using transcriptome data from six tissues: Roots, leaves, elongated stems, unelongated stems, flowers, and root nodules (Fig. 6). According to the expression peaks, MsPAP members were classified into four functional groups.
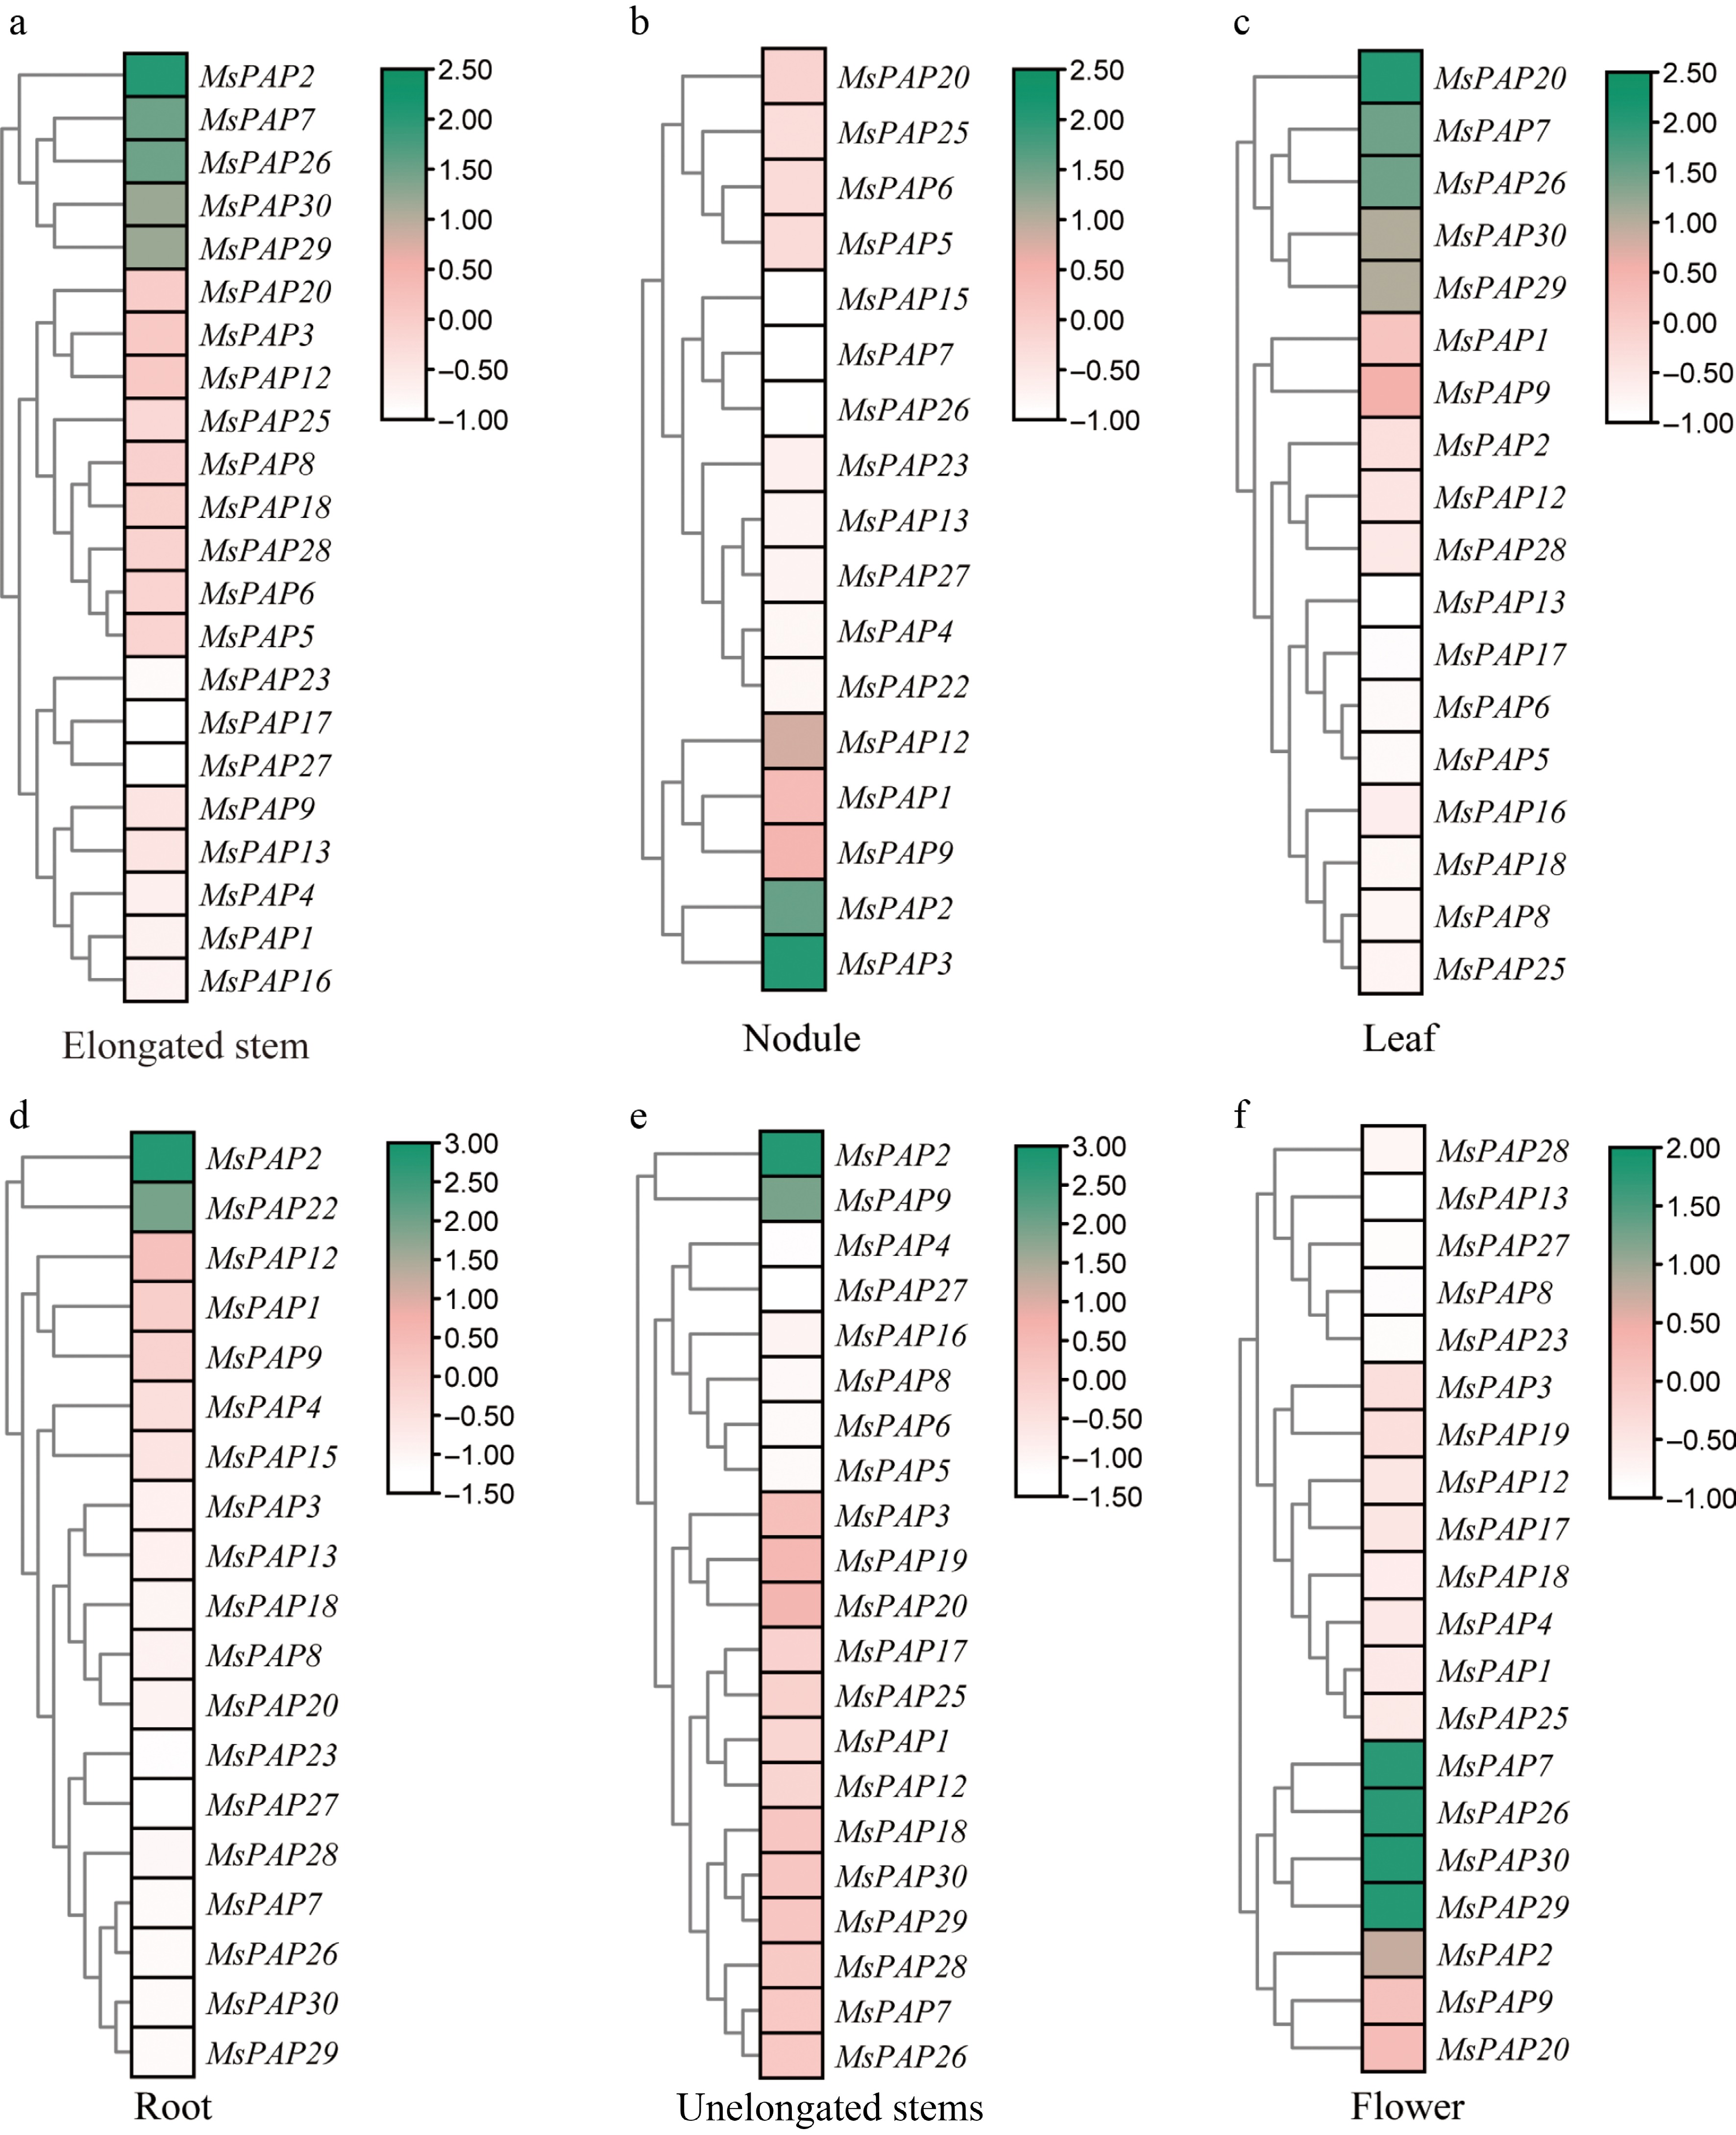
Figure 6.
Analysis of MsPAP genes' expression in different tissues of alfalfa. Hierarchical clustering heatmap of the transcriptional expression levels of the MsPAP gene family in the tissues of (a) elongated stems, (b) nodules, (c) leaves, (d) roots, (e) unelongated stems, and (f) flowers in alfalfa. The genes are arranged according to the results of the cluster analysis; the color gradient represents the relative expression levels (green indicates high expression, white indicates low expression), and the color scale on the right shows the range of expression values using FPKM-normalized values.
In the root and unelongated stem group, genes such as MsPAP9 showed significantly higher expression in roots and unelongated stems than in other tissues (Fig. 6e). Given the roles of roots and unelongated stems in nutrient uptake and transport, this group may be involved in phosphorus acquisition and initial xylem loading. In the leaf-preferential group, MsPAP7, MsPAP20, and MsPAP26 exhibited expression peaks in functional leaves (Fig. 6c). PAPs are known to remobilize internal phosphorus under low-P conditions. The leaf-enriched expression of these genes suggests their potential roles in the remobilization of P from senescing or mature leaves, thereby supporting new growth. In the reproductive tissue-preferential group, MsPAP7, MsPAP26, MsPAP29, and MsPAP30 were significantly upregulated in the flowers (petals) (Fig. 6f). Reproductive tissues often act as strong P sinks; therefore, these MsPAPs may facilitate the redistribution of P from vegetative organs to floral tissues, ensuring successful reproduction. In the ubiquitously expressed group, MsPAP2 was detected in all six tissues, with the highest relative expression in root nodules, elongating stems, and flowers (Fig. 6a–f). Regarding the nonexpressed genes, five MsPAP genes (MsPAP-10, -11, -14, -21, and -24) showed no detectable expression levels in any of the six tissues examined (Fig. 6). They may be expressed in other unexamined tissues (e.g., seeds, senescing organs) or be specifically induced under stress conditions such as low-P stress.
In summary, the tissue-specific expression patterns of MsPAP genes provide functional clues linking distinct members to root P uptake, leaf P remobilization, reproductive P allocation, and possibly nodule-associated P metabolism. These results lay a foundation for the functional characterization of individual MsPAP genes in alfalfa.
Expression analysis of MsPAP genes under drought, salt, cold, and alkaline stresses
-
To further understand the response of the alfalfa PAP family to different abiotic stresses, transcriptomic data of alfalfa under drought, salt, cold, and alkaline stresses at different time points were analyzed in this study (Fig. 7). Under drought stress, 26 MsPAP genes exhibited distinct expression responses: Most reached their maximum expression at specific time points after the stress, followed by a gradual decline. For instance, the expression of MsPAP19 decreased progressively with extended drought treatment (Fig. 7a). In total, 25, 26, and 27 MsPAP genes responded to salt, cold, and alkaline stresses, respectively (Figs. 7b−d). Notably, most MsPAP genes responded to all four stresses at different time points. Specifically, MsPAP15, -21, and -22 were responsive to both cold and alkaline stresses, with expression peaks at 24 and 48 h. MsPAP9 responded to both drought and salt stresses, with the highest expression at 24 h under both conditions. The MsPAP gene family shows extensive and differential responses to drought, salt, cold, and alkaline stresses, with most genes participating in multiple stress responses, and specific members exhibiting stress-specific or stress-shared response patterns.
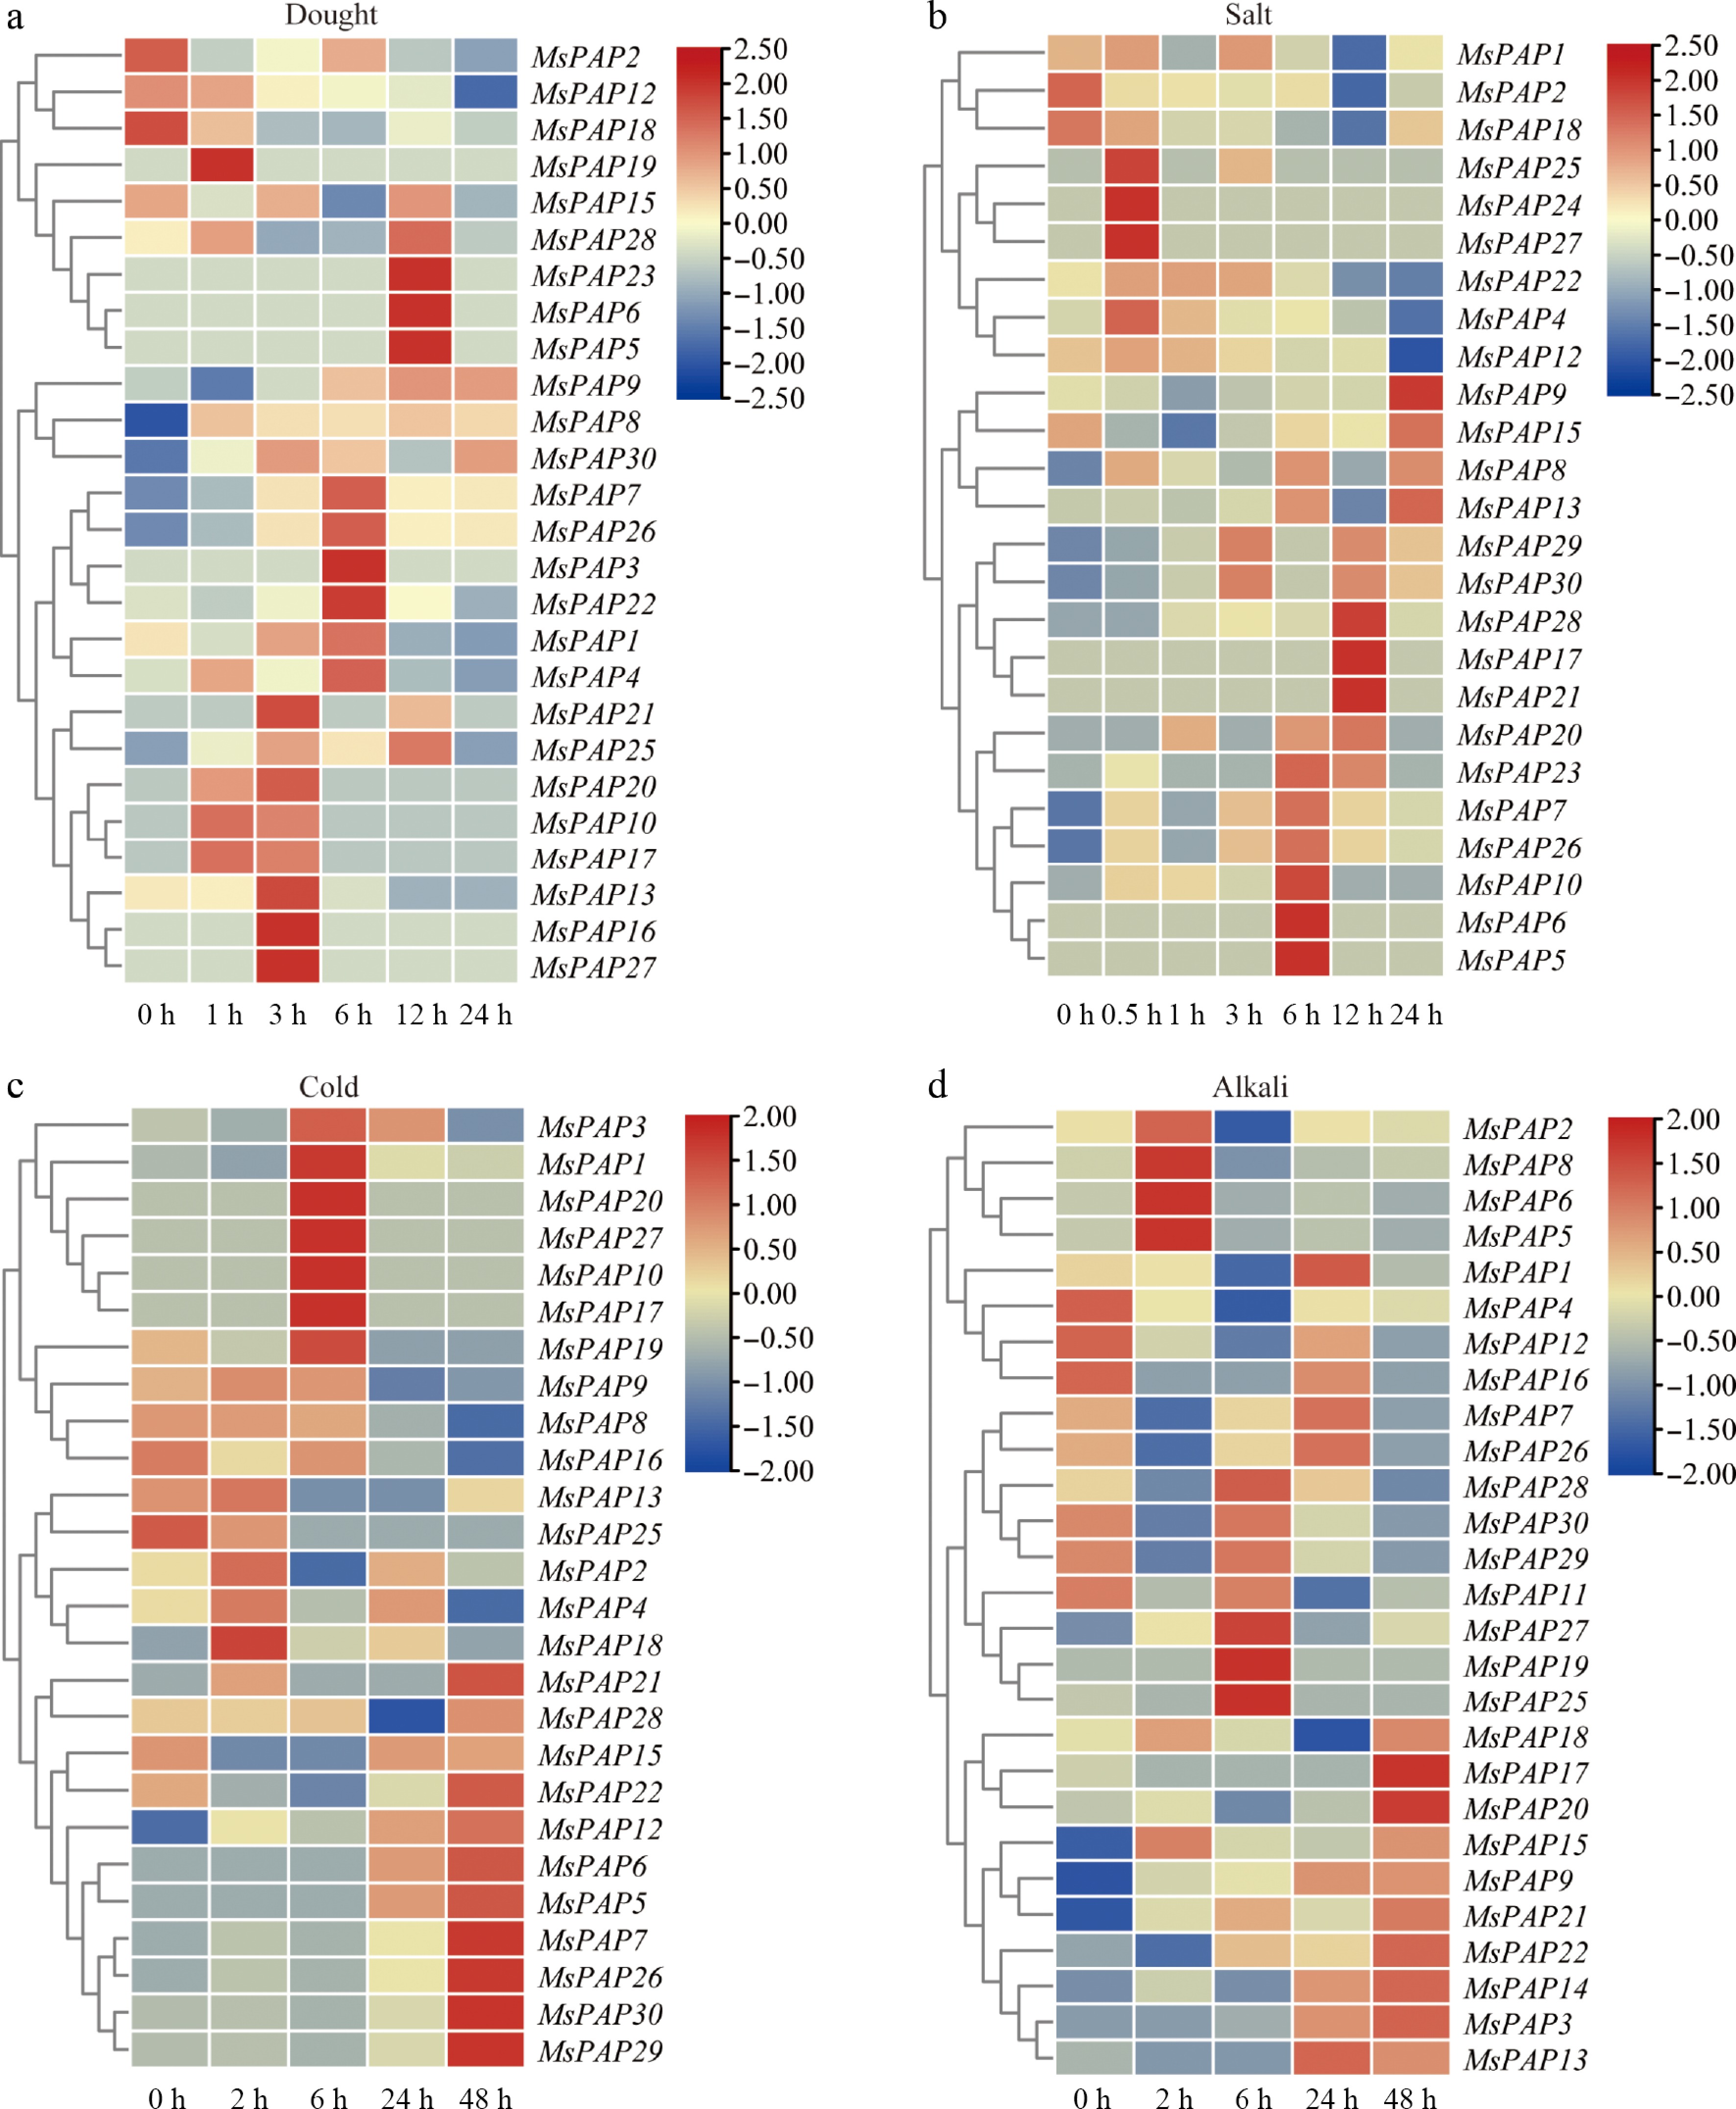
Figure 7.
Expression of MsPAP genes in alfalfa under cold, drought, alkali, and salt stress. Hierarchical clustering heatmap of the transcriptional expression levels of the MsPAP gene family in the stress under (a) drought, (b) salt, (c) cold, and (d) alkali. The color gradient represents the level of gene expression, where red typically indicates high expression and blue typically indicates low expression. The color scale represents log2(FPKM + 1).
Expression analysis of MsPAP genes under low-P stress in alfalfa
-
To further analyze the differential responses of MsPAP genes to low-P stress, six representative MsPAP members from different phylogenetic groups according to the previous phylogenetic analysis (Group II: MsPAP25; Group III: MsPAP9; Group IV: MsPAP23; Group V: MsPAP2; Group VI: MsPAP20, MsPAP26), as shown in Fig. 4 were selected to test their relative expression levels under low-P stress (Fig. 8). Compared with the control group, MsPAP25 (Group II) showed a significant decline in expression on Days 3 and 7 after the stress treatment, with an overall downward trend. On Day 3, the expression level of the control group was more than twice that of the low-phosphorus treatment group. MsPAP2 (Group V) was significantly downregulated on Days 3, 5, and 7 after stress, and all of them were more than onefold higher. The expression levels of MsPAP9 (Group III) exhibited an "increase–decrease–increase" trend, with the most significant difference from the control group observed on Day 3. At this time point, the expression level of the control group was about twice that of the low-P treatment group. MsPAP23 (Group IV) showed a significant increase in expression after stress, reaching a peak on Day 5 (expression was more than sevenfold higher), and then the expression level gradually decreased. MsPAP26 (Group VI) had significantly increased expression at 1 h, Day 3, and Day 5 after stress, but was rapidly downregulated on Day 7. This suggests that its expression is induced by low-P stress and decreases as the plants adapt to the stress. MsPAP20 (Group VI) was significantly downregulated on Day 3 of stress, but significantly increased to four times the control level on Day 7, indicating that it may play an important role in the response of alfalfa to low-P stress. In conclusion, representative MsPAP genes from different clades exhibit differential response patterns to low-P stress, and the expression dynamics of some genes (e.g., MsPAP20, -26, and -23) are closely associated with low-P stress induction and plants' adaptation processes.
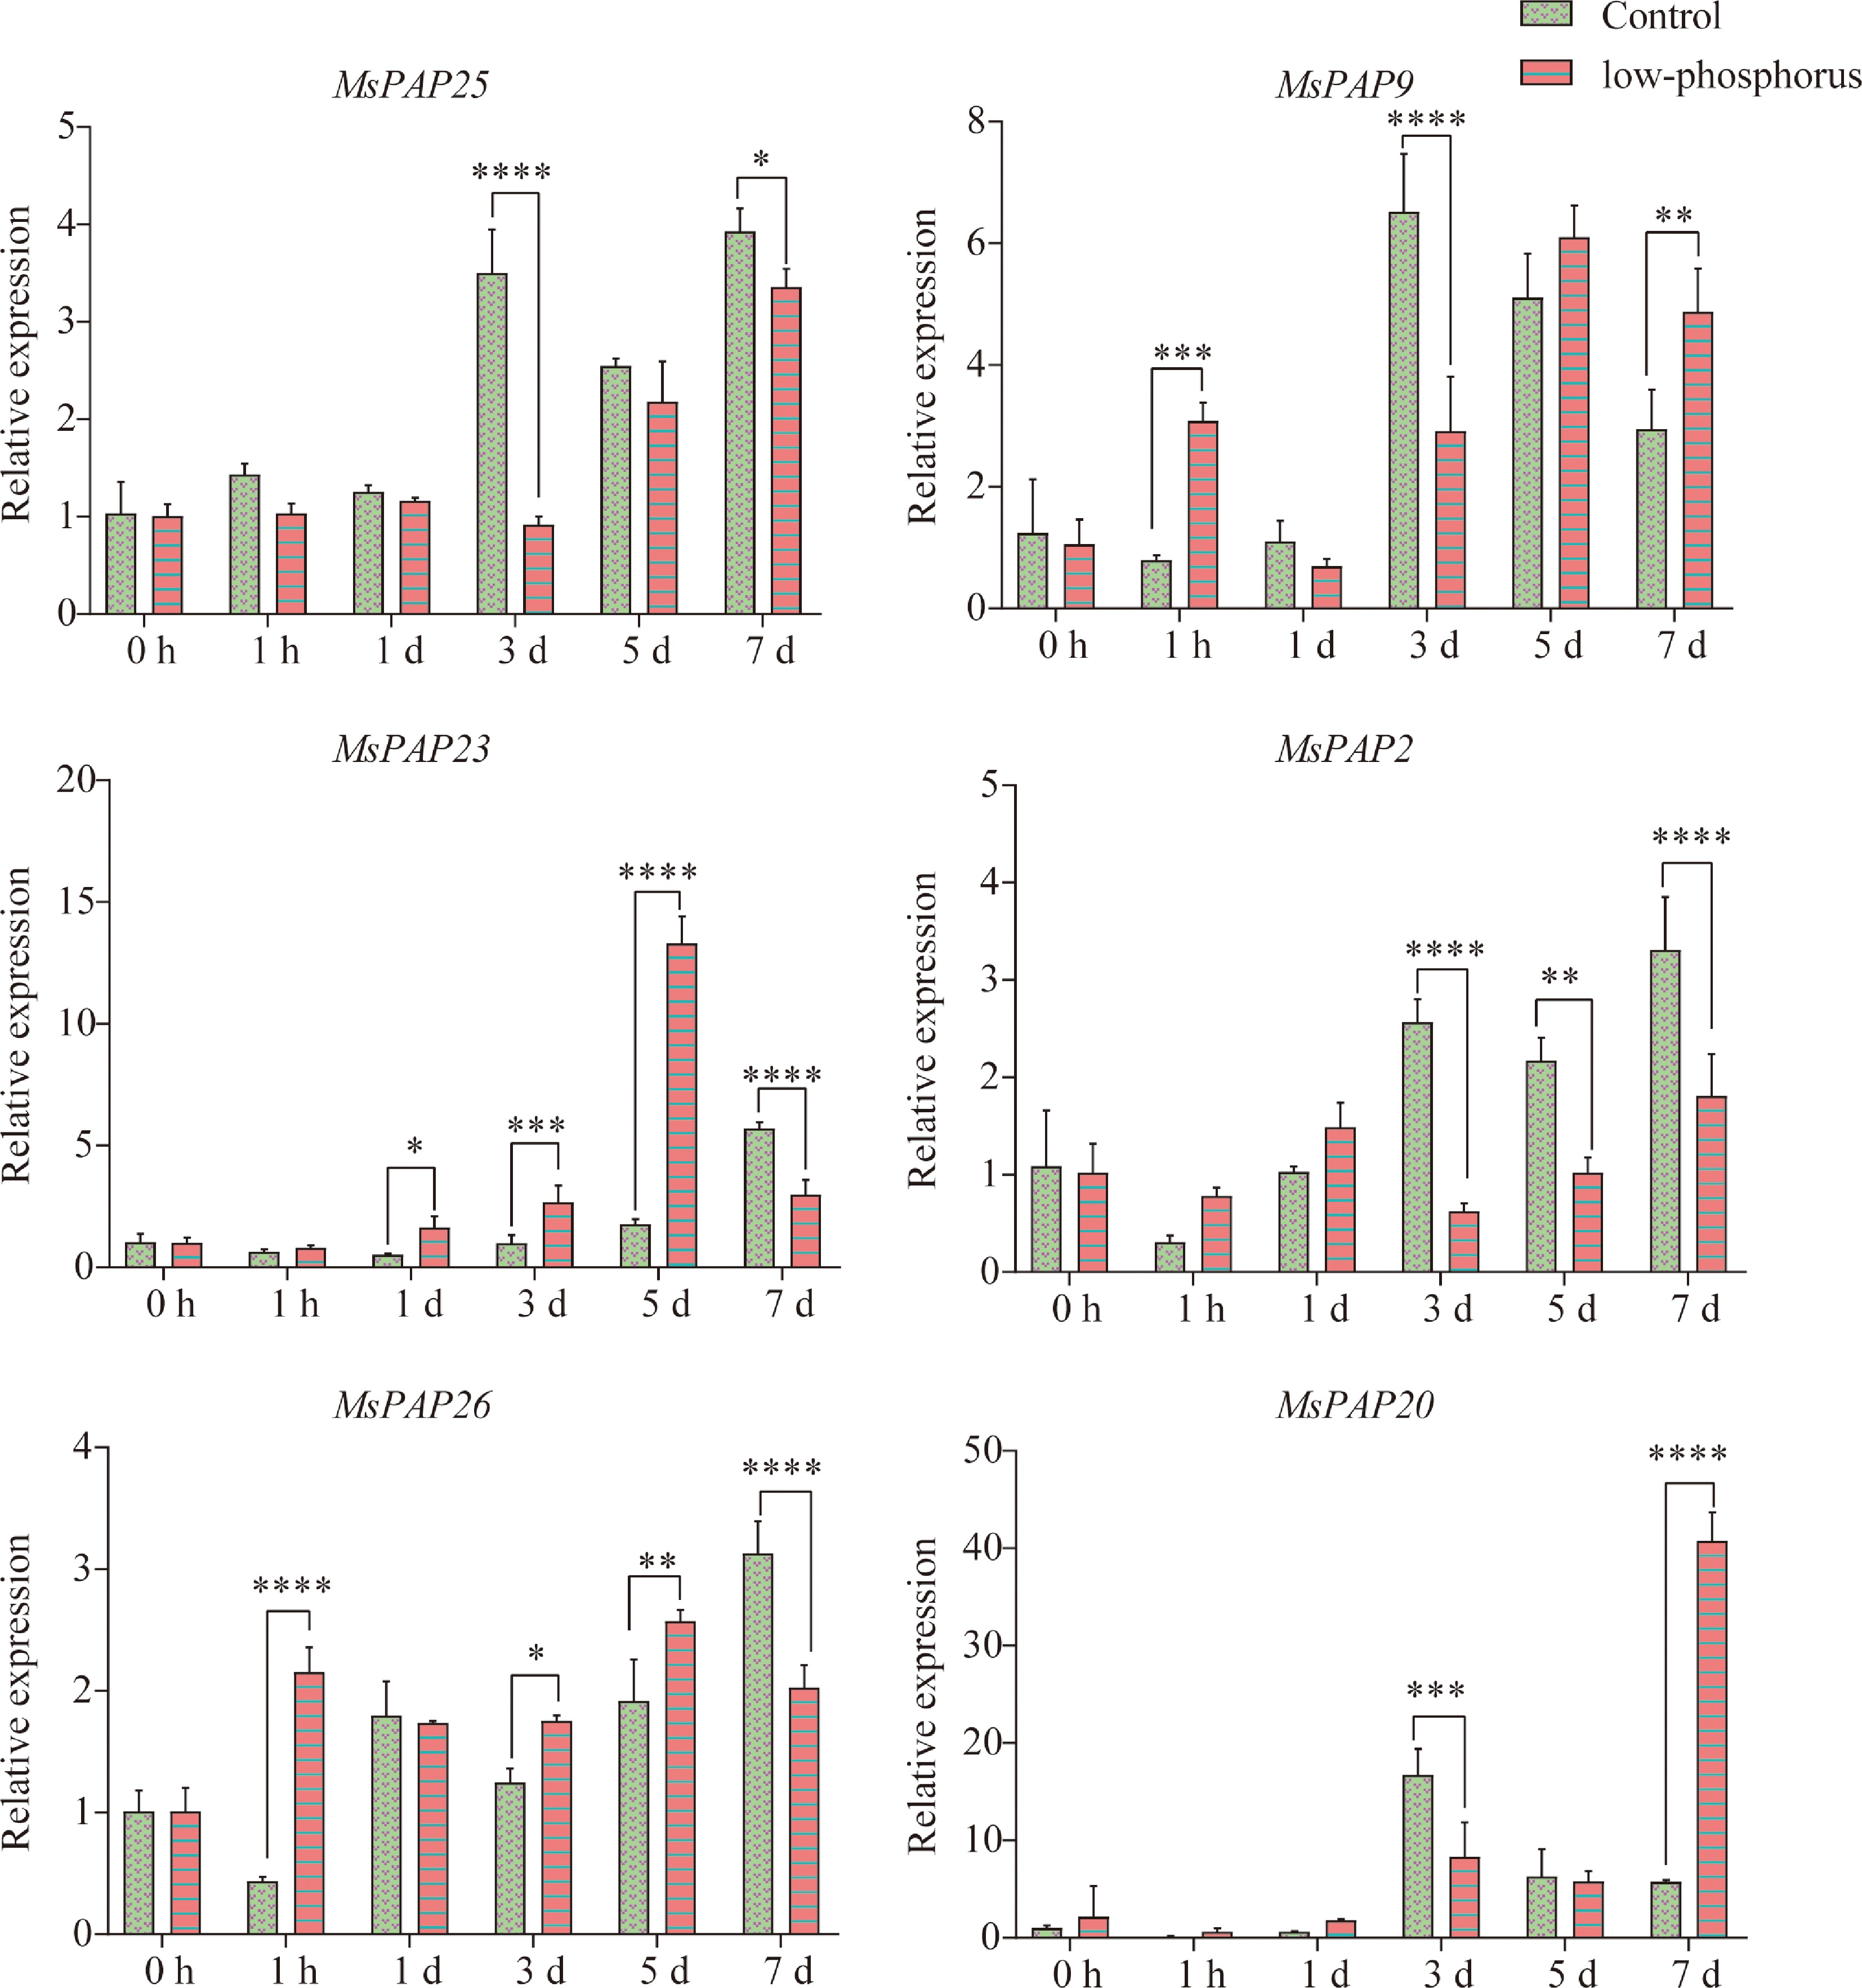
Figure 8.
Analysis of the relative expression levels of MsPAP family members under low-P stress. The abscissa represents different sampling time points: 0 and 1 h, and 1, 3, 5, and 7 d; the ordinate represents the relative expression level of each gene. Pink bars represent the 50-μmol·L−1 low-P treatment group (50 μmol·L−1 KH2PO4), and green bars represent the control group. The data are presented as the mean ± SD, n = 3. Significance of differences: *, 0.01 < p ≤ 0.05; **, 0.001 < p ≤ 0.01; ***, p ≤ 0.001; ****, p ≤ 0.0001, extremely significant. The y-axis shows relative expression (2−ΔΔCᴛ). Data are mean ± SD (n = 3), with the control (0 h) set to 1.
-
The synthesis and secretion of PAPs are critical physiological processes in plants' responses to low-P stress[40]. As an important perennial leguminous forage crop, alfalfa has high nutritional value and strong adaptability. Phosphorus utilization efficiency and abiotic stress tolerance are key factors affecting its yield and quality. Therefore, a systematic analysis of the genomewide identification and abiotic stress functions of PAP proteins in alfalfa provides useful insights. In this study, we identified and analyzed PAP genes in alfalfa, their genomic distribution, and structural characteristics, alongside the proteins' physicochemical properties and evolutionary relationships, tissue-specific expression patterns, and abiotic stress responses. Clade-specific expression dynamics of MsPAPs under low-P stress were discussed as well.
In this study, the 30 identified MsPAP genes were nonrandomly distributed across 8 chromosomes, with paired and clustered arrangements suggesting the role of gene duplication in the family's expansion. Such clustered distributions, often resulting from TDs, are frequently associated with functional divergence and adaptive evolution, as documented in other plant gene families[41]. Substantial structural diversity was observed among MsPAP genes, particularly in terms of exon–intron organization, with exon numbers ranging from 3 to 14. This variation is a recognized marker of functional differentiation[42]. Although most members contained conserved core motifs (e.g., Motifs 1, 2, and 9), certain motifs (e.g., Motifs 5, 6, and 7) showed sparse distribution, potentially conferring functional specialization, analogous to findings in the soybean WRKY family[43].
Analysis of the protein properties confirmed that all MsPAPs are hydrophilic, which supports their potential involvement in aqueous intracellular processes such as metabolism and signaling[44]. Consistent with this, their predicted subcellular localizations indicated a broad distribution across multiple compartments, including the nucleus, chloroplast, vacuole, and cytoplasm, —implying diverse functional roles tailored to specific organelles[45]. For instance, chloroplast-localized PAPs could participate in phosphorus metabolism linked to photosynthesis[5, 16]. Collinearity analysis further revealed species-specific duplication patterns and chromosomal rearrangements, highlighting the unique evolutionary trajectory of the MsPAP family following speciation[46]. When compared with PAP families in other legumes such as soybean and M. truncatula, the MsPAP family exhibits both conserved features (e.g., similar motif composition and exon–intron structures in orthologous genes) and lineage-specific characteristics (e.g., differences in gene number and chromosomal distribution patterns), reflecting the interplay of shared ancestry and species-specific adaptation during evolution[47]. This cross-species comparative analysis not only helps clarify the evolutionary origin of the PAP gene family but also provides important references for elucidating the functional evolution trajectory of MsPAP genes.
The tissue-specific expression of MsPAP genes, particularly their elevated levels in root nodules and leaves, suggests specialized roles in organ-specific phosphorus metabolism, potentially related to nitrogen fixation and photosynthesis, respectively[40, 48]. The absence of expression for five genes in all tested tissues implies regulatory complexity and potential induction under unexamined conditions or stresses[49]. Furthermore, most MsPAP genes responded to abiotic stresses, but with distinct response patterns and dynamics. Genes such as MsPAP15, -21, and -22, which showed sharp induction peaks at specific time points under cold and alkaline stress, likely function as key rapid responders[50]. In contrast, MsPAP9, which was upregulated under both drought and salt stresses, may represent a core component of a broader defense pathway[51]. This functional diversification in expression enables the MsPAP gene family to coordinate alfalfa's adaptation to adverse environments[52,53].
The differences in the expression patterns of MsPAP genes from different clades under low-P stress further reflect functional differentiation and coordinated regulatory mechanisms in response to phosphorus deficiency[16]. Notably, the sustained downregulation of MsPAP25 (Group II) and MsPAP2 (Group V) suggests their primary role in maintaining basal phosphorus metabolism under phosphate-sufficient conditions[54]. Under low-P stress, their suppression may facilitate metabolic resource reallocation, a mechanism analogous to that observed for ZmPAP16 in maize[12], thereby freeing regulatory space for highly responsive genes. In contrast, the expression dynamics of MsPAP9, MsPAP23, and MsPAP26 align closely with the "perception–response–adaptation" model of plants' low-P stress response, a pattern conserved in legumes such as GmPAP23 in soybean[40]. Specifically, the rapid upregulation of MsPAP26 likely contributes to early extracellular remobilization of organic phosphorus; however, this functional inference requires direct biochemical and localization evidence. In chickpea (Cicer arietinum), CaPAP7 has been shown to possess phytase activity, and it was shown to promote growth and Pi accumulation in A. thaliana when phytate is supplied as the sole P source[55]. Moreover, the delayed induction of MsPAP20 (Group VI), which exhibited a fourfold increase in expression in later stages, may represent a long-term adaptive mechanism for sustaining phosphorus uptake, similar to the role of MdPAP10 in apple that potentiates root P transporters' activity[16]. These findings collectively underscore an evolutionarily conserved yet functionally specialized framework of PAP-mediated low-P stress adaptation in alfalfa[56]. The distinct temporal and group-specific expression patterns highlight sophisticated regulatory logic governing the activation, translocation, and metabolic allocation of phosphorus, providing theoretical targets for molecular breeding aimed at enhancing phosphorus use efficiency in alfalfa[40].
-
Thirty members of the MsPAP gene family were identified from the genome of alfalfa, and these members were distributed in pairs or clusters across eight chromosomes. Most family members exhibited relatively high conservation, whereas a small subset of nonconserved members might be associated with functional specificity. The precursor proteins of MsPAP ranged in length from 169 to 1,066 aa. They displayed well-defined ranges of molecular weight and pI, and all were characterized as hydrophilic proteins. Subcellular localization predictions showed that MsPAP proteins were primarily localized to the nucleus and other compartments, with some members exhibiting cross-compartment localization. Expression profiling revealed that MsPAP family genes had distinct tissue-specific expression patterns. Following exposure to abiotic stresses such as low-P, their expression levels changed significantly, and they also showed time-specific expression dynamics. This study represents the first comprehensive and systematic analysis of the MsPAP gene family, encompassing its identification, evolutionary relationships, structural features, and expression profiles across different tissues and in response to multiple abiotic stresses. Future studies could further explore the molecular roles of MsPAP genes in stress resistance and phosphorus use efficiency in alfalfa or other plants, which would provide theoretical support and genetic resources for breeding stress-tolerant alfalfa cultivars.
-
The authors confirm their contributions to the paper as follows: conceived and designed the study: Li M, Liu T; performed the identification and analysis of the MsPAP gene family, conducted the low-P stress experiments, collected samples, processed data, and drafted the manuscript: Yang Y; assisted in the low-P stress treatment, sample collection, and data processing: Zhang J; collaboratively prepared and revised the figures and tables: Wu Q, Zeng X; contributed to data analysis and interpretation: Kang J; provided funding: Liang W, Long R, Li M; revised and finalized the manuscript: Yang Y, Li M, Liu T. All authors reviewed the results and approved the final version of the manuscript.
-
All data generated or analyzed during this study are included in this published article.
-
The authors declare that they have no conflict of interest.
-
This accompanies this paper online at https://doi.org/10.48130/grares-0026-0020.
- Supplementary Table S1 Protein sequences of MsPAP gene family members.
- Supplementary File 1 Melting-curve profiles for qPCR amplification of six MsPAP genes.
- Copyright: © 2026 by the author(s). Published by Maximum Academic Press, Fayetteville, GA. This article is an open access article distributed under Creative Commons Attribution License (CC BY 4.0), visit https://creativecommons.org/licenses/by/4.0/.
-
About this article
Cite this article
Yang Y, Zhang J, Zeng X, Wu Q, Liang W, et al. 2026. Genomewide identification and expression analysis of the purple acid phosphatase (PAP) gene family in Medicago sativa. Grass Research 6: e028 doi: 10.48130/grares-0026-0020 

Genomewide identification and expression analysis of the purple acid phosphatase (PAP) gene family in Medicago sativa
- Received: 18 March 2026
- Revised: 10 June 2026
- Accepted: 08 July 2026
- Published online: 29 September 2026
Abstract: Alfalfa (Medicago sativa), a high-quality forage crop with nitrogen-fixing and soil-improving abilities, is vital for livestock production. Purple acid phosphatases (PAPs), metalloacid phosphatases secreted by plants to the rhizosphere for the hydrolysis of organic phosphorus and growth promotion, remain largely unclear in alfalfa. To address this gap, a genomewide analysis of the MsPAP gene family was conducted to explore its evolution, molecular characteristics, and potential roles in stress tolerance and phosphorus use efficiency. On the basis of the Medicago sativa cv. Zhongmu-1 genome, MsPAP genes were identified and characterized through genomewide screening, phylogenetic analysis, gene structure and conserved motif analysis, chromosomal localization, and collinearity analysis, combined with tissue-specific expression profiling and validation by quantitative real-time polymerase reaction (qRT-PCR). In total, 30 MsPAP genes were identified and unevenly distributed across eight chromosomes. These proteins showed diverse physicochemical properties (169–1,066 amino acids; isoelectric point = 4.87–9.96), were all hydrophilic, and were predicted to localize to chloroplasts, vacuoles, and the cytoplasm. Phylogenetic analysis grouped MsPAPs into six clades and revealed close evolutionary relationships with homologs from Arabidopsis thaliana and Medicago truncatula, which was further supported by collinearity analysis. Expression analysis demonstrated tissue-specific and stress-responsive patterns: Several MsPAP genes were induced by salt, drought, cold, and alkaline stresses, whereas MsPAP23, MsPAP26, and MsPAP20 were strongly upregulated under phosphorus deficiency, indicating roles in the remobilization of phosphorus and stress adaptation. This study provides the first comprehensive characterization of the MsPAP gene family in alfalfa and identifies key candidate genes associated with stress tolerance and phosphorus efficiency, offering valuable genetic resources for breeding improved alfalfa cultivars.
-
Key words:
- Alfalfa /
- MsPAP gene family /
- Abiotic stresses /
- low-P stress /
- Purple acid phosphatases