













-
The mitochondrial genome (mitogenome) is a closed circular double-stranded DNA molecule with a heavy strand (H-strand) and light strand (L-strand)[1]. The typical vertebrate mitogenome is 15 to 17 kb in length and contains 13 protein-coding genes (PCGs), two ribosomal RNA (rRNA) genes, 22 transfer RNA (tRNA) genes, a control region (CR), and a light strand replication origin (OL)[2,3]. Of these, the ND6 gene and eight tRNA genes are encoded by the L-strand, while other elements are transcribed from the H-strand[2,3]. As a valuable molecular marker, mitogenomes are widely used in classification, taxonomy, phylogenetic reconstruction, and adaptive evolutionary analysis[4−7].
Mitogenomic gene rearrangement is a common evolutionary trait, conferring ecological adaptive advantages and reflecting how species respond to environmental changes[8,9]. Four primary rearrangement mechanisms have been proposed: (1) Tandem Duplication and Random Loss (TDRL)[10]; (2) Tandem Duplication and Non-random Loss (TDNL)[11]; (3) Transmitochondrial recombination[12]; and (4) the replication error model triggered by tRNA gene mismatching[13,14]. Of these, TDRL is the most widely recognized cause of metazoan mitogenomic diversity[15], producing four main outcomes: translocation[16], inversion[17], shuffling, and combinatorial rearrangement[14].
The mitogenomes of snakes share basic structural characteristics with other vertebrates but also exhibit lineage-specific traits and gene order variations[18]. Specifically, mitochondrial gene rearrangement hotspots in snakes are concentrated in the WANCY region (Trp-Ala-Asn-OL-Cys-Tyr), the IQM region (Ile-Gln-Met), and the CR region together with adjacent fragments[19,20]. The research on snake mitogenome structure has identified 24 gene arrangement types[21]. Alethinophidia exhibit the highest arrangement diversity. Earlier studies focused on detecting genomic structural variations and exploring the evolutionary implications of mitogenome arrangements in Serpentes, but paid little attention to species- and population-level patterns.
The species of the genus Plagiopholis within the family Pseudoxenodontidae are small, oviparous, and non-venomous snakes, preferring to be active at night and feeding on earthworms[22,23]. They are characterized by an arrow-shaped mark on the nape and dorsal scales with black or white margins that form a reticulate pattern. These snakes are distributed across southern China and other southeastern Asian countries[24−28]. For decades, studies on Plagiopholis have remained limited and fragmented, largely due to their secretive habits and conserved morphological traits[24]. As field biodiversity investigations have intensified, Plagiopholis now consists of eight valid species[27].
Here, the complete mitogenomes of 20 individuals from three species of Plagiopholis were comprehensively structurally analyzed and compared with other related herpetological taxa.
-
Twenty individuals of the genus Plagiopholis (P. blakewayi, P. nuchalis, and P. pluvialis) were collected from the field (see Table 1). The liver tissues were placed in 85% ethanol and stored in a refrigerator at −80 °C. One additional mitogenome of P. pluvialis was retrieved from GenBank for comparative analysis (details see Table 1).
Table 1. Specimens and genetic information used in this study.
Sample Voucher Species Locality Accession Ref. YBU14061 GP3307 P. blakewayi Kaiyuan, Yunnan, China PX933003 This study YBU14072 GP3318 P. blakewayi Kaiyuan, Yunnan, China PX933002 This study YBU14074 GP3320 P. blakewayi Kaiyuan, Yunnan, China PX933001 This study YBU14540 GP3938 P. blakewayi Kaiyuan, Yunnan, China PX932993 This study YBU15116 GP4125 P. blakewayi Kaiyuan, Yunnan, China PX932991 This study YBU14255 GP3555 P. blakewayi Mengzi, Yunnan, China PX932999 This study YBU14258 GP3558 P. blakewayi Mengzi, Yunnan, China PX932996 This study YBU14257 GP3557 P. blakewayi Mengzi, Yunnan, China PX932997 This study YBU14254 GP3554 P. blakewayi Mengzi, Yunnan, China PX933000 This study YBU14256 GP3556 P. blakewayi Mengzi, Yunnan, China PX932998 This study YBU14286 GP3586 P. blakewayi Mengzi, Yunnan, China PX932995 This study YBU14620 GP3987 P. blakewayi Mengzi, Yunnan, China PX932992 This study YBU14287 GP3587 P. blakewayi Mengzi, Yunnan, China PX932994 This study / GP13328 P. nuchalis Thailand PX932988 This study / GP4299 P. aff. nuchalis Tengchong, Yunnan, China PX932990 This study YBU10050 GP1397 P. pluvialis Fanjing Mt., Guizhou, China PX933006 This study / GP2947 P. pluvialis Fanjing Mt., Guizhou, China PX933005 This study YUB13317 GP3009 P. pluvialis Emei Mt., Sichuan, China PX933004 This study YBU20004 GP6451 P. pluvialis Junlian Mt., Sichuan, China PX932989 This study / / P. pluvialis Emei Mt., Sichuan, China NC_060420 [65] / / Thermophis zhaoermii Litang, Sichuan, China NC_012816 [66] Sequencing, assembly, and annotation
-
Total genomic DNA was extracted from each sample using the MolPure Cell/Tissue DNA Kit (YEASEN). After quality assessment, the DNA was randomly fragmented into 350 bp pieces using a Covaris instrument, and libraries were constructed using the TruSeq Nano DNA HT Kit (Illumina). After concentration validation of the libraries, next-generation sequencing (NGS) was carried out on the DNBSEQ-T7 platform. All laboratory procedures were performed at the Smart Genomics Technology Institute (Tianjin, China). Raw sequencing data were processed with Fastp v1.0[29] for quality control, yielding clean reads. Mitogenomes were assembled by NOVOPlasty[30] using the reference accession NC_060420. Cross-validation of assembly was performed by MEANGS[31], while de novo assembly verification and initial gene annotation were accomplished by MitoZ v3.4[32,33]. The locations of the 22 canonical tRNAs were identified using tRNAscan-SE v2.0[34]. The PCGs, OL, and CRs were confirmed the start and end positions of these annotations by comparing with homologous sequences obtained from GenBank in Geneious Prime v2025. Translation check of the 13 PCGs was verified in MEGA v7.0[35]. Gene annotation files were generated with GB2sequin[36], and the final mitogenome map was produced on the online platform Proksee (
https://proksee.ca )[37].Nucleotide composition and genetic distance analysis
-
The genes and regions were extracted using PhyloSuite v18.0[38]. The nucleotide content, relative synonymous codon usage (RSCU), and genetic distances (uncorrected p-distance) between species/lineages were computed in MEGA v7.0[35]. The genetic distance was used as a surrogate for the evolutionary rate of genes, since the magnitude of genetic distance is positively correlated with the evolutionary rate[39,40]. Also, AT-skew or GC-skew was used to assess base preference and was computed with the formulas: AT-skew = (A − T)/(A + T) and GC-skew = (G − C)/(G + C)[41]. Finally, RNAfold (
http://rna.tbi.univie.ac.at ) and tRNAscan-SE v2.0[34] were used to predict the secondary structure of the RNAs.Selective pressure analysis
-
The average nonsynonymous substitution rate (Ka), synonymous substitution rate (Ks), and Ka/Ks ratio of each PCG were calculated in DnaSP v6[42]. Codon Usage Bias (CUB) indices evaluated the roles of mutations and natural selection[43,44]. The index used to influence CUB was calculated by CodonW v1.3 (
http://codonw.sourceforge.net ), including GC3, GCall, base composition at the third codon position (A3, T3, C3, G3), and the effective number of codons (ENC). The GC12 values were derived from CodonW v1.3 indices. The parity rule 2-bias plot (PR2-plot) analysis investigated the factors affecting CUB[45−47]. Neutrality-plot and ENC-plot analyses assessed the relative contributions and quantified the influence of mutation pressure and natural selection on CUB[48,49]. The expected ENC curve was derived according to Eq. (1)[46,49], and plots were generated using the online scientific graphing tool, Chiplot (www.chiplot.online ).$ \rm ENCex=2+{{GC}}_{3}+\dfrac{29}{{{{{GC}}_{3}}}^{2}{+\;(1-{{{GC}}_{3}})}^{2}} $ (1) Phylogenetic analysis
-
Phylogenetic trees were reconstructed using both Bayesian inference (BI) and maximum likelihood (ML) analysis. The sequences were aligned in MEGA 7.0 using the MUSCLE module[35] and exported as a combined dataset for constructing the phylogenetic tree. PartitionFinder v2.1.1[50] was used to select the optimal nucleotide partitioning schemes and substitution models based on the Akaike Information Criterion (AIC). The BI consensus tree was inferred in MrBayes v3.2[51] with four Markov chains (three heated chains and a single cold chain)[52], for 10 million generations, with sampling every 1,000 generations and a 25% burn-in[53]. Convergence was assessed in Tracer v1.7[54]. The nodal support of the BI tree was expressed as Bayesian posterior probabilities (PP), with PP ≥ 0.95 regarded as good support[55,56]. The MAP tree was summarized from the MCMC posterior sample in RevBayes v1.0[57], with all model parameters referenced to the MrBayes analysis but using only a single Markov chain. The ML tree was built in IQ-TREE v1.6.12[58], employing ultrafast bootstrap approximation over 1,000 replicates to assess branch support[59]. Branches with bootstrap support (BS) ≥ 75 were considered well supported[60]. Both phylogenetic trees were visualized and edited in FigTree v1.4[61]. Considering the alignment uncertainty, PhyG[62] was used for dynamic homology analysis to construct a parsimonious tree under dynamic homology[63]. All phylogenetic analyses were conducted using 13 PCGs and two rRNA genes.
Rearrangement analysis
-
Functional and duplicated tRNA genes within the WANCY region were identified using tRNAscan-SE v2.0[34], and the corresponding secondary structures were visualized in VARNA v3.39[64]. Pseudogenes and spacer sequences were detected by Geneious Prime v2025 (Free Trial Version).
-
A total of 19 mitogenomes were completely assembled and annotated, and all new data were deposited in NCBI (Table 1).
All the completed mitogenomes were circular molecules containing 37 canonical genes (Supplementary Table S1). One individual per species was selected for mitogenome mapping (Fig. 1). There was a marked difference in length between intraspecific and interspecific comparisons, which was mainly attributed to length variation in the control regions (CRs), the replication and rearrangement of the WANCY region, and the spacer between ND5 and ND6 (Supplementary Table S1).
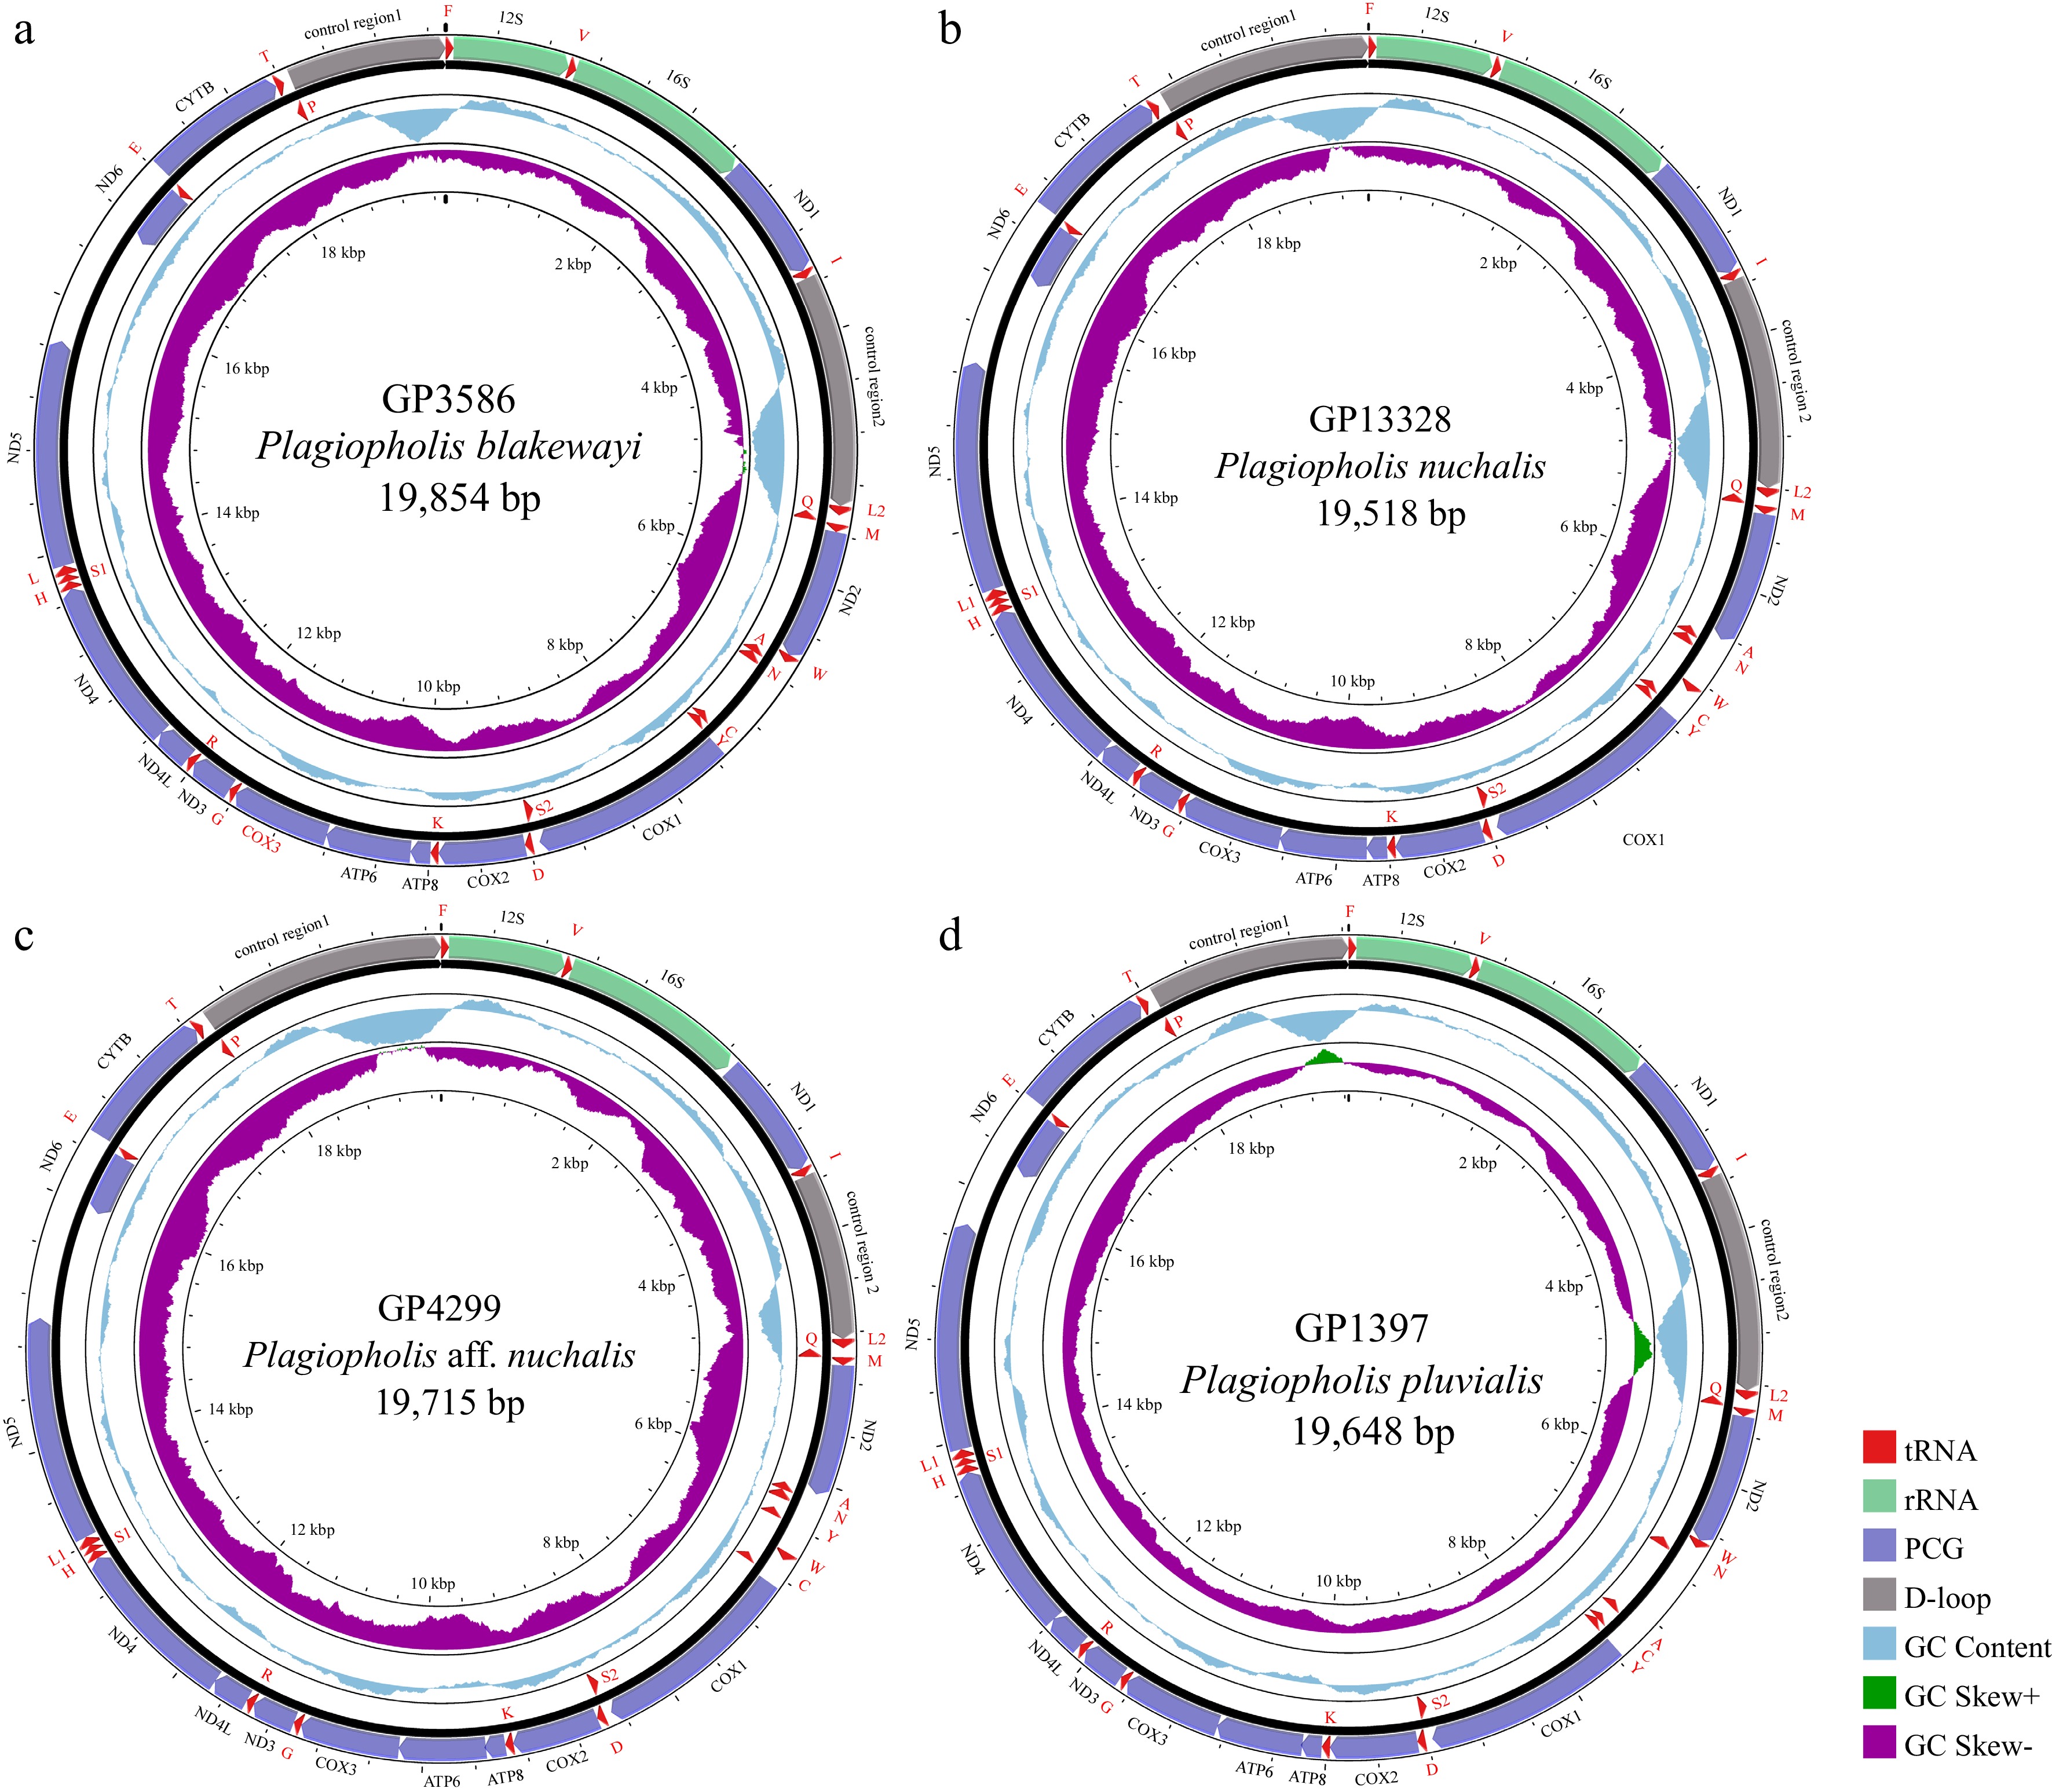
Figure 1.
Circular mitogenome maps of the representative individuals for (a) P. blakewayi, (b) P. nuchalis, (c) P. aff. nuchalis, and (d) P. pluvialis.
The average mitogenomic nucleotide content and skew of each species of Plagiopholis were presented in Fig. 2. Overall, the AT content exceeded 50%, indicating a high AT bias, while the AT-skew and GC-skew were positive and negative, respectively, suggesting a preference for nucleotides A and C. All individuals contained 22 types of tRNA genes, and except for the WANCY region where tRNA recombination occurred (details in Section 'Phylogenetics and WANCY region arrangement'), the number and order of other tRNA genes remained consistent between all individuals. The secondary structures of the rRNA genes of all individuals were predicted and compared. Results showed that the 12S and 16S sequences of each species and individual formed stem-loop structures with high conservation (Supplementary Figs S1 and S2). No long repeats (> 20 bp) were detected in CR1 and CR2, suggesting that CR expansion is unrelated to repetitive duplication.
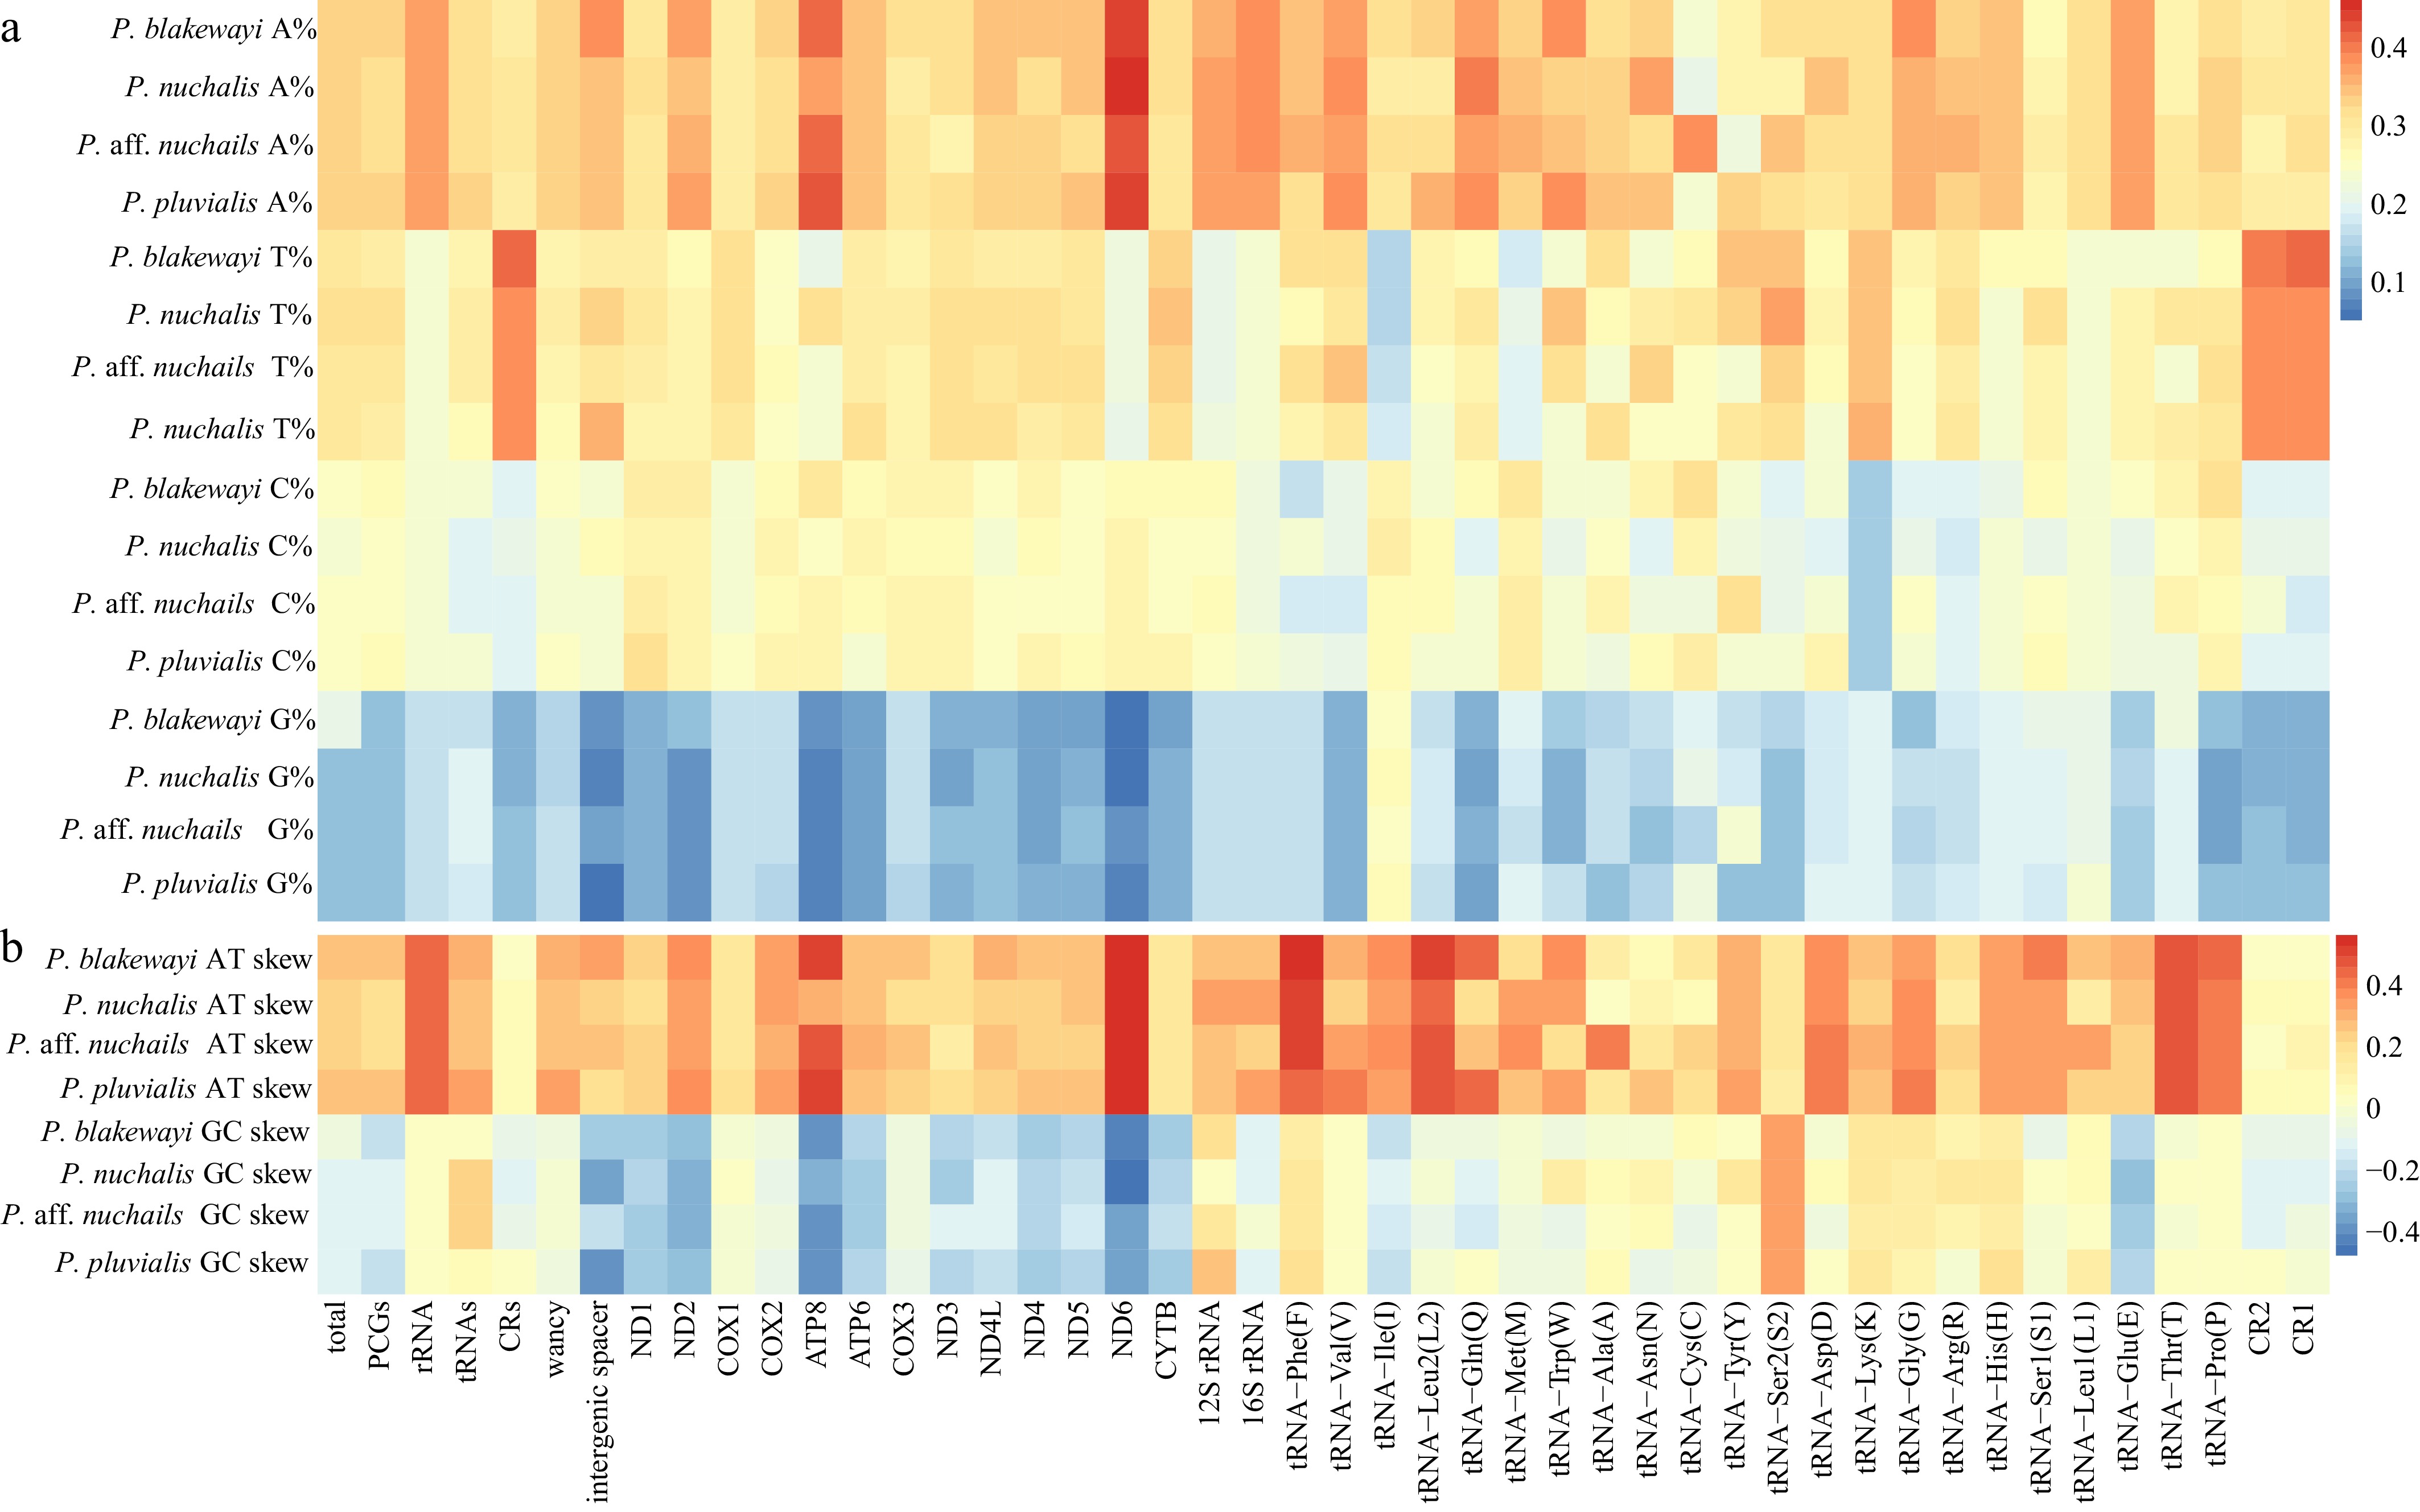
Figure 2.
Heatmap of (a) average mitochondrial nucleotide content and (b) skew for P. blakewayi, P. nuchalis, P. aff. nuchalis, and P. pluvialis. Left labels indicate nucleotide content and skew values for each species. X-axis labels indicate the genes and gene regions.
The total length of the PCGs of P. blakewayi, P. nuchalis, P. aff. nuchalis, and P. pluvialis were 11,283–11,300, 11,300, 11,297, and 11,293 bp, which encoded 3,750–3,753, 3,760, 3,759, and 3,754 amino acids, respectively. The start and stop codons of the PCGs were consistent in all species (Supplementary Table S2). The codons of Thr, Leu2, and Ile were presented in relatively large numbers (Fig. 3a), and the average RSCU revealed similar synonymous codon usage preferences across species (Fig. 3b).
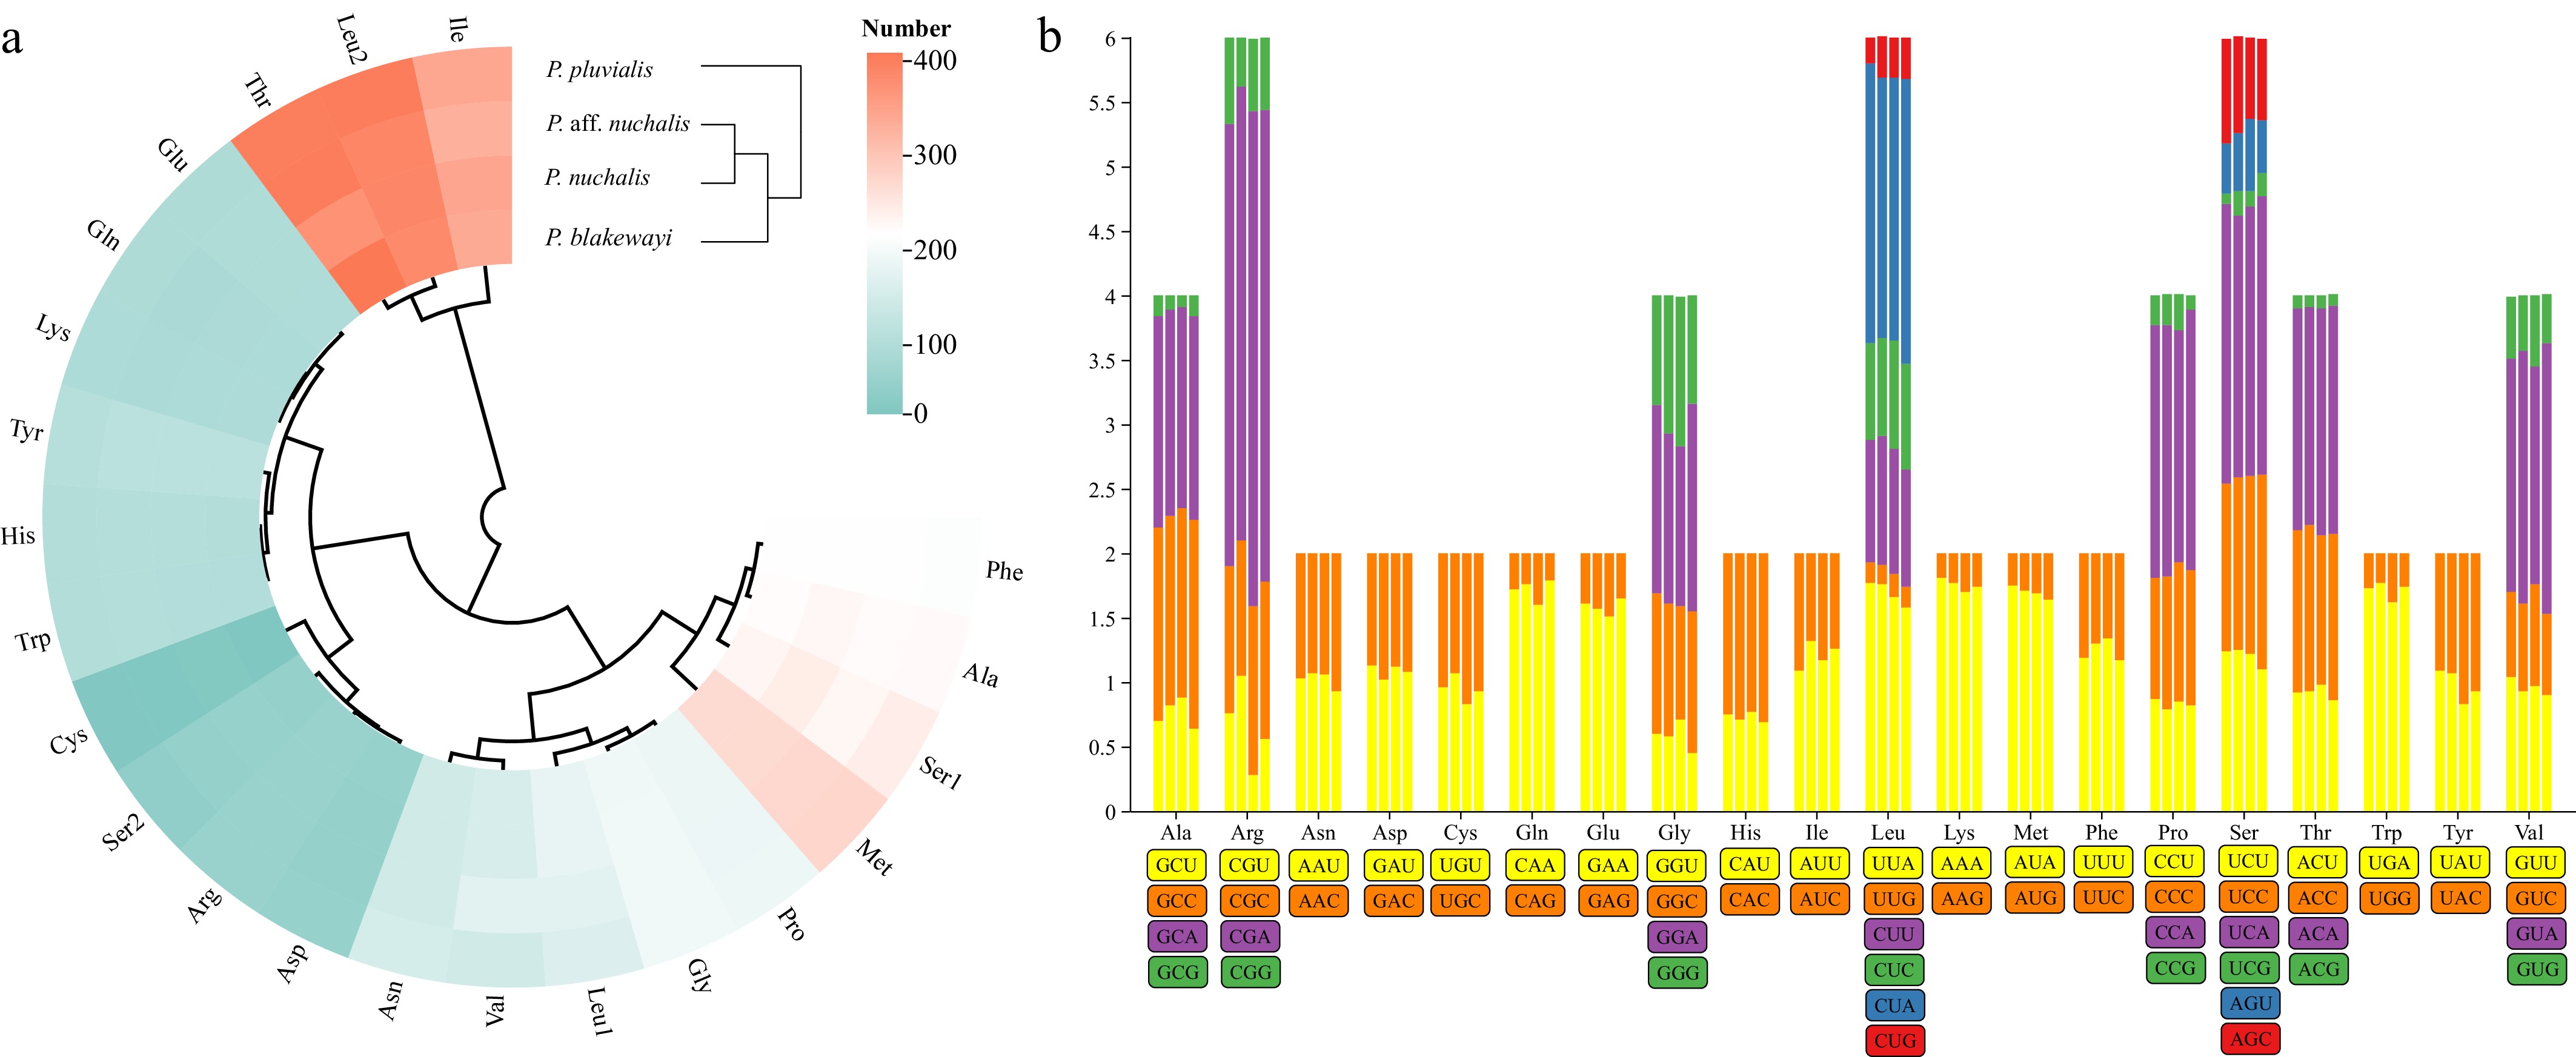
Figure 3.
(a) Cluster heatmap showing the amino acid usage preferences of PCGs; (b) RSCU features of PCGs for P. blakewayi, P. nuchalis, P. aff. nuchalis, and P. pluvialis. The RSCU values are plotted on the y-axis, with codon families shown on the x-axis.
Selective pressure
Nonsynonymous and synonymous substitution rate
-
The Ka/Ks values of all PCGs were less than 1 (Fig. 4a), indicating purifying selection over the course of evolution. The Ka/Ks values of ATP8, ND6, and ND2 were relatively higher than those of other PCGs.
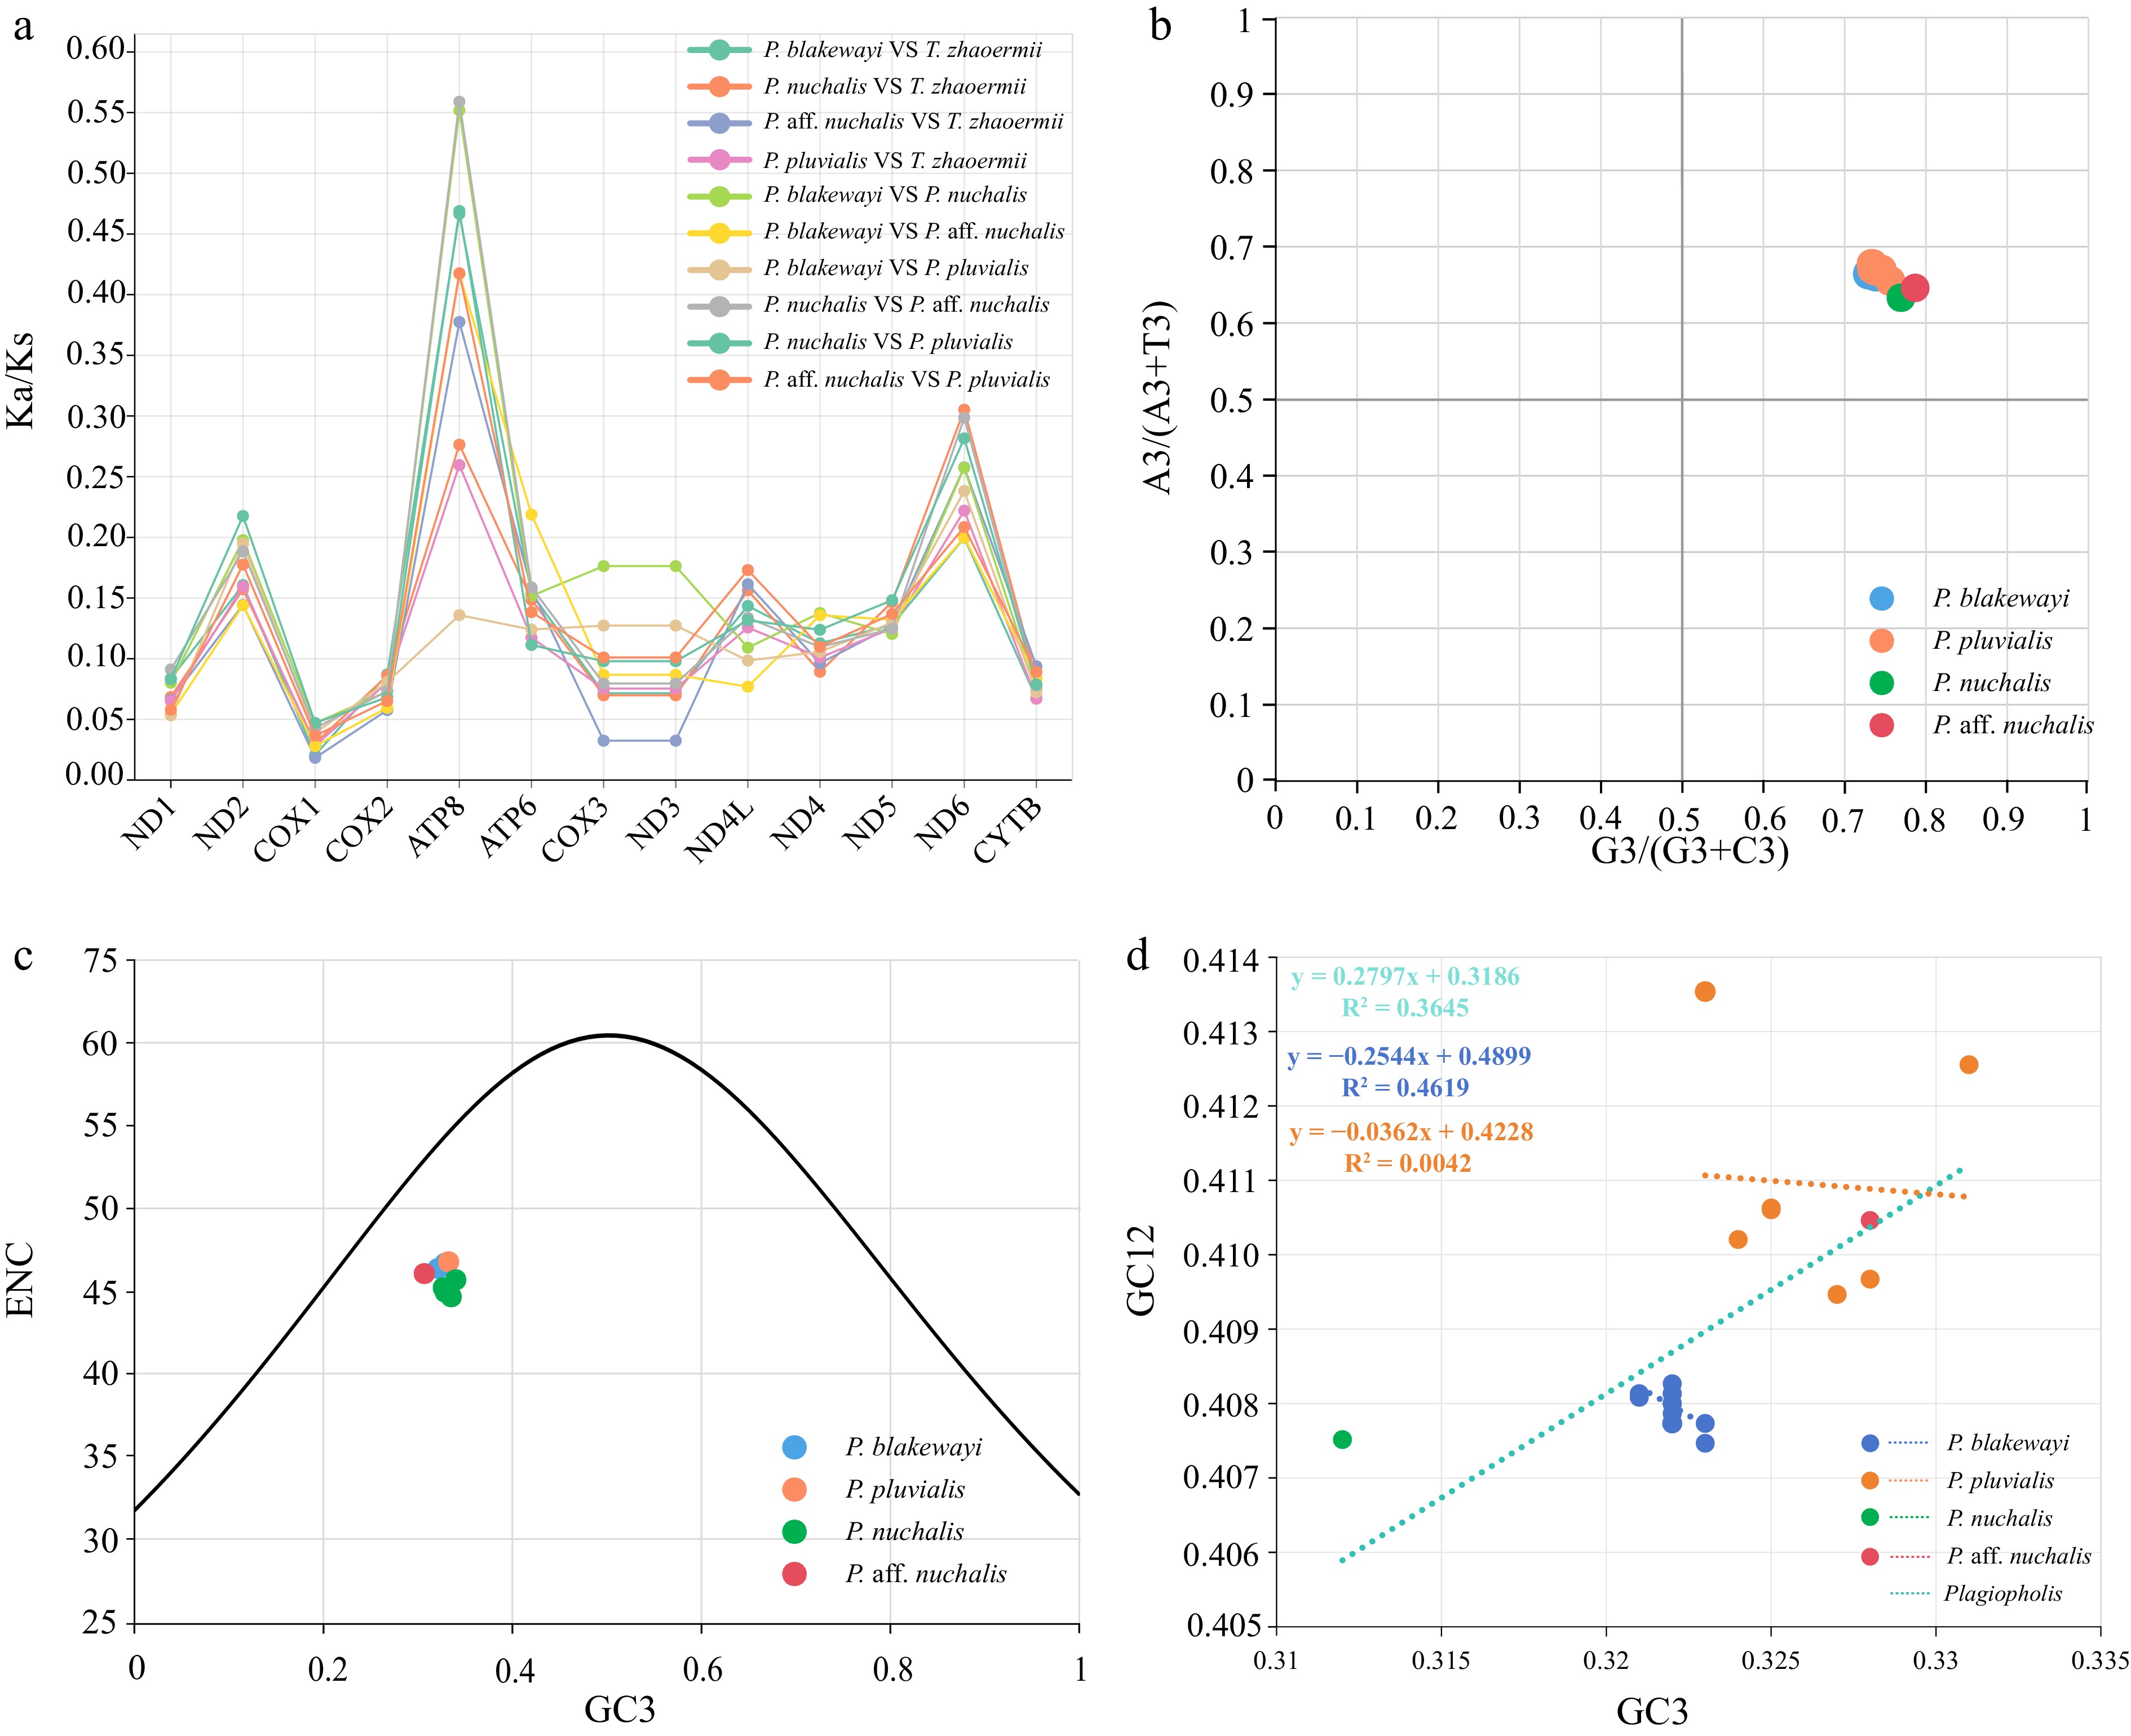
Figure 4.
(a) Ka/Ks ratios of Plagiopholis species and Thermophis zhaoermii. (b) PR2 plot based on the nucleotide composition of total PCGs. The center of the plot (A = U and G = C) indicates no deviation between mutation pressure and natural selection in codon usage. (c) ENC-GC3 plots based on the nucleotide composition of total PCGs. ENC values that fit the standard curve indicate mutation-driven codon usage; deviations reflect dominant selection pressure. (d) Neutrality plot of GC12 and GC3 content values within Plagiopholis species. The slope near 1 denotes dominant mutational pressure on CUB, while a slope close to 0 indicates predominant natural selection.
Mutational and natural selection pressure
-
The PR2 plot analysis showed a deviation of the plotted points from the center (Fig. 4b), indicating that CUB was affected by mutational pressure and natural selection. The ENC plot analysis showed that the data points were distributed below ENCexp (Fig. 4c), indicating that CUB was mainly driven by natural selection. All the regression coefficients of neutrality plot analyses were close to 0 (Fig. 4d), indicating that natural selection dominated the shaping of CUB at the interspecific and intraspecific levels. The CUB of each PCG was consistent with those obtained from the total PCGs (Supplementary Figs S3–S5).
Genetic distance and evolutionary rate
-
The evolutionary rates of each species indicated by genetic distances (Supplementary Table S3) were all as follows: ATP8 > ND4L > ATP6 > ND5 > ND3 > CYTB > ND4 > ND2 > ND6 > ND1 > COX3 > COX1 > COX2 > 16S > 12S.
Phylogenetics and WANCY region arrangement
-
The topologies of the BI and ML phylogenetic trees built from the static alignment are fully congruent. The BI phylogenetic tree showed that the monophyly of the genus Plagiopholis was highly supported (Fig. 5a). Within this genus, P. pluvialis was recovered as an independent lineage. Individuals of P. nuchalis and P. aff. nuchalis formed a clade and then formed a sister group to P. blakewayi. Both the MAP tree (Supplementary Fig. S6a) and the parsimonious tree under dynamic homology were greatly consistent with trees of BI and ML (Fig. 5c).
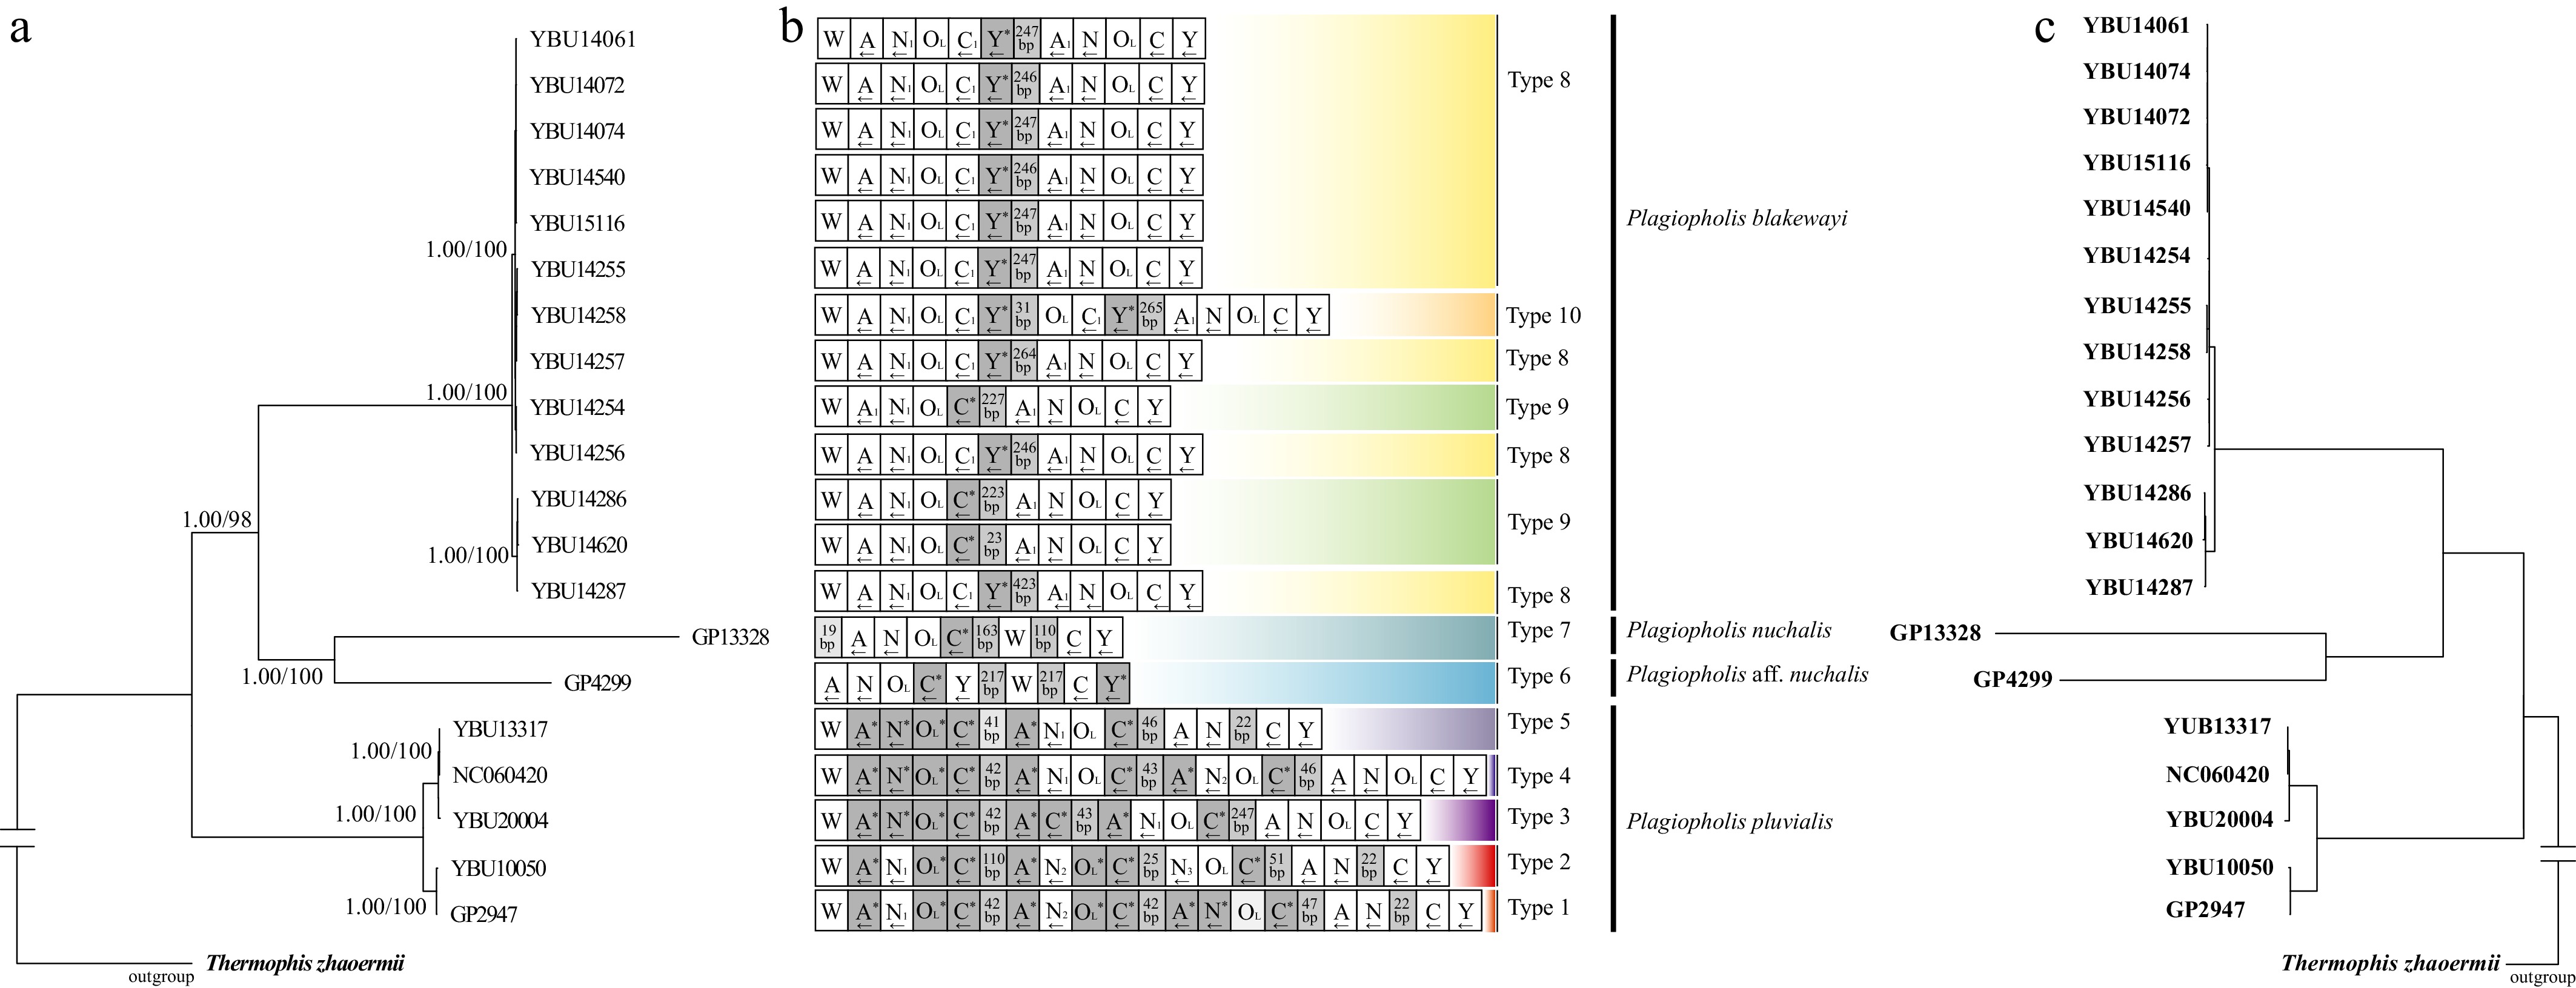
Figure 5.
(a) ML and BI phylogenetic tree inferred from static alignments of PCGs and rRNAs, with PP and BS values shown on each major node. (b) WANCY region arrangement types for each individual. Dark gray represents pseudo-tRNA genes and pseudo-OL, while light gray represents the number of intervening bases. (c) Parsimonious tree under dynamic homology from the PCG and rRNA datasets.
Individuals with close phylogenetic relationships exhibited similar or identical patterns of gene rearrangement and pseudogene types (Fig. 5b). The characteristics of the tandem repeats in the WANCY region were consistent with the TDRL model[3,12,19]. Based on the gene arrangement characteristics in the WANCY region, 10 rearrangement types were identified (Fig. 5b). The predicted secondary structures of the functional tRNA genes in the WANCY region revealed that those flanking the WANCY region conformed to the typical tRNA structural characteristics of serpents (Supplementary Figs S7–S10).
-
The mitogenomes of the Plagiopholis species exhibited distinct common characteristics in (1) a high AT content; (2) a preference for the nucleotides A and C; and (3) the codon usage bias of PCGs toward A and U. The hydrogen bonds between A-T base pairs were inherently weaker than those of G-C pairs, while the nucleotides A and G are particularly susceptible to interconversion through deamination or other chemical modifications[67−69]. These features reduced the stability of the DNA duplex, thereby enhancing its susceptibility to mutations that drove the structural variations observed in the Plagiopholis mitogenomes[41,70,71], and laid a mechanistic foundation for gene rearrangement events. Although there were no significant differences in the nucleotide characteristics of these mitogenomes, the morphology of the WANCY region was the main distinguishing characteristic among the mitochondrial genomes of each Plagiopholis species. The WANCY region of P. nuchalis and P. aff. nuchalis was rearranged to ANWCY, with only one or two tRNA pseudogenes. In contrast, the W and ANCY segments in P. blakewayi contained numerous duplicated tRNA genes with only one or two tRNA pseudogenes, while P. pluvialis contained relatively numerous duplicated tRNA genes and tRNA pseudogenes.
Compared with the structure of other snake families[18,21], the distinct mitogenomic features of Plagiopholis were especially the gene rearrangements of the WANCY region, an abnormally elongated control region, and the presence of a spacer region between ND5 and ND6. The evolutionary rates of PCGs near these abnormal structures were relatively slow, and their emergence may not be affected by the evolution of PCGs but rather by natural selection pressure. The three unusual structures were approximately 2,500–3,000 bp longer than those of typical snake mitogenomes; this anomaly was also observed in the con-familial genus Pseudoxenodon[72], suggesting that this feature may have evolved in a common ancestor of the Pseudoxenodontidae.
tRNA gene characteristics and hypothesized formation mechanism of the WANCY region
-
Based on molecular phylogenetic analysis and secondary structure prediction, two mechanisms and processes could underlie the loss of tRNA functionality and pseudogenization of Plagiopholis: (1) base transitions, deletions (primarily within the DHU loop and DHU stem), and insertions (primarily in the amino acid arm) in tRNA sequences resulted in destabilization or disruption of the secondary stem-loop structure and led to aberrant tertiary conformation[73,74]; (2) base mutations in the anticodon region resulted in the loss of normal aminoacyl transport function[75].
The WANCY region located between the ND2 and COX1 was a well-recognized evolutionary hotspot for mitogenomic rearrangement in serpents[3,71]. Both ND2 and COX1 were core subunits of the mitochondrial oxidative phosphorylation (OXPHOS) system[76]. Consistent with their functional importance, both genes exhibited moderate-low evolutionary rates and Ka/Ks ratios, indicating strong purifying selection acting on these conserved PCGs. Purifying selection ensured that any function-altering mutations were rapidly eliminated or repaired, thereby maintaining the fidelity of gene expression and the normal function of the OXPHOS system[77]. Conserved PCGs typically exhibited high transcriptional activity and repair capacity[78], and the tRNA genes adjacent to these conserved protein-coding regions might encode repair functions. This conferred greater stability upon the tRNA genes within the WANCY region[67] and prevented the pseudogenes from being lost completely.
Comparisons of WANCY and CRs
-
The mitogenomes of Plagiopholis resembled the WANCY region gene arrangement of Quasipaa boulengeri, a well-studied amphibian in herpetology[15]. For example, both were A-T rich, exhibited a characteristic Trp-Ala-Asn-Cys-Tyr gene order, and contained identical gene duplications and pseudogenes within the WANCY region. This conserved gene order reflected an ancestral functional constraint on the WANCY region across chordates, as these tRNAs remained tightly linked to the flanking ND2 and COX1 genes during OXPHOS-associated translation[79]. In addition, in the evolutionary process of the WANCY tandem repeat region, mutations frequently occur in the middle, while fewer mutations were observed at the two ends of the WANCY region. This mutational pattern was attributed to the stronger purifying selection acting on the terminal regions adjacent to conserved PCGs[80].
Previous studies demonstrated considerable variation in the CRs of species in the venomous snake family Elapidae[81]. Notably, the mitogenomic CRs of Plagiopholis and those of the Elapidae were abnormally long compared to most other snake lineages. This was associated with greater regulatory flexibility in mitogenomic replication and transcription, a trait often interpreted as an adaptive response to environmental stressors[8,82]. However, distinct differences also existed between these two taxonomic groups: (1) No repeated sequences were detected in Plagiopholis, possibly due to random loss of partial sequences following duplication-driven expansion, such that residual duplicated fragments could no longer be distinguished under the current evolutionary state[82]. (2) The CRs of Elapid species (E. ijimae, H. ornatus, and H. melanocephalus) were equal in length to or markedly longer than those of Plagiopholis, suggesting convergent evolutionary pressures on mitogenomic structure across distantly related lineages[10].
Hypothesis for spacer between ND5 and ND6
-
The spacer sequence between ND5 and ND6 of Plagiopholis does not encode any functional genes and has no homologous sequences within the mitogenome. Evidence of convergent evolution suggests that ancestral Plagiopholis experienced unique environments. Intense selective pressure accelerated mitogenomic mutations and rearrangements, resulting in lineage-specific structural features[10]. If the hypothesis was valid, then the spacer between ND5 and ND6 may have originated from the CR, as in Antarctic notothenioid fishes[8,83]. Also, after duplication of the CR regions, sequences were randomly lost and repaired during the evolutionary process[10,84].
Phylogeny reconstruction and molecular divergence
-
At the interspecific level, both the MAP tree and the dynamic homology tree were topologically congruent with the BI and ML trees for the Plagiopholis species. The reconstructed phylogenetic relationships were also generally congruent with previous work built on the mitochondrial gene cytb[26,84]. Although the methodological differences in alignment, optimality criteria, and tree-summary strategies were insufficient to resolve the polytomy inconsistencies caused by low genetic distances, they indirectly point to a recent common maternal origin for these P. blakewayi individuals and further support the robustness of our species-level phylogenetic inferences.
Of particular note, a newly collected sample (GP4299) exhibited a great genetic distance (COI and p-distance) ranging from 0.114 to 0.125, which is much larger than those of most snake pairs[26], suggesting this sample may represent an undescribed taxon. Unfortunately, the specimen was road-killed and partially damaged, which prevented a thorough morphological examination and description. The collection of additional voucher specimens in future studies will be essential for clarifying its systematic position.
-
This study explored the mitogenome characteristics and gene rearrangements of three species of Plagiopholis. The mitogenomes exhibited a high AT content, a marked preference for nucleotides A and C, and PCGs under both natural and purifying selection pressure. Notably, gene rearrangements were characterized by tandem duplications within the WANCY region, abnormal CR lengths, and the emergence of a spacer between the ND5 and ND6 genes. Phylogenetic analyses based on multiple methods recovered congruent interspecific relationships for the genus Plagiopholis, supporting the current species delimitation.
These findings revealed considerable interspecific genetic diversity within the genus Plagiopholis, and the observed rearrangement patterns offer novel insights into the evolutionary dynamics of snake mitochondrial genomes.
We would like to thank many people for sample collection, they are Zhong GH, Li K, Zhu F, Li L, Zhang H, Xie YL, and Wang P.
-
All materials used in this study conformed to international and national legal requirements. All experimental procedures were performed in strict accordance with the guidelines set out in the Life Science Ethics Committee Approval Form of Yibin University (Protocol No. YBU2025001; approval date: 12 January 2025).
-
The authors confirm contribution to the paper as follows: study conception and design: Fu C, Guo P, Dong B; data collection and curation: Fu C, Wu Y, Guo P, Dong B; analysis and interpretation of results: Fu C, Zhang J, Tan S, Yu M; investigation: Tan S, Lyu B, Dou L, Shu G, Wu Y; methodology: Fu C, Zhang J, Tan S, Yu M, Dong B; visualization: Fu C, Zhang J, Yu M, Guo P; draft manuscript preparation: Fu C, Zhang J, Tan S; writing − review and editing: Guo P, Dong B. All authors reviewed the results and approved the final version of the manuscript.
-
The data that support the findings of this study are available from the corresponding author upon reasonable request. The datasets supporting the conclusions of this article are available in the GenBank repository (www.ncbi.nlm.nih.gov), accession numbers PX932988–PX933006.
-
The authors declare that they have no conflict of interest.
-
accompanies this paper online at: https://doi.org/10.48130/jzser-0026-0017.
- Supplementary Table S1 Mitogenomic features of the specimens analyzed in this study.
- Supplementary Table S2 The lengths of total, the CR, WANCY region, and the intergenic spacer between ND5 and ND6.
- Supplementary Table S3 Genetic distance (p-distance) of Plagiopholis species based on 13 PCGs and rRNAs.
- Supplementary Fig. S1 12S rRNA secondary structure diagrams of P. blakewayi (a), P. nuchalis (b), P. aff. muchalis (c) and P. plvialis (d).
- Supplementary Fig. S2 16S rRNA secondary structure diagrams of P. blakewayi (a), P. nuchalis (b), P. aff. muchalis (c) and P. plvialis (d).
- Supplementary Fig. S3 PR2-Plot of 13 PCGs of 22 individuals within Plagiopholis species.
- Supplementary Fig. S4 ENC-GC3 plots of 13 PCGs of 22 individuals within Plagiopholis species.
- Supplementary Fig. S5 Neutrality plot analysis results of GC12 and GC3 content values of 13 PCGs of 22 individuals within Plagiopholis species.
- Supplementary Fig. S6 (a) MAP tree inferred from static alignments of PCGs and rRNAs, with the highest values shown on each major node. (b) ML and BI phylogenetic tree inferred from static alignments of PCGs and rRNAs, with PP and BS values shown on each major node. (c) WANCY regions arrangement types of each individual. Dark gray represents pseudo tRNA genes and pseudo OL, while light gray represents the number of intervening bases. (d) Parsimonious tree under dynamic homology from the PCGs and rRNA datasets.
- Supplementary Fig. S7 Schematic diagram of the secondary structures of functional tRNA-Ala gene and tRNA-Ala pseudogene.
- Supplementary Fig. S8 Schematic diagram of the secondary structures of functional tRNA-Asn gene and tRNA-Asn pseudogene.
- Supplementary Fig. S9 Schematic diagram of the secondary structures of functional tRNA-Cys gene and tRNA-Cys pseudogene.
- Supplementary Fig. S10 Schematic diagram of the secondary structures of functional tRNA-Tyr gene and tRNA-Tyr pseudogene.
- This is an open access article under the terms of the Creative Commons Attribution License, which permits use, distribution and reproduction in any medium, provided the original work is properly cited.
-
About this article
Cite this article
Fu C, Zhang J, Tan S, Yu M, Lyu B, et al. 2026. Comparative mitogenomics of three Plagiopholis (Squamata: Pseudoxenodontidae) species and new insights into the snake mitochondrial genome evolution. Journal of Zoological Systematics and Evolutionary Research 2026: e017 doi: 10.48130/jzser-0026-0017 

Comparative mitogenomics of three Plagiopholis (Squamata: Pseudoxenodontidae) species and new insights into the snake mitochondrial genome evolution
- Received: 01 May 2026
- Revised: 01 September 2026
- Accepted: 11 September 2026
- Published online: 09 October 2026
Journal of Zoological Systematics and Evolutionary Research
2026,
Article number: e017 (2026)
|
Cite this article
Abstract: Mitogenome characteristics can clarify an organism’s evolutionary history. This study analyzed and compared the mitochondrial genomes of three Plagiopholis species. These mitogenomes exhibited the following distinct characteristics: (1) a size range of 19,096 to 20,094 bp; (2) encoding 37 typical mitochondrial genes; (3) a high AT content exceeding 50%; (4) a compositional bias for A and C; (5) preferential usage of the amino acids Thr, Leu2, and Ile in protein-coding genes; (6) two exceptionally long control regions; (7) gene rearrangement events within the WANCY region; and (8) presence of a spacer between ND5 and ND6. Evolutionary analyses revealed that the mitogenomic evolution of Plagiopholis was mainly shaped by purifying selection and natural selection pressure. Among the mitochondrial genes, ATP8 exhibited the fastest evolutionary rate, while 12S RNA evolved the slowest. Ten types of gene rearrangements were detected in the WANCY region across all individuals, and these rearrangements were consistent with TDRL. This first mitogenomic analysis of the genus Plagiopholis offers new perspectives on snake mitogenome evolution.
-
Key words:
- Plagiopholis;
- Mitogenome;
- Gene arrangement;
- WANCY;
- Snakes