












-
Type 1 diabetes in childhood and adolescence is a condition requiring daily complex management and a close therapeutic and behavioral partnership between parents and the child[1]. Parental competence is essential to achieve optimal glycemic control and to prevent or appropriately manage acute complications[2,3], such as hypoglycemic episodes[4−6] and diabetic ketoacidosis[4,7]. From diagnosis, parents must be adequately trained to recognize and promptly manage these potential life-threatening events[8,9]. These constant demands place a significant emotional burden on parents, contributing to high levels of distress that may interfere with effective care[10,11].
While the moment of diagnosis is widely recognized as the most traumatic for parents, parental adaptation to the child's condition is highly individualized and may vary considerably in duration[12]. In chronic illness, where cure is not achievable, the primary therapeutic goal becomes adaptation and the maintenance of a satisfactory quality of life. This process is influenced by both internal and external resources and obstacles. Successful adaptation is associated with improved psychological well-being, reduced diabetes-related concerns, increased confidence in the child's future, and greater parental self-efficacy.
Within diabetology, various educational approaches have been developed to support disease management skills. Diabetes camps represent a well-established modality for children and adolescents with type 1 diabetes, often involving parents/caregivers, and have been shown to improve metabolic control, knowledge of acute complication management, quality of life, and psychosocial outcomes for children/adolescents[13]. However, these programs mainly focus on clinical aspects and the child's role, sometimes overlooking the parents' emotional experience. Experiential group programs for parents may better address these needs and improve adaptation.
The Body Emotional Maps (BEM) program is an experiential group intervention for parents of children with chronic illness, facilitated by trained practitioners. It includes relaxation techniques, breathing exercises, guided visualizations, Neuro-Linguistic Programming (NLP) strategies, problem-solving interventions, body and emotional awareness exercises, and interactive discussions[14].
The BEM methodology aims to improve parental adaptation, process diagnostic trauma, and reduce distress and fear of hypoglycemia. In a preliminary single-arm pre–post study, the BEM method reduced parental stress at three-month follow-up[14].
The present study aimed to evaluate the impact of the BEM method on stress and well-being among parents of children/adolescents with type 1 diabetes, compared with a standard group-based therapeutic education (control group).
-
Randomized, open-label, multicenter comparative trial (ClinicalTrials.gov ID NCT07098689). After verification of eligibility criteria, parents were assigned via centralized web-based randomization to either the BEM group intervention or the control group (1:1). If both parents were eligible, they were allocated to the same study arm. Randomization was stratified by center.
The primary endpoint was the between-group difference in the Parental Stress Index Short-Form (PSI-SF) score changes at three months (T3) after participation in the group activities compared with baseline.
Secondary endpoints included the following between groups differences at T3 and T6 vs T0:
Individual PSI-SF subscales (Parental Distress, Parent–Child Dysfunctional Interaction, Difficult Child);
Patient Health Questionnaire (PHQ-9) score for the assessment of depressive symptoms;
Generalized Anxiety Disorder scale (GAD-7) score for the assessment of anxiety symptoms;
Brief Pittsburgh Sleep Quality Index (B-PSQI) score for the assessment of sleep disturbances;
Parental Self-Efficacy for the Management of Diabetes Mellitus (PSESDM) score for the assessment of perceived self-efficacy in managing the child's diabetes;
Coping Orientation to the Problems Experienced – New Italian Version (COPE-NVI) score for the assessment of parental adjustment and coping strategies;
Children's/adolescents' glucometric data (Time in Range [TIR], Time Above Range [TAR], Time Below Range [TBR], HbA1c, average glucose levels, glycemic variability);
PSI-SF score changes at six months (T6) after participation in the group activities compared with baseline (T0);
Within group changes of questionnaire scores at T3 and T6 vs T0 were also assessed.
Inclusion criteria were: parents of children and adolescents under 18 years, with type 1 diabetes of more than 12 months' duration; adequate understanding of the Italian language, willing to actively participate in the experiential group activities and complete all questionnaires; signed informed consent from the participating parent; signed informed consent for the processing of the minor's data by both parents (when applicable). The following exclusion criteria were applied: parent with a psychiatric disorder; parents of children with any diagnosed psychiatric or behavioral disorders; parent with any condition that, in the clinician's judgment, could impede active participation in the experiential group activities.
Study interventions
-
Both study groups participated in three-day residential programs, immersed in a natural environment, but with different content. The group activities were conducted under the supervision of specifically trained healthcare personnel, and basic information was provided on diabetes management both to BEM and to the control group.
The staff supervising the camps received dedicated training by professionals with BEM method expertise, during a two-day weekend course (8 h/d).
The BEM method involves a group-based intervention for parents of children with diabetes, aimed at promoting parental adaptation to their child's 'diabetes condition'[14], and is structured into three sessions. The first session focuses on introductions and group formation. The second includes the narration of the child's diabetes onset, the identification of the most challenging aspects of daily management, and the main change the parent wishes to achieve. The third session consists of the BEM pathway, which includes guided visualization and the spatial anchoring map. This session is conducted partly in plenary format and partly in smaller subgroups, ensuring that each participant has sufficient time to connect with deeper personal experiences and express themselves. A detailed description of the BEM method is provided in Appendix 1.
The control intervention consisted of a three-day residential diabetes camp conducted in the same type of natural setting and with a duration comparable to that of the BEM camp. Parents received basic educational information on diabetes management and participated in facilitated group discussions, informal peer interactions, and recreational activities. These activities provided opportunities for sharing experiences and mutual support but did not include the structured experiential techniques specific to the BEM intervention, such as guided visualization, spatial anchoring, body and emotional awareness exercises, or structured processing of diabetes-related experiences. Each group activity involved 25 parents.
Study procedures
-
Parents were informed about the study and, after verification of eligibility criteria, were invited to provide written informed consent during one of their child's routine clinic visits. Subsequently, they were assigned via centralized web-based randomization to either the BEM or control group intervention.
After enrollment, parents received access to the study web platform to complete the required questionnaires. Socio-demographic information and the child's clinical data were collected at baseline.
Parents then participated in either the BEM or standard group activity.
Questionnaires were repeated after three- and six-month group activity. Children's glucometric data were derived from continuous glucose monitoring (CGM) measurements and extracted from the electronic medical records available at the participating diabetes centers.
Study questionnaires
-
At baseline, T3 and T6 participants completed the following questionnaires: PSI-SF[15], PHQ-9[16−19], GAD-7[20−23], B-PSQI[24], PSESDM[25], and COPE[26]. (Description in Appendix 2).
Children's/adolescents' glucometric data
-
The following glucometric indices were assessed at baseline and after three and six months: HbA1c, TIR (time spent with glucose levels between 70 and 180 mg/dl), TBR level 1 (time spent with glucose levels < 70 mg/dl) and level 2 (time spent with glucose levels < 54 mg/dl), TAR level 1 (time spent with glucose levels > 180 mg/dl) and level 2 (time spent with glucose levels > 250 mg/dl), average blood glucose levels, coefficient of variation of blood glucose levels.
Insulin treatment modality was classified into mutually exclusive categories as multiple daily injections (MDI), conventional continuous subcutaneous insulin infusion (CSII) without automated insulin delivery, and automated insulin delivery (AID) systems integrating CGM data with algorithm-driven adjustment of insulin delivery.
Statistical analysis
-
The primary efficacy assessment evaluated differences between the study arms in the change in PSI-SF score from baseline to three months. Changes in PSI-SF scores between the two groups were assessed using effect size, defined as the difference in mean score change divided by the pooled baseline standard deviation. An effect size of ≥ 0.5 is widely considered clinically meaningful[27]. In the previous study[14], baseline PSI-SF values were 75.4 ± 2.5; therefore, an effect size of 0.5 would correspond to a between-group difference of 1.25. To detect an effect size of at least 0.5 with 80% statistical power (α = 0.05), it was necessary to evaluate at least 64 parents per group. Assuming a 15% dropout rate, a total of 150 parents (75 per group) was planned for enrollment.
All participants included in the study were analyzed. No missing data imputation was performed.
Descriptive data are expressed as mean and standard deviation for continuous variables, and as percentages for categorical variables.
Group comparisons for descriptive variables were performed using Student's t-test or the Mann–Whitney U test for continuous variables, and the chi-square test or Fisher's exact test for categorical variables.
For the primary endpoint, the secondary endpoints related to questionnaire scores, and glucometric measures, the comparison between study arms was performed using mixed models for repeated measures (MMRM), which included the baseline outcome value as a linear covariate and the study arm as a fixed effect. MMRMs account for within- and between-subject correlation through a variance-covariance matrix with a first-order autoregressive structure.
MMRMs were also used to assess the differences at three and six months compared with baseline within each study arm. Results are expressed as estimated means and estimated mean differences with corresponding 95% confidence intervals.
In addition to the evaluation of the overall sample, analyses were also performed separately by parent sex, by age of the children/adolescents (≤ ten years and > ten years), and by the use of AID.
Ethical aspects
-
This study was conducted in accordance with the Declaration of Helsinki regarding medical research involving human subjects (Declaration of Helsinki – Ethical Principles for Medical Research Involving Human Subjects – 64th WMA General Assembly, Fortaleza, Brazil, October 2013), in compliance with the protocol, Good Clinical Practice (GCP), the General Data Protection Regulation (GDPR), and applicable Italian regulations.
The study was approved by the Independent Ethics Committee responsible for each participating center.
Before participating in the study, a signed informed consent was obtained from each parent. By signing the informed consent, parents also provided authorization for the processing of their own personal data and those of their child with type 1 diabetes.
-
Six pediatric diabetology centers participated in the study. A total of 101 eligible children were identified, and 177 parents were enrolled and randomized. Of these, 38 were unable to attend the camp; therefore, the study sample consisted of 139 parents of 80 children, of whom 69 were assigned to the BEM camp and 70 to the traditional camp (flow chart in Supplementary Fig. S1). In the BEM group, there were 29 parent couples and 11 single parents (eight mothers and three fathers), while in the control group there were 30 parent couples and ten single parents (nine mothers and one father). The educational camps were held between April and November 2024.
Children's socio-demographic and clinical characteristics (n = 80) are reported in Table 1. No statistically significant differences emerged between the two groups, although the children of parents assigned to the traditional camp were slightly older on average (12.1 years vs 10.5 years) and were more often treated with AID systems and less often with multiple daily injections of insulin. No significant differences were observed in metabolic control or in glucometric indices, with a mean TIR of 70.2 in the BEM group and 65.9 in the control group. No episodes of severe hypoglycemia or ketoacidosis were recorded in the 12 months preceding the study. Overall, 38.9% of the children had previously attended diabetes camps (an average of 2.3 ± 1.4 times).
Table 1. Characteristics of the children/adolescents included in the study.
Characteristics BEM Control p* n 40 40 Sex 0.65 Males 57.5% 52.5% Females 42.5% 47.5% Age (years) 10.5 ± 3.9 12.1 ± 3.3 0.06 Education level Primary school 35.3 23.7 Middle school 35.3 36.8 High school 29.4 39.5 Ethnicity 1 Caucasian 100% 97.5% Other − 2.5% Type 1 diabetes duration (years) 4.9 ± 3.2 5.0 ± 3.0 0.70 Type of insulin administration 0.42 CSII (Continuous subcutaneous
insulin infusion)10.0% 5.0% SAP (Sensor-augmented pump) 5.0% 5.0% AID (Automated insulin delivery) 55.0% 72.5% MDI (Multiple Daily Injections) 30.0% 17.5% Type of fast-acting insulin 0.68 Regular human insulin 11.8% 4.0% Aspart 5.9% 12.0% Lispro 82.4% 84.0% Type of basal insulin 0.20 Glargine U100 71.4% 30.0% Glargine U300 28.6% 40.0% Degludec 0.0% 30.0% Last value of HbA1c (%) 6.7 ± 0.7 7.0 ± 0.6 0.14 Method used for glucose monitoring 0.19 FGM (Flash glucose monitoring) 2.5% 10.8% CGM (Continuous glucose monitoring) 97.5% 89.2% Glucometric indices (if CGM) Time in range (70−180 mg/dl) 70.2 ± 9.2 65.9 ± 15.8 0.39 Time below range (TBR) level 1 (< 70 mg/dl) 2.2 ± 2.0 2.2 ± 4.5 0.15 TBR level 2 (< 54 mg/dl) 0.7 ± 0.9 1.8 ± 8.5 0.11 Time above range (TAR) level 1 (> 180 mg/dl) 20.2 ± 7.0 22.3 ± 9.5 0.51 TAR level 2 (> 250 mg/dl) 6.9 ± 5.8 7.7 ± 7.5 0.67 Average blood glucose level (mg/dl) 152.9 ± 17.1 159.8 ± 23.1 0.27 Coefficient of variation (%) 36.3 ± 5.2 34.3 ± 5.9 0.09 Hospitalizations for hypoglycemia
in the past 12 months0 0 − Hospitalizations for ketoacidosis
in the past 12 months0 0 − Episodes of severe hypoglycemia requiring
glucagon administration due to loss of
consciousness or seizures (without
hospitalization)0 0 − Diabetes complications 0 0 − Other chronic diseases Celiac disease 12.5% 5.3% 0.43 Thyroiditis 5.1% 5.3% 1 Data are expressed as frequencies (%) or mean ± SD. * Chi-square test or Fisher's exact test for categorical variables and Mann–Whitney U test for continuous variables. p-values < 0.05 are considered statistically significant. AID, automated insulin delivery; BMI, body mass index; CGM, continuous glucose monitoring; CSII, continuous subcutaneous insulin infusion; CV, coefficient of variation; HbA1c, glycated hemoglobin; MDI, multiple daily injections; TAR, time above range; TBR, time below range; TIR, time in range. Socio-demographic characteristics of parents participating in the study are reported in Table 2. No significant differences emerged between the two study arms.
Table 2. Characteristics of parents participating in the study.
Characteristics BEM Control p* n 69 70 Civil status 0.25 Single 0.0% 2.5% Married/cohabiting 86.5% 92.5% Separated/divorced 13.5% 5.0% Mother's age 43.2 ± 5.0 44.6 ± 7.3 0.19 Mother's educational level 0.56 Middle school diploma 8.1% 12.8% High school diploma 48.6% 56.4% University degree 43.2% 30.8% Mother's employment status 0.69 Employed 75.7 79.5 Unemployed 24.3 20.5 Retired − − Father's age 46.1 ± 5.8 48.6 ± 7.1 0.12 Father's educational level 0.44 Middle school diploma 11.1% 22.2 High school diploma 55.6% 47.2 University degree 33.3% 30.6 Father's employment status 1 Employed 97.2% 97.2% Unemployed 2.8% 0.0% Retired 0.0% 2.8% Other family members with type 1 diabetes 17.5% 16.2% 0.88 Data are expressed as frequencies (%) or mean ± SD. * Chi-square test or Fisher's exact test for categorical variables and Mann–Whitney U test for continuous variables. p-values < 0.05 are considered statistically significant. Overall, 131 and 124 parents completed the questionnaires at three and six months, respectively (T3: BEM arm 64 and control arm 67; T6: BEM group 57, control group 67).
Table 3 reports the results for the primary endpoint and the secondary endpoints. Both the within-arm changes in scores and the between-arm comparisons of these changes are presented.
Table 3. Study results for the primary endpoint and secondary parent-related endpoints: outcomes at three months and six months after participation in the camp.
Endpoint Time BEM Control Estimated mean
levels (95% CI)Estimated mean difference
from T0 and 95% CIp-value* Estimated mean
levels (95% CI)Estimated mean difference
from T0 and 95% CIp-value* PSI-SF (total) T0 73.9 (69.0; 78.7) 80.6 (75.8; 85.5) Primary Endpoint T3 69.9 (64.7; 75.1) −3.9 (−7.4; −0.4) 0.03 77.7 (72.6; 82.7) −3.0 (−6.3; 0.4) 0.08 T6 65.4 (60.4; 70.5) −8.4 (−12.4; −4.4) < 0.0001 72.9 (68.1; 77.8) −7.7 (−11.4; −4) < 0.001 PSI-SF parental distress T0 27.4 (25.2; 29.6) 28.7 (26.5; 30.9) T3 24.9 (22.8; 27) −2.5 (−4.2; −0.9) 0.003 27.2 (25.2; 29.3) −1.5 (−3.1; 0.1) 0.07 T6 23.4 (21.3; 25.5) −4.0 (−5.9; −2.1) < 0.0001 25.7 (23.7; 27.7) −3.0 (−4.8; −1.2) 0.001 PSI-SF dysfunctional parent-child interaction T0 19.3 (17.7; 20.9) 22.7 (21.1; 24.3) T3 19.9 (18.1; 21.7) 0.6 (−0.8; 1.9) 0.40 23.0 (21.2; 24.7) 0.3 (−1; 1.6) 0.65 T6 18.3 (16.7; 20) −1.0 (−2.5; 0.5) 0.19 22.0 (20.5; 23.5) −0.7 (−2.1; 0.7) 0.34 PSI-SF difficult child T0 27.1 (25.1; 29.1) 29.2 (27.3; 31.2) T3 25.2 (23.2; 27.3) −1.9 (−3.3; −0.5) 0.01 27.4 (25.4; 29.4) −1.9 (−3.2; −0.5) 0.008 T6 23.8 (21.9; 25.8) −3.3 (−4.9; −1.6) 0.0001 25.2 (23.3; 27.1) −4.1 (−5.6; −2.5) < 0.0001 PHQ-9 T0 5.1 (4.2; 6) 5.7 (4.8; 6.6) T3 4.4 (3.4; 5.3) −0.7 (−1.5; 0.1) 0.1 4.9 (4; 5.8) −0.8 (−1.6; 0) 0.05 T6 4.2 (3.3; 5.1) −0.9 (−1.8; 0) 0.04 4.9 (4.1; 5.7) −0.8 (−1.6; 0) 0.05 GAD-7 T0 5.6 (4.5; 6.7) 6.9 (5.9; 8) T3 4.2 (3.2; 5.2) −1.4 (−2.2; −0.5) 0.001 5.2 (4.3; 6.1) −1.7 (−2.5; −0.9) < 0.0001 T6 4.1 (3.1; 5.1) −1.5 (−2.3; −0.6) 0.001 5.2 (4.2; 6.2) −1.7 (−2.5; −0.9) < 0.0001 B-PSQI C1_Subjective sleep quality T0 1.4 (1.2; 1.5) 1.2 (1; 1.4) T3 1.1 (0.9; 1.3) −0.3 (−0.5; −0.1) 0.001 1.2 (1; 1.3) −0.1 (−0.2; 0.1) 0.45 T6 1.1 (0.9; 1.2) −0.3 (−0.5; −0.1) 0.001 1.2 (1; 1.3) 0.0 (−0.2; 0.1) 0.58 B-PSQI C2_Latency T0 0.8 (0.6; 1) 0.8 (0.6; 1) T3 0.8 (0.6; 1) 0.0 (−0.2; 0.2) 0.85 0.7 (0.5; 0.9) −0.1 (−0.3; 0.1) 0.47 T6 0.7 (0.5; 0.9) −0.1 (−0.3; 0.1) 0.36 0.8 (0.6; 1) 0.0 (−0.2; 0.2) 0.93 B-PSQI C3_Sleep duration T0 1.4 (1.3; 1.6) 1.5 (1.3; 1.7) T3 1.3 (1; 1.5) −0.2 (−0.4; 0) 0.03 1.5 (1.3; 1.7) 0.0 (−0.2; 0.2) 0.85 T6 1.3 (1.1; 1.6) −0.1 (−0.3; 0.1) 0.22 1.6 (1.4; 1.8) 0.1 (−0.1; 0.3) 0.28 B-PSQI C4_Sleep efficiency T0 0.6 (0.4; 0.8) 0.5 (0.3; 0.7) T3 0.7 (0.4; 0.9) 0.1 (−0.2; 0.3) 0.65 0.5 (0.3; 0.7) 0.0 (−0.2; 0.2) 0.93 T6 0.3(0.1; 0.5) −0.3 (−0.5; 0) 0.02 0.6 (0.4; 0.8) 0.1 (−0.1; 0.3) 0.48 B-PSQI C5_Sleep disturbances T0 1.2 (1.1; 1.3) 1.3 (1.1; 1.4) T3 1.1 (0.9; 1.2) −0.1 (−0.3; 0) 0.06 1.2 (1.1; 1.3) −0.1 (−0.2; 0.1) 0.28 T6 1.1 (1; 1.2) −0.1 (−0.3; 0) 0.07 1.1 (1; 1.2) −0.2 (−0.3; 0) 0.02 B-PSQI C6_Use of sleep medications T0 0.2 (0.1; 0.3) 0.1 (0; 0.2) T3 0.0 (0; 0.1) −0.2 (−0.3; 0) 0.02 0.1 (0; 0.1) 0.0 (−0.1; 0.1) 0.691 T6 0.1 (0; 0.2) −0.1 (−0.2; 0) 0.21 0.0 (−0.1; 0.1) −0.1 (−0.2; 0.1) 0.29 B-PSQI C7_Dysfunction during the day T0 0.7 (0.5; 0.9) 0.8 (0.6; 1) T3 0.7 (0.5; 0.8) 0.0 (−0.2; 0.2) 0.66 0.7 (0.6; 0.9) 0.0 (−0.2; 0.1) 0.73 T6 0.6 (0.4; 0.8) −0.1 (−0.3; 0.1) 0.74 0.6 (0.5; 0.8) −0.1 (−0.3; 0.1) 0.19 PSESDM T0 32.1 (31; 33.3) 30.0 (28.9; 31.2) T3 32.9 (31.5; 34.3) 0.8 (−0.5; 2.1) 0.22 30.2 (28.9; 31.6) 0.2 (−1.1; 1.4) 0.77 T6 33.3 (31.9; 34.8) 1.2 (−0.1; 2.6) 0.08 31.3 (30; 32.7) 1.3 (0; 2.6) 0.04 COPE Social support T0 27.1 (25.4; 28.9) 27.6(25.8; 29.3) T3 27.1 (25.2; 29) 0.0 (−1.8; 1.7) 0.98 26.2 (24.3; 28.1) −1.4 (−3; 0.3) 0.1 T6 26.5 (24.6; 28.4) −0.6 (−2.3; 1.1) 0.5 25.4 (23.6; 27.2) −2.2 (−3.9; −0.6) 0.007 COPE Avoidance strategies T0 20.4 (19.3; 21.6) 22.0 (20.9; 23.1) T3 21.3 (20; 22.5) 0.8 (−0.5; 2.1) 0.22 21.4 (20.2; 22.6) −0.6 (−1.9; 0.7) 0.34 T6 20.9 (19.7; 22.1) 0.4 (−0.8; 1.7) 0.49 20.5 (19.4; 21.6) −1.5 (−2.7; −0.3) 0.01 COPE Positive attitude T0 33.0 (31.6; 34.4) 32.8 (31.4; 34.2) T3 33.2 (31.9; 34.6) 0.2 (−1.2; 1.6) 0.74 31.9 (30.6; 33.2) −0.9 (−2.2; 0.5) 0.2 T6 33.0 (31.4; 34.6) 0.0 (−1.5; 1.5) 0.99 32.1 (30.6; 33.6) −0.7 (−2.1; 0.7) 0.34 COPE Problem orientation T0 33.2 (31.7; 34.7) 32.0 (30.5; 33.5) T3 32.9 (31.2; 34.6) −0.3 (−1.8; 1.2) 0.66 30.6 (29; 32.3) −1.4 (−2.9; 0) 0.06 T6 32.5 (30.8; 34.2) −0.7 (−2.3; 0.8) 0.36 30.3 (28.7; 31.9) −1.7 (−3.2; −0.3) 0.02 COPE Transcendent orientation T0 23.4 (22.2; 24.5) 23.4 (22.2; 24.5) T3 23.1 (21.9; 24.2) −0.5 (−1.4; 0.4) 0.31 23.1 (21.9; 24.2) −0.3 (−1.2; 0.5) 0.46 T6 23.6 (22.5; 24.8) −0.8 (−1.8; 0.1) 0.08 23.6 (22.5; 24.8) 0.3 (−0.6; 1.1) 0.57 * Paired t-test derived from linear mixed models for repeated measures. Statistically significant p-values (p < 0.05) are shown in bold. Primary endpoint
-
At T3, a significant reduction in PSI-SF total score was observed in the BEM group (p = 0.03), whereas in the control group the reduction was not statistically significant (p = 0.07). At T6, a significant reduction in the PSI-SF score was present in both groups (p < 0.001). No differences emerged between the two groups (p = 0.92) (Fig. 1).
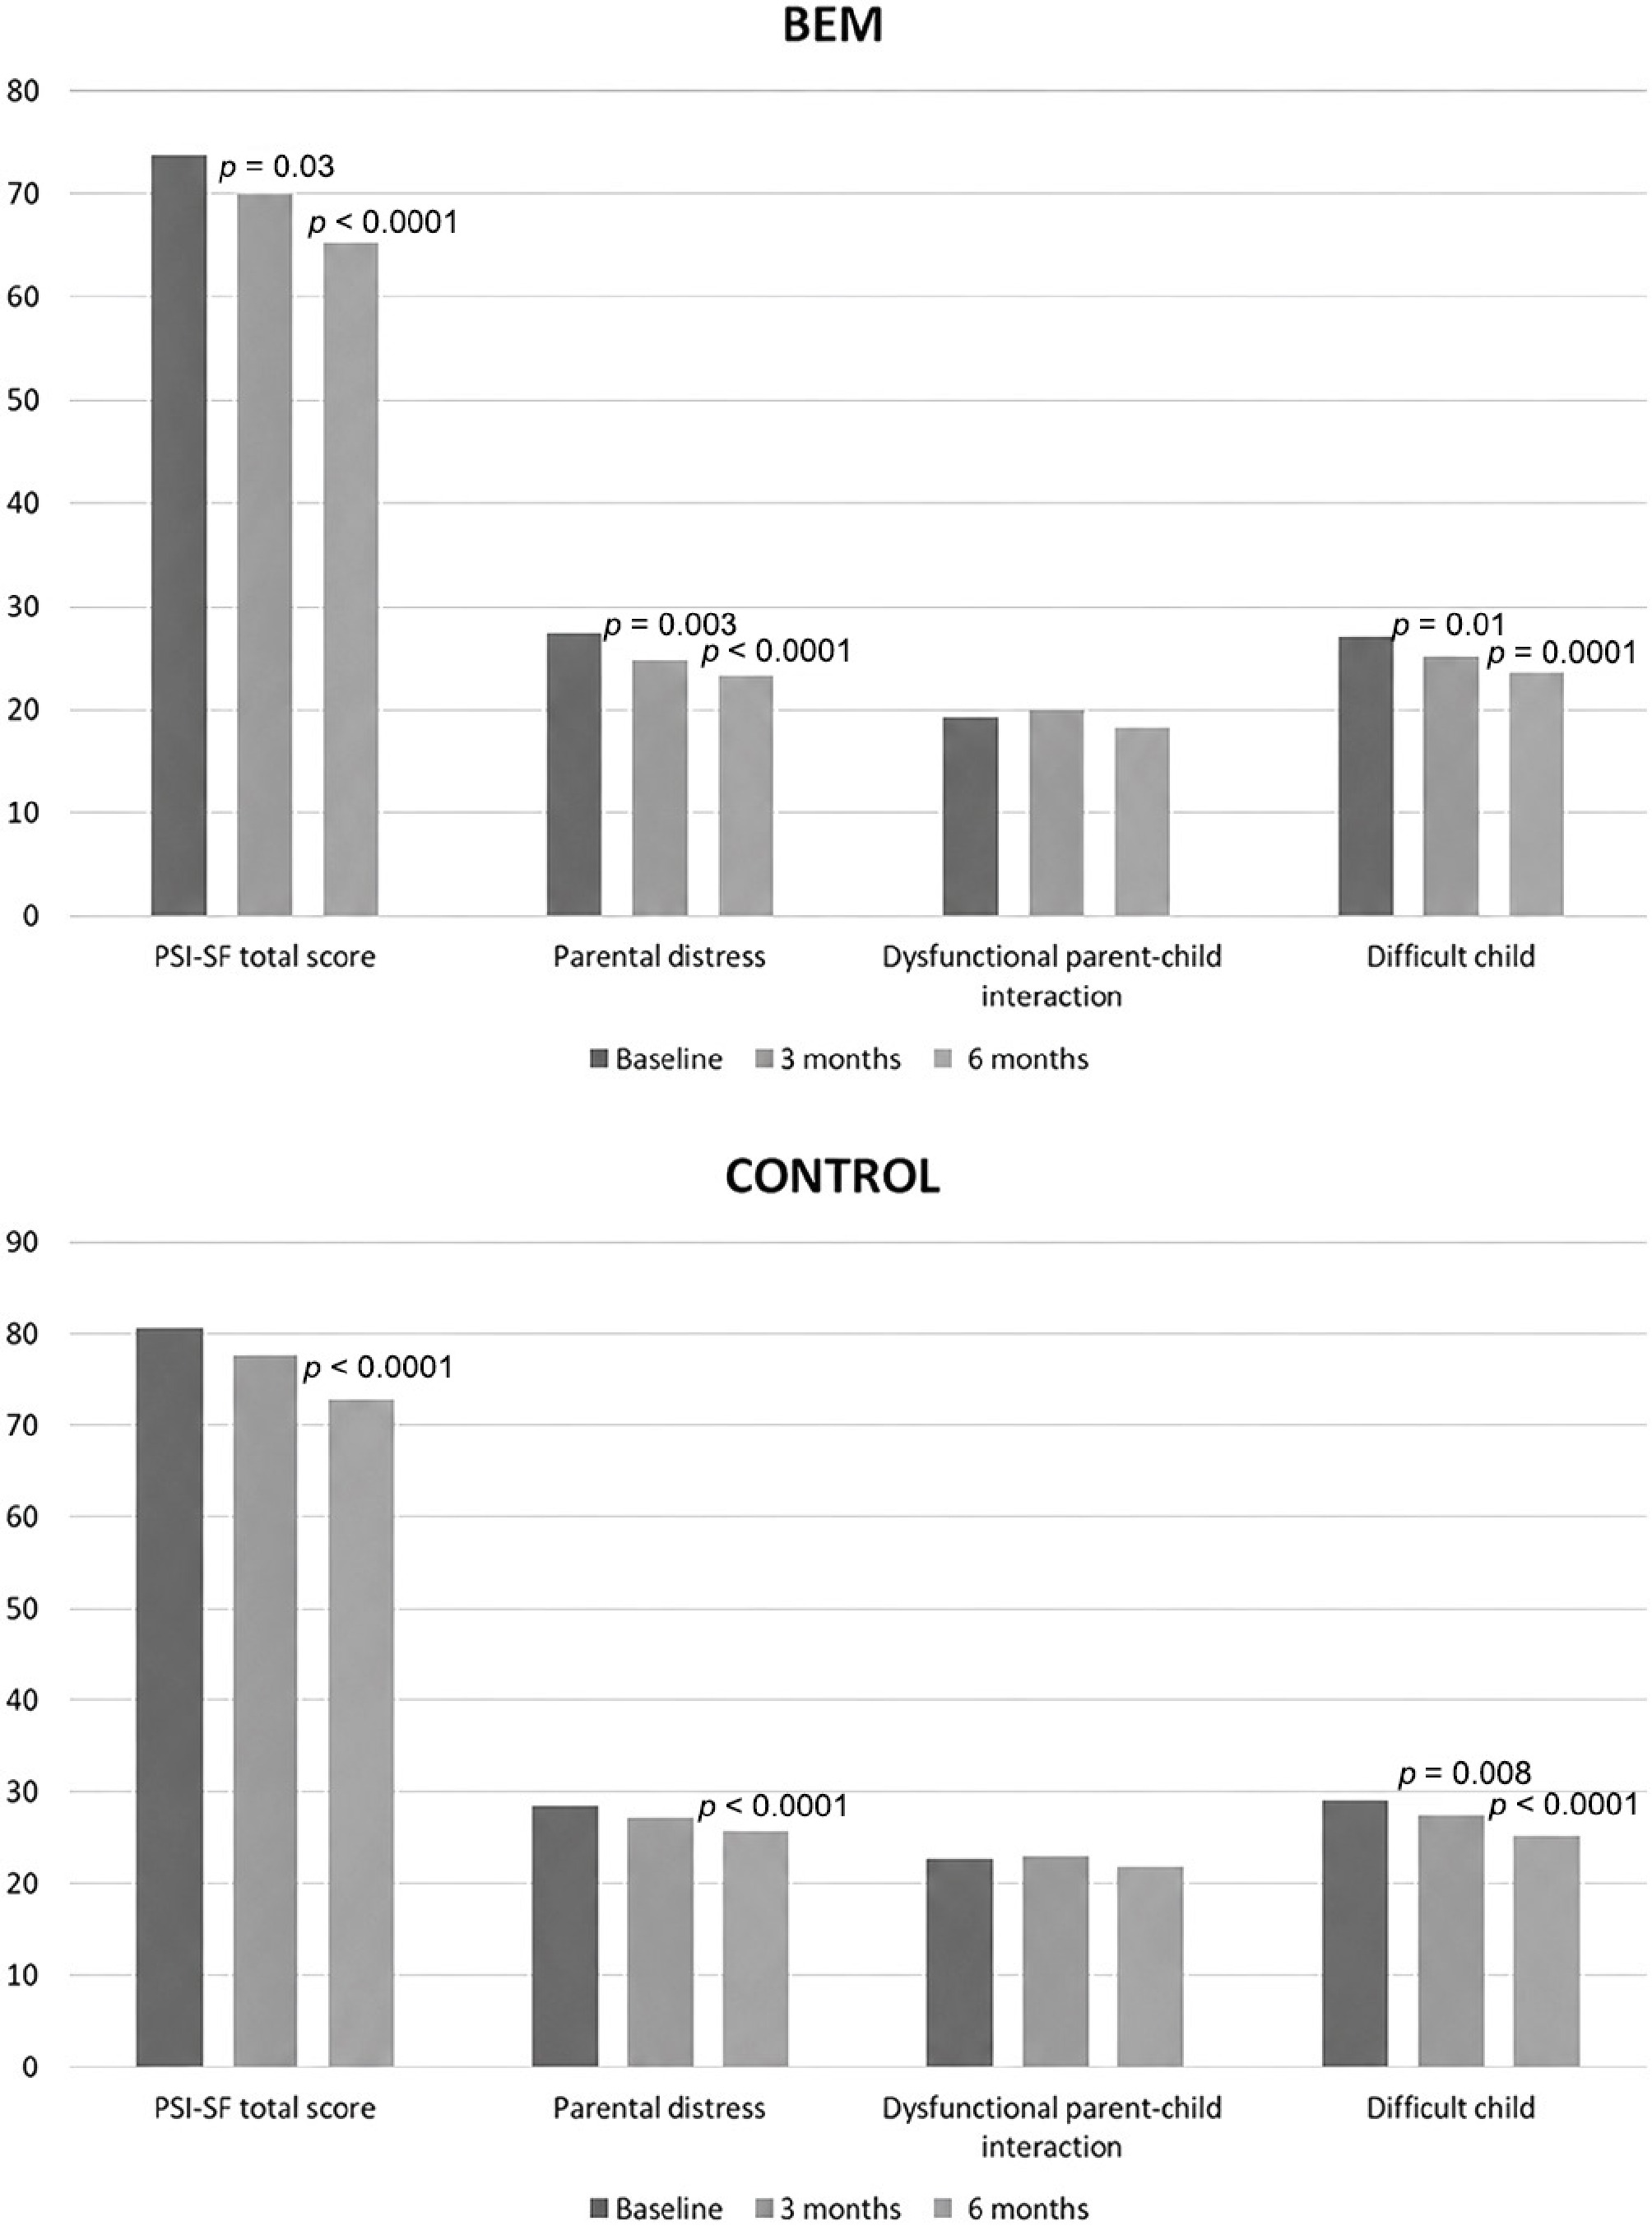
Figure 1.
Changes in PSI-SF total score and single domains at three and six months vs baseline, by study group (p-values derived from linear mixed models for repeated measures).
As for the domains covered by the PSI-SF, a significant reduction in parental distress was observed in the BEM group both at T3 (p = 0.003) and T6 (p < 0.001), while in the control group the reduction was significant only at T6 (p = 0.001), with no significant differences between the groups. In addition, a significant reduction in the difficult child domain score was recorded in both groups at both T3 and T6.
Secondary endpoints related to parents
-
At T6, the reduction in PHQ-9 score was significant in the BEM group (p = 0.04) and borderline in the control group (p = 0.05).
A significant reduction in GAD-7 score was observed in both groups at T3 and T6.
Subjective sleep quality (B-PSQI) improved significantly only in the BEM group at T3 and T6 (p = 0.001), although the between-group difference did not reach statistical significance (p = 0.10). The score for sleep duration improved significantly in the BEM group at T3 (p = 0.03) but not at T6, while it did not change in the control group. In addition, the sleep efficiency score improved significantly in the BEM group at T6 (p = 0.02), while it did not change in the control group. In this case, the between-group difference was significant (p = 0.03). A significant improvement at T6 emerged only in the control group for the sleep disturbances (p = 0.02), and an improvement at T3 in the score related to the use of sleep medication was documented in the BEM group (p = 0.02).
Regarding the PSESDM questionnaire, a significant improvement of the score at T6 was observed only in the control group (p = 0.04).
Finally, the COPE questionnaire scores showed a reduction at T6 in the control group for the dimensions social support, avoidance strategies, and problem orientation.
In all the cases mentioned above, no significant differences between groups emerged.
Secondary endpoints related to children/adolescents – glycemic parameters
-
Changes at T3 and T6 in the glycemic parameters of the children/adolescents are reported in Table 4. In both groups, HbA1c levels remained unchanged at both time points. Similarly, no significant changes in TIR were observed. At T3, a significant 5% increase in TBR level 1 (< 70 mg/dL) was recorded in the BEM group, which was no longer present at T6. No significant changes were observed in the control group. The difference between groups was not significant. Changes in TBR level 2 (< 54 mg/dL) were not significant in either group. TAR level 1 (> 180 mg/dL) decreased significantly at T3, but not at T6, in the BEM group; however, the between-group difference did not reach statistical significance. Lastly, TAR level 2 (> 250 mg/dL), average blood glucose, and coefficient of variation of blood glucose did not show significant changes over time or differences between the two groups.
Table 4. Secondary endpoints related to children/adolescents – glycemic parameters.
Parameters Time BEM BEM Control Control Estimated mean
levels (95% CI)Estimated mean difference
from T0 and 95% CIp-value* Estimated mean
levels (95%CI)Estimated mean difference
from T0 and 95% CIp-value* Between-group
p-value*HbA1c (%) T0 6.7 (6.5; 6.9) 7.0 (6.8; 7.2) 0.65 T3 6.7 (6.5; 7.0) 0.0 (−0.2; 0.3) 0.72 7.1 (6.9; 7.4) 0.1 (−0.1; 0.4) 0.13 T6 6.7 (6.5; 6.9) 0.0 (−0.2; 0.2) 0.99 7.0 (6.8; 7.2) 0.0 (−0.2; 0.2) 0.84 Glucometric indices in the
past 15 d (if using CGM)Time in Range (70−180 mg/dl) T0 70.4 (65.9; 74.8) 66.2 (61.7; 70.6) 0.69 T3 69.6 (64.5; 74.7) −0.7 (−5.8; 4.3) 0.77 67.5 (62.3; 72.8) 1.4 (−3.7; 6.5) 0.59 T6 68.3 (63.3; 73.3) −2.0 (−7.6; 3.5) 0.46 63.9 (58.9; 68.8) −2.3 (−7.7; 3.2) 0.41 Time below range (TBR)
level 1 (< 70 mg/dl)T0 2.3 (1.1; 3.5) 2.2 (1; 3.4) 0.07 T3 7.2 (4.3; 10.2) 5.0 (1.6; 8.3) 0.004 3.0 (−0.1; 6.2) 0.9 (−2.7; 4.4) 0.63 T6 1.9 (0.7; 3.2) −0.4 (−2; 1.3) 0.66 2.4 (1.2; 3.6) 0.2 (−1.4; 1.8) 0.78 Time below range (TBR)
level 2 (< 54 mg/dl)T0 0.7 (−1.5; 2.8) 1.9 (−0.2; 4) 0.30 T3 5.3 (0.4; 10.1) 4.6 (−0.6; 9.8) 0.08 1.4 (−3.7; 6.6) −0.4 (−5.9; 5) 0.88 T6 0.5 (−2.5; 3.6) −0.2 (−4; 3.7) 0.93 2.9 (−0.1; 5.9) 1.0 (−2.8; 4.8) 0.59 Time above range (TAR)
level 1 (> 180 mg/dl)T0 20.4 (17.4; 23.3) 22.3 (19.4; 25.2) 0.07 T3 13.7 (10; 17.4) −6.7 (−10.9; −2.5) 0.002 20.9 (17; 24.9) −1.4 (−5.7; 3) 0.53 T6 21.1 (18.6; 23.5) 0.7 (−2.8; 4.2) 0.70 22.1 (19.7; 24.5) −0.2 (−3.7; 3.2) 0.90 Time above range (TAR)
level 2 (> 250 mg/dl)T0 6.9 (4.6; 9.3) 7.9 (5.6; 10.2) 0.64 T3 4.9 (2.6; 7.3) −2.0 (−4.8; 0.8) 0.17 7.7 (5.3; 10.2) −0.2 (−3; 2.6) 0.9 T6 6.7 (4.4; 8.9) −0.2 (−2.9; 2.4) 0.86 8.7 (6.5; 10.9) 0.8 (−1.8; 3.4) 0.54 Average blood glucose (mg/dl) T0 153.1 (146.2; 160.1) 160.4 (153.6; 167.3) T3 148.8 (141.4; 156.2) −4.3 (−9.8; 1.1) 0.12 161.3 (153.8; 168.9) 0.9 (−4.6; 6.4) 0.74 T6 152.6 (146.4; 158.7) −0.5 (−6.2; 5.1) 0.85 162.1 (156; 168.2) 1.7 (−3.9; 7.3) 0.55 Coefficient of variation T0 36.2 (34.3; 38.1) 34.5 (32.6; 36.4) 0.20 T3 34.7 (32.2; 37.2) −1.5 (−3.9; 0.8) 0.20 34.2 (31.6; 36.7) −0.3 (−2.7; 2.2) 0.83 T6 34.9 (33.1; 36.6) −1.3 (−3.1; 0.4) 0.14 35.4 (33.7; 37.1) 0.9 (−0.8; 2.6) 0.30 * Paired t-test derived from linear mixed models for repeated measures. Statistically significant p-values (p < 0.05) are shown in bold. Analysis by parent sex
-
Mothers and fathers responded differently to the interventions (Supplementary Table S1). At T3, total PSI-SF scores improved only among fathers in both groups; at T6, improvements were significant for mothers only in the BEM arm and for fathers in both arms.
Parental distress improved at both time points only among mothers in the BEM group, while it improved at T6 among fathers only in the control group. The difficult child domain improved at T3 only among fathers and at T6 in both parents.
PHQ-9 and GAD-7 scores improved mainly among mothers in both arms, while anxiety decreased among fathers only in the control group. In the BEM arm, both mothers and fathers reported improved subjective sleep quality; no other sleep domains changed.
No significant effects were observed for PSESDM. COPE changes were limited to reduced avoidance strategies in control-group mothers and reduced transcendent orientation in BEM-group fathers.
No between-group differences emerged.
Analysis by children/adolescent's age
-
Supplementary Table S2 shows age-stratified results. At T3, total PSI-SF and parental distress improved only among parents of children > ten years in the BEM arm. At T6, both age groups improved in the BEM arm, whereas in the control arm improvements were seen only among parents of older children.
PHQ-9 scores improved only in parents of children > ten years (at both time points in BEM; at T6 in control). Anxiety (GAD-7) decreased in the BEM arm in older children at both time points and in younger children at T6, while in the control arm anxiety declined in both age groups at both time points.
Subjective sleep quality improved only in the BEM arm (older children at T3; both age groups at T6). Additional sleep-related changes were limited and age-specific: improved sleep duration (≤ ten years, control), sleep efficiency (> ten years, BEM), sleep disturbances (> ten years, BEM), and sleep-medication use (≤ ten years, control).
PSESDM increased significantly only in the BEM arm at T3 among parents of older children. COPE changes were modest, with reductions in social support, avoidance strategies, and problem orientation in the control arm (> ten years) and reduced transcendent orientation in the BEM arm (≤ ten years).
Analysis by use of AID systems
-
Supplementary Table S3 shows that in the BEM arm, improvements in total PSI-SF, parental distress, dysfunctional parent–child interaction, and difficult child scores occurred only among parents of children using AID systems. In the control arm, total PSI-SF improved at T6 regardless of AID use, while parental distress and PHQ-9 improved only in the no-AID and AID groups, respectively.
Anxiety (GAD-7) decreased in AID users in both arms at T3 and T6. Subjective sleep quality improved only in the BEM group at both time points, independent of AID use, while additional sleep-related changes were limited and group-specific.
PSESDM improved only at T3 in the BEM no-AID group and at T6 in the control AID group. COPE changes were modest and varied by subgroup.
Supplementary Tables S4 and S5 summarize the results obtained in the overall sample and in pre-specified subgroups in terms of statistical significance and clinical relevance, expressed as effect size. The tables show that the most substantial benefits (effect size of 0.4 or greater) are observed for distress, sleep-related problems, and anxiety.
-
This multicenter randomized study compared two educational camps for parents of children with type 1 diabetes and showed that both the BEM and traditional camps significantly reduced parenting stress. The BEM intervention produced earlier improvements at three months, while similar benefits were observed in both groups by six months, suggesting that BEM structured activities may accelerate stress reduction.
PSI-SF domain analyses support this interpretation: parental distress decreased at both follow-ups only in the BEM group, whereas in the control group it improved only at six months. The difficult child domain improved in both arms at all time points, suggesting reduced perceived challenges in diabetes management.
Overall, camp participation appeared to positively influence parents' perceptions, while the structured BEM approach may accelerate changes in parents' subjective distress. This may reflect the BEM program's focus on processing diagnostic trauma and promoting long-term adaptation through relaxation, guided imagery, and group sharing, which support coping resources and self-efficacy[28].
Depressive symptoms improved primarily at six months and to a similar extent across groups, whereas anxiety symptoms decreased significantly at both time points in both arms. Subjective sleep quality improved consistently only in the BEM group, particularly in the domains of sleep duration and sleep efficiency. These results suggest that the overall camp experience provides meaningful emotional support for parents, while the specific structure and components of BEM may confer additional benefits on sleep and perceived restfulness.
Several complementary mechanisms may explain the earlier improvement in parental stress and the sleep-related benefits observed with BEM. Unlike the traditional camp, which primarily provides education, peer interaction, and informal emotional support, BEM explicitly targets parents' emotional and bodily responses to the demands of caring for a child with diabetes. Guided visualization, relaxation, and breathing exercises may reduce physiological arousal and facilitate emotional regulation, while body-focused awareness may help parents recognize and modulate stress responses that are otherwise maintained by persistent vigilance and diabetes-related concerns. The structured exploration of emotionally salient experiences and the identification of personal resources may also promote cognitive and emotional reappraisal of diabetes-related challenges. Finally, facilitated group sharing may strengthen perceived social support and normalize parents' experiences. These mechanisms could contribute to a more rapid reduction in subjective distress and, by reducing cognitive and physiological arousal, may also favor improvements in perceived sleep quality and sleep efficiency. However, these mechanisms were not directly assessed in the present study and should therefore be considered hypothesis-generating.
The temporal pattern of change may provide additional insight into the effects of the intervention. BEM participants showed improvements in total parenting stress and parental distress as early as three months, whereas comparable improvements in the control group became evident mainly at six months. One possible explanation is that the structured and emotionally focused components of BEM may facilitate earlier recognition, processing, and reappraisal of diabetes-related stressors. In contrast, the benefits of a traditional camp may develop more gradually through education, peer interaction, normalization of experiences, and informal social support. Thus, BEM may primarily accelerate psychological adaptation rather than produce a substantially greater long-term effect. This interpretation remains exploratory and should be confirmed in studies specifically designed to investigate mediating mechanisms and trajectories of psychological change.
Importantly, the intervention had no substantial effects on children's glycemic outcomes. HbA1c, TIR, hypoglycemia metrics, and glucose variability remained stable in both groups, with only transient changes (e.g., in TBR and TAR at T3) that did not translate into durable metabolic benefits. This is consistent with previous evidence indicating limited or inconsistent metabolic effects of short-term parent-focused psychosocial interventions[29].
Stratified analyses by parent sex, child age, and AID use provide additional insights into potential moderators of intervention effectiveness, although these findings should be interpreted cautiously because the subgroup analyses were exploratory and the study was not powered for these comparisons. Mothers appeared to derive more sustained psychological benefits from the BEM intervention than fathers. This finding is consistent with previous literature showing that mothers generally assume greater day-to-day responsibility for diabetes management and experience higher levels of parenting burden, emotional distress, and diabetes-related caregiving responsibilities than fathers, leaving greater scope for improvement through interventions targeting emotional processing and coping[11,30−33].
Parents of older children (> ten years) also appeared to benefit more from the BEM intervention. During adolescence, families face the progressive transfer of diabetes self-management responsibilities from parents to children, increasing concerns regarding autonomy, adherence, peer influence, and risk-taking behaviors. These developmental challenges may heighten parental emotional burden and make interventions focused on emotional adaptation and coping particularly valuable during this stage[3,11,34].
Finally, the greater benefits observed among families using automated insulin delivery (AID) systems should be interpreted with caution. One possible explanation is that, by reducing part of the cognitive and practical burden associated with glucose management, AID systems allow parents to devote greater attention to emotional adaptation and family functioning. Alternatively, AID use may identify families who are more engaged in diabetes management or who receive care in specialized centers with greater access to education and psychosocial support. Because these hypotheses cannot be tested in the present study, further research is needed to clarify whether diabetes technology modifies the effectiveness of parent-focused psychosocial interventions or simply identifies families more likely to benefit from them.
Overall, our study suggests that family characteristics and diabetes management modality may moderate the effectiveness of parent-focused interventions and should be considered when tailoring future programs.
Comparison with existing evidence
-
High levels of parenting stress, anxiety, depression, and sleep problems among parents of children with type 1 diabetes are well documented, with observational studies consistently reporting clinically relevant distress, often higher in mothers, and associations with socio-demographic factors[11,30,31,34]. Our findings of significant reductions in parenting stress, anxiety, and selected sleep dimensions after camp participation align with this literature and extend it by providing randomized evidence that these outcomes are modifiable.
Most studies of diabetes camps have focused on children, with mixed and often short-lived effects on psychosocial outcomes and little impact on glycemic control[35−37]. Calls for more structured, parent-inclusive approaches have followed. Our trial adds to this evidence by targeting parents directly and comparing a standard camp with the more structured BEM model in a randomized design.
Recent reviews of parenting interventions in type 1 diabetes suggest that brief programs can yield modest but meaningful improvements in parental distress, self-efficacy, and family functioning, though evidence remains heterogeneous[38]. Our results support the feasibility of embedding structured psychological components such as BEM within traditional diabetes camps to enhance stress-reduction benefits.
Sleep is an increasingly recognized challenge in families coping with T1D, with poor caregiver sleep linked to greater psychological burden and suboptimal glycemic outcomes[39]. The improvements in subjective sleep quality and, in some subgroups, sleep duration and efficiency, observed particularly in the BEM group, are consistent with this evidence and suggest that stress-focused interventions may also support better sleep.
Our findings reinforce the substantial psychosocial burden experienced by parents of children with type 1 diabetes and show that both camp-based interventions were associated with reductions in parenting stress over six months. The distinctive finding associated with BEM was the earlier improvement in total parenting stress and parental distress, together with more consistent improvements in selected sleep-related outcomes. However, translating these improvements into measurable changes in children's glycemic control remains a persistent challenge.
Our study has strengths and limitations. A key strength is that it represents the first randomized controlled trial evaluating educational camp models specifically designed for parents of children with type 1 diabetes. Also, the study assessed a broad range of validated psychological, sleep-related, and self-efficacy measures alongside children's glycemic outcomes, offering a comprehensive view of parental well-being. The inclusion of multiple subgroup analyses provides clinically relevant insights into differential responses based on parental sex, child age, and diabetes technology use. The six-month follow-up further strengthens the study by demonstrating the medium-term persistence of psychological benefits.
Some limitations should be acknowledged. First, although powered for the primary endpoint, the sample size may be insufficient to detect small, yet clinically relevant, between-group differences or fully evaluate subgroup effects. In this respect, socioeconomic resources may also influence parental psychological burden and responsiveness to psychosocial interventions through differences in access to support, work flexibility, health literacy, and financial stress. The present study was not designed or powered to assess heterogeneity of treatment effects across socioeconomic strata, and future studies should specifically evaluate whether socioeconomic disadvantage modifies participation in or response to parent-focused interventions.
Second, despite including glycemic outcomes, the study may not have been long enough to detect meaningful metabolic changes in children. Also, the two camp formats, while different in structure, shared common educational and supportive elements, possibly reducing the contrast between arms. Furthermore, the study was not designed to isolate the independent contribution of peer support from the structured components of the interventions. Both camp formats provided opportunities for informal interaction, sharing of experiences, and mutual support among parents, and these common contextual and relational components may have contributed to the psychological improvements observed in both groups. Thus, the present findings should be interpreted as reflecting the incremental effect of BEM within a camp-based setting rather than the isolated effect of its individual components. Future factorial or multi-arm studies incorporating formal measures of peer support and group processes could help disentangle the independent and potentially synergistic effects of peer interaction, education, and structured experiential interventions. As an additional limitation, follow-up was limited to six months, preventing assessment of the long-term sustainability of improvements in parenting stress, anxiety, and sleep-related outcomes. Longer follow-up is needed to determine whether the benefits observed after both camp interventions persist over time and whether the earlier improvements associated with BEM translate into sustained psychological advantages. Furthermore, although children's glycemic outcomes were assessed, the study did not evaluate their psychological or behavioral outcomes. Longitudinal assessment of children's emotional well-being, diabetes distress, quality of life, and family functioning is needed to determine whether improvements in parental psychological well-being translate into downstream benefits for children and the broader family system. Finally, generalizability may be limited to similar healthcare and cultural contexts, as the study was conducted within a single national setting.
-
Diabetes camps reduce parenting stress, anxiety, and selected sleep disturbances. The structured BEM model provides earlier and broader benefits, particularly in parental distress and subjective sleep quality. Depressive symptoms also improved over time, while children's glycemic outcomes remained unchanged.
Subgroup findings suggest greater benefits among mothers, parents of older children, and families using AID systems, indicating that aligning interventions with family characteristics and treatment modality may enhance effectiveness.
Overall, educational camps are a useful strategy to support parents of children with type 1 diabetes, and integrating structured psychological components, as in the BEM model, may further strengthen their impact. Future work should assess long-term effects, clarify mechanisms, including the role of sleep, and evaluate whether combining camp-based programs with ongoing, low-intensity parental support can improve family well-being and diabetes outcomes.
Future studies should determine the relative contributions of structured experiential activities and peer support and assess whether improvements in parental well-being translate into sustained psychological benefits for children and families.
A special thanks goes to the families who actively participated in the proposed activities and without whom it would not have been possible to carry out this study. Giusi Graziano, who performed data analysis. Special thanks to the working group for the intellectual and practical support: BEM Study group: Pietro Lazzeroni5, M.D.; Roberto Francavilla5, M.D.; Vanessa Sambati5, M.D.; Rossella Ricciardi3, M.D.; Francesca Cardella4, M.D.; Sara Santarelli1, M.D.; Giada Boccolini1, Psy.D.; Antonio Iannilli1, M.D.; Elena Prandi7, M.D.; Alessia D'Angillo6, Psy.D.; Arianna Negri6, Psy.D.; Dario Manzotti1, C.N.P.; Alice Stella4 M.D.
-
The study protocol was approved by local ethics committees, and all patients signed the informed consent. The study was conducted in accordance with good clinical practice principles and the ethical standards of the responsible committee on human experimentation (institutional and national) and with the Helsinki Declaration of 1964, as revised in 2013, and the protocol was approved by the following local Ethics Committees: 1. Territorial Ethics Committee of Marche (Project identification code: BEM-02) on Aug 08, 2023; 2. Local Ethics Committee Palermo 2 (Project identification code: BEM-02) on Oct 03, 2023; 3. Territorial Ethics Committee Area Centro-Est Veneto (Project identification code: BEM-02) on Apr 12, 2024; 4. Territorial Ethics Committee Lombardia 6 (Project identification code: BEM-02) on Apr 23, 2024; 5. Ethics Committee Sardegna (Project identification code: BEM-02) on May 07, 2024; 6. Ethics Committee Area Vasta Emilia Nord (Project identification code: BEM-02) on Aug 05, 2024.
-
The authors confirm their contributions to the paper as follows: study conception and design: Cherubini V, Alessandrelli MC, Pagnini M, Nicolucci A; subject recruitment and follow-up: Tiberi V, Ripoli C, Roppolo R, Iovane B, Moretti C, Felappi B, Cusinato M, Marino M; draft manuscript preparation: Cherubini V, Nicolucci A, Puglielli C; guarantor: Cherubini V. All authors reviewed the results and approved the final version of the manuscript.
-
Not applicable.
-
Cherubini V has received consulting fees from Sanofi, MOVI, Theras, Novo Nordisk, Abbott, and research grants from Medtronic, Eli Lilly, AstraZeneca. MOVI was not involved in the study design, data collection, data analysis, manuscript writing, or the decision to submit the manuscript for publication. Puglielli C and Nicolucci A are employees of CORESEARCH SRL, a private contract research organization that provided editorial support for this study. Nicolucci A has received research grants from AlfaSigma, Novo Nordisk, Sanofi, Shionogi, Theras. The remaining authors declare that the research was conducted in the absence of any commercial or financial relationships that could be construed as a potential conflict of interest.
-
accompanies this paper online at: https://doi.org/10.48130/pedi-0026-0011.
- Supplementary Table S1 Study results for the primary endpoint and secondary parent-related endpoints by parent sex.
- Supplementary Table S2 Study results for the primary endpoint and secondary parent-related endpoints by children/adolescent's age.
- Supplementary Table S3 Study results for the primary endpoint and secondary parent-related endpoints by use of AID.
- Supplementary Table S4 Summary of the results obtained in the overall sample in terms of statistical significance (asterisks) and clinical relevance, expressed as effect size.
- Supplementary Table S5 Summary of the results obtained in pre-specified subgroups in terms of statistical significance (asterisks) and clinical relevance, expressed as effect size.
- Supplementary Fig. S1 Study flow chart.
- Appendix 1 BEM (Body Emotional Map) intervention manual.
- Appendix 2 Description of study questionnaires.
-
Copyright © 2026 by the author(s).
Pediatric Diabetes published by Maximum Academic Press on behalf of John Wiley & Sons Ltd. This is an open access article under the terms of the Creative Commons Attribution License, which permits use, distribution and reproduction in any medium, provided the original work is properly cited. -
About this article
Cite this article
Cherubini V, Puglielli C, Alessandrelli MC, Pagnini M, Tiberi V, et al. 2026. A randomized trial of a structured experiential intervention to reduce parenting stress in parents of children with type 1 diabetes BEM 02-study. Pediatric Diabetes 2026: e010 doi: 10.48130/pedi-0026-0011 

A randomized trial of a structured experiential intervention to reduce parenting stress in parents of children with type 1 diabetes BEM 02-study
- Received: 22 April 2026
- Revised: 28 July 2026
- Accepted: 09 September 2026
- Published online: 08 October 2026
Abstract: Parents of children with type 1 diabetes experience substantial stress, anxiety, and sleep difficulties. We evaluated the effectiveness of Body Emotional Maps (BEM), an experiential group intervention delivered during a diabetes camp, compared with a traditional educational camp. In this multicenter randomized trial (NCT07098689), 139 parents were enrolled. The primary endpoint was the between-group difference in Parenting Stress Index–Short Form (PSI-SF) change at three months (T3). Secondary outcomes included depressive symptoms (Patient Health Questionnaire, PHQ-9), anxiety (Generalized Anxiety Disorder questionnaire, GAD-7), subjective sleep quality (Brief Pittsburgh Sleep Quality Index, B-PSQI), parental self-efficacy (Parental Self-Efficacy for the Management of Diabetes Mellitus, [PSESDM]), coping (Coping Orientation to Problems Experienced, COPE), and children's glucometric indices at T3 and six months (T6). Mixed models for repeated measures were used. At T3: PSI-SF total score improved significantly in the BEM group (p = 0.03) but not in controls (p = 0.08). At T6, both groups showed significant improvement (p < 0.001) with no between-group difference. The parental distress domain improved earlier and more consistently in the BEM group. Anxiety decreased significantly in both groups. Subjective sleep quality improved only in the BEM arm at both assessments, with a significant advantage in sleep efficiency at T6 (p = 0.03). Children's glycemic parameters remained stable in both groups. In conclusion, both camp models reduced parental stress, but BEM produced earlier improvements and additional benefits in parental distress and sleep quality.