













-
Pear (Pyrus spp.), a long-lived woody perennial fruit tree, is widely cultivated globally. The protracted breeding cycle poses challenges for the development of new pear tree varieties, prompting the exploration of strategies to overcome seed dormancy and enhance germination[1−3]. During pear seed germination, indole-3-acetic acid (IAA) and abscisic acid (ABA) decrease, while the level of gibberellin (GA) increases[4]. Exogenous GA or IAA treatments have been shown to boost the germination rate of uncoated seeds[1], whereas exogenous ABA treatment hinders germination[5]. In various plant species, seed germination has also been associated with the involvement of jasmonic acid (JA)[6], cis-zeatin, and dihydrozeatin[7].
Advancements in metabolomic technologies have facilitated the identification of a growing number of compounds in seeds[8,9]. Notably, during seed germination, wheat (Triticum aestivum) and soybean (Glycine max) exhibit significant changes in 67 and 287 compounds, respectively[10,11]. In pear, 715 compounds have been identified in uncoated seeds, among which, 251 respond to ABA treatment and are enriched in 26 metabolic pathways, including phenylpropanoid and flavonoid biosynthesis[5]. However, the key metabolites that play essential roles in pear seed germination have not yet been clearly defined.
Whole-transcriptome sequencing is an effective method for identifying both protein-encoding genes and various classes of noncoding RNAs, including long noncoding RNAs (lncRNAs) and microRNAs[12]. MicroRNAs, typically 18–30 nucleotides in length[13], are well known for their ability to suppress the expression of downstream target genes[14,15]. LncRNAs, on the other hand, are generally defined as transcripts longer than 200 nucleotides and can modulate gene expression through multiple mechanisms, including transcriptional regulation and protein translation and modification, as well as acting as molecular decoys or sponges for microRNAs[16,17]. Both types of noncoding RNAs have been implicated in the regulation of abiotic and biotic stress responses[18,19], postharvest storage[20], and organ development in fruit crops[21,22].
Integrated analyses combining whole-transcriptomic and metabolomic data have been used to elucidate the potential pathway through which noncoding RNAs modulate fruit metabolite profiles in perennial fruit trees[23,24]. However, our understanding of the involvement of noncoding RNAs in seed germination remains limited. In this study, following previously described approaches[4,5], the seed coat was removed to accelerate pear seed germination. Subsequent metabolomic and whole-transcriptomic sequencing analyses were carried out to identify the compounds, mRNAs, and noncoding RNAs associated with this process. Moreover, potential interactions among lncRNAs, microRNAs, and mRNAs were predicted to reveal the metabolic regulatory network governing seed germination regulated by noncoding RNAs. These findings offer new insights into the epigenetic control of seed germination in perennial fruit trees.
-
In accordance with the prior investigation[4], ripe fruit of the pear cultivar Cuiguan (Pyrus pyrifolia (Burm.f.) Nakai) were stored at 4 °C for approximately 1.5 months. In total, 144 seeds were collected without drying and divided into two groups, each consisting of three biological replicates. In one group, the seed coats were removed, whereas the other group remained intact as the control. All seeds were then placed on dampened gauze within a growth chamber maintained at 25 ± 1 °C under a 16-h photoperiod (75 μmol·m−2·s−1) and 60% relative humidity to facilitate germination. Embryos from both coated and uncoated seeds were promptly flash-frozen in liquid nitrogen and stored at –80°C for subsequent use.
Measurement and quantification of metabolites
-
A sample of 0.1 g of dry powder from each replicate of two groups was dissolved in 70% methanol for extraction, and subsequently analyzed by ultra-performance liquid chromatography (UPLC) (SHIMADZU Nexera X2, Shimadzu, Kyoto, Japan) coupled with tandem mass spectrometry (MS/MS) (Applied Biosystems 4500 QTRAP, Applied Biosystems, Framingham, MA, USA). Compound identification was achieved by comparison with validated standards, and signal intensities were standardized utilizing an internal standard (lidocaine, 0.1 mg·L−1). Each specimen was subjected to three distinct biological replicates to enhance the reliability and robustness of the findings.
Transcriptome sequencing and analysis
-
Total RNA was extracted from each replicate of two groups using the RNAprep Pure Plant Kit of Polysaccharides & Polyphenolics-Rich (Tiangen, Beijing, China). Transcriptome libraries were prepared and sequenced according to a previously published protocol[25]. The raw sequencing data are available in the Genome Sequence Archive at China's National Center for Bioinformation (
https://ngdc.cncb.ac.cn ; PRJCA040547). After removal of the low-quality raw reads, the high-quality clean reads were aligned to the reference genome of the pear cultivar Dangshansuli (http://peargenome.njau.edu.cn ). Gene expression levels were quantified as reads per kilobase per million.Small RNA sequencing and analysis
-
Small RNAs were size-selected and sequenced by following the methods described in a previous study[26]. Three replicates were processed. The raw sequencing data are available in the Genome Sequence Archive at China's National Center for Bioinformation (
https://ngdc.cncb.ac.cn ; PRJCA040547). After removing low-quality reads and those with inappropriate lengths (shorter than 18 bp or longer than 30 bp), the resulting high-quality reads were aligned to the reference genome of pear. (http://peargenome.njau.edu.cn ). MicroRNA identification and annotation were performed in accordance with established protocols[26], and microRNA expression levels were quantified and reported as transcripts per million.Identification of lncRNAs
-
Transcriptome sequencing reads from individual samples were assembled using StringTie v1.3.1[27] via a reference-based approach. LncRNAs were identified according to a methodology established in a prior investigation[28]. The expression levels of lncRNAs were quantified as reads per kilobase per million.
Dual luciferase assay
-
To investigate the interactions among lncRNA, microRNA, and mRNA, the precursor sequence of the microRNA and the corresponding lncRNA were individually cloned into the pSAK277 expression constructs, which were subsequently introduced into Agrobacterium tumefaciens by transformation. The full-length coding sequence of the putative mRNA target was amplified by polymerase chain reaction (PCR) and subcloned into the pGreenII dual luciferase microRNA target expression vector, as described in a previous study[29]. Bacterial suspensions containing the lncRNA, microRNA, and mRNA constructs were adjusted to equivalent optical densities and mixed at a volumetric ratio of 4:4:2 (v/v/v). After infiltration into tobacco (Nicotiana tabacum) leaves, luciferase activities were measured using the Dual-Luciferase® Reporter Assay System (Promega, Madison, WI, USA). Firefly luciferase (Luc) and Renilla luciferase (Ren) signals were detected with a Cytation 3 Cell Imaging multi-mode reader (BioTek, Santa Barbara, CA, USA), with a minimum of six independent biological replicates per experiment. The primer sequences used for vector construction are listed in Supplementary Table S1.
Data analysis
-
Principal component analysis (PCA) of the metabolic compounds was performed using the two-dimensional PCA approach (
www.omicshare.com ). Analysis of variance (ANOVA) was performed using SPSS software (IBM SPSS Statistics version 19, Chicago, Illinois). Student's t-test was served to assess significant differences, with differences indicated by the lowercase letters a, b, and c at p < 0.05. Differentially accumulated compounds were identified on the basis of ion intensity with a threshold of a false discovery rate (FDR) of < 0.05. Differential expression analysis of the genes, microRNAs, and lncRNAs was carried out using EdgeR V 2.6.10, with standardized read counts across all samples and the criteria of an absolute log2 fold change ≥ 2 and FDR < 0.05. Correlation analyses were conducted to clarify the relationships among compounds and genes, microRNAs, and lncRNAs, with a threshold of FDR < 0.05. -
To elucidate the differences in plant hormone concentrations between dormant and germinated seeds, the seed coats of dormant seeds were removed. Uncoated seeds initiated germination at 36 h after treatment (HAT) (Fig. 1a). In total, 12 hormones and their derivatives were quantified in coated and uncoated seeds at 0 and 36 HAT (Fig. 1b). The contents of methylindole-3-acetic acid (ME-IAA), cis-zeatin, and JA remained relatively stable across the three samples. Indole-3-carboxylic acid (ICA), N6-(Δ2-isopentenyl)-adenine (IP), and trans-zeatin showed only minor changes between dormant and germinated seeds at 36 HAT but decreased compared with the levels measured at 0 HAT (C0). Dihydrozeatin levels in germinated seeds at 36 HAT (T36) were lower than in dormant seeds at the same timepoint (C36), but did not significantly differ from the levels at C0. These results indicate that these seven hormones and their derivatives may have limited involvement in seed germination. In contrast, the contents of IAA, dihydrojasmonic acid (H2JA), jasmonic acid–isoleucine (JA-ILE), and ABA decreased in T36 compared with C0 and C36, whereas salicylic acid (SA) increased. Therefore, IAA, H2JA, JA-ILE, ABA, and SA are likely to be involved in seed germination.
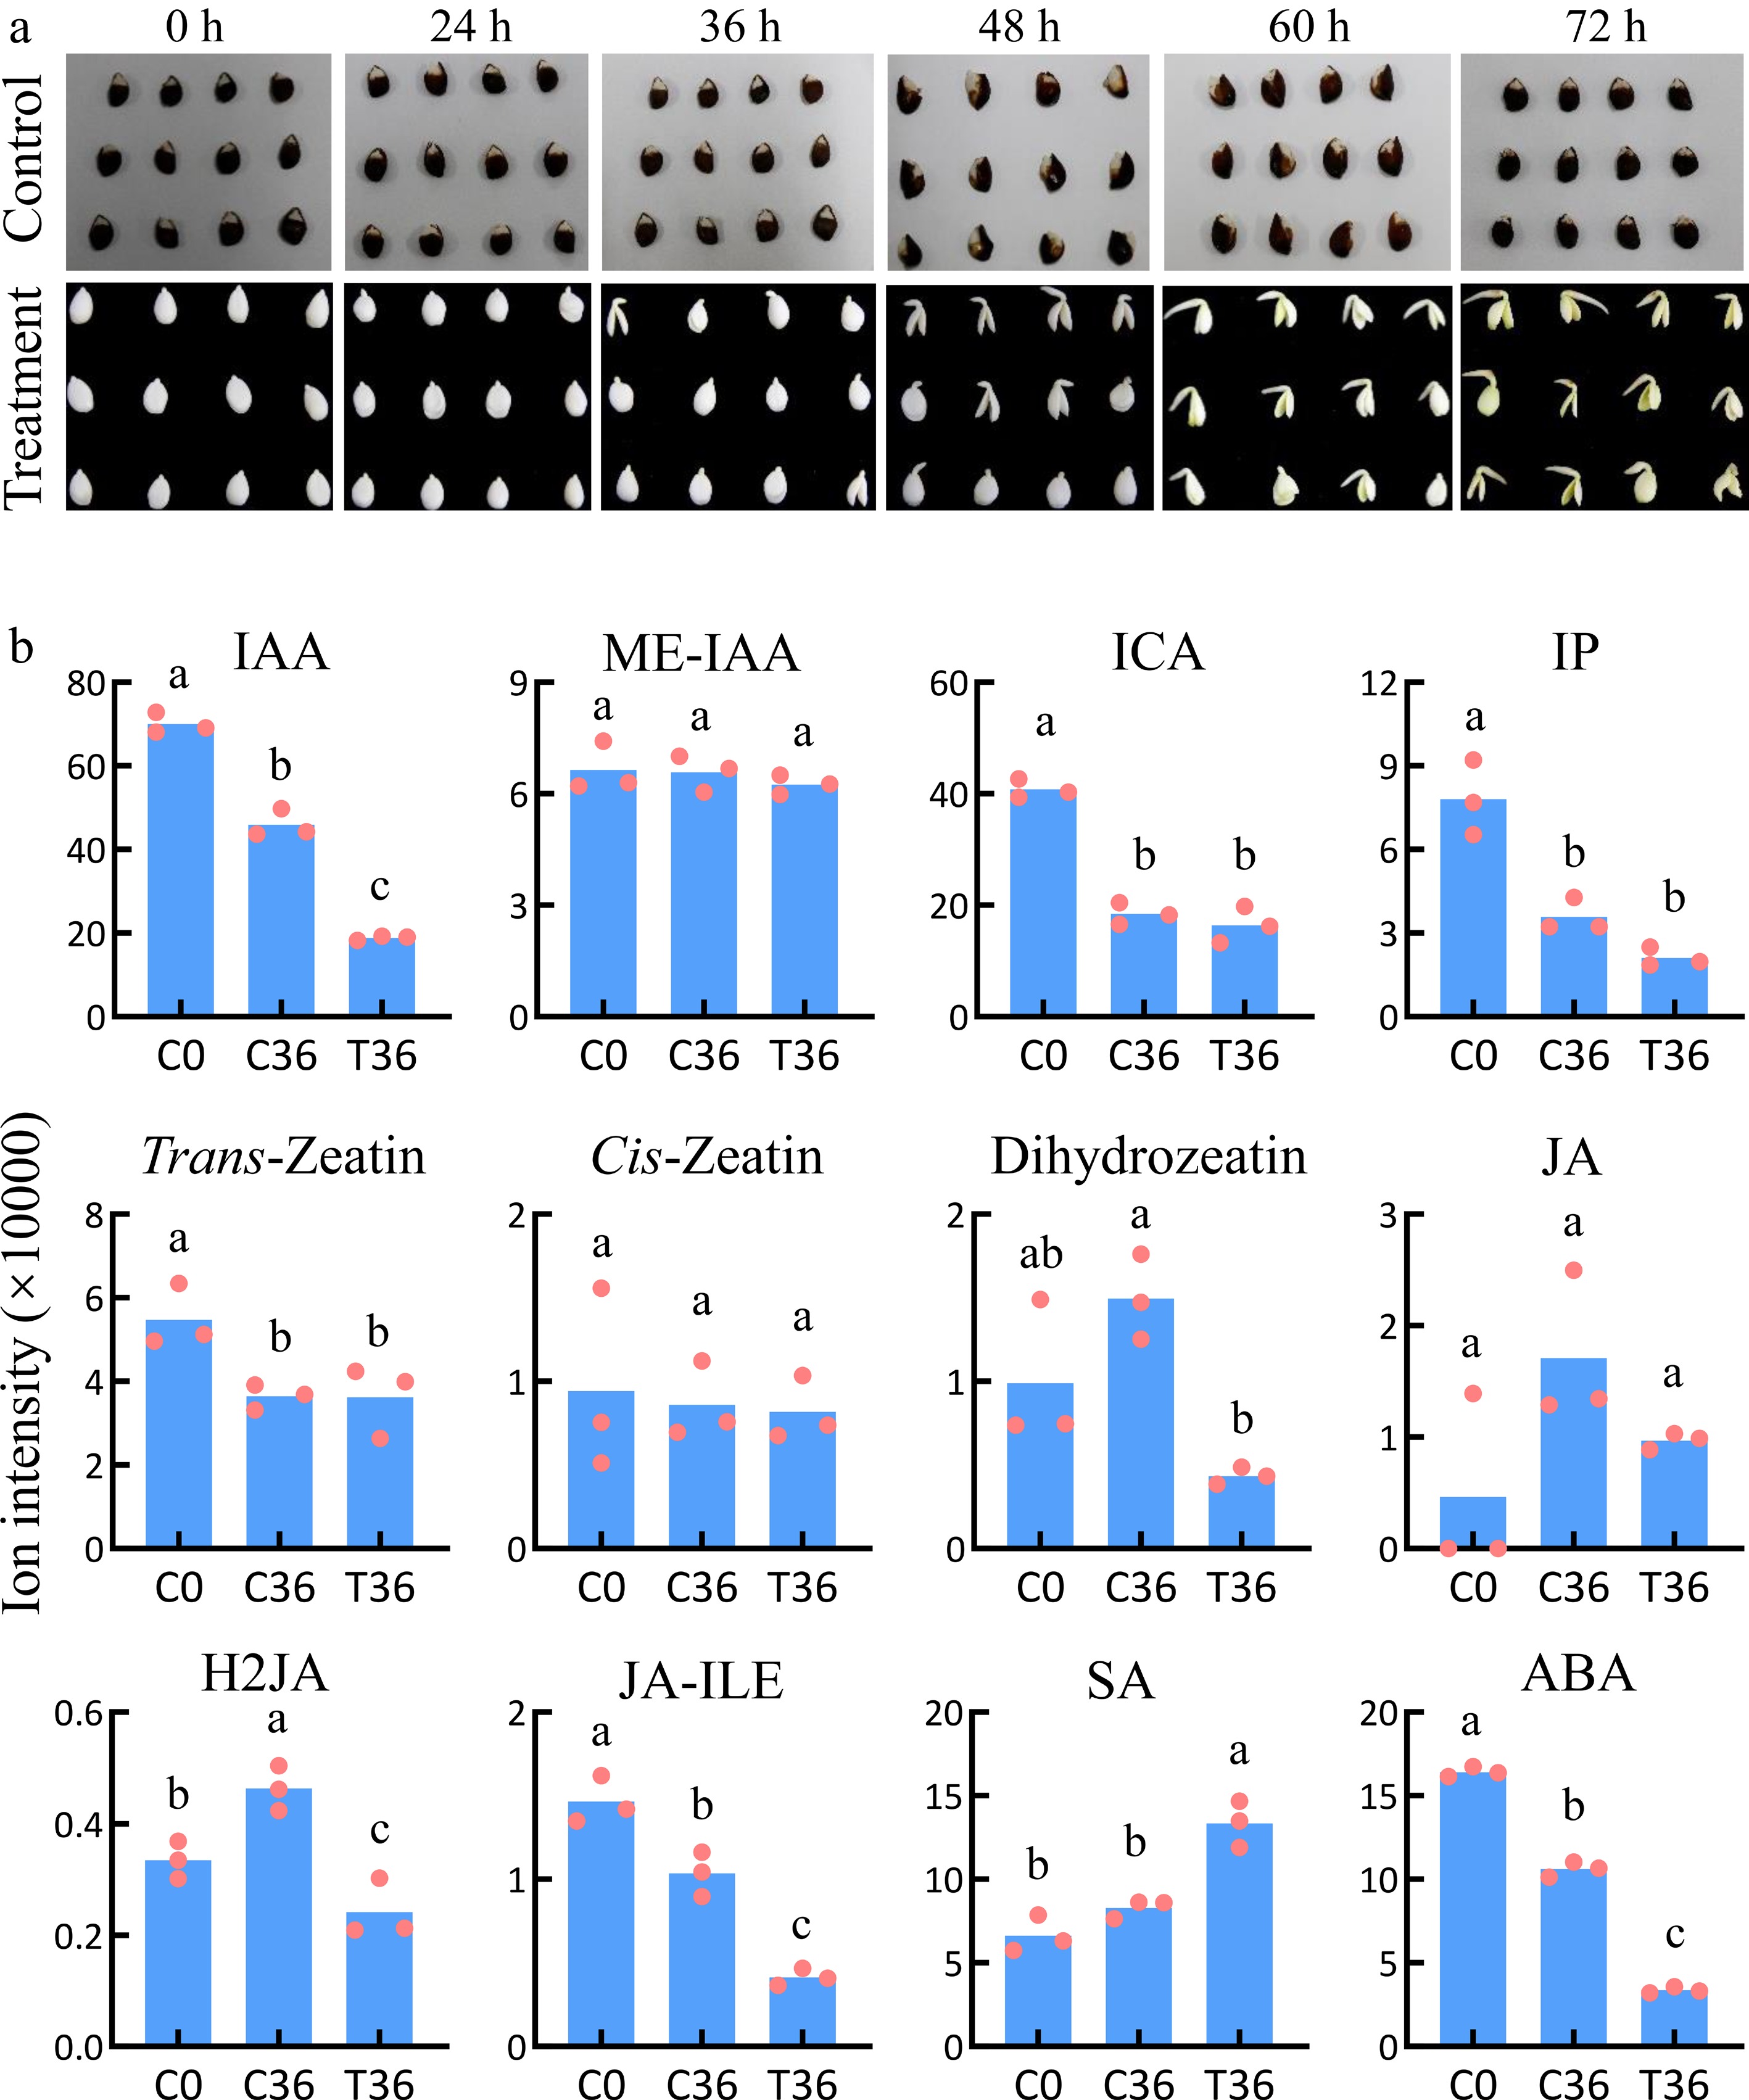
Figure 1.
Identification of plant hormones associated with seed germination. (a) Dynamic changes during the germination of coated seeds. The treatment indicates seeds with the whole coat removed; the control indcludes the coated seeds. (b) The levels of plant hormones in coated seeds at 0 h (C0) and 36 h (C36) and uncoated seeds at 36 h (T36). Means and standard errors were calculated using Student's t-test. The lowercase letters a, b, and c indicate significant differences at p < 0.05.
To further explore the metabolic regulatory network during the germination of uncoated seeds, integrated metabolomic, transcriptomic, and microRNAomic analyses were performed on the C0, C24, C36, T24, and T36 samples to identify the associated compounds, mRNAs, microRNAs, and lncRNAs (Supplementary Fig. S1). Differential analyses between T36 and C36 and between T36 and C0 were conducted to identify the compounds and transcripts that were responsive to seed germination, whereas differential analyses between T24 and C24 and between C36 and C0 were used as controls. Subsequently, a correlation analysis between differentially accumulated compounds (DACs) and differentially expressed genes (DEGs) was conducted to construct a gene–metabolite association database. Eventually, a targeting analysis of the microRNAs for mRNAs and lncRNAs was carried out to clarify the potential regulatory roles of microRNAs and lncRNAs in seed metabolism during germination.
Identification of the compounds that are responsive to seed germination
-
To identify compounds that are responsive to seed germination, the broadly targeted metabolites were measured, detecting a total of 620 compounds in coated and uncoated seeds at 0, 24, and 36 HAT (Supplementary Table S2). Hierarchical clustering and PCA analyses of the relative levels of these compounds showed the distinct grouping of the three replicates within each sample (Fig. 2a, b). Differential analysis showed that compared with T36, 122 and 286 compounds decreased in C36 and C0, respectively (Supplementary Tables S3, S4). Among these, 104 compounds were shared and categorized into various classes, including anthocyanins, carbohydrates, cholines, coumarins, catechin derivatives, flavanone, flavone, flavonol, hydroxycinnamoyl derivatives, isoflavone, fatty acids, glycerolipids, glycerophospholipids, amino acids and their derivatives, nucleotide and its derivates, organic acids, phenolamides, quinate and its derivatives, vitamins, and others (Fig. 2c; Supplementary Tables S4, S5). In contrast, 80 and 41 compounds increased in C36 and C0, respectively (Supplementary Tables S3, S4). Five compounds were shared between two groups, classified as benzoic acid derivatives, hydroxycinnamoyl derivatives, nucleotide and its derivates, organic acids, and proanthocyanidins (Fig. 2c; Supplementary Tables S4, S5). These results indicate the potential involvement of these 109 DACs in seed germination.
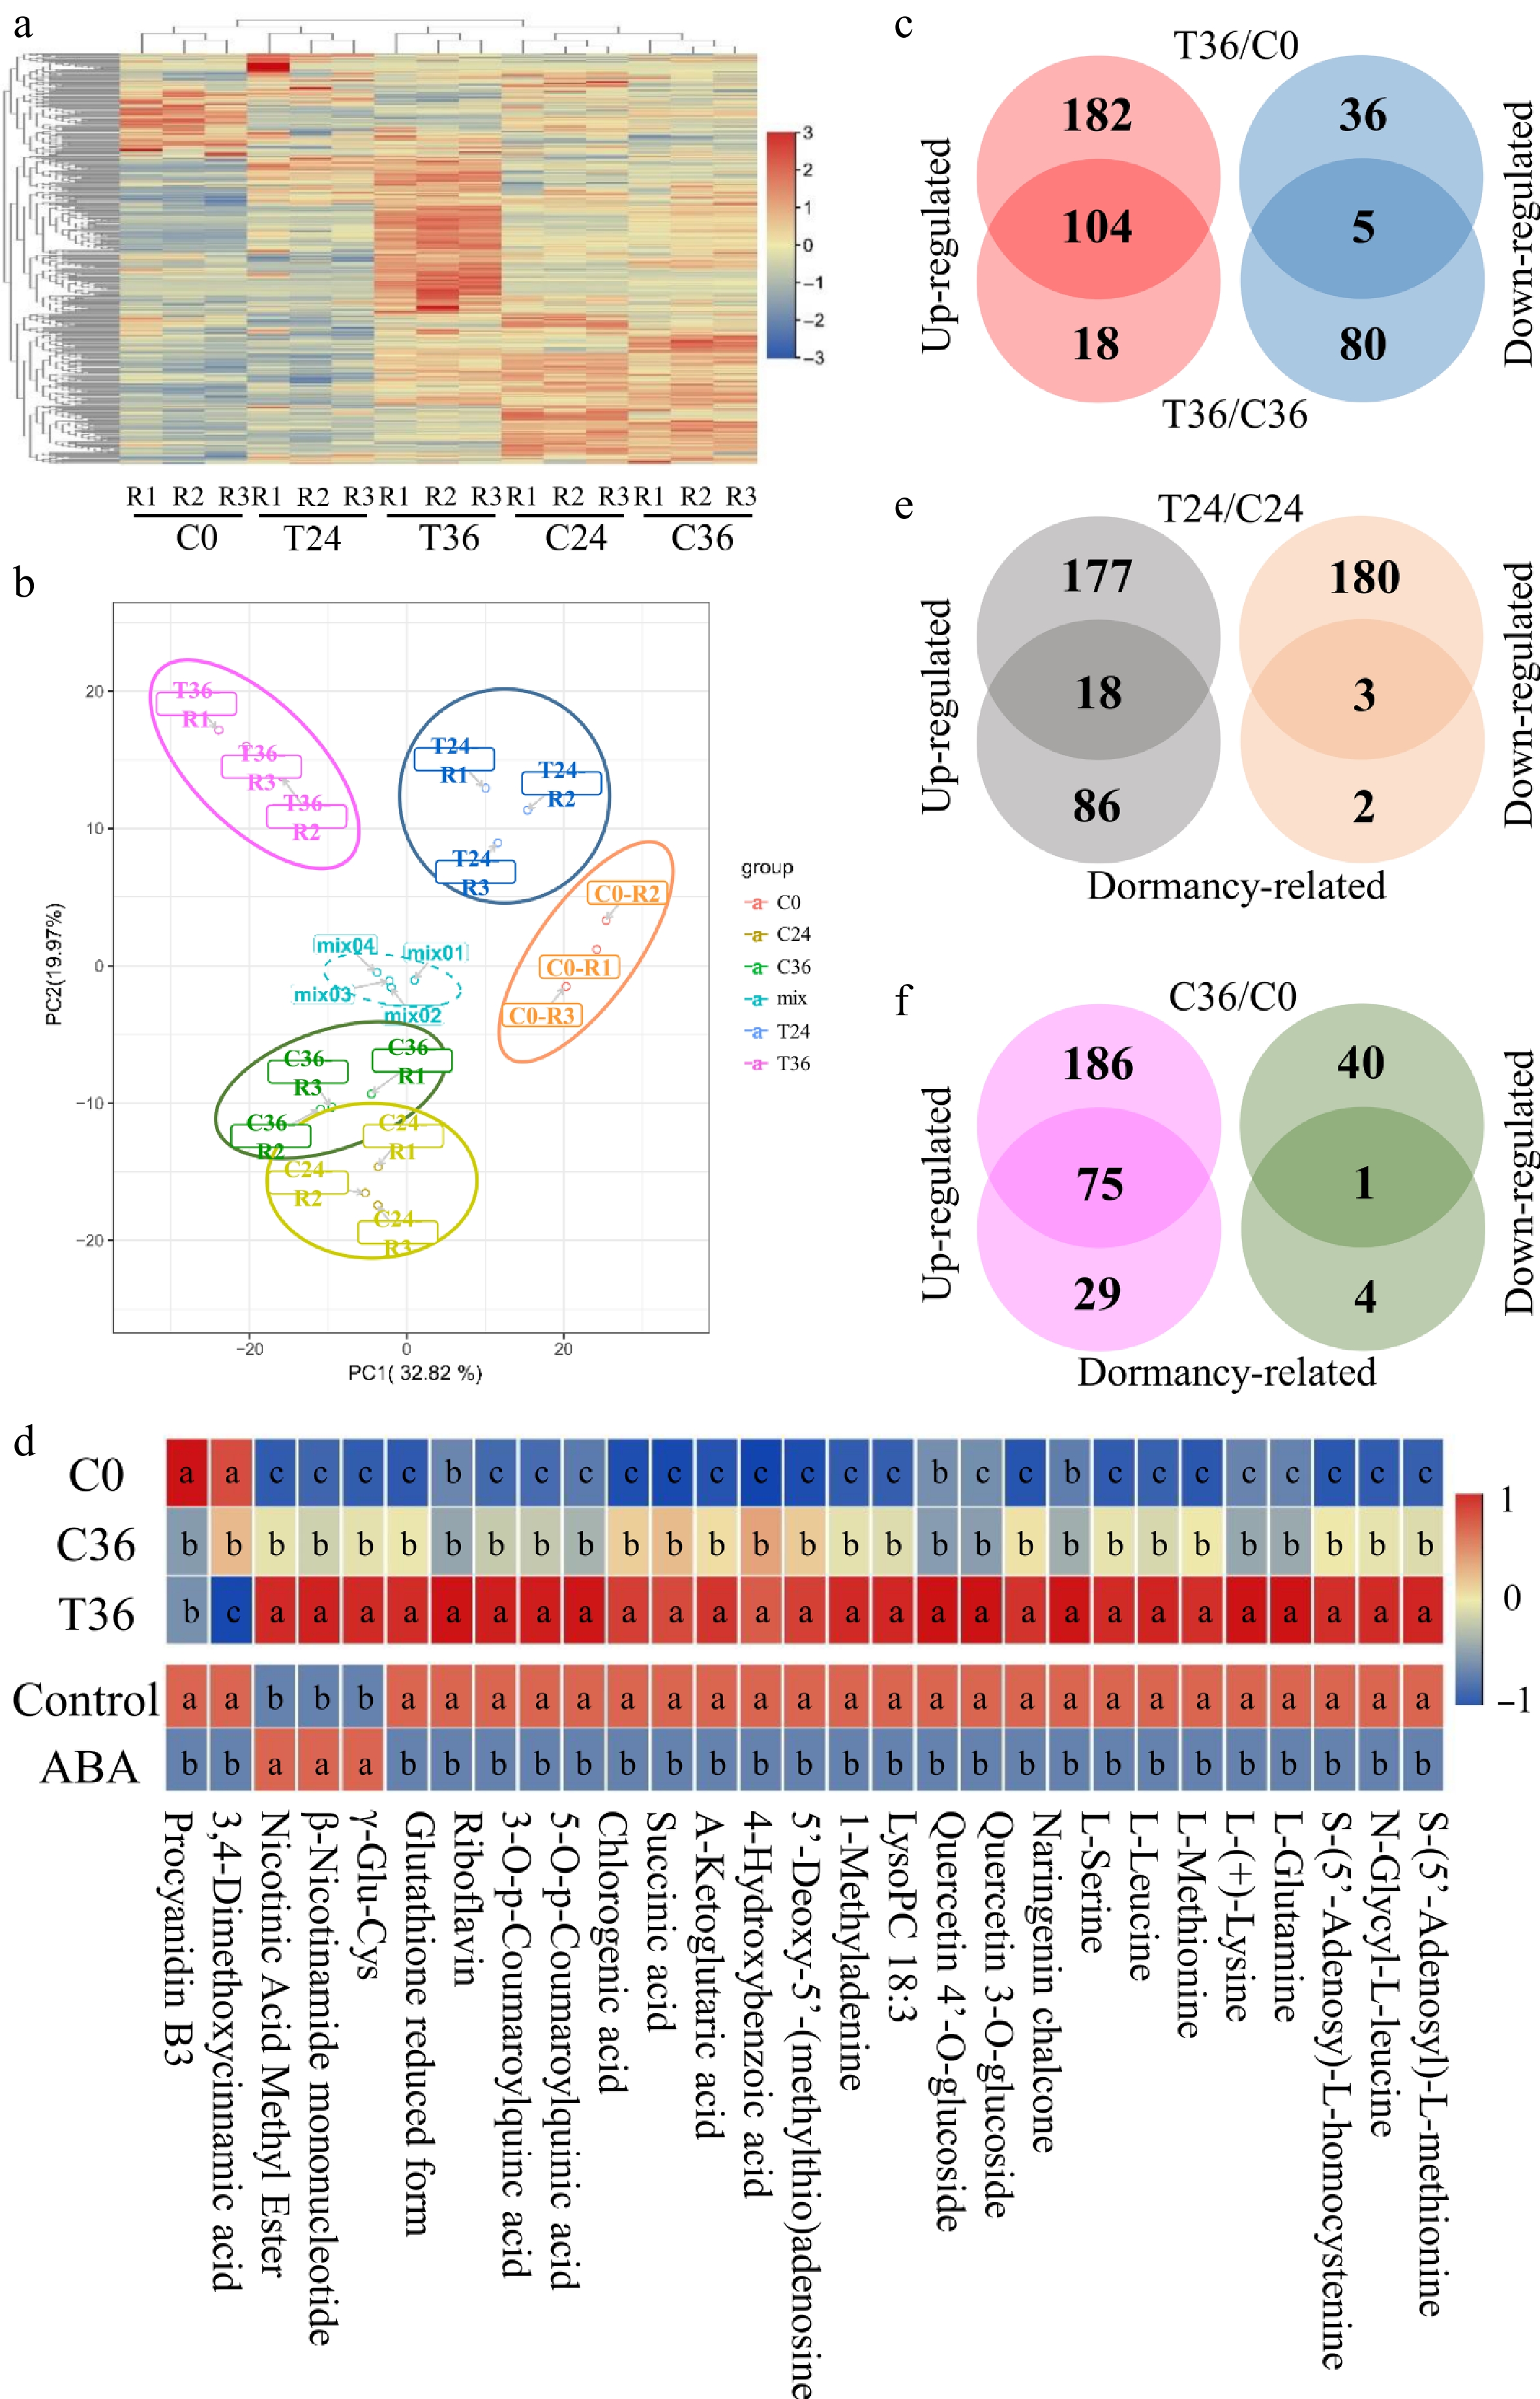
Figure 2.
Differential accumulation analyses of metabolic compounds associated with seed germination. (a) A heatmap showing the levels of 612 metabolic compounds in coated seeds at 0 (C0), 24 (C24), and 36 h (C36), and uncoated seeds at 24 (T24) and 36 h (T36). R1, R2, and R3 are the three replicates. The level increases with the transition from blue to red. (b) Principal component analysis of the metabolic compounds in five samples. (c) Identification of compounds that were responsive to seed germination. Differential accumulation was tested between T36 and C0 and between T36 and C36. (d) Exogenous ABA treatment influences the levels of 29 compounds that are responsive to seed germination. The top panel is the levels of 29 compounds in C0, C36, and T36; the bottom panel shows the levels of 29 compounds in ABA-treated and control seeds. Student's t-test was used to assess significant differences. The lowercase letters a, b, and c indicate significant differences at p < 0.05. (e) Identification of compounds that are responsive to seed germination and differentially accumulated between T24 and C24. Dormancy-related indicates compounds that are responsive to seed germination. (f) Identification of compounds that are responsive to seed germination and differentially accumulated between C36 and C0.
A previous study reported that exogenous ABA treatment inhibited pear seed germination by influencing the accumulation of 251 compounds[5]. Only 29 of these overlapped with the 109 DACs identified in this study. Of these, 24 DACs exhibited decreased contents in both C0 and C36 compared with T36 (which contained reduced ABA concentrations) but showed increased contents in uncoated seeds treated with exogenous ABA compared with the control (Fig. 2d; Supplementary Table S5). However, the remaining five DACs exhibited the opposite trends under ABA treatment (Fig. 2d; Supplementary Table S5), suggesting a slight perturbation in the ABA-mediated metabolic pathways by other factors, such as H2JA, JA-ILE, and SA.
To further characterize the dynamics of the 109 compounds implicated in seed germination, differential analyses were performed between coated and uncoated seeds at 24 HAT, as well as between C36 and seeds at 0 HAT (C0). In uncoated seeds at 24 HAT (T24), 295 compounds increased and 183 compounds decreased relative to coated seeds at the same point (C24; Supplementary Table S6). Only 21 of the 109 DACs were detected in this comparison (Fig. 2e), suggesting that the remaining 88 DACs may arise from conversion of the other 457 DACs between T24 and C24. Moreover, 261 compounds increased and 41 compounds decreased in C36 compared with C0 (Supplementary Table S7). Only 76 of the 109 DACs were detected in the comparison (Fig. 2f), suggesting that the differential accumulation of these 76 DACs precedes seed germination.
Identification of genes that are responsive to seed germination
-
To identify the genes that are responsive to seed germination, transcriptomic sequencing was performed on C0, C24, C36, T24, and T36. In total, 1,565.19 million raw reads were generated across all samples (Supplementary Table S8), yielding 1,001.07 million clean reads that assembled into 30,468 genes and 34,303 lncRNAs. Hierarchical clustering of the gene expression profiles showed the clear grouping of the three replicates within each sample (Fig. 3a). Differential analysis showed that compared with T36, 6,161 and 11,017 genes exhibited reduced expression in C36 and C0, respectively (Supplementary Tables S9, S10), with 5,617 genes shared between both comparisons (Fig. 3b). In contrast, 1,741 and 1,516 genes displayed increased expression in C36 and C0, respectively (Supplementary Tables S9, S10), with 505 genes being shared (Fig. 3b). The results indicate the involvement of these 6,122 DEGs in seed germination. Notably, 2,670 DEGs were previously reported to respond to ABA treatment5. Of these, 2,338 DEGs exhibited decreased expression in both C0 and C36 compared with T36, which had a lower concentration of ABA, but were upregulated in uncoated seeds treated with exogenous ABA compared with the control (Supplementary Table S11). Conversely, 202 DEGs exhibited increased expression in both C0 and C36 compared with T36, yet were downregulated following exogenous ABA treatment (Supplementary Table S11). These DEGs represent approximately 41.49% of all genes that are responsive to seed germination, underscoring the pivotal role of ABA in seed dormancy regulation[30]. However, 130 DEGs exhibited opposing expression patterns under exogenous ABA treatment (Supplementary Table S11), suggesting potential disruption in the ABA-mediated gene regulatory network in seeds caused by other factors.
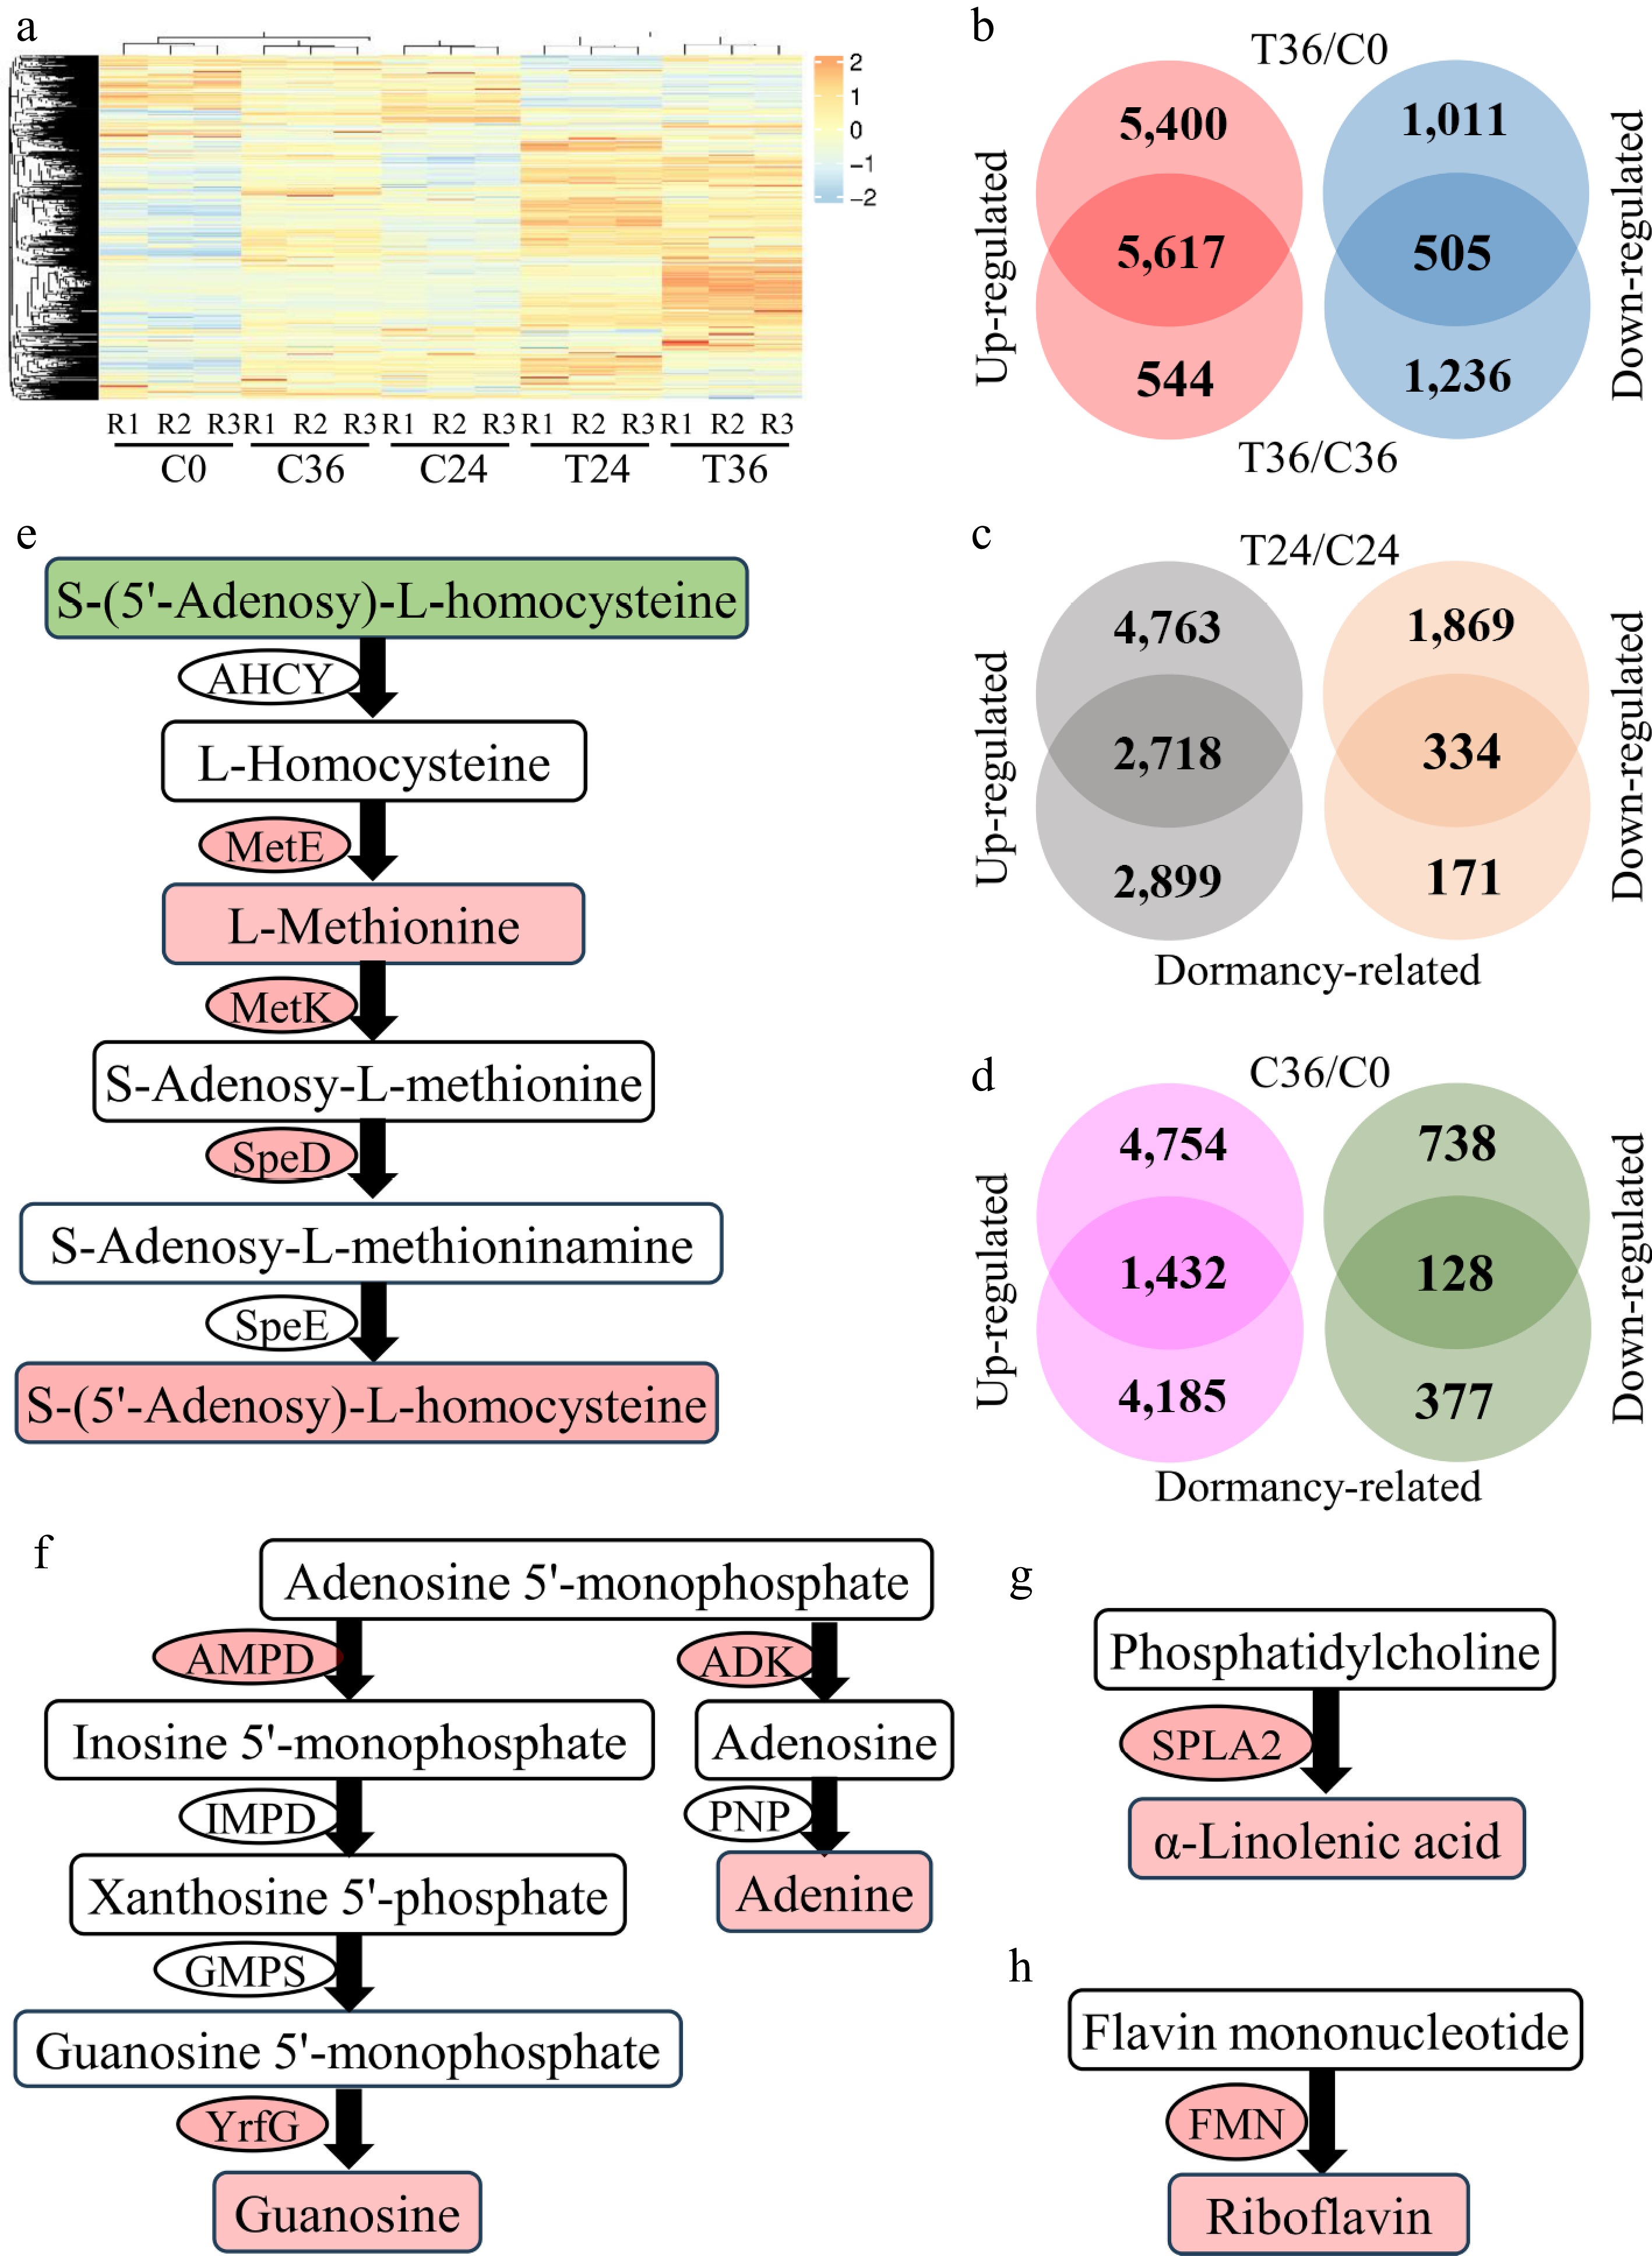
Figure 3.
Differential expression analyses of genes associated with seed germination. (a) A heatmap showing the expression levels of 30,468 genes in coated seeds at 0 (C0), 24 (C24), and 36 h (C36) and uncoated seeds at 24 (T24) and 36 h (T36). R1, R2, and R3 are the three replicates. The level increases with the transition from blue to red. (b) Identification of genes that are responsive to seed germination. Differential expression was tested between T36 and C0 and between T36 and C36. (c) Identification of genes that are responsive to seed germination and differentially expressed between T24 and C24. "Dormancy-related" indicates genes that are responsive to seed germination. (d) Identification of genes that are responsive to seed germination and differentially expressed between C36 and C0. (e) Cysteine and methionine metabolism. AHCY, adenosylhomocysteinase; MetE, 5-methyltetrahydropteroyltriglutamate–homocysteine methyltransferase; MetK, S-adenosylmethionine synthetase; SpeD, S-adenosylmethionine decarboxylase; SpeE, spermidine synthase. The compounds and genes with a red background are increased in T36, compared with C36. In contrast, the compounds with a green background are decreased in T36. (f) Purine metabolism. AMPD, AMP deaminase; IMPD, IMP dehydrogenase; GMPS, GMP synthase; YrfG, 5'-nucleotidase; ADK, adenosine kinase; PNP, purine-nucleoside phosphorylase. (g) Biosynthesis of α-linolenic acid. SPLA2, secretory phospholipase A2. (h) Riboflavin biosynthesis. FMN, acid phosphatase.
To characterize the expression dynamics of these 6,122 genes during seed germination, differential analysis was performed between T24 and C24 and between C36 and C0. In T24, 7,481 genes were upregulated and 1,535 genes were downregulated relative to C24 (Supplementary Table S12). Of the 6,122 seed germination-related DEGs, approximately half (3,057 DEGs) exhibited differential expression between T24 and C24, corresponding to 19.27% of the 109 DACs (Fig. 3c), indicating that changes in gene expression precede metabolite shifts during seed germination. In dormant seeds, 4,754 genes were upregulated and 866 were downregulated in C36 compared with C0 (Supplementary Table S13). Only 1,560 DEGs overlapped with the 6,122 seed germination-responsive genes in this comparison (Fig. 3d), suggesting that the differential expression of these 1,560 DEGs occurs prior to the onset of germination.
To establish gene–metabolite relationships, a correlation-based database was constructed, linking genes to the compounds implicated in seed germination. Correlation analysis was performed between the 6,122 genes and 109 compounds, which identified significant associations for 6,047 genes (FDR < 0.05; Pearson coefficient > 0.85 or < –0.85; Supplementary Table S14). In the database, L-methionine and S-(5'-adenosy)-L-homocysteine exhibited positive correlations with the pathway genes adenosylhomocysteinase (Pbr014761.1 and Pbr031083.1), 5-methyltetrahydropteroyltriglutamate–homocysteine methyltransferase (Pbr016887.1), and S-adenosylmethionine decarboxylase (Pbr008602.1 and Pbr001686.1) (Fig. 3e). Guanosine and adenine correlated positively with AMP deaminase (Pbr019453.1), 5'-nucleotidase (Pbr000542.1), and adenosine kinase (Pbr006128.1) (Fig. 3f). Likewise, α-linolenic acid and riboflavin were associated with the biosynthetic genes secretory phospholipase A2 (Pbr008963.1 and Pbr008987.1) and acid phosphatase (Pbr003100.1, Pbr012159.1, and Pbr007578.1) (Fig. 3g, h). These results demonstrate that the constructed gene–metabolite database effectively identifies crucial genes involved in established metabolic pathways, providing valuable insights into the regulatory mechanisms underlying seed germination.
MicroRNA–gene interactions during seed germination
-
To identify microRNAs involved in seed germination, small RNA sequencing was performed on C0, C24, C36, T24, and T36. In total, 340.4 million raw reads were generated across all samples (Supplementary Table S15). Of these, 329.64 million clean reads were successfully mapped to 39 known and 254 novel microRNAs. Hierarchical clustering of the microRNA expression profiles showed the consistent grouping of biological replicates within each sample (Fig. 4a). Among these microRNAs, 227 were identified as potentially targeting 922 genes, with a reliable expectation threshold of 2.5 (Supplementary Table S16). Notably, 98 microRNAs were found to target 137 genes within the gene–metabolite database (Supplementary Table S14), indicating their potential involvement in seed germination.
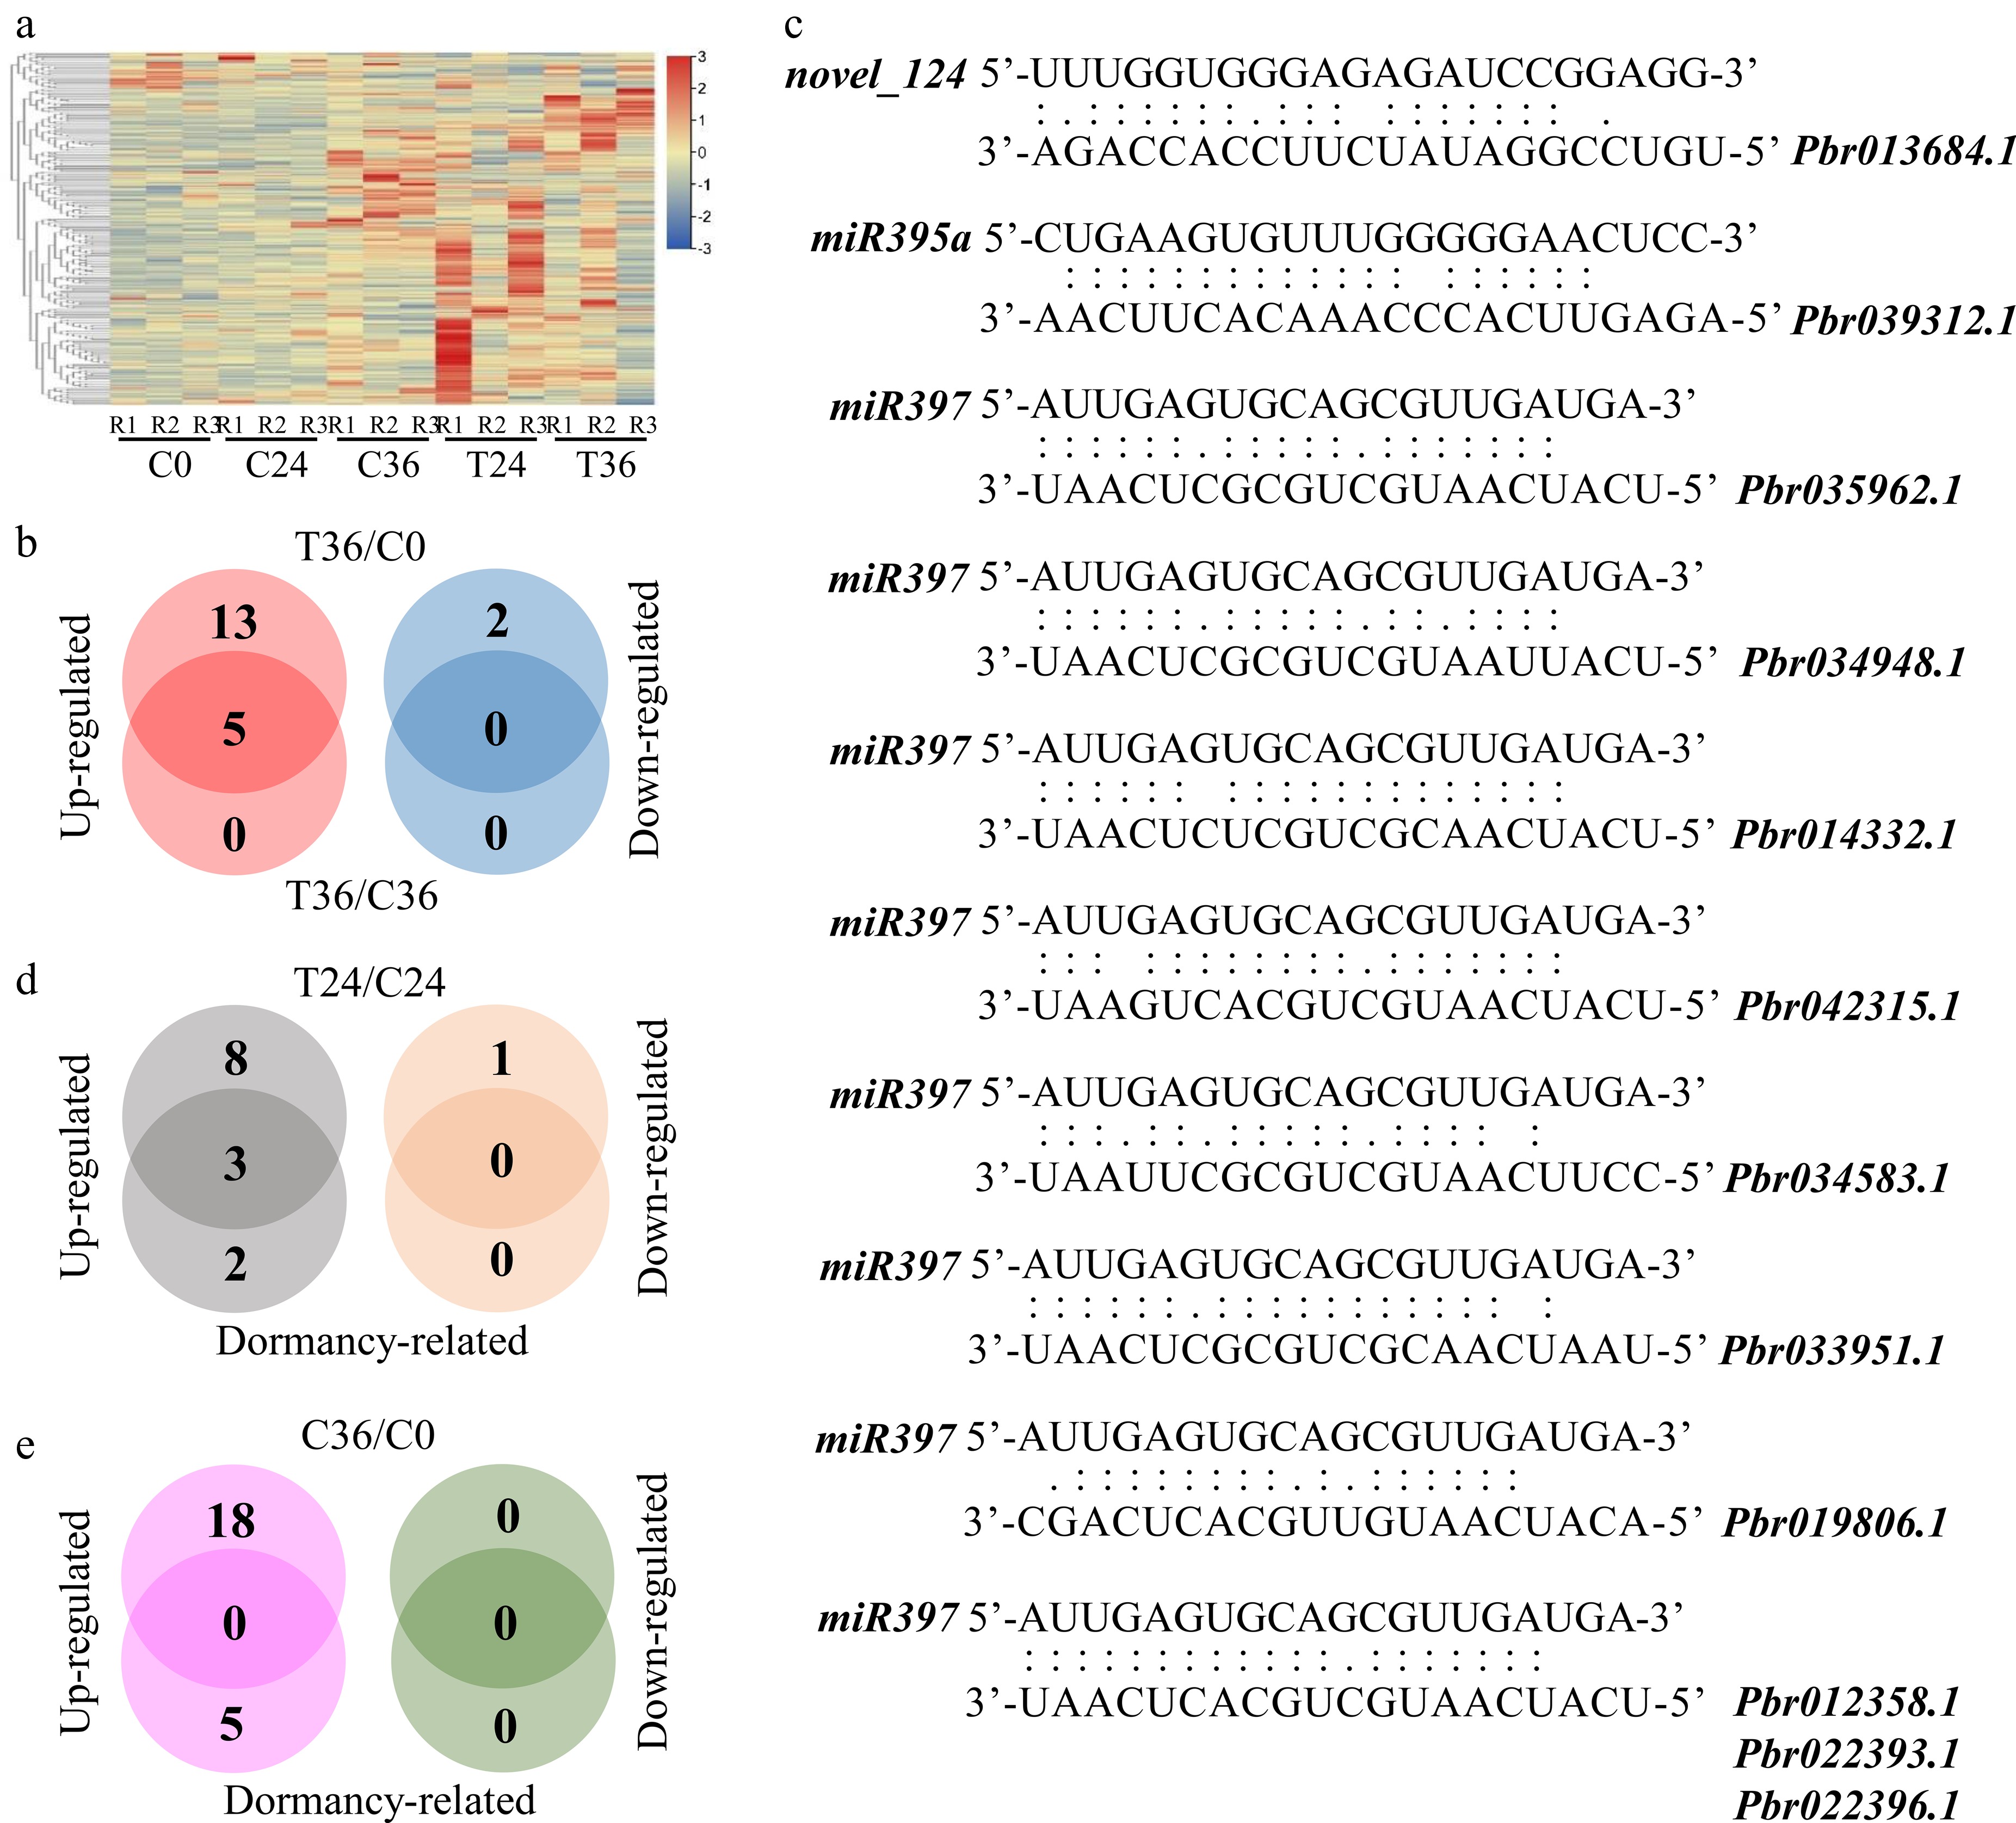
Figure 4.
Differential expression analyses of microRNAs associated with seed germination. (a) A heatmap showing the expression levels of 293 microRNAs in coated seeds at 0 (C0), 24 (C24), and 36 h (C36) and uncoated seeds at 24 (T24) and 36 h (T36). R1, R2, and R3 are the three replicates. The level increases with the transition from blue to red. (b) Identification of microRNAs that are responsive to seed germination. Differential expression was tested between T36 and C0 and between T36 and C36. (c) Prediction of microRNA–gene interactions. (d) Identification of microRNAs that are responsive to seed germination and differentially expressed between T24 and C24. Dormancy-related indicates microRNAs that are responsive to seed germination. (e) Identification of microRNAs that are responsive to seed germination and differentially expressed between C36 and C0.
To further characterize microRNAs that are responsive to seed germination, differential analysis was performed between T36 and C36, as well as between T36 and C0. The analysis showed that only five microRNAs, novel_124, novel_453, miR166c-5p, miR397, and miR395a, were upregulated in T36 compared with C36 (Supplementary Table S17). All five exhibited differential expression between T36 and C0 (Fig. 4b; Supplementary Table S18). Within the gene–metabolite database, novel_124 targeted Pbr013684.1, miR395a targeted Pbr039312.1, and miR397 targeted 10 genes (Pbr012358.1, Pbr022393.1, Pbr022396.1, Pbr035962.1, Pbr034948.1, Pbr014332.1, Pbr033951.1, Pbr042315.1, Pbr019806.1, and Pbr034583.1) (Fig. 4c; Supplementary Table S13). These results indicate that these microRNAs may be involved in seed metabolism during germination by interacting with the target genes and linked metabolic pathways. In addition, novel_124 and miR395a were upregulated in T24 compared with C24 (Fig. 4d; Supplementary Table S19), although no differential expression was observed between C36 and C0 (Fig. 4e; Supplementary Table S20). This result suggests that the differential expression patterns of novel_124 and miR395a likely precede the onset of seed germination.
LncRNA–microRNA–gene interactions during seed germination
-
Hierarchical clustering of lncRNA expression patterns showed the distinct grouping of the three biological replicates within each sample (Fig. 5a). In total, 34,303 lncRNAs were identified, distributed across the antisense (14.8%), intronic (41.2%), and intergenic regions (44.0%; Fig. 5b), spanning all 17 chromosomes and 793 scaffolds (Supplementary Table S21). Of these lncRNAs, 21,004 overlapped with the gene bodies or promoters of 17,037 genes (Fig. 5c; Supplementary Table S21). Notably, 677 lncRNAs exhibited strong correlations with the expression of 641 proximal genes (Supplementary Table S22), indicating a potential regulatory role of these lncRNAs on their neighboring genes.
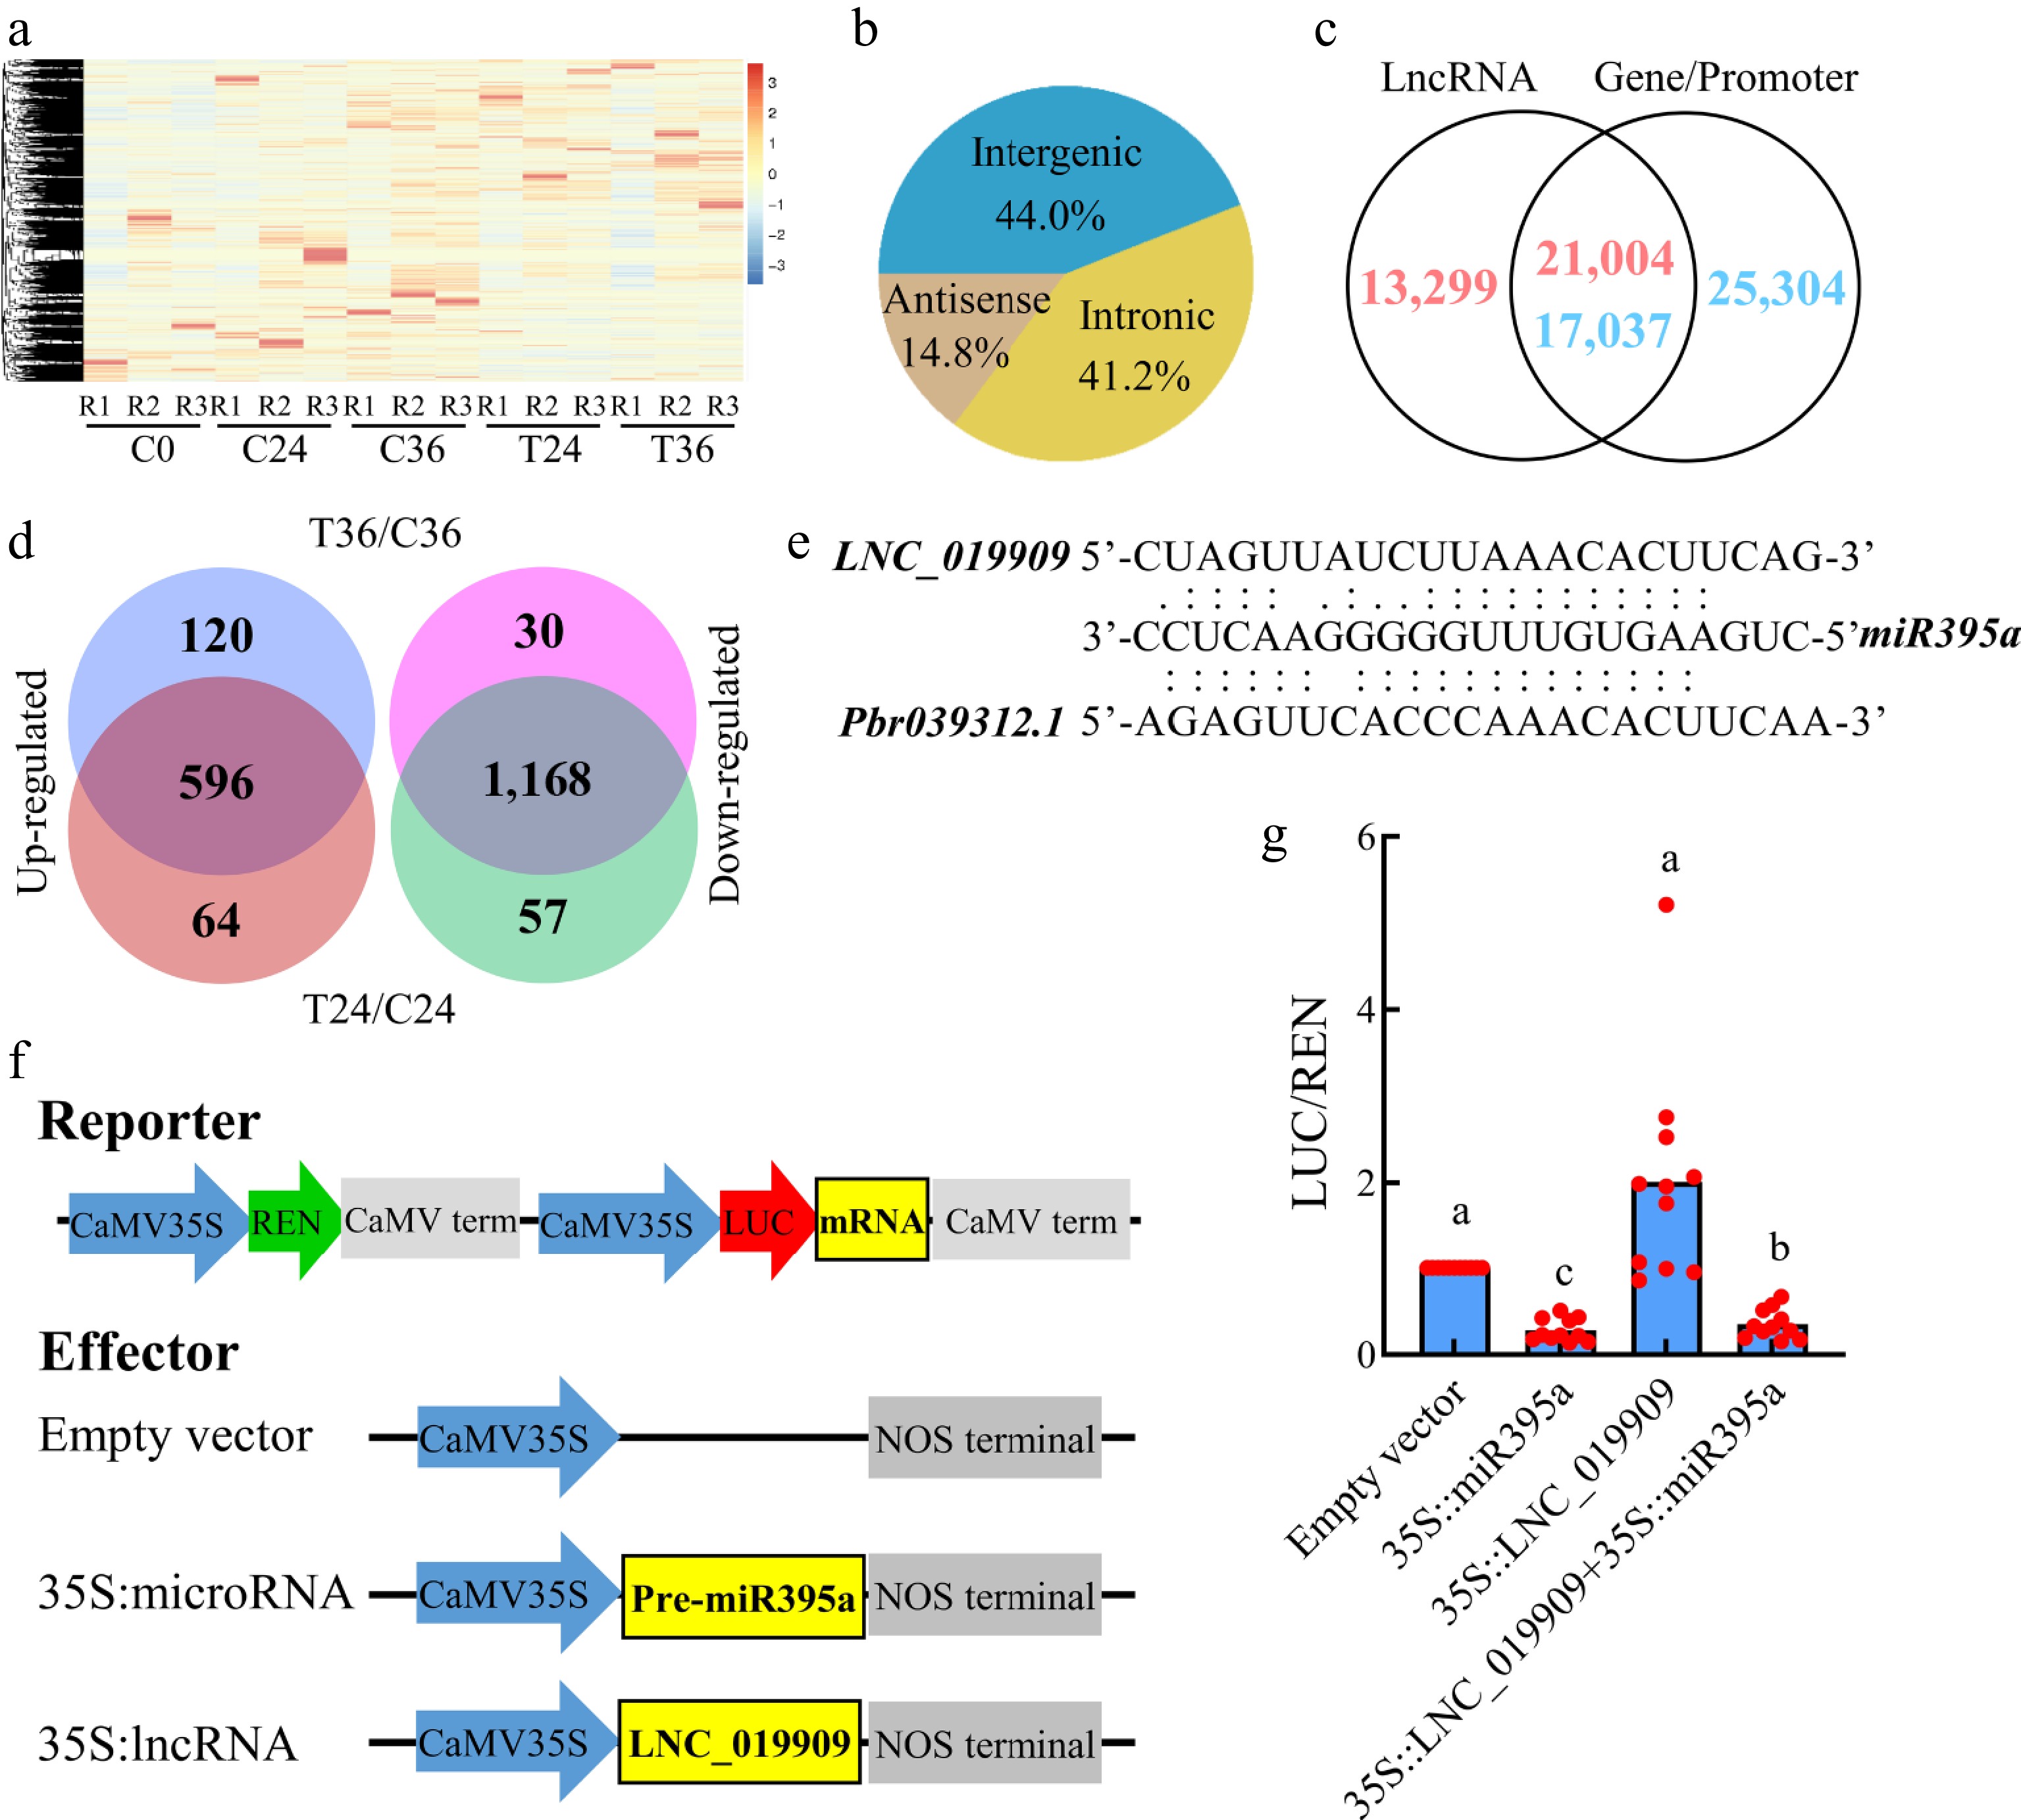
Figure 5.
Identification and differential expression analyses of lncRNAs associated with seed germination. (a) A heatmap showing the expression levels of of 34,303 lncRNAs in coated seeds at 0 (C0), 24 (C24), and 36 h (C36) and uncoated seeds at 24 (T24) and 36 h (T36). R1, R2, and R3 are the three replicates. The level increases with the transition from blue to red. (b) Distribution of lncRNAs in the antisense, intronic, and intergenic regions. (c) Identification of lncRNAs overlapping with gene bodies or promoters. (d) Identification of lncRNAs that are differentially expressed between T36 and C36 and T24 and C24. (e) Prediction of lncRNA–microRNA–gene interactions. (f) Construction of reporter and effector vectors. (g) Dual luciferase assay of lncRNA–microRNA–mRNA interactions.
To identify lncRNAs that are responsive to seed germination, a differential analysis was performed. In total, 716 lncRNAs were upregulated and 1,198 were downregulated in T36 compared with C36 (Supplementary Table S23). Among the 1,914 differentially expressed lncRNAs (DELs), 240 were significantly correlated with 243 genes located within or near their genomic regions. In contrast, no lncRNA showed differential expression between T36 and C0 or between C36 and C0, indicating that the DELs between T36 and C36 may not be essential for seed germination. Moreover, 1,764 of the 1,914 DELs were also differentially expressed between T24 and C24 (Supplementary Table S24), accounting for 93.58% of the DELs detected in the T36 versus C36 comparison (Fig. 5d). These results suggest that most DELs may respond primarily to seed coat removal rather than directly mediating seed germination.
To further identify lncRNAs involved in seed germination, potential interactions between lncRNAs and microRNAs were predicted. In total, 971 were identified as targets of approximately 53.94% of the detected microRNAs (Supplementary Table S22), supporting the existence of a competing endogenous RNA (ceRNA) regulatory mechanism. Among these, 94 DELs were predicted to interact with 60 microRNAs, including miR395a (Supplementary Table S25), and 13 DELs showed significant correlations with 13 genes located within or near their loci. Notably, LNC_019909 was predicted to be targeted by miR395a (Fig. 5c), suggesting a possible role in regulating seed metabolism via modulation of the miR395a–Pbr039312.1 interaction pathway. To verify this regulatory relationship, reporter and effector constructs were generated (Fig. 5f) for the dual luciferase assay. The results showed that miR395a directly binds to Pbr039312.1, causing a significant reduction in luciferase activity, whereas co-expression of LNC_019909 markedly alleviated this repression (Fig. 5g). These findings provide direct functional evidence that LNC_019909 can act as a molecular sponge for miR395a, thereby weakening its inhibitory effect on Pbr039312.1, thus supporting the proposed ceRNA-based regulatory role of LNC_019909 in metabolic regulation during seed germination.
-
Seed dormancy and germination are orchestrated by a complex interplay of phytohormones. Among these, ABA serves as a major inducer of seed dormancy and an inhibitor of germination[31,32], whereas GA acts antagonistically to break dormancy and stimulates germination[33]. IAA also hinders germination by disrupting GA biosynthesis, promoting the accumulation of ABA, and interacting with ABA signaling pathways[34,35]. In this study, a marked reduction in ABA and IAA levels was observed in germinated seeds compared with dormant seeds (Fig. 1b), consistent with previous findings[4]. The concurrent decline in ABA and IAA was accompanied by an increase in GA content[4], thereby promoting the germination process. Interestingly, SA levels, which impede germination by suppressing GA-responsive gene expression[36], also increased (Fig. 1b), indicating a potential interplay between GA-induced SA biosynthesis and the inhibitory effects of IAA and ABA. These results indicate a finely tuned hormonal equilibrium between GA and SA that is essential for optimizing seed germination in pear.
In a prior investigation, exogenous ABA application was found to impede the germination of uncoated seeds by modulating the accumulation of 251 compounds and the expression of 6,348 genes[5]. In the present study, during natural germination, only 23 compounds exhibited patterns similar to those induced by the application of ABA (Fig. 2d), representing a mere 21.1% of all compounds that are responsive to seed germination. Although this numerical proportion is relatively low, it does not necessarily indicate a limited functional role for ABA. Many of these ABA-responsive metabolites likely serve as critical signaling intermediates that activate downstream gene expression programs governing germination. Consistent with this interpretation, 2,540 DEGs displayed expression patterns correlated with ABA levels, accounting for 41.49% of all genes that are responsive to seed germination (Supplementary Table S11), highlighting ABA's substantial influence at the transcriptional level and its recognized role as a key negative regulator of seed dormancy[30]. It is well established that GAs act as the primary positive hormonal regulators of seed germination, stimulating embryos' growth and weakening the physical constraints imposed by the seed coat[30,37]. Although GA was not directly quantified in this study, extensive research strongly supports its prominent stimulatory function during germination. Collectively, our findings complement this hormonal framework by showing that, despite a relatively small overlap between ABA-responsive metabolites and germination-associated compounds, ABA exerts a highly specific yet powerful regulatory influence. Through these metabolites and its extensive transcriptional networks, ABA contributes critically to fine-tuning the dormancy-to-germination transition in pear seeds.
The gene–metabolite database reveals the metabolic regulatory network during seed germination
-
Integrated transcriptomic and metabolomic analysis has emerged as a powerful approach for delineating metabolic regulatory networks across diverse plant tissues. In pear, this strategy has been instrumental in elucidating the regulatory networks governing esters[23,38], terpenoids[39], sugar[40], lignin[41,42], peel coloration[43,44], fruit reddening[45,46], cuticular wax[47], and other aspects of fruit quality[47−50]. A prior investigation in pear used transcriptomic and metabolomic analyses to investigate the inhibitory effects of ABA on seed germination[5]. In this study, transcriptomic analysis showed that the ABA biosynthesis gene PbNECD.C1 (Pbr006010.1) was significantly downregulated in germinated seeds (T36) in comparison with dormant (C36) and untreated seeds (C0; Supplementary Tables S9, S10). This expression pattern aligns with earlier observations[4], indicating a reduction in ABA levels during seed germination (Fig. 1b).
Beyond phytohormone profiling, 620 compounds were identified in pear seeds (Supplementary Table S2), 424 of which were also detected previously in the developing fruit flesh[25]. Among these 620 compounds, 109 were responsive to the germination process (Supplementary Table S5). Notably, the metabolic profiles of these 109 compounds demonstrated both concordant or divergent trends when compared with the expression patterns of 6,047 genes across the five samples examined (Supplementary Table S11). A comparison of the current gene–metabolite network with that constructed for fruit development[25] revealed an overlap of 86 metabolites (Supplementary Table S26). However, only approximately 10% of the associated genes were shared (Supplementary Table S26), highlighting substantial divergence in the molecular regulatory architecture controlling seed versus fruit metabolism in pear. Within the gene–metabolite database established here, key genes were identified in pathways related to α-linolenic acid biosynthesis, riboflavin biosynthesis, cysteine and methionine metabolism, and purine metabolism (Fig. 2e–h). Moreover, multiple transcriptional cascades associated with ABA accumulation have been reported in pear fruit[25], and a NAC4- AAT10 model was determined to be involved in ester biosynthesis in kiwifruit (Actinidia chinensis)[51]. These results underscore the utility of the gene–metabolite database established in this study as an effective tool for decoding the metabolic regulatory network underlying seed germination in pear.
Noncoding RNAs are involved in regulating seed germination
-
Research into the molecular mechanisms governing seed dormancy and germination has revealed several key molecular pathways[33,52]. In rice (Oryza sativa), a mutation in miR156 suppresses the expression of Ideal Plant Architecture 1, leading to inhibited GA signaling and enhancing seed dormancy[53]. Conversely, in Arabidopsis thaliana, miR163 and miR402 facilitate germination by targeting paraxanthine methyltransferase 1 and demeter-like protein 3, respectively[54,55]. MiR160 modulates the interplay between auxin and ABA by targeting auxin response factor 10[56], whereas miR159 regulates the accumulation of both ABA and GA by targeting GA-MYB transcription factors[57,58]. In this study, three microRNAs (novel_124, miR395a, and miR397) and their 12 gene targets in the gene–metabolite database were found to be responsive to seed germination (Fig. 4), indicating their involvement in this process. Among them, miR395a was identified to target the lncRNA LNC_019909 (Fig. 5), suggesting a potential role of LNC_019909 in seed metabolism through the lncRNA–microRNA–mRNA regulatory axis. Moreover, a significant proportion of microRNAs have the capacity to target at least one lncRNA (Table S22), implying that lncRNAs may function as ceRNAs in regulating seed germination[17]. Beyond ceRNA-mediated regulation, other lncRNAs may directly modulate the expression of genes implicated in germination. For instance, in Arabidopsis, the lncRNA AtR8 regulates WRKY46 and its downstream target Late Embryogenesis Abundant 6 to mediate seed germination[59]. Similarly, in cabbage (Brassica oleracea), the lncRNA BoNR8 regulates genes within the ABA signaling pathway[60]. These results underscore the multifaceted roles of lncRNAs and microRNAs in orchestrating the complex transcriptional and metabolic networks governing seed germination.
This work was supported by the Jiangsu Seed Industry Revitalization Project (JBGS[2021]022), the Key Research and Development Program (Modern Agriculture) of Jiangsu Province (BE2022381), the Fundamental Research Funds for the Central Universities (YDZX2025036), and the Bioinformatics Center of Nanjing Agricultural University.
-
The authors confirm their contributions to the paper as follows: conception, design of the experiments: Qi KJ, Gu C, Zhang SL; conducting the experiments: Qi KJ, Zheng SQ, Ye YP, Cui YB, Xie ZH, Wang YR; data analysis: Qi KJ, Zheng SQ, Ye YP; manuscript draft preparation: Qi KJ, Zheng SQ; manuscript review: Gu C, Zhang SL. All authors reviewed the results and approved the final version of the manuscript.
-
The whole-transcriptome sequencing data have been deposited in the Genome Sequence Archive at China's National Center for Bioinformation (PRJCA040547).
-
The authors declare that they have no conflict of interest.
-
# Authors contributed equally: Kai-Jie Qi, Si-Qi Zheng
- Supplementary Table S1 Primer pairs used in this study.
- Supplementary Table S2 Metabolic compounds detected in pear seeds.
- Supplementary Table S3 The differentially accumulated compounds between T36 and C36.
- Supplementary Table S4 The differentially accumulated compounds between T36 and C0.
- Supplementary Table S5 The compounds associated with seed germination.
- Supplementary Table S6 The differentially accumulated compounds between C24 and T24.
- Supplementary Table S7 The differentially accumulated compounds between C0 and C36.
- Supplementary Table S8 The sequence reads of transcriptome and their mapping results to a reference genome.
- Supplementary Table S9 The differentially expressed genes between C36 and T36.
- Supplementary Table S10 The differentially expressed genes between C0 and T36.
- Supplementary Table S11 Function annotation of the genes associated with seed dormancy and germination.
- Supplementary Table S12 The differentially expressed genes between C24 and T24.
- Supplementary Table S13 The differentially expressed genes between C0 and T36.
- Supplementary Table S14 A gene-metabolite database was constructed by integrative analysis of 109 DACs and 6122 DEGs.
- Supplementary Table S15 Sequence reads of small RNAs in pear fruit and their mapping results in pear.
- Supplementary Table S16 Prediction of genes targeted by microRNAs.
- Supplementary Table S17 The differentially expressed microRNAs between C36 and T36.
- Supplementary Table S18 The differentially expressed microRNAs between C0 and T36.
- Supplementary Table S19 The differentially expressed microRNAs between C24 and T24.
- Supplementary Table S20 The differentially expressed microRNAs between C0 and T36.
- Supplementary Table S21 Identification of lncRNAs in seed.
- Supplementary Table S22 Identification of lncRNAs correlating with genes.
- Supplementary Table S23 The differentially expressed lncRNAs between C36 and T36.
- Supplementary Table S24 The differentially expressed lncRNAs between C24 and T24.
- Supplementary Table S25 Prediction of lncRNAs targeted by microRNAs.
- Supplementary Table S26 Summary of genes showing correlation with each compound.
- Supplementary Fig. S1 Experimental design for assessment of seed germination in pear.
- Copyright: © 2026 by the author(s). Published by Maximum Academic Press on behalf of Hainan Yazhou Bay Seed Laboratory. This article is an open access article distributed under Creative Commons Attribution License (CC BY 4.0), visit https://creativecommons.org/licenses/by/4.0/.
-
About this article
Cite this article
Qi KJ, Zheng SQ, Ye YP, Cui YB, Xie ZH, et al. 2026. Integration analysis of the metabolome, transcriptome, and microRNAome provides insights into the metabolic regulatory networks of seed germination in pear. Seed Biology 5: e004 doi: 10.48130/seedbio-0026-0002 

Integration analysis of the metabolome, transcriptome, and microRNAome provides insights into the metabolic regulatory networks of seed germination in pear
- Received: 04 November 2025
- Revised: 06 January 2026
- Accepted: 12 January 2026
- Published online: 28 February 2026
Abstract: Seed dormancy is an important physiological stage in many seed-bearing plants and can be broken by removing the seed coat, yet the underlying physiological and molecular mechanisms remain elusive. In this study, analyses of the metabolome, transcriptome, and microRNAome were conducted on pear seeds with and without coats, identifying 632 compounds, 30,468 genes, 293 microRNAs, and 34,303 long noncoding RNAs (lncRNAs). Differential analyses revealed 114 germination-responsive compounds, including indole-3-acetic acid, dihydrojasmonic acid, jasmonic acid-isoleucine, abscisic acid, and salicylic acid, together with 7,358 genes and 5 microRNAs. A correlation-based gene–metabolite database comprising 6,047 genes and 109 compounds was constructed. Among these, 29 compounds and 2,670 genes were responsive to abscisic acid (ABA), and the ABA levels declined in germinated seeds, reinforcing ABA's central role in dormancy control. Three microRNAs (miR395a, miR397, and novel_124) targeted 12 genes within the database. Notably, the lncRNA LNC_019909 was targeted by miR395a and interacts with the gene Pbr039312.1, suggesting a lncRNA–microRNA–mRNA regulatory axis influencing metabolite synthesis during germination. Collectively, these findings highlight coordinated hormone dynamics and noncoding RNA regulation and provide a systems-level framework for the metabolic regulatory network that governs seed germination in a perennial fruit tree.
-
Key words:
- Pyrus /
- Seed /
- Metabolic network /
- microRNA /
- lncRNA