












-
Dysthyroid optic neuropathy (DON) is a vision-threatening complication of thyroid eye disease (TED), occurring in an estimated 3%–8% of individuals diagnosed with TED[1−3]. Although its exact pathogenic mechanisms are not fully understood, DON is widely believed to result from compression, stretching, and ischemia of the optic nerve caused by increased crowding of the orbital tissue at the orbital apex[4−6]. Clinically, DON often develops insidiously yet progresses rapidly, and can lead to significant and sometimes irreversible vision loss if not treated promptly[1,7]. Early identification is therefore critical for initiating timely interventions and preserving visual function[8−10].
Currently, there is no universally accepted gold standard for identifying DON in clinical practice[11,12]. Common ophthalmological assessments, including visual acuity, visual field testing, optic disc evaluation, and color vision examination, remain the cornerstone of clinical evaluation and are widely used in routine diagnostic workups[13−15]. However, these signs are not specific to DON and may also occur in TED patients without DON (nDON), leading to diagnostic delays and clinical uncertainty[16,17]. Moreover, the diagnostic performance of individual indicators may vary across patients, and their assessment can be influenced by the testing conditions and the patients' cooperation[18,19]. Consequently, there remains a need for complementary and more objective evaluation methods to assist in the clinical assessment of DON.
Orbital magnetic resonance imaging (MRI), recommended by the European Group on Graves’ Orbitopathy (EUGOGO) guidelines, has emerged as a key noninvasive tool in managing TED[20,21]. Its high soft-tissue resolution allows detailed assessments of disease activity, evaluations of treatment response, and stratification of disease severity[20,21]. These advantages make orbital MRI a useful imaging modality in the evaluation of suspected DON. A number of studies have conducted quantitative and qualitative analyses of orbital structures, including the orbital walls, orbital fat, extraocular muscles, optic nerve, and eyeball, to improve detection efficacy[22−31]. Beyond conventional orbital MRI, recent advances in brain MRI techniques have opened new perspectives on DON. Studies have revealed functional and structural changes along the central visual pathways, indicating that DON involves more than just mechanical compression[32−38]. Importantly, these alterations in the central visual system may serve as a complementary approach to conventional orbital MRI[34−38]. Moreover, considering that different MRI modalities can provide varied perspectives for understanding the disease, researchers have also combined two modalities in an effort to obtain more comprehensive data[39,40] (Fig. 1).
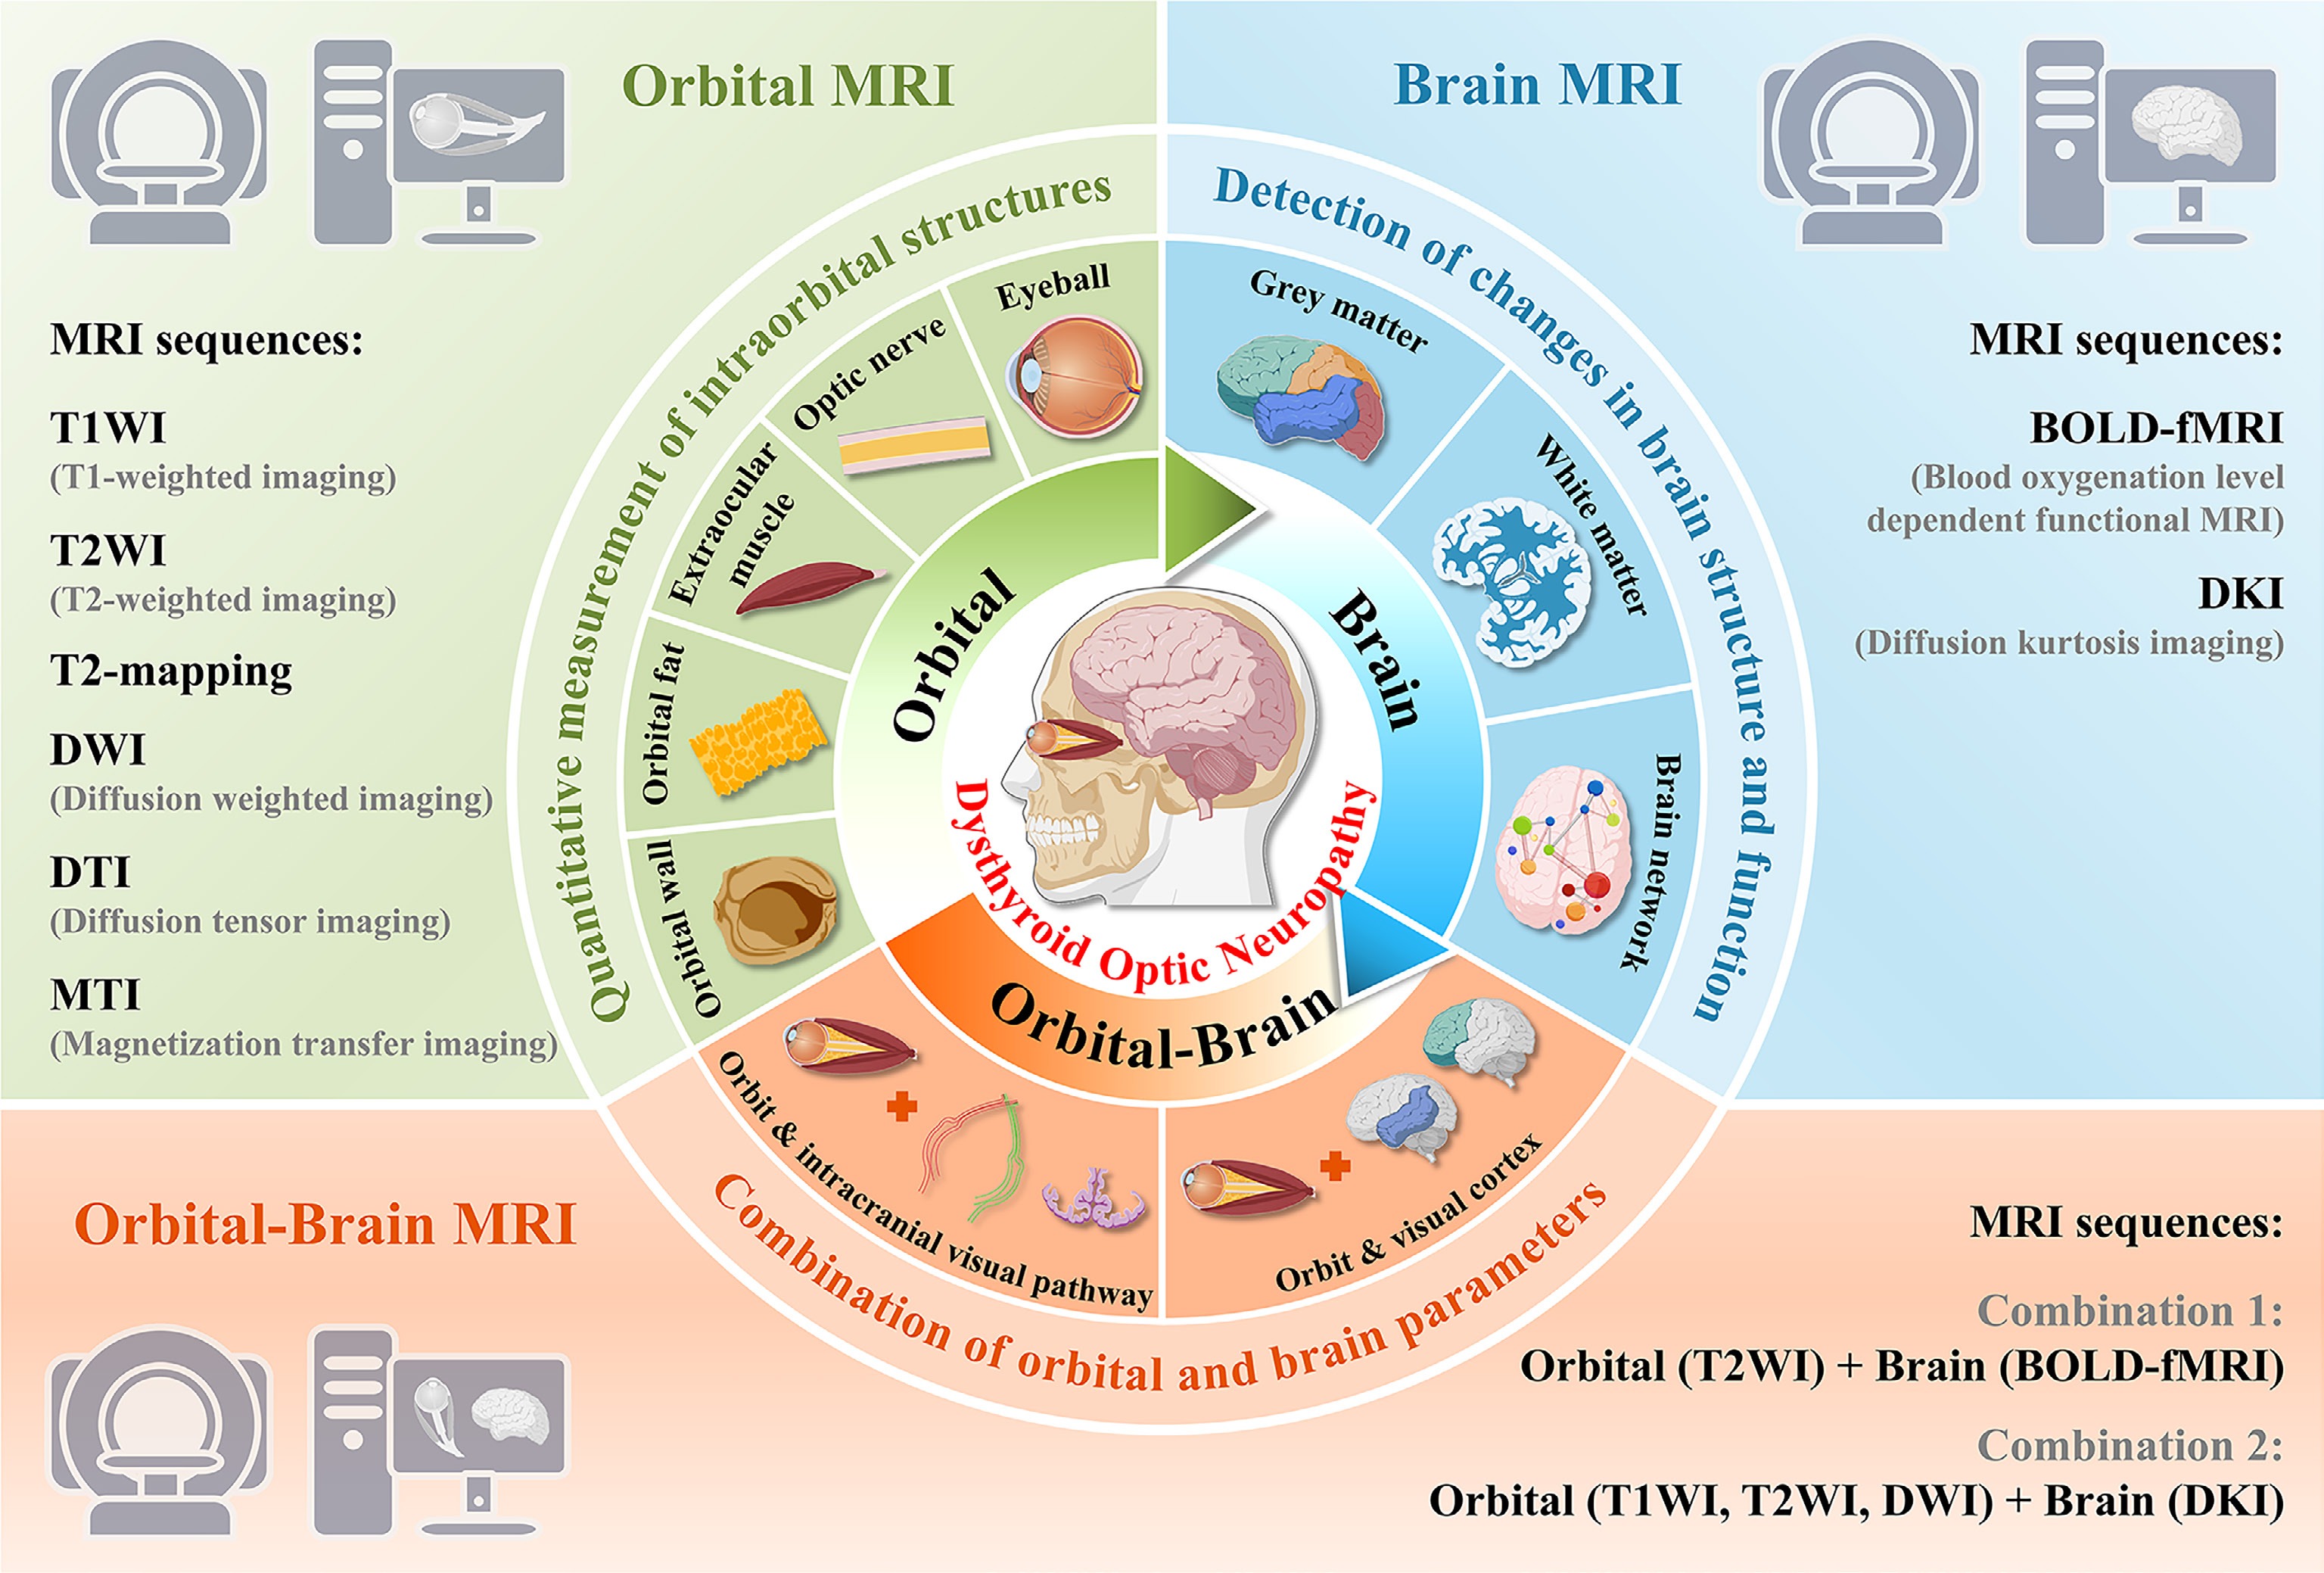
Figure 1.
Schematic overview of current MRI modalities and their applications in the identification of dysthyroid optic neuropathy. This figure was created with
BioGDP.com [41].With the rapid growth of MRI research in this area, novel insights into the identification of DON are continually emerging. Accordingly, we conducted this systematic review to synthesize the existing evidence on the application of MRI in DON. We discussed how these MRI metrics may relate to underlying pathological mechanisms, thereby supporting their potential value in the evaluation of DON, and also outlined current trends and future research directions in this evolving field.
-
This systematic review was registered on the International Prospective Register of Systematic Reviews (PROSPERO) platform (
www.crd.york.ac.uk/PROSPERO/view/CRD420251151922 ) and was conducted following the Preferred Reporting Items for Systematic Reviews and Meta-Analyses (PRISMA) Statement[42].Search strategy
-
A systematic literature search of the Web of Science, PubMed, and Embase databases was conducted by two independent researchers (Researcher 1 and Researcher 2, with 5 and 13 years of experience in radiology, respectively) from their inception to September 3, 2025. In all databases, search terms were limited to the title and abstract: ("dysthyroid optic neuropathy" OR "thyroid-associated optic neuropathy") AND ("magnetic resonance imaging" OR MRI).
Selection criteria
-
Eligibility was restricted to original research studies published in the English language. The inclusion criteria were as follows: Studies were included if they (1) enrolled patients diagnosed with DON, (2) conducted radiological evaluations using MRI, and (3) compared MRI parameters between DON and nDON or healthy control (HC) groups. The exclusion criteria were as follows: We excluded those that (1) did not specifically focus on DON, (2) did not use MRI as a primary imaging modality, and (3) did not assess MRI for identifying DON.
Data extraction
-
Two researchers (Researcher 1 and Researcher 2) independently extracted the following data from each study: Authors, year of publication, MRI sequences, participant classification, sample size, age, sex, TED duration, clinical activity score, smoking history, history of 131I therapy, thyrotropin receptor antibody, best corrected visual acuity (BCVA), visual field index, mean deviation, pattern standard deviation, intraocular pressure, proptosis, MRI parameters, outcome of statistical analyses, and the results of receiver operating characteristic (ROC) curve analysis (area under the ROC curve [AUC], cutoff value, sensitivity, specificity, and p- value of the DeLong test). For studies that reported both training and validation cohorts, data were extracted separately for each cohort. Any discrepancies in data extraction were resolved through consultation with a third senior researcher (Researcher 3, with 16 years of experience in radiology).
Risk of bias/quality assessment
-
The Quality Assessment of Diagnostic Accuracy Studies (QUADAS)-2 tool was used to assess the methodological quality of each included study[43]. This tool comprises four domains: Patient selection, index test, reference standard, and flow and timing. For each domain, the risk of bias was evaluated, and applicability concerns were specifically rated for the first three domains, with all judgments categorized as "low," "high," or "unclear"[43]. The quality assessment was conducted independently by two researchers (Researcher 1 and Researcher 2). Any discrepancies identified between their assessments were resolved by discussion or by a third senior researcher (Researcher 3).
-
In total, 292 records were screened initially from the electronic databases using the described search strategy. After removing all duplicates, 123 studies were excluded. Among the remaining 169 studies, 79 studies were excluded for not being original research, and 73 studies were excluded on the basis of the inclusion and exclusion criteria through full-text screening. Ultimately, 17 studies were included in this systematic review[22−31,34−40]. The study selection process is summarized in the PRISMA flowchart (Fig. 2). Of the 17 included studies, 10 studies (10/17, 58.82%)[22−31] utilized orbital MRI, 5 studies (5/17, 29.41%)[34−38] used brain MRI, and 2 studies (2/17, 11.76%)[39,40] used a combined orbital–brain MRI.
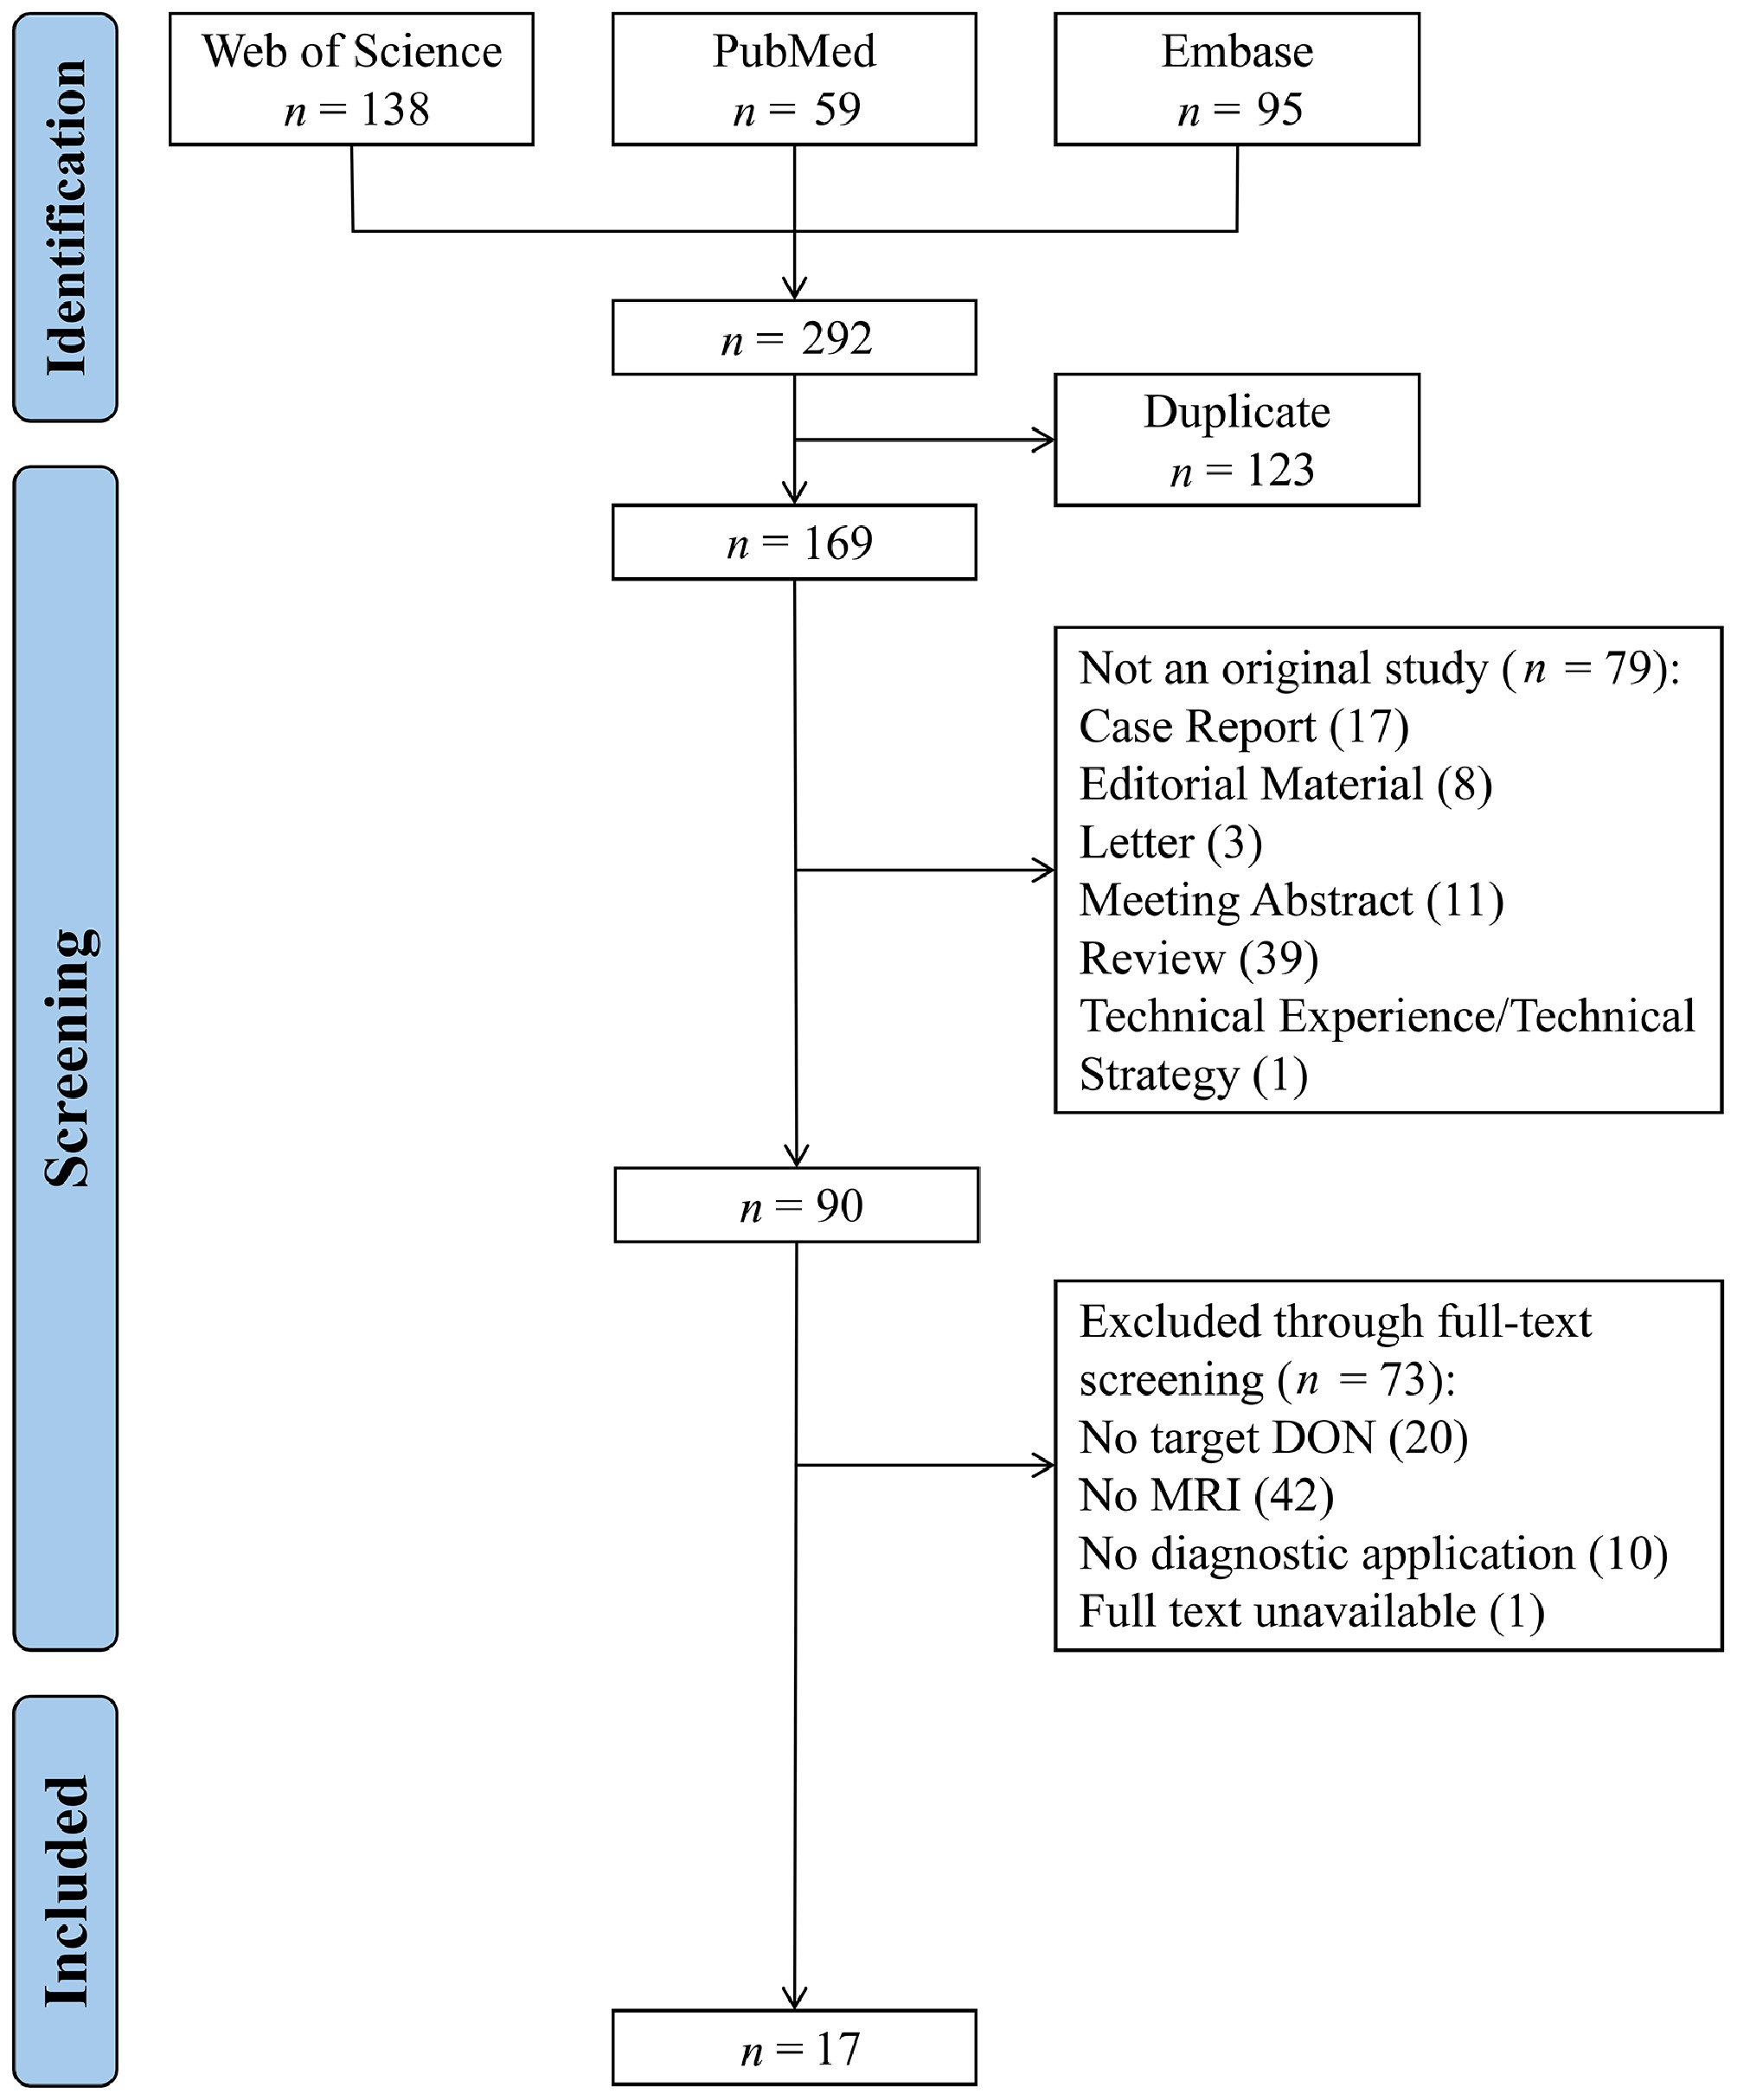
Figure 2.
PRISMA flow diagram.
Risk of bias/quality assessment
-
Each included study was evaluated using the QUADAS-2 tool to assess potential biases that could compromise the reliability of its findings. The summary of QUADAS-2 quality assessments for all studies is shown in Fig. 3.
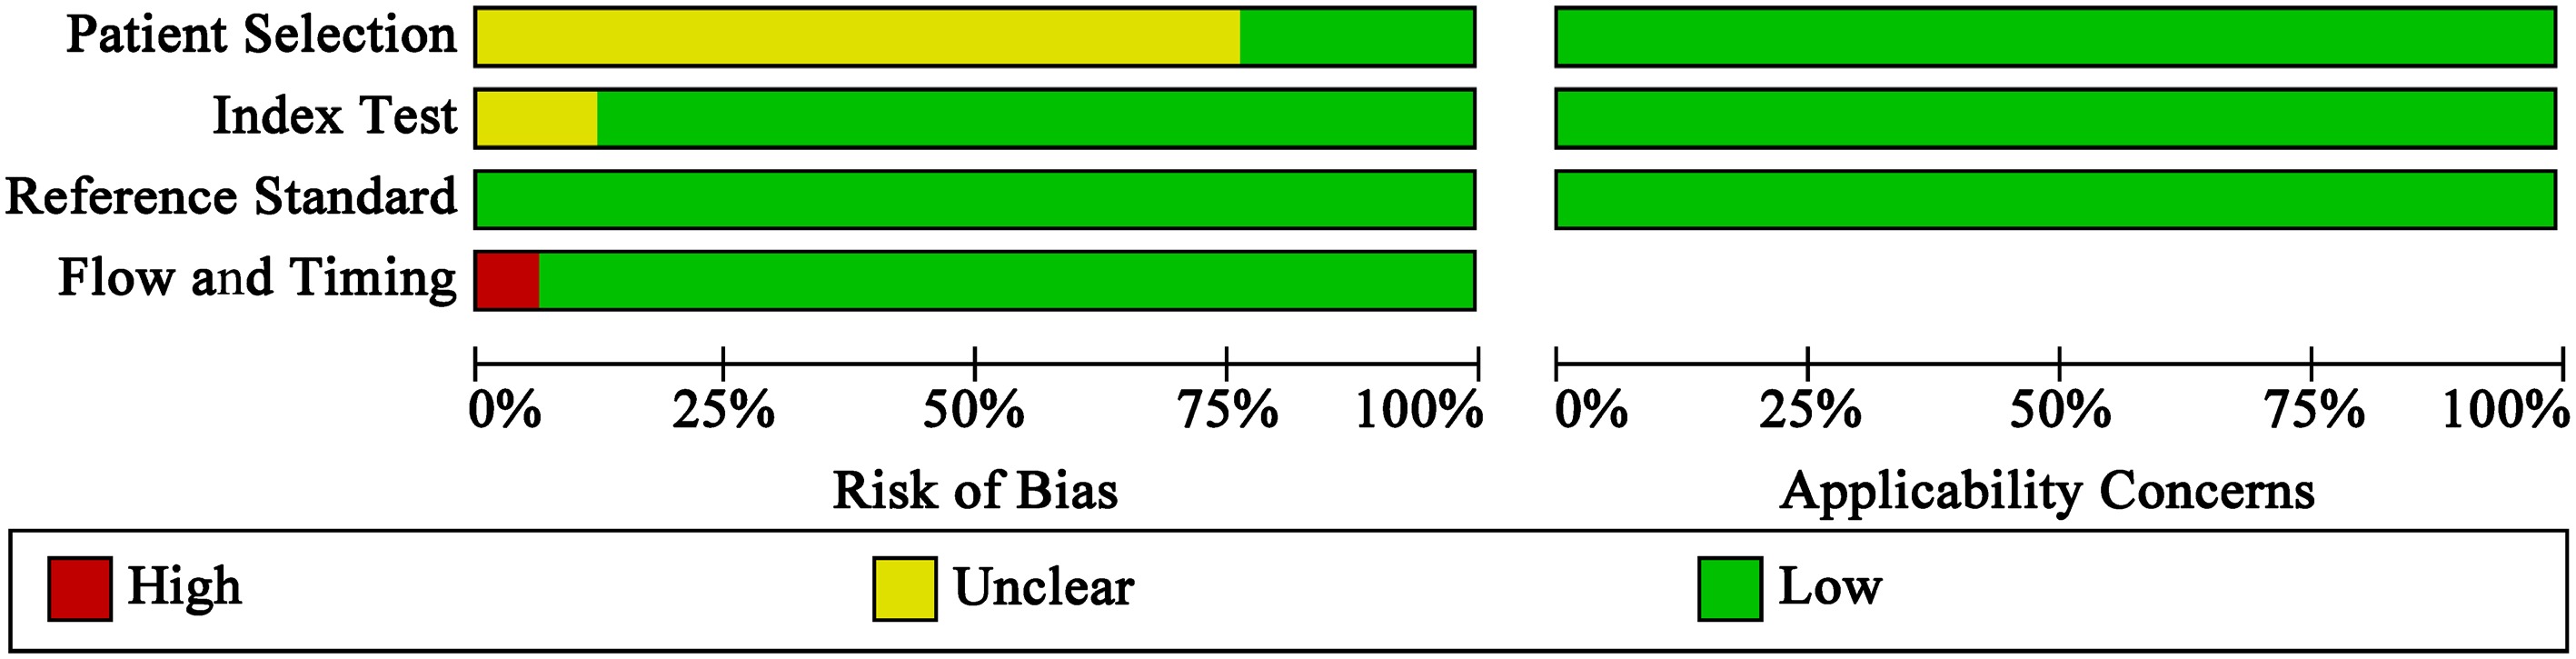
Figure 3.
Summary of QUADAS-2 quality assessment findings regarding the risk of bias and applicability concerns across all included studies.
Descriptive characteristics
-
The time span of these studies ranged from 2021 to 2025, with the majority of the research teams being from China (16/17, 94.12%). Of the 17 studies, 7 (41.18%)[24,25,27,29,31,34,38] fully reported both inclusion and exclusion criteria, whereas the remaining 10 studies (58.82%)[22,23,26,28,30,35−37,39,40] described only the inclusion or exclusion criteria. DON was identified in patients with TED presenting with specific clinical manifestations, such as decreased BCVA, visual field defects, abnormal color vision, optic disc edema (or papilledema), relative afferent pupillary defects, and abnormal pattern visual evoked potentials. The majority of studies (14/17, 82.35%)[22,24−26,28−31,34−37,39,40] used the presence of at least two clinical manifestations as a criterion for identifying DON, although the specific manifestations used were inconsistent. Two studies (2/17, 11.76%)[23,38] considered a single manifestation as a sufficient criterion, whereas one study (1/17, 5.88%)[27] did not specify the requisite number.
In total, 1,664 TED patients with or without DON and 186 HCs were assessed. The mean age of participants ranged from 39.97 (Song et al.[26]) to 57.93 years (Zhou et al.[22]), with a relatively narrow range indicating a consistent age distribution among the study populations. Among TED patients, 611 were male and 1,011 were female (one study had partially missing data[24]), with most studies (11/17, 64.71%)[22−24,28,34−40] reporting a higher proportion of females. The distribution of age and sex described above is consistent with the established epidemiological profile of TED[20,44]. A summary of the general characteristics of the participants in the included studies is provided in Table 1.
Table 1. Demographic and clinical characteristics of participants in the included studies.
Study/MRI sequences Participant Sample size (patients/
eyes)Age (year) Sex (male/
female)TED duration (months) CAS Smoking history (yes/no) 131I therapy (yes/no) TRAb
(IU/L)BCVA VFI MD (dB) PSD (dB) IOP (mmHg) Proptosis (mm) Wu et al.[31] (2021)
IDEAL-T2WIDON 30/54 50.5 ± 9.99 18/12 6 (4, 12) 4 (2, 5)a 11/19 / / 0.55 ± 0.3a / −4.50 (−10.07, −2.68)a 3.79 (2.02, 6.57)a 20.96 ± 4.60a 19.87 ± 2.59a nDON 30/60 47.63 ± 8.77 13/17 5 (2, 6) 2 (1, 3)a 11/19 / / 0.82 ± 0.27a / −2.05 (−2.85, −0.86)a 1.68 (1.43, 2.13)a 20.08 ± 6.07a 19.15 ± 2.86a HC 19/38 46.53 ± 11.97 7/12 / / 8/11 / / 0.88 ± 0.32a / / / / / Liu et al.[30] (2022)
DTIDON 23/46 55.35 ± 8.89 13/10 6 (2, 10) 2 (1, 4)a 10/13 3/20 16.86 ± 11.16 0.8 (0.5, 1.0)a / −5.64 ± 7.3a 5.44 ± 3.88a 18 (17, 20)a 19 (16, 21)a nDON 36/72 52.14 ± 7.93 18/18 6 (3, 12) 2 (1, 3)a 14/22 8/28 10.56 ± 11.81 1 (0.8, 1)a / −4.69 ± 1.9a 4.59 ± 1.69a 19 (17, 21)a 18 (16.225, 20)a Wu et al.[29] (2022)
IDEAL-T2WITraining cohort DON 46/83 50.93 ± 8.39 25/21 5.59 ± 3.77 4 (2, 5)a 18/28 / / 0.6 (0.5, 1.0)a / / / / 19 (18, 21)a nDON 42/80 45.90 ± 8.64 19/23 8.93 ± 10.90 2 (1, 2.75)a 15/27 / / 0.85 (0.8, 1.0)a / / / / 19 (17.25, 20)a Validation cohort DON 13/21 52.57 ± 12.17 7/6 6.29 ± 4.33 3 (2, 3)a 5/8 / / 0.5 (0.25, 0.8)a / / / / 19 (18, 20)a nDON 27/51 47.1 ± 9.0 18/9 6.97 ± 4.9 2 (1.5, 2)a 9/18 / / 0.8 (0.8, 1.0)a / / / / 19 (18, 20)a Zou et al.[28] (2022)
T1WI, FS-T2WI, Dixon-T2WI, T2-mapping, 3DT1DON 26/43 49.9 ± 12.3 3/23 8 (3, 16) / 20/6 3/23 19.295 (5.097, 41.315) / / / / / / nDON 33/66 45.1 ± 13.1 16/17 6 (3, 12) / 14/19 3/30 10.755 (3.620, 20.125) / / / / / / Zhang et al.[27] (2022)
T1WI, T2WIDON 16/23 45.04 ± 7.85 9/7 / / / / / 0.66 ± 0.38a, * / −16.51 ± 5.81a 5.38 ± 3.49a 21.56 ± 5.01a 18.39 ± 3.14a nDON 23/37 46.05 ± 5.39 12/11 / / / / / 0.10 ± 0.16a, * / −1.96 ± 1.70a 2.13 ± 0.98a 15.68 ± 2.83a 17.56 ± 3.26a HC 11/21 43.09 ± 9.09 6/5 / / / / / −0.01 ± 0.05a, * / / / 14.86 ± 2.43a / Song et al.[26] (2023)
T1WI, Dixon-T2WI, 3DT1DON 24/48 51.00 ± 12.91 13/11 6.00 (3, 12) 4 (4, 5)a 6/18 / 6.240 (3.060, 25.430) / / / / 20 (17, 23)a 18 (14, 22)a nDON 39/78 39.97 ± 10.96 21/18 5.00 (3, 12) 3 (1, 4)a 12/27 / 7.850 (2.470, 24.880) / / / / 17 (16, 19)a 17 (16, 19)a Wu et al.[25] (2024)
IDEAL-T2WITraining cohort DON 30/54 50.5±9.99 18/12 6 (4, 12) 4 (2, 5)a 11/19 4/26 / 0.55 ± 0.3a / / / 20.96 ± 4.60a 19.87 ± 2.59a nDON 30/60 47.63±8.77 13/17 5 (2, 6) 2 (1, 3)a 11/19 5/25 / 0.82 ± 0.27a / / / 20.08 ± 6.07a 19.15 ± 2.86a Validation cohort DON 14/26 55.2 ± 8.07 9/5 6 (2, 8) 4 (2, 5)a 4/10 2/12 / 0.61 ± 0.25a / / / 19.8 ± 3.29a 19.57 ± 2.03a nDON 15/30 45.29 ± 5.68 9/6 6 (4, 10) 3 (1, 3)a 3/12 2/13 / 0.87 ± 0.26a / / / 19.39 ± 2.79a 18.92 ± 3.08a Moledina et al.[24] (2025)
T1WI, STIR-T2WI, DWIDON 26/NA / 5/21 / 3.52 ± 1.72a 7/19 4/15# / / / / / / / nDON 516/NA / 105/369# / 0.54 ± 0.80a 115/332# 66/374# / / / / / / / Li et al.[23] (2025)
T1WI, FS-T2WIDON NA/16 53.43 ± 12.55 / / / / / / 0.22 ± 0.14a, * / / / 20.75 ± 5.97a / Moderate to severe TED NA/48 43.22 ± 11.87 / / / / / / 0.07 ± 0.09a, * / / / 20.48 ± 6.14a / Mild TED NA/45 42.94 ± 9.94 / / / / / / 0.01 ± 0.02a, * / / / 18.73 ± 3.17a / Zhou et al.[22] (2025)
MTI, FS-T2WI, DWITraining cohort DON 30/46 57.93 ± 10.97 13/17 8 (5, 13) 4 (3, 5)a 12/18 / 8.06 (2.96, 26.35) 0.6 (0.2, 0.7)a 0.86 (0.42, 0.96)a −6.21 (−19.01, −3.09)a 3.98 (2.12, 8.21)a / 21.37 ± 3.25a nDON 74/148 42.85 ± 13.14 24/50 7 (4, 18) 2 (1, 3)a 28/46 / 2.17 (0.81, 6.76) 1.0 (1.0, 1.0)a 0.99 (0.97, 0.99)a −1.18 (−2.31, −0.38)a 1.53 (1.30, 2.08)a / 19.57 ± 3.21a Validation cohort DON 13/20 54.46 ± 14.09 5/8 7 (4, 14) 4 (3, 5)a 7:6 / 5.93 (1.69, 16.42) 0.6 (0.4, 0.7)a 0.83 (0.50, 0.97)a −6.70 (−16.50, −2.88)a 4.71 ± 2.97a / 20.78 ± 3.40a nDON 32/64 44.50 ± 11.48 5/27 10 (3, 24) 2 (1, 3)a 12:20 / 2.39 (0.88, 12.97) 1.0 (1.0, 1.0)a 0.99 (0.98, 1.00)a −0.85 (−1.79, 0.06)a 1.69 ± 0.73a / 18.68 ± 3.20a Jiang et al.[38] (2021)
Bold-fMRIDON 16/NA 54.85 ± 5.02 6/10 / / / / / 0.55 ± 0.25/
0.35 ± 0.20b/ / / / / nDON 16/NA 53.09 ± 5.16 6/10 / / / / / 1.05 ± 0.10/
1.05 ± 0.10b/ / / / / Liu et al.[37] (2023)
Bold-fMRIDON 20/NA 54.65 ± 7.82 10/10 6 (2, 36) 4 (1~7)/
4 (1~7)b9/11 7/13 17.39 ± 11.69 0.36 ± 0.22/
0.38 ± 0.17b/ / / 18.92 ± 4.39/
18.52 ± 3.84b19.30 ± 1.90/
18.85 ± 2.72bnDON 27/NA 52.00 ± 6.63 13/14 8 (3, 33) 1 (0~6)/
1 (0~6)b14/13 9/18 12.53 ± 11.08 0.98 ± 0.14/
0.91 ± 0.17b/ / / 18.98 ± 6.01/
20.01 ± 7.27b16.80 ± 3.62/
18.98 ± 6.01bHC 33/NA 54.03 ± 6.72 17/16 / / 13/20 / / / / / / / / Zhou et al.[36] (2024)
Bold-fMRIDON 28/NA 54.00 ± 11.44 13/15 12.36 ± 8.99 4.14 ± 1.33/
4.07 ± 1.33b12/16 / / 0.66 ± 0.24/
0.60 ± 0.27b0.83 ± 0.22/
0.87 ± 0.22b−7.32 ± 6.91/
−5.69 ± 6.74b3.81 ± 2.75/
3.39 ± 2.43b/ 20.14 ± 3.18/
21.02 ± 3.40bnDON 38/NA 49.18 ± 8.41 15/23 12.61 ± 14.31 2.92 ± 1.22/
2.94 ± 1.21b18/20 / / 0.97 ± 0.12/
0.94 ± 0.13b/ / / / 18.91 ± 3.00/
19.62 ± 2.92bHC 30/NA 50.30 ± 11.97 11/19 / / 12/18 / / 0.98 ± 0.13/
0.97 ± 0.11b/ / / / / Zhou et al.[35] (2025)
DKIDON 21/NA 53.7 ± 13.9 9/12 10.0 (6.5, 13.5) 5.0 (3.5, 5.0)/
5.0 (3.0, 5.0)b10/11 / / 0.80 (0.50, 1.00)/
0.70 (0.55, 0.80)b0.94 (0.80, 0.98)/
0.93 (0.76, 0.97)b/ / / 19.7 ± 3.4/
21.2 ± 3.8bnDON 32/NA 45.6 ± 12.7 12/20 8.0 (4.3, 17.3) 2.0 (2.0, 3.0)/
2.0 (2.0, 3.0)b10/22 / / 1.00 (1.00, 1.00)/
1.00 (0.80, 1.00)b0.99 (0.98, 1.00)/
0.99 (0.96, 1.00)b/ / / 18.3 ± 2.5/
18.8 ± 2.5bHC 30/NA 45.4 ± 15.5 10/20 / / 11/19 / / 1.00 (1.00, 1.00)/
1.00 (1.00, 1.00)b/ / / / / Lu et al.[34] (2025)
Bold-fMRIDON 23/NA 56.04 ± 11.46 11/12 12.04 ± 9.59 4.48 ± 1.27/
4.39 ± 1.31b9/14 / / 0.60 ± 0.28/
0.60 ± 0.27b0.73 ± 0.31/
0.82 ± 0.30b/ / / 20.67 ± 3.22/
21.35 ± 3.53bnDON 34/NA 51.35 ± 7.07 10/24 14.56 ± 14.49 2.21 ± 1.23/
2.24 ± 1.23b11/23 / / 0.99 ± 0.13/
0.97 ± 0.14b/ / / / 17.35 ± 2.79/
17.62 ± 3.03bHC 27/NA 52.44 ± 7.93 10/17 / / 13/14 / / 1.00 ± 0.12/
1.00 ± 0.11b/ / / / / Zhang et al.[39] (2024)
Dixon-T2WI, Bold-fMRIDON 47/NA 50.36 ± 12.26 18/29 14.33 (6.00, 20.00) 3.23 ± 1.88a 12/35 / 11.70 (2.68, 16.60) 0.34 ± 0.23a / / / 20.00 (17.10, 21.00)a 19.55 ± 2.88a nDON 56/NA 50.48 ± 9.095 22/34 17.46 (6.00, 15.00) 2.34 ± 1.56a 13/43 / 4.67 (1.10, 15.58) 0.95 ± 0.08a / / / 18.50 (17.00, 20.50)a 19.33 ± 2.58a HC 36/NA 45.64 ± 14.43 16/20 / / / / / 0.96 ± 0.07a / / / / / Hu et al.[40] (2024)
T1WI, FS-T2WI, DWI, DKIDON 25/40 56.6 ± 11.4 11/14 8 (5, 12) 5 (3, 5)a 10/15 1/24 5.00 (2.30, 11.48) 0.6 (0.4, 0.7)a 0.88 (0.43, 0.95) −6.04 (−19.89, −3.40)a 3.13 (1.98, 5.15)a 17.7 (14.9, 20.9)a 20.3 (18.1, 23.8)a nDON 36/72 45.6 ± 10.7 16/20 7 (3, 18) 2 (1, 3)a 17/19 3/33 2.14 (1.27, 8.48) 1.0 (1.0, 1.0)a 0.99 (0.98, 1.00) −0.92 (−2.19, 0.31)a 1.50 (1.24, 1.90)a 15.9 (13.7, 18.8)a 19.0 (17.0, 22.0)a a Data are presented as the average. b Data are presented as right eye (OD)/left eye (OS). *BCVA according to a logMAR visual chart. # Existence of missing data. Values in parentheses separated by a comma represent the 25th and 75th percentiles, whereas those separated by a tilde represent the range. MRI, magnetic resonance imaging; TED, thyroid eye disease; DON, dysthyroid optic neuropathy; HC, healthy control; CAS, clinical activity score; TRAb, thyrotropin receptor antibody; BCVA, best-corrected visual acuity; VFI, visual field index; MD, mean deviation; PSD, pattern standard deviation; IOP, intraocular pressure; T1WI, T1-weighted imaging; T2WI, T2-weighted imaging; DWI, diffusion-weighted imaging; DTI, diffusion tensor imaging; DKI, diffusion kurtosis imaging; MTI, magnetization transfer imaging; Bold-fMRI, blood oxygenation level-dependent functional MRI. In terms of study design, seven studies (41.18%)[27,31,34−37,39] included HCs and conducted comparisons across DON, nDON, and HC groups. One study (5.88%)[23] compared mild and moderate with severe TED with DON. The remaining studies focused on comparisons between DON and nDON groups (9/17, 52.94%)[22,24−26,28−30,38,40]. Of note, although comparisons between patients and HCs may provide valuable insights, diagnostic efficacies derived from DON versus nDON comparisons hold significantly greater clinical relevance, as the real-world challenge is to distinguish DON from nDON. Additionally, two studies by Wu et al.[25,29] and one by Zhou et al.[22] divided their data into training and validation cohorts.
Orbital MRI in identifying DON
-
Table 2 presents the main findings of MRI studies on the identification of DON.
Table 2. The main findings of MRI studies on the diagnosis of DON.
Study Parameters or models Condition
(DON vs. nDON)AUC Cut-off value Sensitivity Specificity p-value Wu et al.[31] (2021) Optic nerve signal intensity ratio 3 mm behind the eyeball DON > nDON 0.66 1.71 0.55 0.71 / 6 mm behind the eyeball DON > nDON 0.69 1.55 0.57 0.71 / Optic nerve water fraction (%) 3 mm behind the eyeball DON > nDON 0.78 91.55 0.51 0.96 / 6 mm behind the eyeball DON > nDON 0.76 88.48 0.70 0.70 / Optic nerve subarachnoid space (mm) 3 mm behind the eyeball DON > nDON 0.95 2.35 0.91 0.90 / 6 mm behind the eyeball DON > nDON 0.93 2.00 0.91 0.86 / Optic nerve sheath diameter (mm) 3 mm behind the eyeball DON > nDON 0.93 5.45 0.83 0.95 / 6 mm behind the eyeball DON > nDON 0.91 4.55 0.78 0.87 / Optic nerve diameter (mm) 3 mm behind the eyeball DON > nDON 0.73 2.95 0.72 0.68 / 6 mm behind the eyeball DON > nDON 0.76 2.35 0.78 0.67 / Optic nerve sheath area (mm2) 3 mm behind the eyeball DON > nDON 0.90 21.5 0.82 0.89 / 6 mm behind the eyeball DON > nDON 0.89 15.5 0.82 0.82 / Optic nerve area (6 mm behind the eyeball) (mm2) DON > nDON 0.73 6.5 0.78 0.62 / Optic nerve area/optic nerve sheath area (%) 3 mm behind the eyeball DON < nDON 0.89 44.09 0.89 0.85 / 6 mm behind the eyeball DON < nDON 0.85 45.23 0.89 0.73 / Fluid volume in the optic nerve sheath (mm3) DON > nDON 0.93 0.166 0.85 0.93 / Liu et al.[30] (2022) Optic nerve axial diffusivity (ONAD) (×10–3 mm2/s) DON > nDON 0.644 1.927 0.7174 0.6071 / Optic nerve radial diffusivity (ONRD) (×10–3 mm2/s) DON > nDON 0.640 0.791 0.8696 0.4554 / Optic nerve mean diffusivity (ONMD) (×10–3 mm2/s) DON > nDON 0.727 1.164 0.9565 0.4732 / Optic nerve fractional anisotropy (ONFA) DON < nDON 0.709 0.574 0.9565 0.3571 / ONAD + ONRD / 0.666 0.711 0.7609 0.5714 / ONAD + ONMD / 0.720 0.719 0.8261 0.5804 / ONAD + ONFA / 0.748 0.728 0.7609 0.6161 / ONRD + ONMD / 0.746 0.716 0.8043 0.6071 / ONRD + ONFA / 0.717 0.713 0.7174 0.6250 / ONMD + ONFA / 0.768 0.738 0.8478 0.6429 / ONAD + ONRD + ONMD / 0.744 0.721 0.8261 0.6071 / ONAD + ONRD + ONFA / 0.748 0.736 0.8043 0.5893 / ONAD + ONMD + ONFA / 0.765 0.709 0.8043 0.6786 / ONRD + ONMD + ONFA / 0.784 0.727 0.7826 0.6786 / ONAD + ONRD + ONMD + ONFA / 0.801 0.729 0.8043 0.6696 / Wu et al.[29] (2022) Training cohort Convention MRI evaluation (apical crowding sign + optic nerve stretching sign) / 0.801 / 0.867 0.638 / Radiomics signature* / 0.889 / 0.687 0.950 / Radiomics nomogram (conventional MRI evaluation + radiomics signature*) / 0.921 / 0.867 0.825 / Validation cohort Convention MRI evaluation (apical crowding sign + optic nerve stretching sign) / 0.745 / 0.762 0.608 0.04 (vs. Radiomics nomogram) Radiomics signature* / 0.848 / 0.667 0.843 / Radiomics nomogram (conventional MRI evaluation + radiomics signature*) / 0.876 / 0.905 0.706 / Zou et al.[28] (2022) Modified muscle index at the posterior globe of 21 mm (mMI at 21 mm) (%) DON > nDON 0.848 55.1 0.651 0.907 / Optic nerve T2 value (ms) DON > nDON 0.805 119.2 0.884 0.653 / mMI at 21 mm + optic nerve T2 value / 0.918 0.2 0.953 0.760 / Zhang et al.[27] (2022) Extraocular muscle volume (mL) DON > nDON 0.850 4.035 1.000 0.703 / Fat volume (mL) DON > nDON 0.674 / / / / Whole volume (mL) DON > nDON 0.726 / / / / Extraocular muscle volume/fat volume DON > nDON 0.712 / / / / Song et al.[26] (2023) Optic nerve signal intensity ratio 3 mm behind the eyeball (ONSIR3) DON > nDON 0.834 1.639 0.829 0.714 / 6 mm behind the eyeball DON > nDON 0.732 / / / < 0.001 (vs. ONSIR3) 9 mm behind the eyeball DON > nDON 0.641 / / / < 0.001 (vs. ONSIR3) Extraocular muscle volume index at the orbital apex (AMI) (%) DON > nDON 0.898 41.781 0.886 0.890 / Extraocular muscle volume at the orbital apex (cm3) DON > nDON 0.836 / / / 0.016 (vs. AMI) Extraocular muscle volume (cm3) DON > nDON 0.802 / / / 0.007 (vs. AMI) Medial rectus muscle volume (cm3) DON > nDON 0.806 / / / 0.009 (vs. AMI) Extraocular muscle volume index (%) DON > nDON 0.795 / / / 0.002 (vs. AMI) Barrett index (%) DON > nDON 0.846 / / / 0.048 (vs. AMI) Effective orbital volume (cm3) DON > nDON 0.621 / / / / Axial length of the eyeball (mm) DON < nDON 0.629 / / / / ONSIR3 + AMI / 0.943 / / / 0.003 (vs. ONSIR3)
0.013 (vs. AMI)Wu et al.[25] (2024) Training cohort Cerebrospinal fluid volume in the optic nerve sheath + optic
nerve subarachnoid space (3 mm behind the eyeball)/ 0.994 / 0.944 0.967 / Validation cohort Cerebrospinal fluid volume in the optic nerve sheath + optic
nerve subarachnoid space (3 mm behind the eyeball)/ 0.960 / 0.889 0.893 / Moledina et al.[24] (2025) Apparent diffusion coefficient value of the most involved muscle (×10–6 mm2/s) DON > nDON 0.844 1115 0.789 0.782 / 796.5 1.000 0.248 / 1498 0.316 0.977 / Li et al.[23] (2025) Volume of the medial orbital wall (cm3) DON < nDON 0.808 –0.065 0.813 0.753 / Zhou et al.[22] (2025) Training cohort Mean magnetization transfer ratio of optic nerve (MTRmean) (%) DON < nDON 0.831 40.0 0.739 0.791 < 0.001 (vs. MTRmean + ADCmean + mMI) Mean apparent diffusion coefficient of optic nerve (ADCmean) (×10-6 mm2/s) DON < nDON 0.738 1050.0 0.565 0.818 < 0.001 (vs. MTRmean + ADCmean + mMI) mMI (%) DON > nDON 0.862 54.1 0.870 0.750 < 0.001 (vs. MTRmean + ADCmean + mMI) MTRmean + ADCmean + mMI / 0.946 0.154 0.935 0.824 / Validation cohort MTRmean (%) DON < nDON 0.833 40.0 0.650 0.813 0.028 (vs. MTRmean + ADCmean + mMI) ADCmean (×10-6 mm2/s) DON < nDON 0.768 1050.0 0.550 0.813 0.005 (vs. MTRmean + ADCmean + mMI) mMI (%) DON > nDON 0.852 54.1 0.750 0.797 0.058 (vs. MTRmean + ADCmean + mMI) MTRmean + ADCmean + mMI / 0.926 0.154 0.750 0.844 / Jiang et al.[38] (2021) Regional homogeneity (ReHo) value of corpus callosum/cingulate gyrus DON < nDON 0.933 / / / / ReHo value of parietal lobe/middle frontal gyrus DON < nDON 0.938 / / / / Liu et al.[37] (2023) ReHo value of left insula DON < nDON 0.757 / / / / ReHo value of left posterior cingulate cortex DON > nDON 0.843 / / / / ReHo value of right superior temporal lobe DON < nDON 0.646 / / / / ReHo value of left insula + ReHo value of left posterior cingulate cortex / 0.915 / / / / ReHo value of left insula + ReHo value of right superior temporal lobe / 0.763 / / / / ReHo value of left posterior cingulate cortex + ReHo value of right superior temporal lobe / 0.852 / / / / ReHo value of left insula + ReHo value of left posterior cingulate cortex + ReHo value of right superior temporal lobe / 0.915 / / / / Zhou et al.[36] (2024) Model of static functional network (σ + degree centrality in left medial orbital part of superior frontal gyrus + degree centrality in left middle occipital gyrus + degree centrality in right inferior occipital gyrus + nodal efficiency in left medial orbital part of superior frontal gyrus + nodal efficiency in right medial orbital part of superior frontal gyrus + nodal efficiency in left gyrus rectus + nodal efficiency in right inferior occipital gyrus) / 0.793 / / / / Model of dynamic functional network (variance of global efficiency + variance of characteristic path length) / 0.766 / / / / Model of static functional network + model of dynamic functional network / 0.836 / / / / Zhou et al.[35] (2025) Radial kurtosis value of right posterior thalamic radiation (include optic radiation) DON < nDON 0.838 / / / / Radial kurtosis value of left posterior thalamic radiation (include optic radiation) DON < nDON 0.802 / / / / Mean kurtosis value of right posterior thalamic radiation (include optic radiation) DON < nDON 0.795 / / / / Radial kurtosis value of left sagittal stratum DON < nDON 0.786 / / / / Radial kurtosis value of right sagittal stratum DON < nDON 0.753 / / / / Axial kurtosis value of right posterior corona radiata DON < nDON 0.751 / / / / Radial kurtosis value of left retrolenticular part of internal capsule DON < nDON 0.723 / / / / Lu et al.[34] (2025) Static amplitude of low-frequency fluctuation (ALFF) model (static ALFF value of the left lingual gyrus + static ALFF value of the right lingual gyrus + static ALFF value of the right cuneus + static ALFF value of the left medial part of the superior frontal gyrus + static ALFF value of the right medial part of the superior frontal gyrus + static ALFF value of the right dorsolateral part of the superior frontal gyrus + static ALFF value of the right precentral gyrus) / 0.8440 / 0.7826 0.9118 0.0155 (vs. Dynamic ALFF model) Dynamic ALFF model (dynamic ALFF value of the left lingual gyrus + dynamic ALFF value of the right cuneus + dynamic ALFF value of the right orbital part of the middle frontal gyrus + dynamic ALFF value of the right dorsolateral part of the superior frontal gyrus) / 0.9987 / 1.0000 0.9706 / Static ReHo model (static value of the right lingual gyrus + static value of the right supramarginal gyrus) / 0.7762 / 0.7391 0.8235 0.0007 (vs. Dynamic ALFF model) Dynamic ReHo model (dynamic value of the right supramarginal gyrus) / 0.7609 / 0.6957 0.7647 0.0004 (vs. Dynamic ALFF model) Zhang et al.[39] (2024) ALFF value of the right superior frontal gyrus, orbital part DON > nDON 0.64 / / / / ALFF value of right hippocampus DON > nDON 0.66 / / / / ALFF value of right superior temporal gyrus DON > nDON 0.66 / / / / Posterior mMI DON > nDON 0.76 / / / 0.1456 (vs. Combined model) Combined model (ALFF value of the right hippocampus + ALFF value of the right superior temporal gyrus + posterior mMI) / 0.80 / / / / Hu et al.[40] (2024) Apical muscle index (MI) DON > nDON 0.822 0.548 0.750 0.806 / Optic nerve apical area index (ONAI) DON > nDON 0.791 0.518 0.700 0.819 0.588 (vs. MI) Optic nerve apparent diffusion coefficient (ONADC) (×10–3 mm2/s) DON < nDON 0.719 1.123 0.725 0.653 0.098 (vs. MI) Optic nerve signal intensity ratio DON > nDON 0.619 1.090 0.400 0.847 0.003 (vs. MI) Kurtosis fractional anisotropy value of optic tract (OTKFA) DON < nDON 0.745 0.412 0.400 0.972 0.080 (vs. ORKFA) Kurtosis fractional anisotropy value of optic radiation (ORKFA) DON < nDON 0.827 0.421 0.600 1.000 / Kurtosis fractional anisotropy value of Brodmann Area 17 (BA17KFA) DON < nDON 0.789 0.283 0.725 0.833 0.261 (vs. ORKFA) Kurtosis fractional anisotropy value of Brodmann Area 18 DON < nDON 0.698 0.286 0.575 0.833 0.007 (vs. ORKFA) Kurtosis fractional anisotropy value of Brodmann Area 19 DON < nDON 0.718 0.315 0.475 0.972 0.011 (vs. ORKFA) Mean kurtosis of optic tract DON < nDON 0.625 0.900 0.450 0.917 0.002 (vs. ORKFA) Mean kurtosis of optic radiation DON < nDON 0.597 0.852 0.425 0.944 < 0.001 (vs. ORKFA) Orbital MRI model (MI + ONAI + ONADC) / 0.890 / 0.775 0.903 0.257 (vs. visual pathway DKI model)) Visual pathway DKI model (OTKFA + ORKFA + BA17KFA) / 0.832 / 0.700 0.917 0.005 (vs. combined model) Combined model (orbital MRI model + visual pathway DKI model) / 0.926 / 0.800 0.944 0.177 (vs. orbital MRI model) * Radiomics signature: Rad-score = 0.046222 + (original_shape_LeastAxisLength × 0.295835) – (wavelet.HHH_glrlm_LowGrayLevelRunEmphasis × 0.168698) + (wavelet.HHH_glszm_SizeZoneNonUniformityNormalized × 0.078249) – (original_glcm_InverseVariance × 0.215994) + (wavelet.HLH_glszm_LargeAreaHighGrayLevelEmphasis × 0.256508) – (wavelet.HHH_glcm_ClusterShade × 0.061405) – (original_glrlm_ShortRunLowGrayLevel
Emphasis × 0.238402) + (original_gldm_LargeDependenceHighGrayLevelEmphasis × 0.006713). DON, dysthyroid optic neuropathy; AUC, area under the receiver operating characteristic (ROC) curve; ONAD, optic nerve axial diffusivity; ONRD, optic nerve radial diffusivity; ONMD, optic nerve mean diffusivity; ONFA, optic nerve fractional anisotropy; MRI, magnetic resonance imaging; mMI, modified muscle index; ONSIR3, optic nerve signal intensity ratio at 3 mm behind the eyeball; AMI, extraocular muscle volume index at the orbital apex; MTRmean, mean magnetization transfer ratio; ADCmean, mean apparent diffusion coefficient; ReHo, regional homogeneity; ALFF, amplitude of low-frequency fluctuation; MI, apical muscle index; ONAI, optic nerve apical area index; ONADC, optic nerve apparent diffusion coefficient; OTKFA, kurtosis fractional anisotropy value of optic tract; ORKFA, kurtosis fractional anisotropy value of optic radiation; BA17KFA, kurtosis fractional anisotropy value of Brodmann Area 17; DKI, diffusion kurtosis imaging.Our review included 10 studies that utilized orbital MRI to perform both quantitative and qualitative measurements of various orbital structures, including the orbital wall, orbital fat, extraocular muscle, optic nerve, and eyeball[22−31]. The analytical methods applied in these studies comprised both conventional imaging metrics (9/10, 90%)[22−28,30,31] (such as diameter, volume, and signal intensity) and a radiomics approach (1/10, 10%)[29]. Among these studies, four assessed the efficacy of identifying DON using only a single parameter (40%)[23,24,27,31], whereas the other six also investigated the combination of multiple parameters (60%)[22,25,26,28−30].
The optic nerve was the most frequently studied orbital structure (7/10, 70%)[22,25,26,28−31], evaluated with both macroscopic and microscopic parameters. Wu et al. attempted to investigate the optic nerve and the cerebrospinal fluid within its sheath as potential imaging markers for DON[31]. They measured and compared the signal intensity ratio (SIR) of the optic nerve, the optic nerve subarachnoid space (ONSS), the diameter and cross-sectional area of the optic nerve and its sheath, the water fraction of the optic nerve, and the volume of the fluid in the optic nerve sheath. Their findings indicated that patients with DON exhibited a higher water fraction of the optic nerve, a larger ONSS, and a greater volume of fluid within the optic nerve sheath. For identifying DON, ONSS 3 mm behind the eyeball (ONSS3) emerged as a robust predictor (AUC = 0.95, sensitivity = 0.91, specificity = 0.90). In the subsequent investigation, a prediction model integrating the volume of fluid in the optic nerve sheath and ONSS3 demonstrated excellent classification performance in both the training (AUC = 0.994, sensitivity = 0.944, specificity = 0.967) and validation cohorts (AUC = 0.960, sensitivity = 0.889, specificity = 0.893)[25]. Furthermore, in a diffusion tensor imaging (DTI) study, the same group reported significantly lower fractional anisotropy and higher diffusivity metrics in DON[30]. Mean diffusivity alone yielded the best individual identification performance (AUC = 0.727, sensitivity = 0.9565, specificity = 0.4732), whereas the combination of all four DTI parameters provided superior identification efficacy (AUC = 0.801, sensitivity = 0.8043, specificity = 0.6696).
The remaining studies involving the optic nerve consistently combined its parameters with additional orbital measures. Zou et al. reported elevated optic nerve T2 values in DON compared with nDON patients[28]. Using a cutoff T2 value of 119.2 ms, they achieved good efficiency (AUC = 0.805, sensitivity = 0.884, specificity = 0.653). Additionally, they developed a modified muscle index (mMI) measured on oblique coronal Dixon T2-weighted imaging, which proved more effective than the muscle index (MI) introduced by Barrett et al.[45]. The combination of the mMI at 21 mm and the mean optic nerve T2 value provided the optimal discriminatory performance (AUC = 0.918, sensitivity = 0.953, specificity = 0.760). Consistent with the findings of Wu et al.[31], Song et al. also reported significantly higher SIR values in DON patients, with SIR values at 3 mm behind the eyeball yielding an AUC of 0.834 for identifying DON[26]. Combining SIR with the extraocular muscle volume index at the apex could significantly improve the performance (AUC = 0.943). Zhou et al. evaluated magnetization transfer imaging for identifying DON, reporting a significantly lower magnetization transfer ratio (MTR) in the optic nerve of DON patients[22]. A model integrating MTR, the apparent diffusion coefficient (ADC), and mMI demonstrated superior performance (AUC = 0.926, sensitivity = 0.750, specificity = 0.844). However, the AUC of this combined model was only higher than that of either mean ADC or mean MTR alone (both p < 0.05), but the improvement over the mMI alone did not reach statistical significance (p = 0.058). Among the 10 reviewed studies, one used a radiomics-based model to differentiate DON from nDON[29]. The results demonstrated that the radiomics nomogram significantly outperformed the conventional model, with AUCs of 0.876 versus 0.745 (p = 0.04).
Beyond the optic nerve, the volumetric parameters of orbital structures were also a focus of investigation. Two studies specifically assessed these metrics, including extraocular muscle volume, fat volume, and the volume of the medial orbital wall[26,27]. Zhang et al. found significantly higher fat volume and extraocular muscle volume in DON via MRI-based three-dimensional (3D) reconstruction, with extraocular muscle enlargement contributing the most to DON and achieving the highest discrimination efficiency (AUC = 0.850, sensitivity = 1.000, specificity = 0.703)[27]. Meanwhile, Song et al. focused on the high-risk orbital apex region, defining an extraocular muscle volume index at the orbital apex (AMI) that proved superior to other morphological parameters (AUC = 0.898, sensitivity = 0.886, specificity = 0.890)[26]. Furthermore, as an independent risk factor, the AMI combined with the optic nerve SIR yielded excellent performance (AUC = 0.943).
Several recent studies have investigated relatively unconventional orbital metrics[23,24]. Li et al. evaluated MRI parameters including the orbital bone wall area, extraocular muscle area, and proptosis, discovering several correlations with clinical ophthalmic measures[23]. Their measurements of indentation and protrusion areas in the medial and lateral orbital walls revealed that the medial wall area increased with TED's severity and held high diagnostic value for DON (AUC = 0.808, sensitivity = 0.813, specificity = 0.753). In a notable departure, Moledina et al. conducted the largest retrospective analysis to date, involving over 500 TED patients[24]. They assessed multiple MRI parameters for identifying DON and found that, with the sole exception of the ADC value of the extraocular muscle (AUC = 0.844, sensitivity = 0.789, specificity = 0.782), all other parameters exhibited AUCs below 0.50. The authors also highlighted that adjusting the cutoff value for the ADC of the extraocular muscle could yield maximal sensitivity and specificity (100% and 97.7%, respectively).
Brain MRI in identifying DON
-
This systematic review included five studies that used brain MRI to investigate cerebral functional and structural alterations of DON[34−38], including four functional MRI studies and one diffusion MRI study. All these studies performed whole-brain analyses. Specifically, three studies used regional homogeneity (ReHo) analysis (60%)[34,37,38], one used amplitude of low-frequency fluctuation (ALFF) analysis (20%)[34], one applied graph theory to study functional brain networks (20%)[36], and one conducted tract-based spatial statistics analysis based on diffusion kurtosis imaging (DKI) (1/5, 20%)[35].
ReHo and ALFF are widely used to assess regional neural function. ReHo measures the consistency of neural activity in neighboring brain areas, whereas ALFF reflects the intensity of spontaneous neural activity[46,47]. Jiang et al. reported decreased ReHo values in the corpus callosum/cingulate gyrus and parietal lobe/middle frontal gyrus in DON patients, which they linked to visual dysfunction and emotional disturbances[38]. Notably, the ReHo values in these areas demonstrated promising potential for identifying DON, with AUCs of 0.933 and 0.938, respectively. Similarly, Liu et al. also applied ReHo analysis and found significant differences in brain regions involved in visual information processing[37]. A combined model using ReHo values in the left insula and left posterior cingulum yielded an AUC of 0.915, supporting ReHo as a potential biomarker for DON. Differently, Lu et al. used both static and dynamic ALFF and ReHo analyses in DON patients, demonstrating alterations in brain regions associated with visual processing, cognition, and emotion[34]. Moreover, the machine learning model based on dynamic ALFF achieved the highest performance in identifying DON (AUC = 0.9987, sensitivity = 1.0000, specificity = 0.9706), underscoring the value of dynamic analysis.
Graph theoretical analysis models the brain's connectivity as a topological network and can reveal abnormalities in functional organization[48]. Zhou et al. found that both static and dynamic functional networks were altered in DON and nDON patients, with more pronounced changes in the DON group[36]. Using a network-based statistics method[49], a strengthened subnetwork centered on the visual network was identified in DON patients, which may reflect a compensatory mechanism that helps preserve visual function. Although models based on either static or dynamic network properties alone showed decent AUCs in discriminating DON (AUC = 0.793 and 0.766, respectively), a combined model integrating both static and dynamic properties achieved optimal performance (AUC = 0.836). These findings suggested that functional network properties are potent biomarkers for monitoring TED's progression and identifying DON.
In a separate study, Zhou et al. used DKI with tract-based spatial statistics to examine white matter microstructures[35]. They observed widespread microstructural changes in projection, association, and commissural fibers in both DON and nDON patients, with more severe alterations in the DON group. The white matter tracts that differentiated DON from nDON were mainly located within the visual system, including the posterior thalamic radiation and sagittal stratum. Radial kurtosis values in the bilateral posterior thalamic radiation were the most effective biomarkers for distinguishing DON (AUC = 0.802 and 0.838). These findings position DKI as a promising tool for visualizing changes in the white matter and aiding in the identification of DON.
Combined orbital–brain MRI in identifying DON
-
Our systematic review incorporated two studies that utilized combined orbital–brain MRI[39,40]. In one, orbital MRI was used to quantify changes in the optic nerve alongside ALFF analysis based on blood oxygenation level-dependent functional MRI (BOLD-fMRI) to detect potential aberrant neural alterations[39]. The other integrated orbital MRI with whole-brain DKI to simultaneously evaluate both the orbital and the intracranial visual pathways[40].
Zhang et al. conducted the largest combined orbital–brain MRI study on DON to date[39]. Their findings revealed that abnormalities in the orbital parameters primarily occurred in the posterior segment of the intraorbital segment of the optic nerve in the DON and nDON groups. Indeed, the posterior mMI was the only orbital parameter that significantly differed between the DON and nDON groups. In the ALFF analysis, regions showing distinct alterations between DON and nDON included the orbital part of the superior frontal gyrus, hippocampus, and superior temporal gyrus. Although these brain regions are not traditionally associated with direct visual processing[50−52], the study highlighted that during the progression from nDON to the onset of DON, functional changes occur across brain regions with diverse functions. Furthermore, these orbital and cerebral imaging biomarkers demonstrated the potential to identify DON, with individual AUC values ranging from 0.64 to 0.76. Notably, a combined orbital–brain model exhibited superior identification ability (AUC = 0.80), though it did not show a statistically significant difference in discriminatory performance compared with the posterior mMI (p = 0.1456).
In a study with greater focus on the entire visual pathway, Hu et al. used orbital MRI to evaluate the optic nerve and utilized DKI to assess the optic tract, optic radiation, and visual cortex[40]. Several orbital parameters differed between DON and nDON, of which the apical MI showed the greatest ability to identify DON (AUC = 0.822, sensitivity = 0.750, specificity = 0.806). Regarding the intracranial visual pathway, DKI metrics were altered in the optic tract, optic radiation, and visual cortex, with kurtosis fractional anisotropy of the optic radiation showing the highest identification efficacy (AUC = 0.827, sensitivity = 0.600, specificity = 1.000). By integrating significant parameters from both the orbital MRI and DKI of the visual pathway, the authors constructed a combined model that achieved further optimized classification performance, with an AUC of 0.926, a sensitivity of 0.800, and a specificity of 0.944. Statistical comparisons indicated that the AUC of this combined orbital–brain model was significantly higher than that of the visual pathway DKI-based model (p = 0.005), whereas the difference compared with the orbital MRI-based model did not reach statistical significance (p = 0.177). Nevertheless, the combined model exhibited the highest sensitivity and specificity among all models evaluated.
-
We conducted a systematic review of 17 studies that utilized MRI in the evaluation of DON. The field is attracting growing interest, with all included studies published within the past five years. Notably, five appeared in the last year alone, representing the highest annual number to date. Although previous reviews have summarized the value of various MRI techniques in identifying and assessing TED broadly, DON has not been their primary focus[21,53]. In contrast, our review specifically concentrates on MRI findings in DON. We synthesized the reported identification performance of different MRI parameters, explained their theoretical rationale based on the underlying pathophysiological mechanism of DON, and outlined current trends and future research directions in this emerging area.
The pathophysiological mechanisms of DON are multifaceted, primarily including compression, stretching, and atrophy of the optic nerve, as well as retinal ganglion cell damage induced by high intraocular pressure[4,5,54−56]. Among these, the most widely accepted pathophysiological mechanism of DON is direct compression of the optic nerve at the orbital apex by enlarged extraocular muscles[4,5]. On the basis of this premise, the MI, initially proposed by Barrett et al. using computed tomography, has become the classic metric for assessing crowding of the orbital apex[45]. Zou et al. later introduced an mMI based on MRI, which offers improved visualization of the extraocular muscles and may be more effective in detecting DON[28]. Studies evaluating mMI have consistently demonstrated its solid performance in identifying DON when used independently. The reported cutoff values from two separate studies were similar at 55.1% and 54.1%, supporting the reliability of this index[22,28]. Nevertheless, as a two-dimensional parameter derived from a single imaging slice, mMI may have inherent limitations in its sensitivity. Consequently, volumetric assessments, such as an extraocular MI at the orbital apex, have been proposed as potentially more accurate alternatives[26]. Other MRI parameters indirectly reflecting orbital crowding, such as extraocular muscle volume, orbital fat volume, and orbital wall volume, have also been explored but remain less commonly used in clinical research[23,26,27].
However, the EUGOGO survey reported that TED patients can develop DON even without evident apical crowding, suggesting that reliance on mMI alone may risk underdiagnosis[57]. This has shifted the research focus toward direct evaluation of alterations in the optic nerve. Studies have examined both the optic nerve proper and the surrounding cerebrospinal fluid (CSF) within the optic nerve sheath, using varied MRI techniques to assess macro- and microstructural changes. At the macroscopic level, the optic nerve's diameter and cross-sectional area are often increased in DON patients compared with nDON patients, suggesting the presence of nerve swelling[31]. At the microstructural level, more advanced MRI techniques have been applied to reveal different pathological alterations. The SIR of the optic nerve is frequently elevated in DON, potentially reflecting inhibited axonal flow caused by extraocular muscle enlargement or inflammatory exudation secondary to optic neuritis[28,58]. However, one study found that extraocular muscle enlargement does not consistently correlate with elevated SIR[26], implying that optic neuritis may play a relevant role in the increase in SIR observed in DON. Furthermore, the water fraction is a quantitative parameter calculated as water signal/(water + fat) signal, serving as an indicator of the tissue water content[59,60]. The finding of a higher water fraction in the optic nerves of DON patients may further support the mechanism of inflammatory edema in the pathogenesis of DON[61]. Early postmortem evidence from a DON patient demonstrated a loss of large-type axons in the optic nerve[62]. Advanced modalities such as DTI, T2 mapping, and magnetization transfer imaging enable the noninvasive detection of neuronal injury that is not visible via conventional MRI[22,28,30]. DTI captures the directional nature of water diffusion and reflects subclinical neuronal injury. DTI-derived metrics can evaluate axonal integrity, glial cell impairment, and myelination[63,64]. T2 mapping provides a quantitative measure of the T2 relaxation time, which is sensitive to variations in the tissue water content, vascular permeability, inflammatory mediators, and products of axonal or myelin breakdown[65,66]. Magnetization transfer imaging assesses the proton magnetization exchange between free and macromolecule-bound water[67]. The derived MTR reflects the concentration of macromolecules in tissues, such as the lipid-rich myelin sheath of the optic nerve[68,69]. In DON patients, abnormal DTI metrics, elevated T2 values, and reduced MTR values likely reflect these underlying pathological alterations in the optic nerves.
Moreover, the optic nerve sheath and the CSF constitute essential components of the optic nerve. One study indicated that DON is associated with enlargement of the perineural subarachnoid space, as reflected in increased optic nerve sheath diameter, cross-sectional area, and CSF volume within the sheath compared with nDON patients[31]. These findings suggested that accumulation of CSF within the optic nerve sheath may serve as a sensitive indicator for predicting DON. Several possible mechanisms may explain these observations: Apical crowding caused by enlarged extraocular muscles and orbital fat may physically impede CSF reflux and restrict venous drainage. Concurrently, inflammatory exudation could contribute to fluid accumulating within the optic nerve sheath[70]. Furthermore, recent studies have identified a putative glymphatic system in the eye and optic nerve, which is hypothesized to provide a paravascular pathway for clearing CSF in the optic nerve sheath[71−73]. Glymphatic circulation appears to interface directly with the human visual pathway and may contribute to the pathophysiology of several ophthalmic diseases[74,75]. Therefore, impairment of the glymphatic system in DON could play a significant role in CSF's accumulation within the optic nerve sheath. Emerging evidence has already demonstrated brain glymphatic dysfunction in TED patients, with severity correlating with disease activity and duration[76]. Further investigation into glymphatic circulation within the optic nerve may thus provide novel diagnostic insights and therapeutic avenues for DON in the future.
Orbital MRI parameters hold more immediate clinical potential, given their relatively well-established association with the pathophysiological changes of DON. Nevertheless, brain alterations are also informative, particularly for mechanistic exploration. Visual information is transmitted from the retinal ganglion cells to the brain for processing[77]. Prior research has yielded initial evidence that optic nerve injury may influence the intracranial visual pathway through transsynaptic axonal degeneration[78]. Therefore, assessing structural and functional changes within the cerebral visual system could enhance our understanding of DON and aid in its identification. DKI offers kurtosis metrics that enable accurate the detection of minute histological alterations within white matter tracts[79,80]. DKI analysis utilizing tract-based spatial statistics has further revealed that microstructural alterations to the white matter in DON may extend throughout the posterior visual system[35,81]. The most marked alterations were seen in the radial kurtosis values within the bilateral posterior thalamic radiation, a region that primarily contains the optic radiation[82]. These altered radial kurtosis values also demonstrated reasonably strong efficacy in differentiating DON from nDON cases[35]. Functionally, BOLD-fMRI enables both the assessment of local spontaneous brain activity through ALFF and ReHo, as well as the construction of functional networks to characterize the balance between integration and segregation in the brain[83−85]. Across the included studies, the specific brain regions identified as significantly altered have shown an incomplete overlap, though the majority are implicated in visual processing[34,37,38]. The observed heterogeneity may be attributed to either limited sample sizes or the fact that the brain is at different stages of a complex compensatory process[37]. Given the considerable variability in the discriminatory performance of different brain regions identified across these fMRI studies, caution is warranted when considering the clinical application of brain MRI parameters at this stage. They remain largely exploratory and mechanistic, and applying such metrics for identifying DON requires more rigorous research designs and larger sample sizes in future investigations.
Currently, researchers have reported numerous MRI-derived parameters with value for identifying DON from both the orbital and cerebral perspectives. Further analysis reveals that combining multiple parameters often yields superior discriminatory performance, likely because a single parameter is insufficient to fully capture the complex pathophysiology of the disease. Two studies using an integrated orbital–brain approach successfully established effective combined models for identifying DON[39,40]. An integrated approach that synthesizes orbital and brain MRI findings enables a more comprehensive assessment, potentially refining diagnostic accuracy and patient management in DON. However, both studies observed that although the performance of the combined model improved, it was not statistically superior to the model based solely on orbital MRI. This interesting finding may suggest that although cerebral alterations may provide additional diagnostic insights, orbital MRI changes still appear to dominate the identification of DON at present. Notably, the combined model demonstrated higher sensitivity and specificity, which may better align with the clinical preference for classification tools with high accuracy to minimize missed diagnoses and misdiagnoses[40].
There are several limitations that should be acknowledged. First, because of the absence of a gold standard, diagnostic criteria for DON varied across studies, which may affect the reliability of the reported performance of MRI. Heterogeneity in the diagnostic criteria directly influences groups' composition and can affect the optimal cutoff values, potentially leading to overestimation or underestimation of MRI models' performance. This heterogeneity represents a major source of bias and an obstacle to future clinical translation. Second, this study is a targeted systematic review focusing exclusively on MRI research into DON, instead of a general review covering all imaging studies on TED. Therefore, we used DON-related keywords in our search strategy to ensure specificity. Consequently, large-sample MRI studies on TED that did not explicitly mention DON in the title or abstract but may have included DON subgroup data could have been omitted. For similar research to follow this up, a two-step retrieval strategy is advisable: The process should conduct an initial broad search combining TED and MRI terms, then manually screen papers with valid DON subgroup information to minimize omissions. Third, several studies reported exceptionally high performance using complex models but lacked validation cohorts. Given the small, single-center, retrospective nature of most included studies, there is a substantial risk of overfitting and positive result-related publication bias. Therefore, we strongly advocate for prospective, multicenter external validation before clinical translation of these MRI-based models. Fourth, prescanning treatment status is a critical confounder. Although most included studies stated that the participants had not received corticosteroid therapy for at least 3–6 months prior to MRI, treatment status remained unknown in some studies. In addition, other therapeutic interventions such as immunosuppressants, local orbital medications, and prior orbital decompression surgery may also influence orbital inflammation, edema, and the corresponding MRI signal characteristics. The incomplete control of these factors introduces potential systematic bias. Future studies should comprehensively document patients’ baseline medication and surgical history, and ideally apply strict inclusion and exclusion criteria to minimize treatment-related confounding. Fifth, most of the included studies were conducted in China, with several originating from the same institution, raising the possibility of overlapping patient cohorts and limiting external validity. In addition, potential ethnic and regional differences in the incidence of TED, orbital anatomy, and phenotypic manifestations of optic nerve compression between East Asian and Western populations further restrict the generalizability of the findings[86,87]. Therefore, the present conclusions, largely based on Chinese cohorts, should be interpreted with caution when extrapolated to other populations, and international multicenter collaborative research is needed for further validation. Sixth, although MRI parameters have been widely investigated for DON, most studies did not report systematic correlations between the findings revealed by imaging and objective measures of visual function. The lack of accessible histopathological specimens from patients with DON, together with the absence of well-established and reproducible animal models, significantly hampers the ability to validate MRI parameters against true pathological alterations. Therefore, systematic validation linking imaging biomarkers to actual tissue-level pathology and functional visual outcomes remains a major challenge for future research.
-
This systematic review synthesizes current evidence on the application of MRI in the identification of DON. Emerging MRI techniques provide valuable insights into the complex pathophysiology of DON, encompassing both macro- and microstructural changes in the optic nerve, as well as alterations within the central nervous system. We found that integrating multiple MRI parameters is a consistent trend in both orbital and brain MRI studies to enhance performance in distinguishing DON. A combined orbital–brain MRI approach represents a promising strategy for improving the sensitivity and specificity of identifying DON. According to the findings and limitations of this review, several future research priorities should be emphasized. First, standardized clinical diagnostic criteria and MRI research paradigms for DON are urgently needed to reduce heterogeneity across studies. Second, multicenter prospective studies with external validation cohorts are essential to confirm the generalizability of promising MRI markers and address the risk of overfitting. Third, imaging techniques combined with artificial intelligence approaches, such as deep learning, hold promise for automated lesion detection and risk stratification[88]. Fourth, radiomics and habitat-based imaging analysis could better characterize intralesional heterogeneity and spatial microenvironmental variation. Fifth, the integration of MRI with multi-omics data (e.g., transcriptomics[89] and metabolomics[90]) may help identify biologically informed imaging biomarkers. Sixth, the combination of multimodal imaging can provide complementary information and may improve imaging-based assessment of DON[91]. Additionally, in clinical practice, given the heterogeneous course and preclinical phase of DON, increasing awareness of and attention to subclinical DON is particularly important[92,93]. Utilizing MRI for the precise identification of subclinical DON during longitudinal follow-up of TED patients warrants further investigation and is expected to hold significant clinical value.
-
Not applicable.
-
The authors confirm their contributions to the paper as follows: study conception and design: Liu H, Chen HH, Hu H, Wu FY; data collection: Zhou J, Lu JL, Xu XQ; analysis and interpretation of results: Zhou J, Wan Y, Qin JT; draft manuscript preparation: Zhou J; manuscript revision and study supervision: Xu XQ, Hu H, Wu FY. All authors reviewed the results and approved the final version of the manuscript.
-
Data sharing is not applicable to this article as no datasets were generated or analyzed during the current study.
-
The authors declare that they have no conflict of interest.
- Copyright: © 2026 by the author(s). Published by Maximum Academic Press, Fayetteville, GA. This article is an open access article distributed under Creative Commons Attribution License (CC BY 4.0), visit https://creativecommons.org/licenses/by/4.0/.
-
About this article
Cite this article
Zhou J, Lu JL, Wan Y, Qin JT, Chen HH, et al. 2026. Magnetic resonance imaging in identifying dysthyroid optic neuropathy: a systematic review. Visual Neuroscience 43: e043 doi: 10.48130/vns-0026-0040 

Magnetic resonance imaging in identifying dysthyroid optic neuropathy: a systematic review
- Received: 01 April 2026
- Revised: 05 July 2026
- Accepted: 15 July 2026
- Published online: 18 September 2026
Abstract: Dysthyroid optic neuropathy (DON) is the most critical vision-threatening complication of thyroid eye disease (TED), yet no gold standard exists for its identification in clinical practice. Emerging magnetic resonance imaging (MRI) studies have demonstrated the potential of MRI techniques in identifying DON. This systematic review aims to synthesize existing evidence on the application of MRI in identifying DON and discuss how MRI-derived metrics may relate to the underlying pathological mechanisms. We analyzed data from 17 related studies involving 1,664 TED patients with or without DON and 186 healthy controls, utilizing orbital MRI, brain MRI, or a combined orbital–brain MRI approach. These studies uncovered several MRI metrics that are applicable to the identification of DON and reported their identification performance. Notably, integrating multiple MRI parameters may enhance the identification accuracy for DON, and a combined orbital–brain approach shows promise for further improving the sensitivity and specificity. This review highlights the potential value of MRI techniques as complementary imaging biomarkers in the evaluation of DON, lays a foundation for future clinical applications, and proposes directions for further research.
-
Key words:
- Dysthyroid optic neuropathy /
- Magnetic resonance imaging /
- Identification /
- Orbital /
- Brain