












-
China's apple industry is predominantly composed of mid- and late-maturing apple varieties, whose color conversion and ripening often occur at the same time, resulting in centralized marketing and low product price[1]. Therefore, it is important to study the mechanism underlying fruit color formation in apple for regulating the fruit color conversion period. Apple color is mainly determined by flavonoids, which can be structurally categorized into four subclasses, namely flavan-3-ols, flavonols, flavanones, and anthocyanidins[2]. Generally, flavan-3-ols are the most abundant subclass, and are mainly composed of catechin, epicatechin, and procyanidin dimers. Flavonols are the second most abundant subclass, and are commonly found as the O-glycoside forms of quercetins, such as quercetin-3-O-galactoside, quercetin-3-O-glucoside, and quercetin-3-O-rhamnoside. Flavanones are the third highest subclass, in which dihydrochalcones (such as phloridzin) has been recognized as the characteristic compound of apple fruits owing to their exclusive accumulation in Malus species[3]. Anthocyanidins are generally accumulated at lower concentration levels and are predominantly accumulated in colored apple varieties in the form of cyanidin glycosides, including cyanidin 3-O-glucoside, cyanidin 3-O-galactoside, and cyanidin-3-O-arabinoside[4]. In addition to their roles in fruit color, flavonoids also serve as imperative buffer substances in linking primary and secondary metabolic processes[5]. Therefore, apple varieties with diverse and abundant flavonoids are ideal materials for studying the interplay of flavonoids and primary metabolism in plants.
The formation of the basic backbone structure of flavonoids is initiated by chalcone synthase (CHS), which catalyzes the combination of p-coumaroyl-Coenzyme A (CoA) from the phenylpropanoid pathway and malonyl-CoA from the malonyl-CoA supplying pathways (Fig. 1)[5]. The function of the phenylpropanoid pathway to provide p-coumaroyl-CoA has attracted considerable research attention[6,7]; in contrast, much less attention has been paid to the malonyl-CoA supplying pathways. It has been reported that acetyl-CoA and/or malonyl-CoA levels within the cytosol have a significant impact on the formation of flavonoids in Arabidopsis[5]. Therefore, the malonyl-CoA supplying pathway may be a supporting pathway for the improvement of plant flavonoids that has hitherto been ignored.
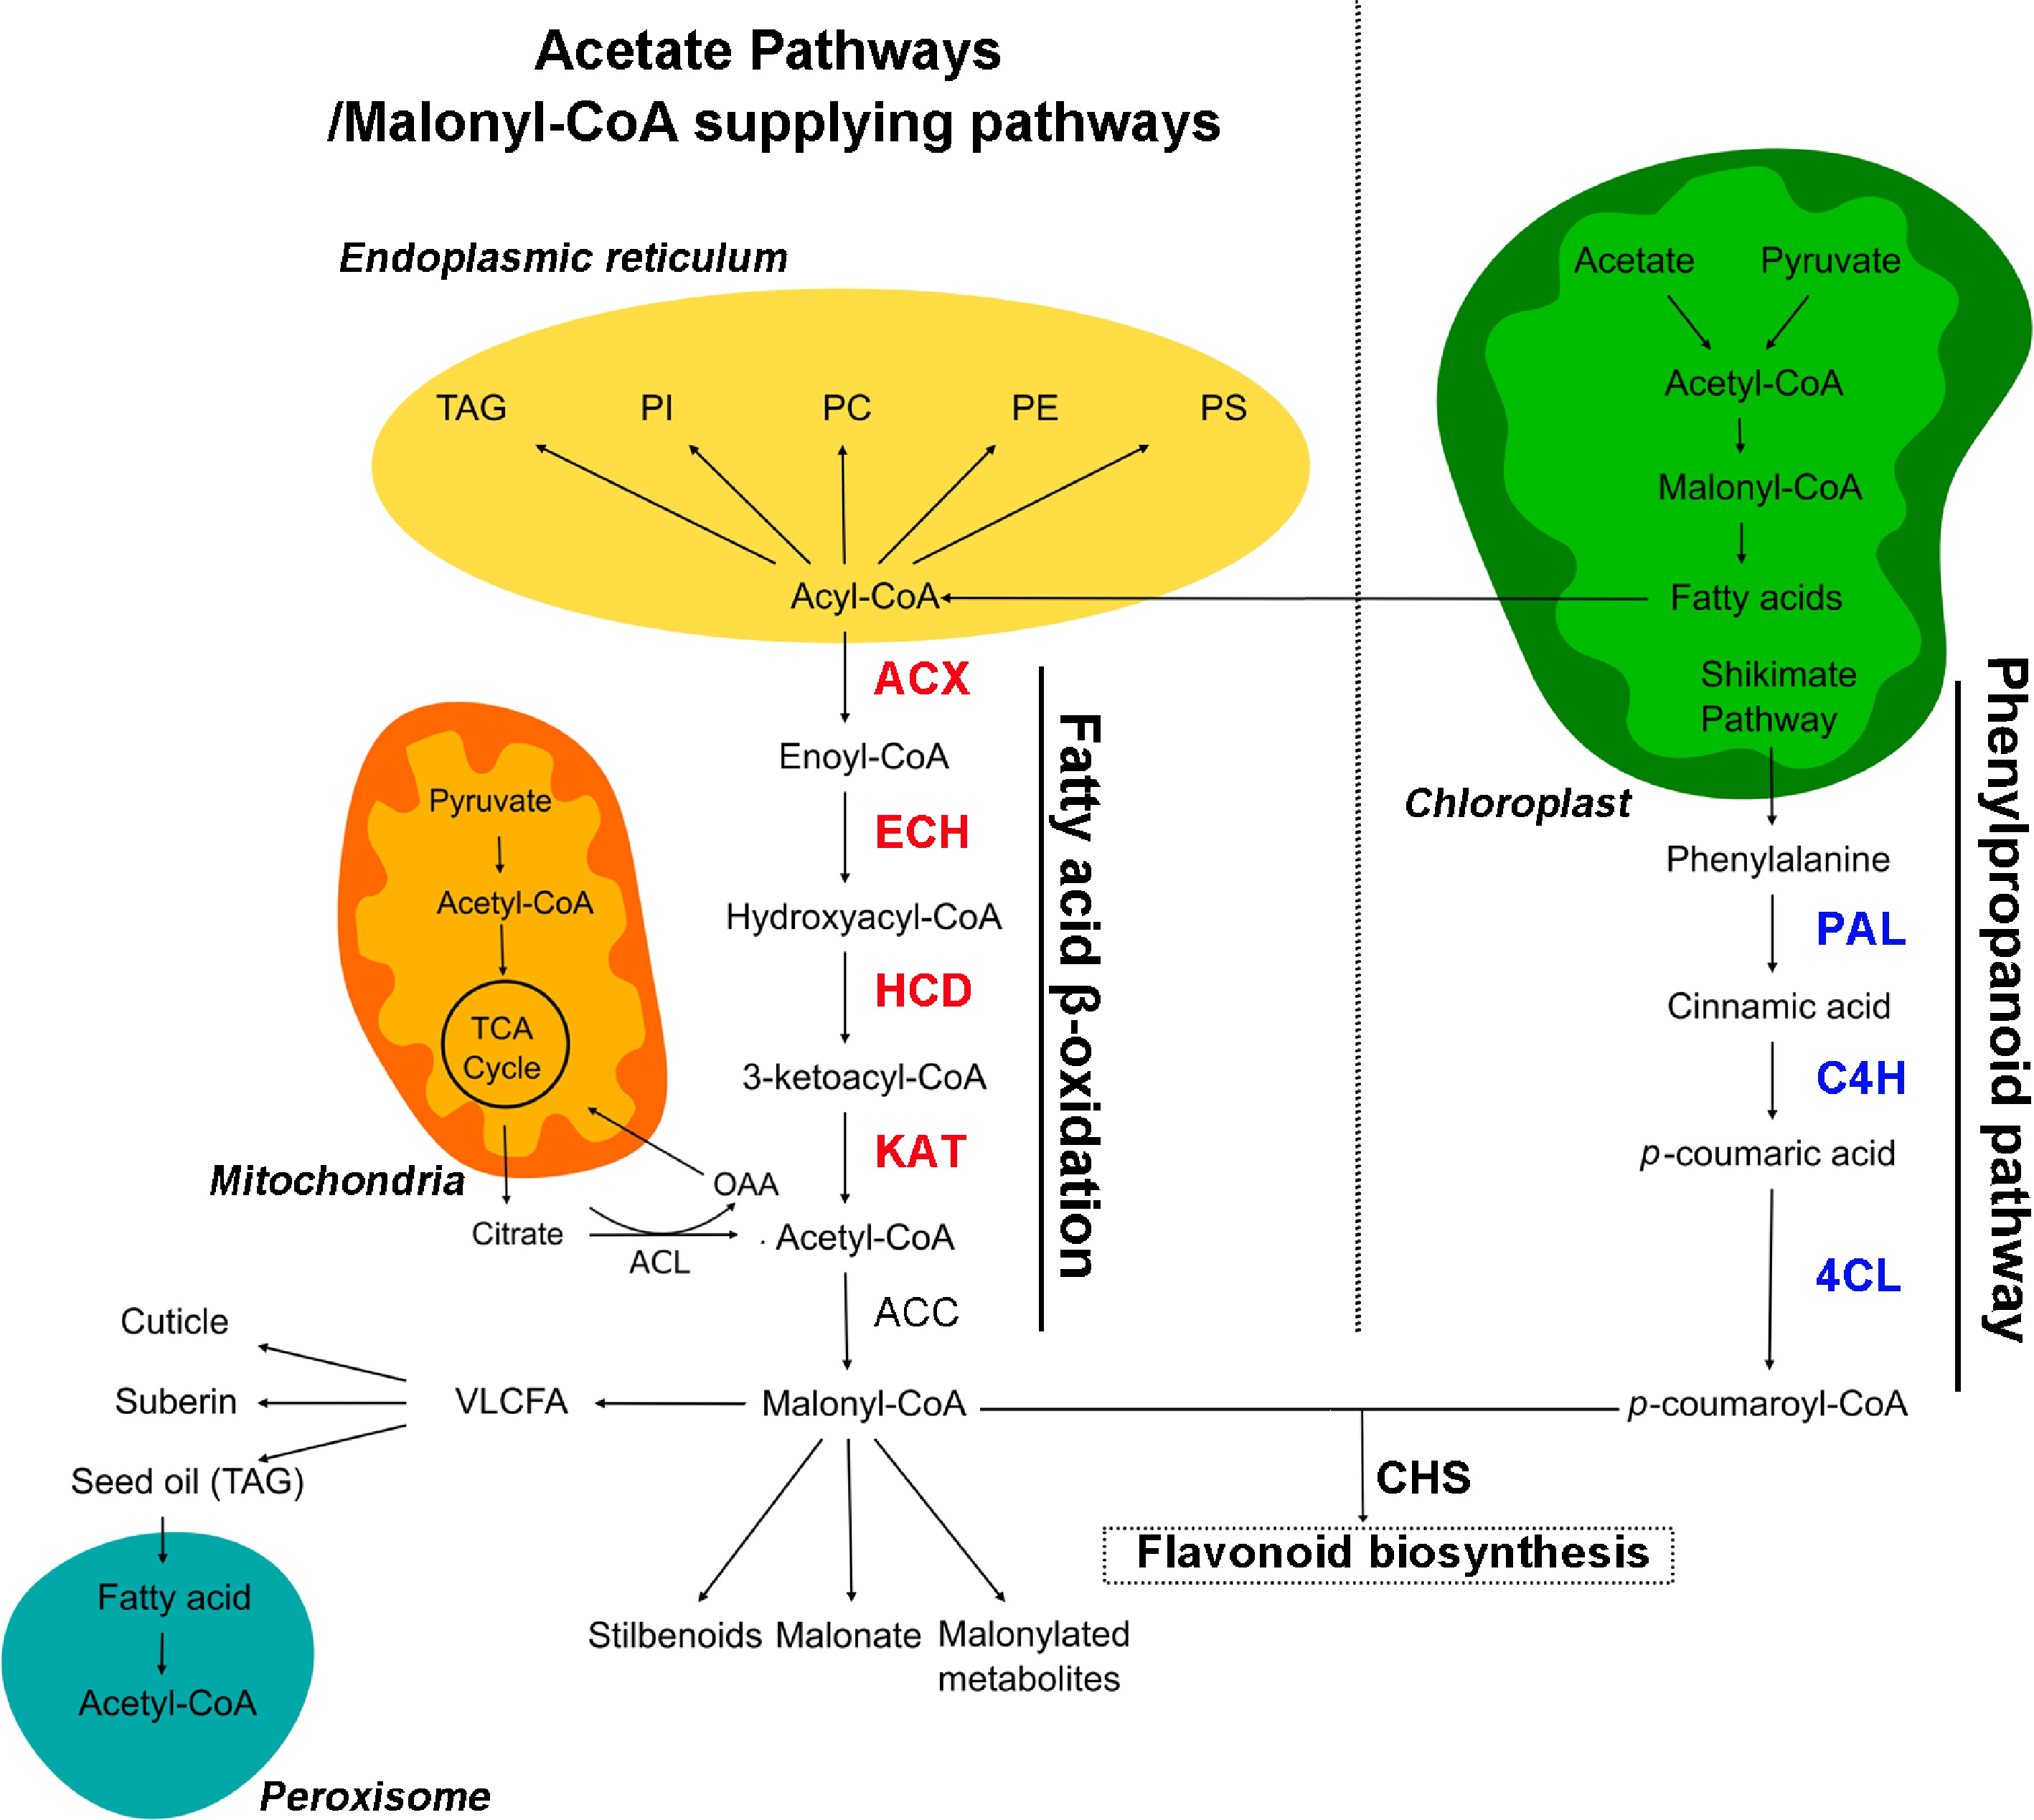
Figure 1.
Overview of flavonoid and acetyl-CoA metabolic pathways in plants. Enzymes mentioned in this work are highlighted in red for fatty acid β-oxidation and blue for the phenylpropanoid pathway. OAA, oxaloacetate; ECH, enoyl-CoA hydratase; HCD, hydroxyacyl-CoA dehydrogenase; PAL, phenylalanine ammonia lyase; C4H, cinnamate 4-hydroxylase; 4CL, 4-coumarate: CoA ligase; CHS, chalcone synthase. The pathway map was drawn according to the report of Perez de Souza et al.[5].
β-Oxidation plays a basic housekeeping role in metabolic breakdown of fatty acids and can provide abundant cytosolic malonyl-CoA[8]. β-Oxidation of fatty acids occurs via the successive catalyzation of acyl-CoA oxidase (ACX), enoyl-CoA hydratase (ECH), hydroxyacyl-CoA dehydrogenase (HCD), and ketoacyl-CoA thiolase (KAT) in both the peroxisomes and mitochondria[9], providing acetyl-CoA for the production of malonyl-CoA (Fig. 1). It has been indicated that the genes related to β-oxidation and flavonoids are often co-expressed in plants. For example, the expression of KAT5, a rate-limiting enzyme of β-oxidation, has been reported to be highly correlated with that of flavonoid-related genes in Arabidopsis[10,11]. Ultraviolet (UV) light treatment was found to simultaneously induce ACX and the phenylalanine ammonia lyase (PAL) and chalcone synthase (CHS) genes in flavonoid biosynthesis in parsley (Petrosilenum crispum)[12]. Besides the supply of carbon substrate, the final steps of the hormone jasmonic acid (JA) biosynthesis are catalyzed by the three core enzymes of the β-oxidation cycle in the peroxisome[13]. It has been extensively reported that an increase in JA content boosts the content of flavonoid pigments in apple[14−16]. Therefore, the β-oxidation process, which is important in the mobilization of carbon flux from fatty acids towards cytosolic malonyl-CoAs, theoretically plays an important role in flavonoid biosynthesis. However, studies of fatty acid β-oxidation in plants have been mostly focused on its effect on seedling development and lipid homeostasis[17−19], while the influence of β-oxidation on flavonoids remains poorly understood.
It has been well established that apple flavonoids differ significantly among different cultivars, particularly those with different colors[20]. In this study, we selected nine apple cultivars with different contents of flavonoids from 33 common cultivars in China. These nine cultivars were divided into three groups, and their metabolite profiles were analyzed via high-resolution mass spectrometry. Specifically, we focused on the association of major flavonoids with fatty acids and JA in these apple cultivars. At the transcriptome level, we observed differentially expressed genes in fatty acid- and flavonoid-related pathways between cultivars with high and low flavonoid contents. Finally, we harvested 'Fuji' apple at the coloring stage and treated these fruit with 100 and 200 μM etomoxir, an effective irreversible inhibitor of palmitoyltransferase (CPTo) (EC 2.3.1.21) that supplies long-chain acyl-CoAs for β-oxidation[21,22]. Etomoxir has been successfully used to block fatty acid β-oxidation in pea, wheat, and Drosophila[23−25]. The degree of coloration, content of flavonoids, and expression levels of flavonoid-related genes were decreased in the two treatment groups compared with that of the control group in a dose-dependent manner. This study aimed to demonstrate the influence of β-oxidation on flavonoid biosynthesis in apple and provides a theoretical foundation for increasing flavonoids from the perspective of fatty acids.
-
Most of the 33 apple cultivars used for total flavonoid analysis were obtained from adjacent orchards with similar levels of management in Weihai City in Shandong Province. The cultivar 'Black Diamond' (a mutant of the Red Delicious strain) was collected from orchards in Zhaotong City in Yunnan Province. Apple fruit were harvested as they were ripening in accordance with the local commercial harvesting period and immediately sent to the fruit laboratory of Qingdao Agricultural University.
Three biological replicates for each cultivar were collected, with each replicate including 10–12 fruit from at least three trees. The whole fruit without the central part (core) was carefully cut into pieces and immediately immersed in liquid nitrogen. Homogeneous powder was obtained by crushing the frozen tissues with nitrogen to avoid hydration. Powders were kept in a refrigerator at –80 °C until further metabolic and transcriptomic analyses.
Determination of total flavonoids
-
Total flavonoids were determined by the aluminum chloride method described by Hosu et al.[26], with some modifications. First, 1 mL of apple extract was treated with 0.3 mL of a 5% (w/v) sodium acetate solution, 0.3 mL of a 10% (w/v) AlCl3 solution, and 5 mL of distilled water. After 10 min of incubation at room temperature (RT), 2 mL of 1 mol/L sodium hydroxide was added and the volume was adjusted to 10 mL using 60% ethanol. The solution mixture was then appropriately mixed and incubated at RT for 12 min. The total content of flavonoids was determined by measuring the absorbance at 500 nm using a UV spectrophotometer and expressed as mg catechin equivalent (CAE) per 1 g of apple (fresh weight) based on the calibration curve obtained for catechin in the 0–320 mg/L concentration range.
Nontargeted metabolomics by liquid chromatography–Orbitrap mass spectrometry/mass spectrometry
-
Extraction of the metabolites was performed according to the method of Meng et al.[27], with modifications. First, 0.5 g of each sample was weighed and extracted in 1 mL of 80% aqueous ethanol (v/v) in an ultrasonic bath under ultrasonic wave treatment for over 30 min at 4 °C. The homogenate was centrifuged at 12,000× g for 10 min at 4 °C, and the supernatant was collected. The steps of extraction and centrifugation were repeated three times. The supernatants were combined, dried with nitrogen gas, dissolved into 0.5 mL of 80% aqueous ethanol (v/v), and filtered through 0.22 μm hydrophilic polytetrafluoroethylene (PTFE) syringe filters for both nontargeted and targeted analysis.
Nontargeted metabolic profiling was performed with a previously described method[28]. The extracts were analyzed using an Ultimate 3000 ultrahigh-performance liquid chromatography (UHPLC) system coupled with a CORTECS T3 Column (100 mm × 2.1 mm, 2.7 μm, Waters Corporation) and an ESI-Q Exactive Plus mass spectrometer operating in the full scan data-dependent mass spectrscopy (MS)/MS acquisition mode (positive and negative modes). The solvent system of UHPLC was composed of methanol (Solution A) and 0.1% formic acid in water (Solution B). The gradient program and MS detection parameters were set the same as reported above. Raw data were processed with the commercial software Compound Discoverer 3.1 (Thermo Fisher, San Jose, CA, USA). Each metabolite was tentatively annotated on the basis of the mzCloud Library, mass fragmentation, previous literature, and standards. Three biological replicates for each cultivar were set for analysis. Compounds with high scores or corresponding to authentic standards were extracted and are presented in Supplementary Table S1.
Targeted metabolomics by liquid chromatography–MS/MS
-
Extraction of the metabolites was performed the same as described in the nontargeted metabolomics part. Three biological replicates for each cultivar were set for analysis.
Targeted metabolic profiling was performed according to Meng et al.[27]. The UHPHC system (Agilent 1290, Agilent Technologies) was equipped with an XBridge BEH C18 XP column (150 mm × 3 mm, 2.5 μm, Waters Corporation) and electrospray ionization-triple quadrupole (ESI-QQQ) equipment (Agilent 6430 QqQ, Agilent Technologies, Agilent, USA). The solvent system of UHPLC consisted of water (A, 0.1% formic acid) and methanol (B, 0.1% formic acid). The gradient program and MS detection parameters were set the same as reported above. The precursor ion in Quadrupole 1 (Q1) and its product ion in Q3 of each metabolite were obtained by the multiple reaction monitoring (MRM) technique with the standards. Precursor and product ion pairs of the 26 standards were selected for the detection list. The contents of these 26 compounds were quantified in the apple cultivars (Supplementary Table S2).
RNA extraction, sequencing, and data analysis
-
RNA extraction was performed according to the instructions with a RNA prep Pure Plant Kit (Tiangene Co., China). The concentrations of total RNA samples were analyzed with a Nanodrop spectrophotometer (Thermo Fisher Scientific Inc., USA). After quality checking, RNA samples were used for mRNA-Seq library construction and sequencing with the BGI DNBseq platform at Beijing Youji Technology Co., Ltd, China. Clean reads were mapped to the reference apple genome (
https://iris.angers.inra.fr/gddh13/the-apple-genome-downloads.html ). The uniquely mapped reads were extracted for estimating the expression levels of protein-coding genes using Cufflinks, and fragments per kilobase per million mapped fragments (FPKM) was used as the unit of measurement to estimate transcript abundance. Differentially expressed genes (DEGs) were identified by comparing the gene expression levels of some cultivars ('Fuji', 'BD', and 'SWH') with those of 'Orin' using the R package DESeq2. All genes with a Benjamini-Hochberg adjusted p-value (q value) lower than 0.05 and a fold change greater than 1 were regarded as DEGs (Supplementary Table S3). Three biological replicates for each cultivar were used for RNA-seq analysis.Protein sequences of the DEGs were extracted by T-Btools[29] and submitted to Kyoto Encyclopedia of Genes and Genomes (KEGG) for gene annotation and enrichment analysis.
Etomoxir treatment
-
A total of 60 packaged 'Fuji' apple fruit with uniform size in the color transition period were used for the etomoxir treatment. The fruit were removed from the packages and equally divided into three groups, which were immersed into 0 (control), 100, and 200 μM concentrations of etomoxir (Macklin, CAS: 828934-41-4) with 0.05% Tween-80 for 2 min. The fruit were then air-dried and placed in an incubator with 16 h of light and 8 h of dark. Each group was sprayed with the corresponding concentrations of etomoxir once every two days. After 7 d of exposure to light, the value of the surface color was measured. Fruit peels of each group were then collected and immersed in liquid nitrogen and then stored at –80 °C.
Validation of gene expression by quantitative real-time polymerase chain reaction
-
The quantitative real-time polymerase chain reaction (RT-qPCR) experiment was performed according to a previous report[30]. The cDNA synthesis was performed by using the HiScript II First Strand cDNA Synthesis Kit (+gDNA wiper; Vazyme). A gDNA wiper was included in the kit to wipe DNA fragments. RT-qPCR was carried out by using the SYBR Premix Ex Taq Kit (TaKaRa, Dalian, China) with the ABI 7500 Real-Time PCR system. Apple actin (accession no. CN938023) was selected as the internal reference gene. Gene-specific primers used for RT-qPCR were designed using Primer Express software and are listed in Supplementary Table S4. Three replicates were set for each gene quantification and the results were calculated with the 2−ΔΔCᴛ method.
-
In this study, 33 middle- or late-maturing apple cultivars were selected for total flavonoid measurement. The flavonoid content ranged from 0.18 to 0.97 mg CAE/g, which is similar to the range reported by using rutin as the equivalent[31]. The top three flavonoid contents were found in 'Purple Fragrance' (Malus micromalus cv. 'Ruby' × Malus pumila Mill.) (PF), 'Saiwai Hong' (Malus prunifolia) (SWH), and 'Black Diamond' (a mutant of the Red Delicious strain) (BD) with values of 0.96, 0.85, and 0.70 mg CAE/g, respectively, while the three lowest flavonoid contents were found in 'HARLIKAR' ('Golden Delicious' × unknown cultivar), 'Golden Delicious' (GD), and 'Orin' with values of 0.23, 0.20, and 0.18 mg CAE/g, respectively. The total flavonoid contents of 'Fuji', 'Gala', and 'Crispy' fell within the middle range among all the cultivars (Fig. 2a). As shown in Fig. 2b, the cultivars with high ('PF', 'SWH', and 'BD'), medium ('Fuji', 'Gala', and 'Crispy'), and low ('HARLIKAR', 'GD', and 'Orin') flavonoid contents exhibited purplish, red, and pale green color, respectively. The red or pale green color was further confirmed by variations in the value 'a' determined by a colorimeter (Fig. 2c). Therefore, we grouped these cultivars as the Dark group, Red group, and Pale group. These nine cultivars from these three groups were used for further analysis.
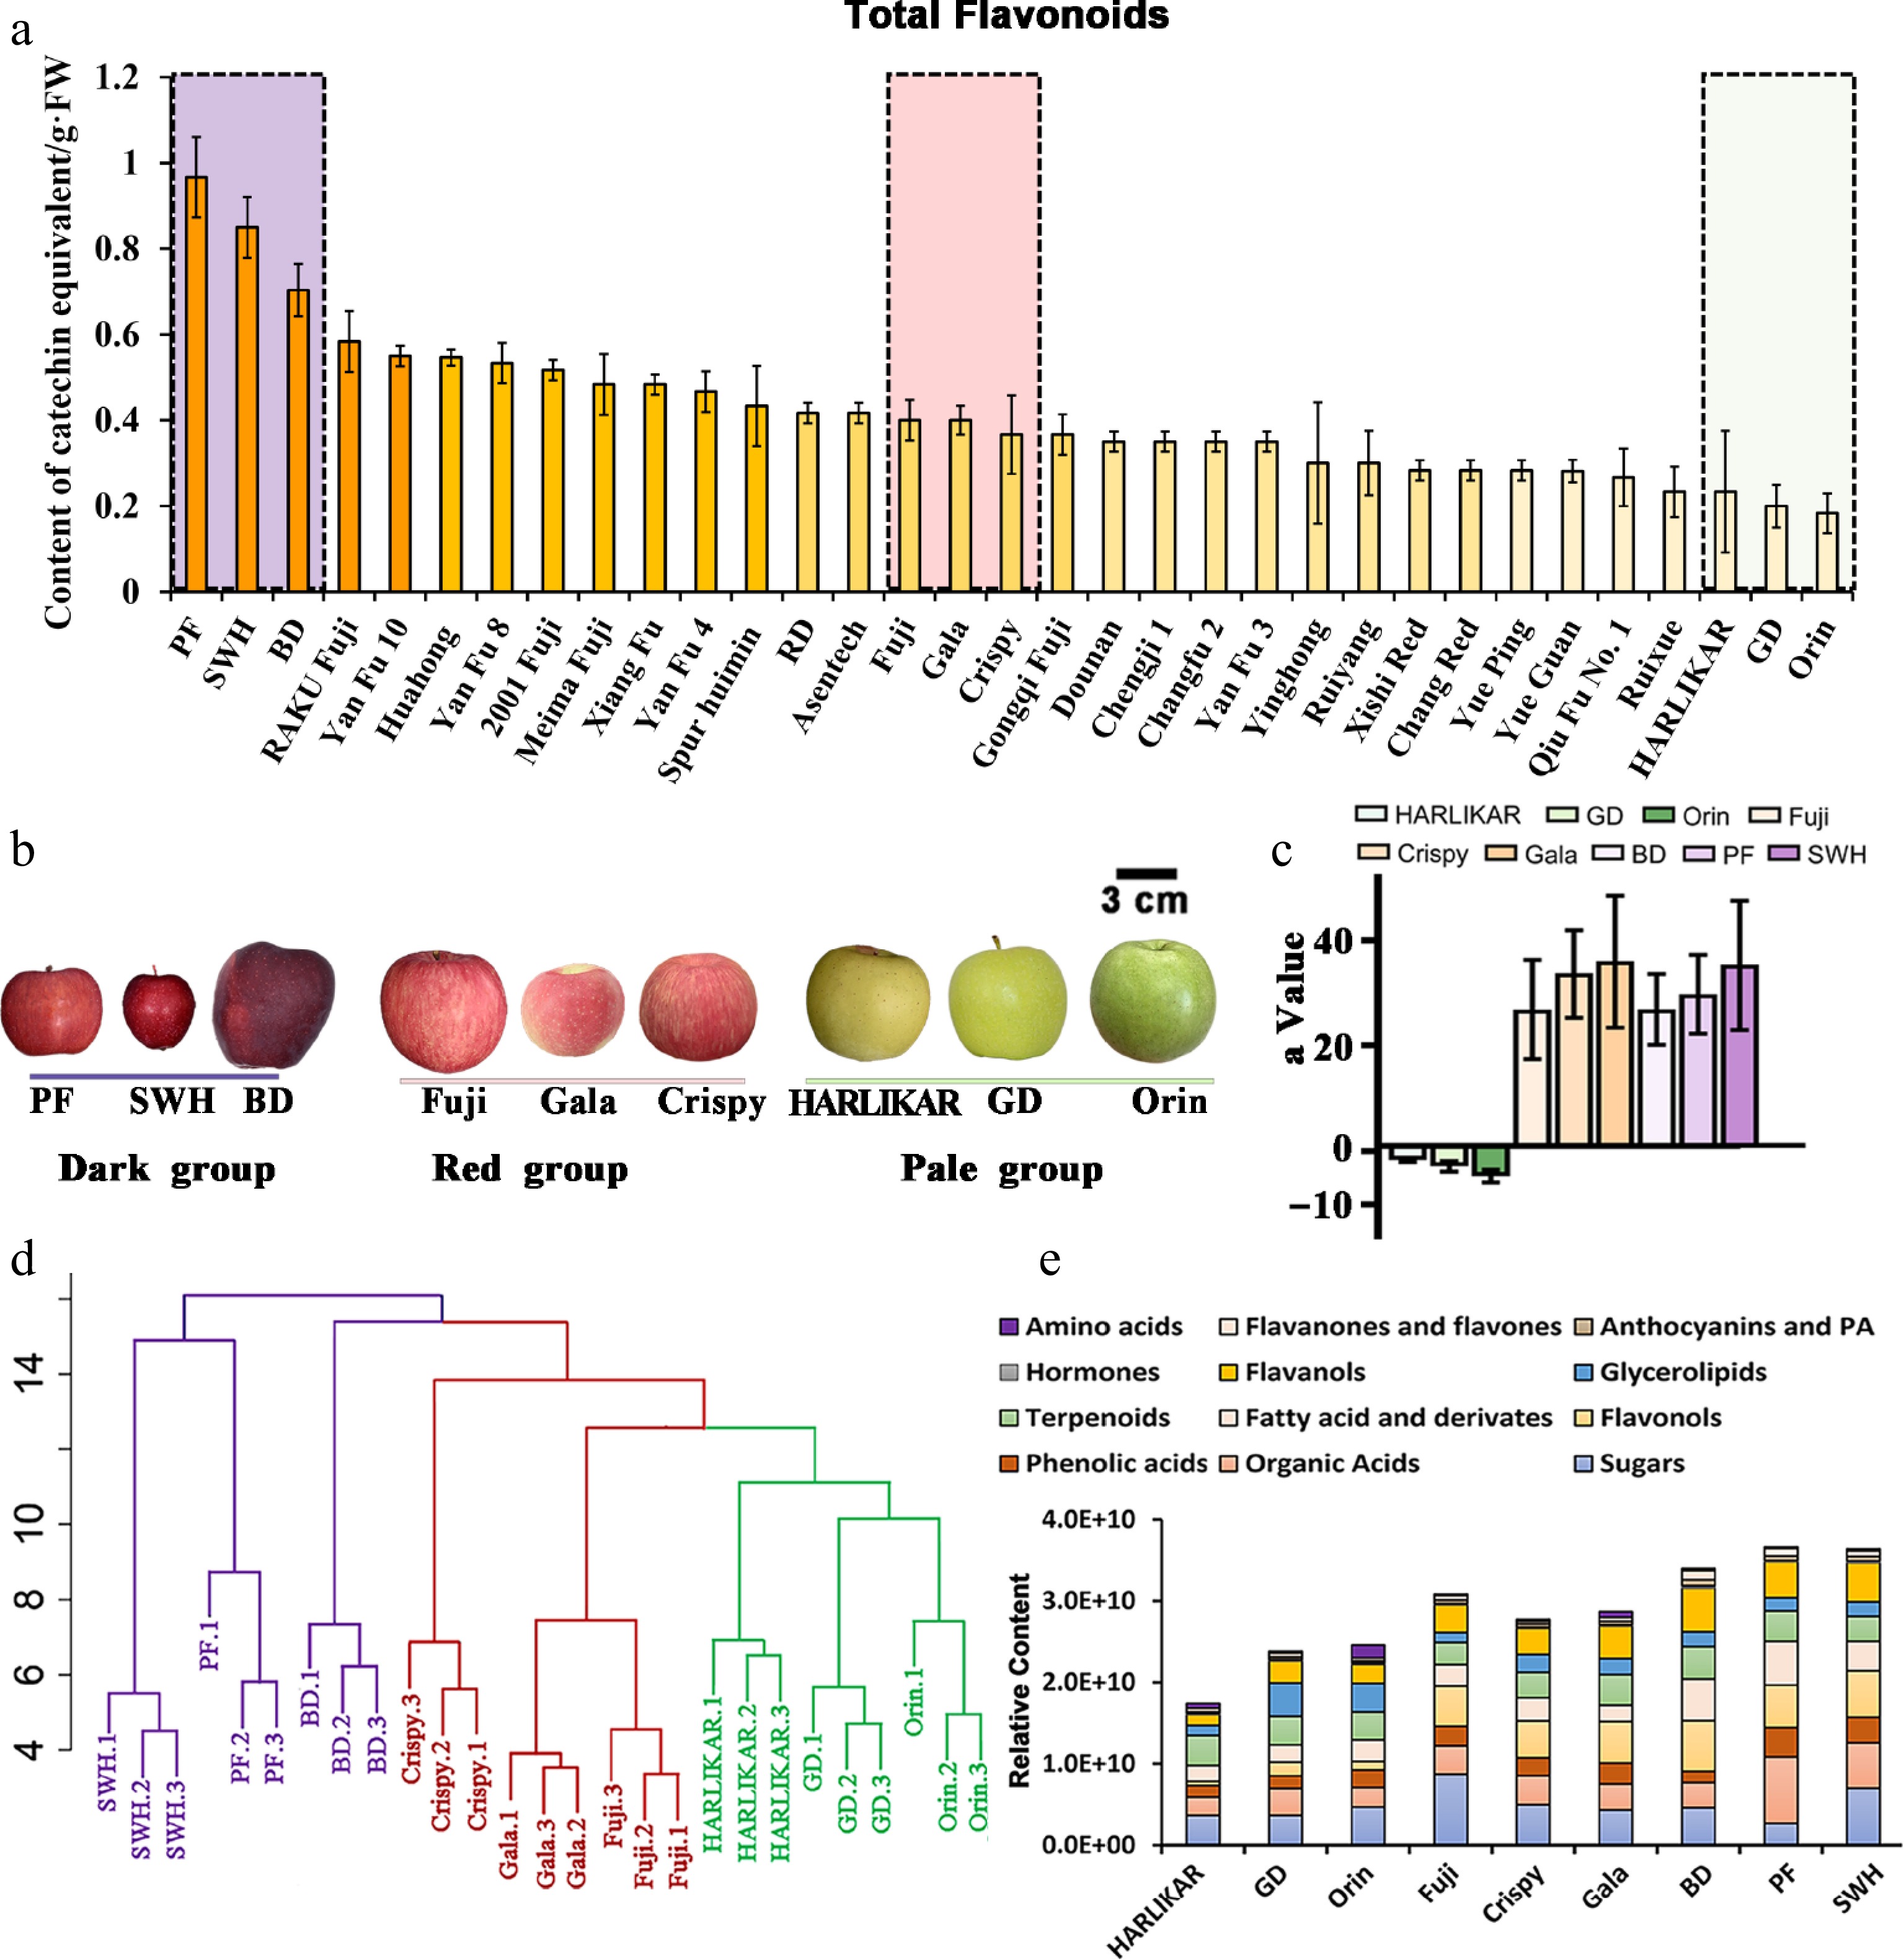
Figure 2.
Nontargeted analysis of nine apple cultivars with different flavonoid contents. (a) Total flavonoid contents of 33 popular cultivars. (b) Appearance of the fruit of nine selected cultivars with different flavonoid contents. (c) The 'a' value of the colorimeter for these nine cultivars. (d) Hierarchical clustering of nontargeted metabolic results of nine cultivars. Cultivars in the same group are indicated in the same color. (e) Relative content of each metabolic subclass observed via nontargeted analysis. Data are the means ± standard deviation (SD) of three biological replicates. Detailed data of the nontarget analysis are presented in Supplementary Table S1.
Nontargeted metabolomics analysis based on high-resolution MS has been shown to be very effective in identifying potential markers under complex metabolite contexts[32]. We conducted nontargeted metabolomics analysis of these nine apple cultivars to identify the key flavonoid components with evident differences among the groups and to determine other nonflavonoid compounds showing co-changes with these key flavonoid components. As a result, we identified 13 phenolic acids and derivatives, 31 flavonoids, 7 sugars, 6 organic acids, 5 amino acids, 7 fatty acids, 14 terpenoids, 5 hormones, and a fraction of glycolipids (Supplementary Table S1). Hierarchical clustering analysis revealed the clustering of these nine cultivars into different groups, indicating different metabolic patterns among the groups (Fig. 2d). The proportions of major flavonoid subclasses were different among different groups. For example, in the Dark group, Red group, and Pale group, the average proportions of flavan-3-ols were 20.71%, 18.87%, and 15.09%, respectively (Fig. 2e). In general, targeted metabolomics provides more accurate quantitative results than nontargeted metabolomics[33]. Therefore, we selected 26 key flavonoids for targeted analysis in the targeted MRM ion mode (Supplementary Table S2), which included 10 major flavonoids detected by nontargeted analysis and 11 anthocyanins (Supplementary Table S2).
Contents of flavanones and flavonols
-
Here, a total of 14 flavanone-flavones and 13 flavonols were identified by the liquid chromatography (LC)-Orbitrap MS/MS method (Fig. 3a; Supplementary Table S1). The proportion of each substance in the corresponding subclass is also displayed on the right side of the heatmap in Fig. 3a. Phloridzin was the most dominant among the flavanone-flavones and further quantified at m/z 437 [M]+ with fragments at m/z 275 in MRM ion mode. The phloridzin content followed a decreasing order of Dark group (25.09–39.51 mg/kg) > Red group (15.04–21.23 mg/kg) > Pale group (13.84–14.75 mg/kg) (Fig. 3b). Flavones accounted for a small proportion of total flavonoids in these apple cultivars, and apigenin-O-glucoside was the most abundant flavone, which was further quantified at m/z 447 [M]+ with fragments at m/z 450 and 270. (Fig. 3a). Apigenin-O-glucoside was detected in all three cultivars in the Dark group and only in 'Gala' in the Red group, but not in the Pale group. Similar results were observed for another flavone, luteolin-O-glucoside (m/z 449 [M]+ with fragments at m/z 287) (Supplementary Table S2). Flavonols commonly exist in the form of quercetin glycosides. The three most abundant quercetin glycosides, including quercetin-3-O-galactoside, quercetin-3-O-rhamnoside, and quercetin-3-O-glucoside, were observed and quantified by MRM. The highest quercetin-3-O-galactoside content was found in GD and the total content of these quercetin glycosides exhibited no evident difference among the three groups. Interestingly, a small number of kaempferol glycosides were identified and quantified in this study. These compounds showed similar accumulative pattern to phloridzin (Fig. 3c).
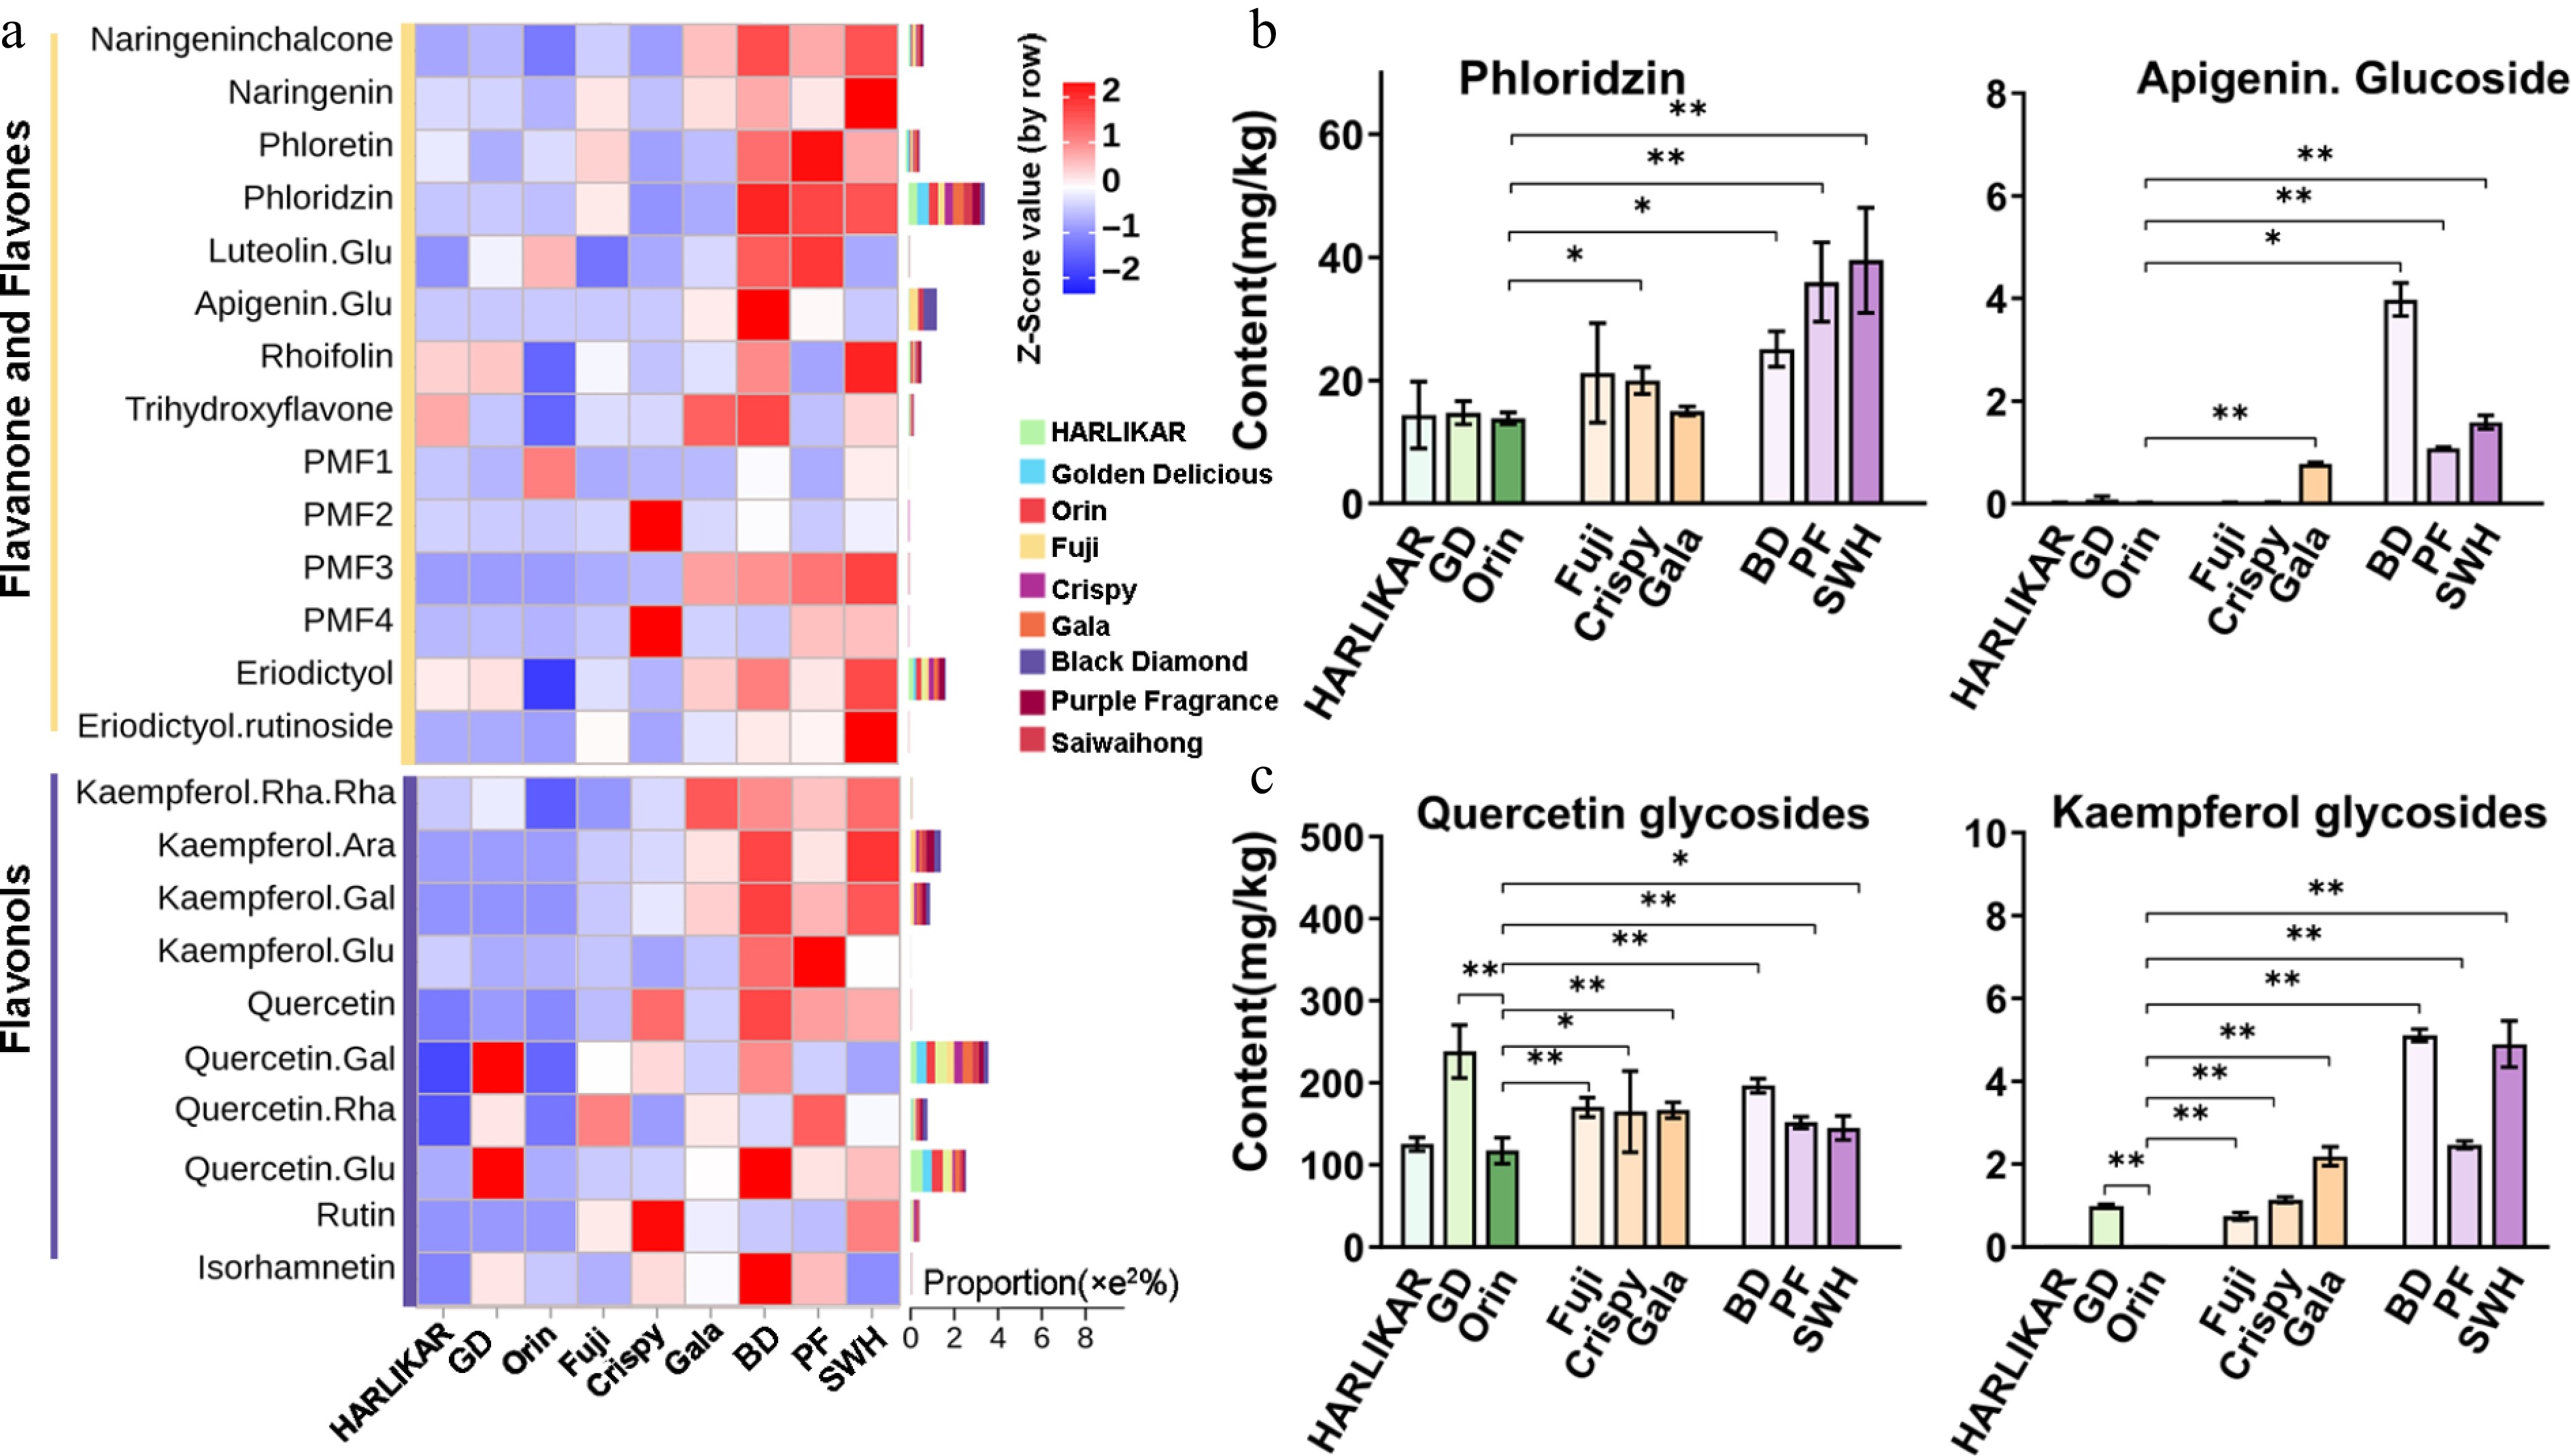
Figure 3.
Content variations of flavanone-flavones and flavonols among the three groups. (a) Contents of flavanone-flavones and flavonol compounds measured by LC-Orbitrap MS/MS. Color scales from red to blue represent values from high to low. Bars located to the left of heatmap represent the total proportion of each compound in each subclass. (b) Contents of phloridzin and apigenin glucoside from the flavanone-flavones subclass measured by QQQ MS/MS. (c) Contents of quercetin and kaempferol glycosides from the flavonol subclass. Data are the means ± SD of three biological replicates. Student's t-test p-values were calculated between 'Orin' and other cultivars. * and ** indicate Student's t-test p-values lower than 0.05 and 0.01, respectively (n = 3).
Contents of flavan-3-ols and anthocyanins
-
In this study, three dimers (procyanidins A1, B1, and C1) and four monomers (epicatechin, catechin, epigallocatechin, and epigallocatechin 3-gallate) of flavan-3-ols were identified by nontargeted analysis (Fig. 4a). Among them, those with relatively high proportions in their respective subclass were further quantified by MRM, including epicatechin at m/z 291 [M]+ with fragments at m/z 139, catechin at m/z 291 [M]+ with fragments at m/z 247, and procyanidin B1 (ProB1) at m/z 579 [M]+ with fragments at m/z 127. Epicatechin and procyanidins are the major phenolic compounds in most apple cultivars[34]. The content of these two compounds showed clear gradient changes across the three groups: the contents of epicatechin and ProB1 were the highest in the Dark group (90.74–107.04 and 112.70–147.37 mg/kg, respectively), followed by the Red group (67.62–83.64 and 83.98–95.20 mg/kg, respectively), and then the Pale group (17.71–53.48 and 61.06–75.48 mg/kg, respectively) (Fig. 4b, c). The Dark group also exhibited a clearly higher level of catechin, the isomeric form of epicatechin (Fig. 4c).
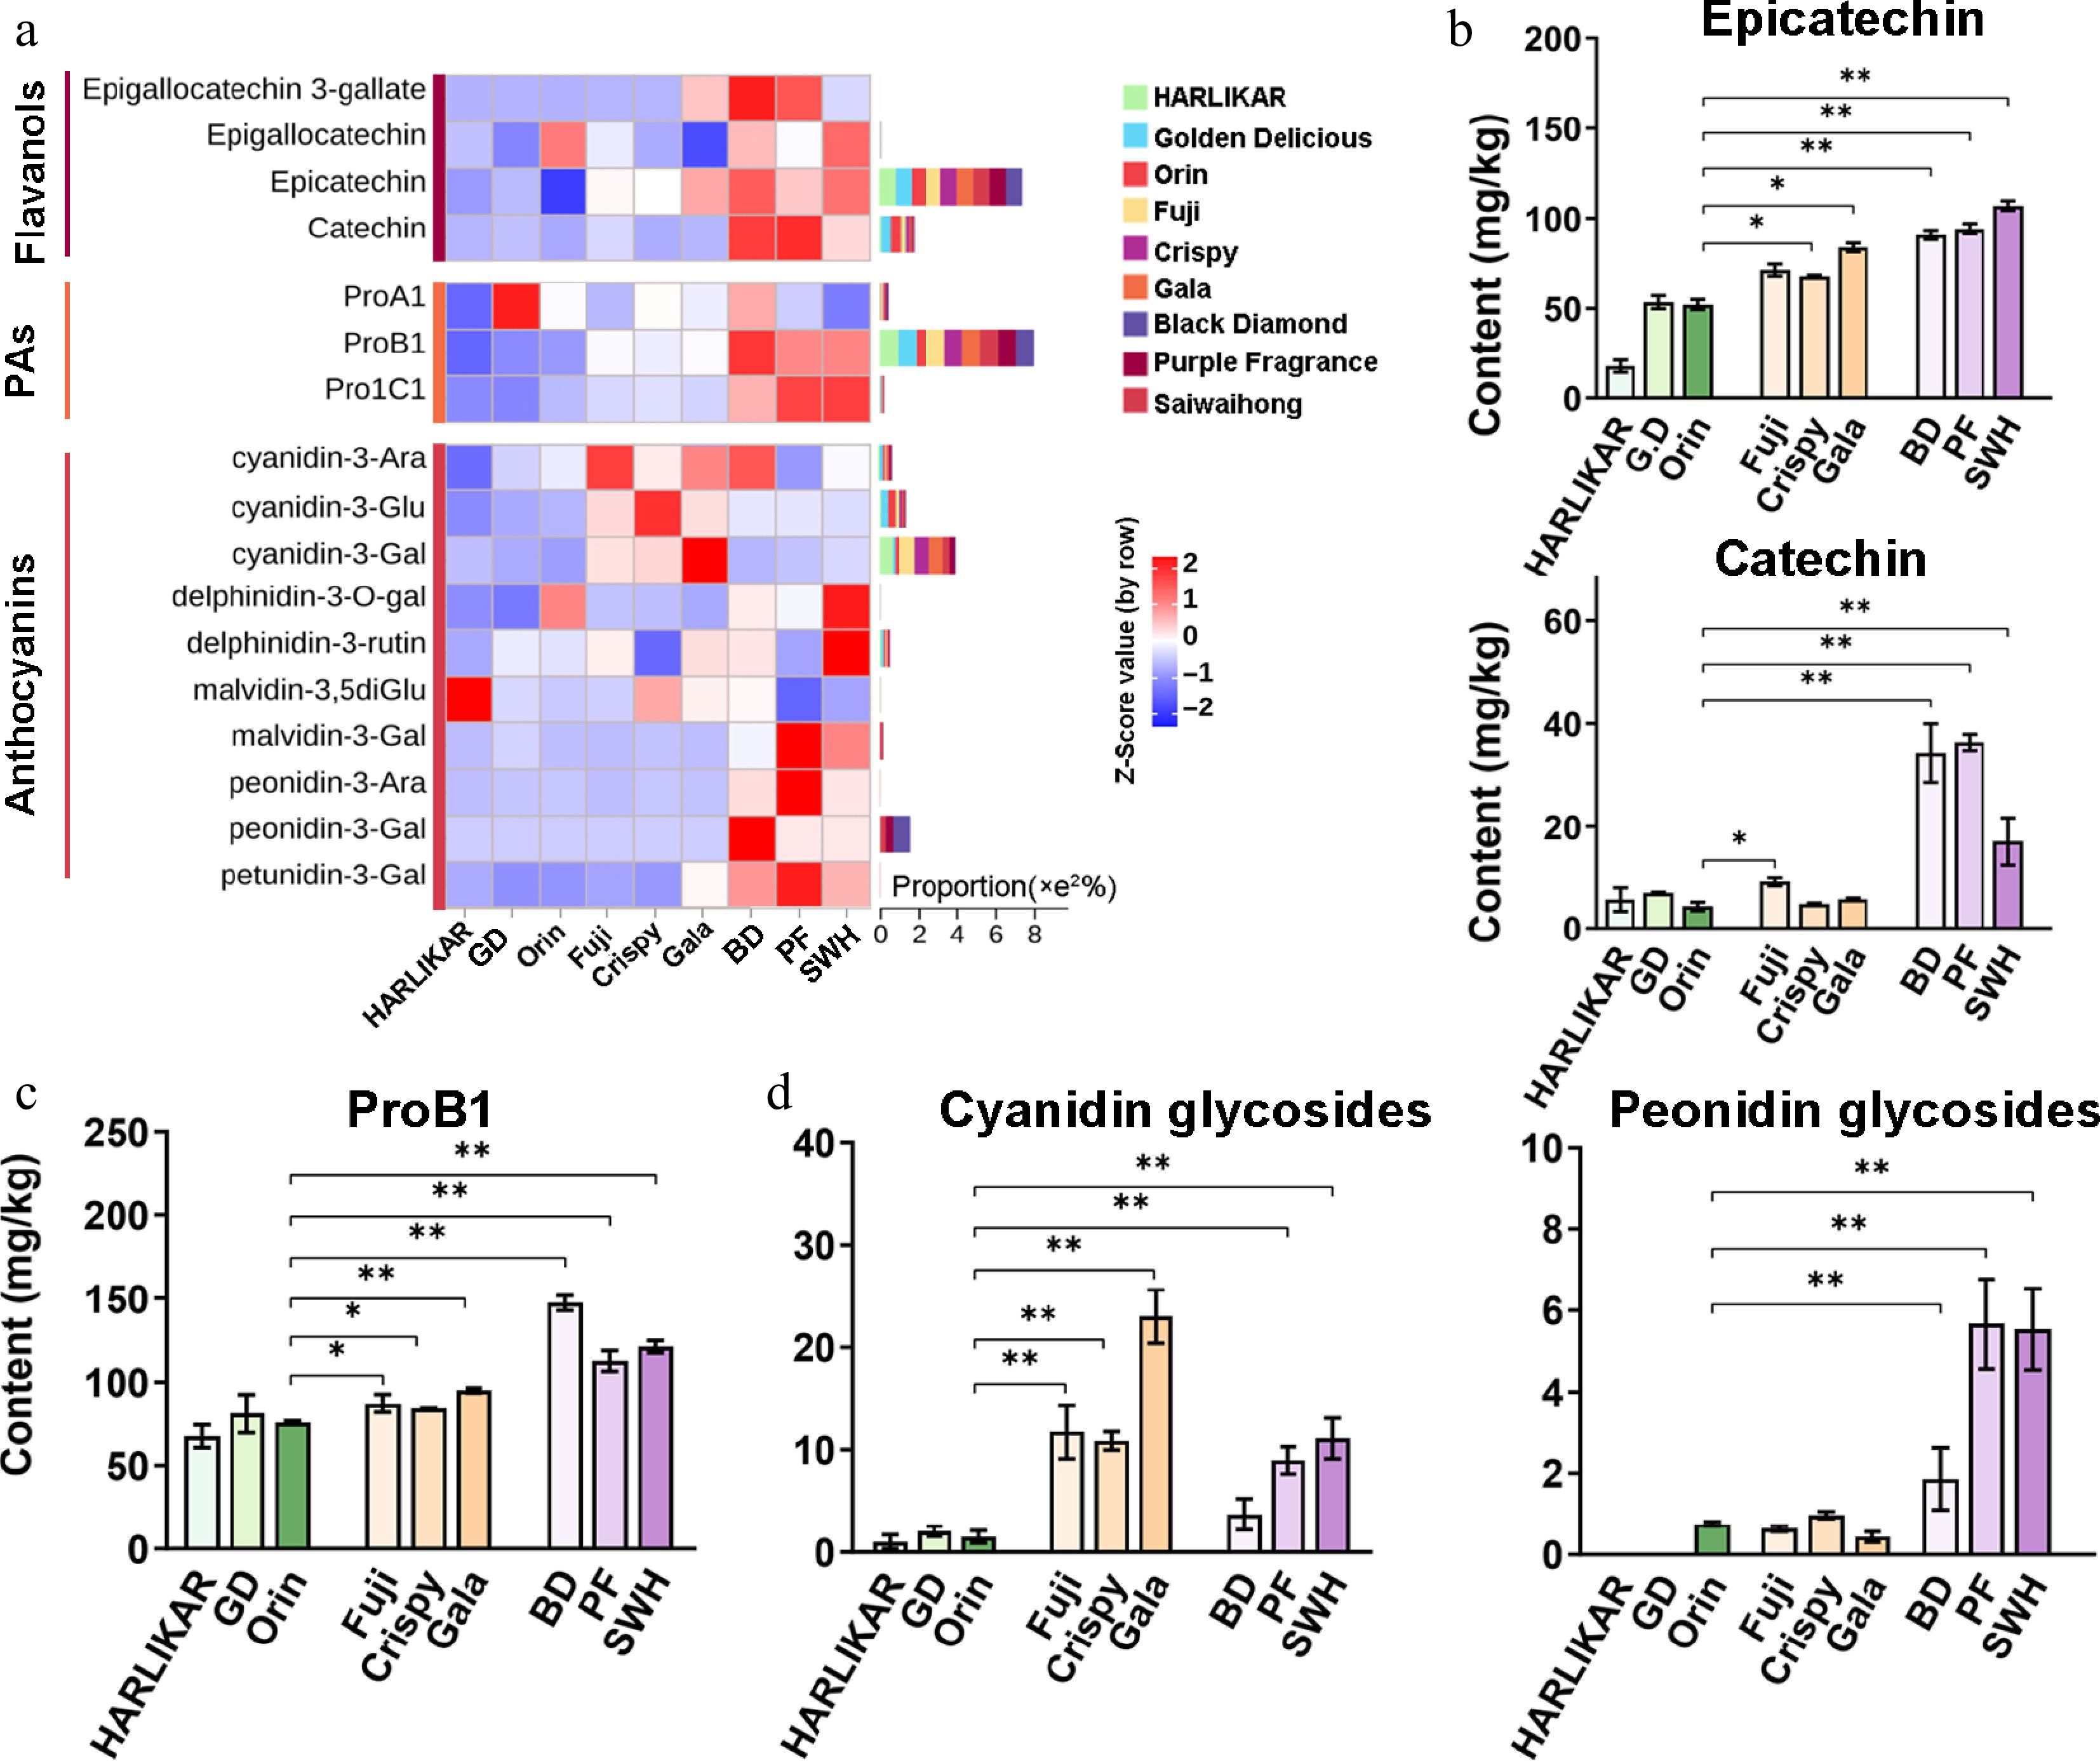
Figure 4.
Variation in the content of flavanol, proanthocyanidins (PAs), and anthocyanins among the three groups. (a) Contents of flavanol, PAs, and anthocyanins. Flavanols and PAs were measured by LC-Orbitrap MS/MS while anthocyanins were measured by QQQ MS/MS. Color scales from red to blue represent values from high to low. Bars to the left of the heatmap represent the total proportion of each compound in each subclass. (b) Contents of epicatechin and catechin from the flavanol subclass. (c) Contents of PoB1 from the PA subclass. (d) Contents of cyanidin and peonidin glycosides from the anthocyanin subclass. Data are the means ± SD of three biological replicates. Student's t-test p-values were calculated between 'Orin' and other cultivars. * and ** indicate Student's t-test p-values lower than 0.05 and 0.01, respectively (n = 3).
Then, 11 different anthocyanins were quantified by the MRM method (Supplementary Table S1). It has been reported that the red pigmentation of apple peel is associated with the presence of cyanidin glycosides, especially cyanidin-3-O-galactoside[35]. Consistent with these reports, we observed the highest cyanidin glycoside content in the Red group (17.97 mg/kg) instead of the Dark group (11.09 mg/kg), whose peel color is purplish instead of dark red. In the Pale group with a green or light yellow color, cyanidin glycosides were almost undetectable (Fig. 4d). Generally, peonidin derivatives are present at very low concentrations in most apple cultivars[36]. However, in the three groups, peonidin-3-O-galactoside and peonidin-3-O-glucoside were only observed in the Dark group and not in the other two groups (Fig. 4d).
Contents of lipids, hormones, and other metabolites
-
The Lipid Maps Structure Database (LMSD) is a comprehensive and standardized database system for identifying lipida from MS fragments[37]. Here, by using the LMSD integrated in the Compound Discover software, we identified 12 fatty acids and multiple glycerolipids (Supplementary Table S1). Linolenic fatty acid (18: 3 FA) was a dominant fatty acid and accounted for an average of 46.46% of the total fatty acids in each cultivar. The content of 18: 3 FA followed a descending order in the Dark group, Red group, and Pale group, and the former two had 76.17% and 18.35% higher 18: 3 FA contents on average than the Pale group. Similarly, the Dark group also exhibited the highest accumulation of linoleic fatty acid (18: 2 FA) and oleic acid (18: 1 FA), but there was no evident difference in these two FAs between the Red group and Pale group (Fig. 5a). Five hormones and their derivatives were detected (Fig. 5b). JA is generated from the β-oxidation of 18: 3 and 18: 2 FA in plants. Consistent with the differences in 18: 3 FA among the three groups, the JA levels in all cultivars from the Dark group were 39.75-, 35.29- and 26.56-fold higher, and those in 'Fuji' and 'Crispy' from the Red group were 2.09- and 8.62-fold higher than the average level in the Pale group, respectively. A similar trend was observed for MeJA, which was highly accumulated in all three cultivars from the Dark group and 'Fuji' and 'Crispy ' from the Red group compared with that in the Pale group. 'Gala' in the Red group seemed to be an exception, as it showed no evident difference in both JA and methyl jasmonate (MeJA) from the Pale group. The contents of other three hormones showed no obvious pattern among the three groups. Additionally, 13 phenolic acids and derivatives were observed (Supplementary Table S1), including a high abundance of chlorogenic acid in apple[38]. No obvious differences were observed for chlorogenic acid among the three groups.
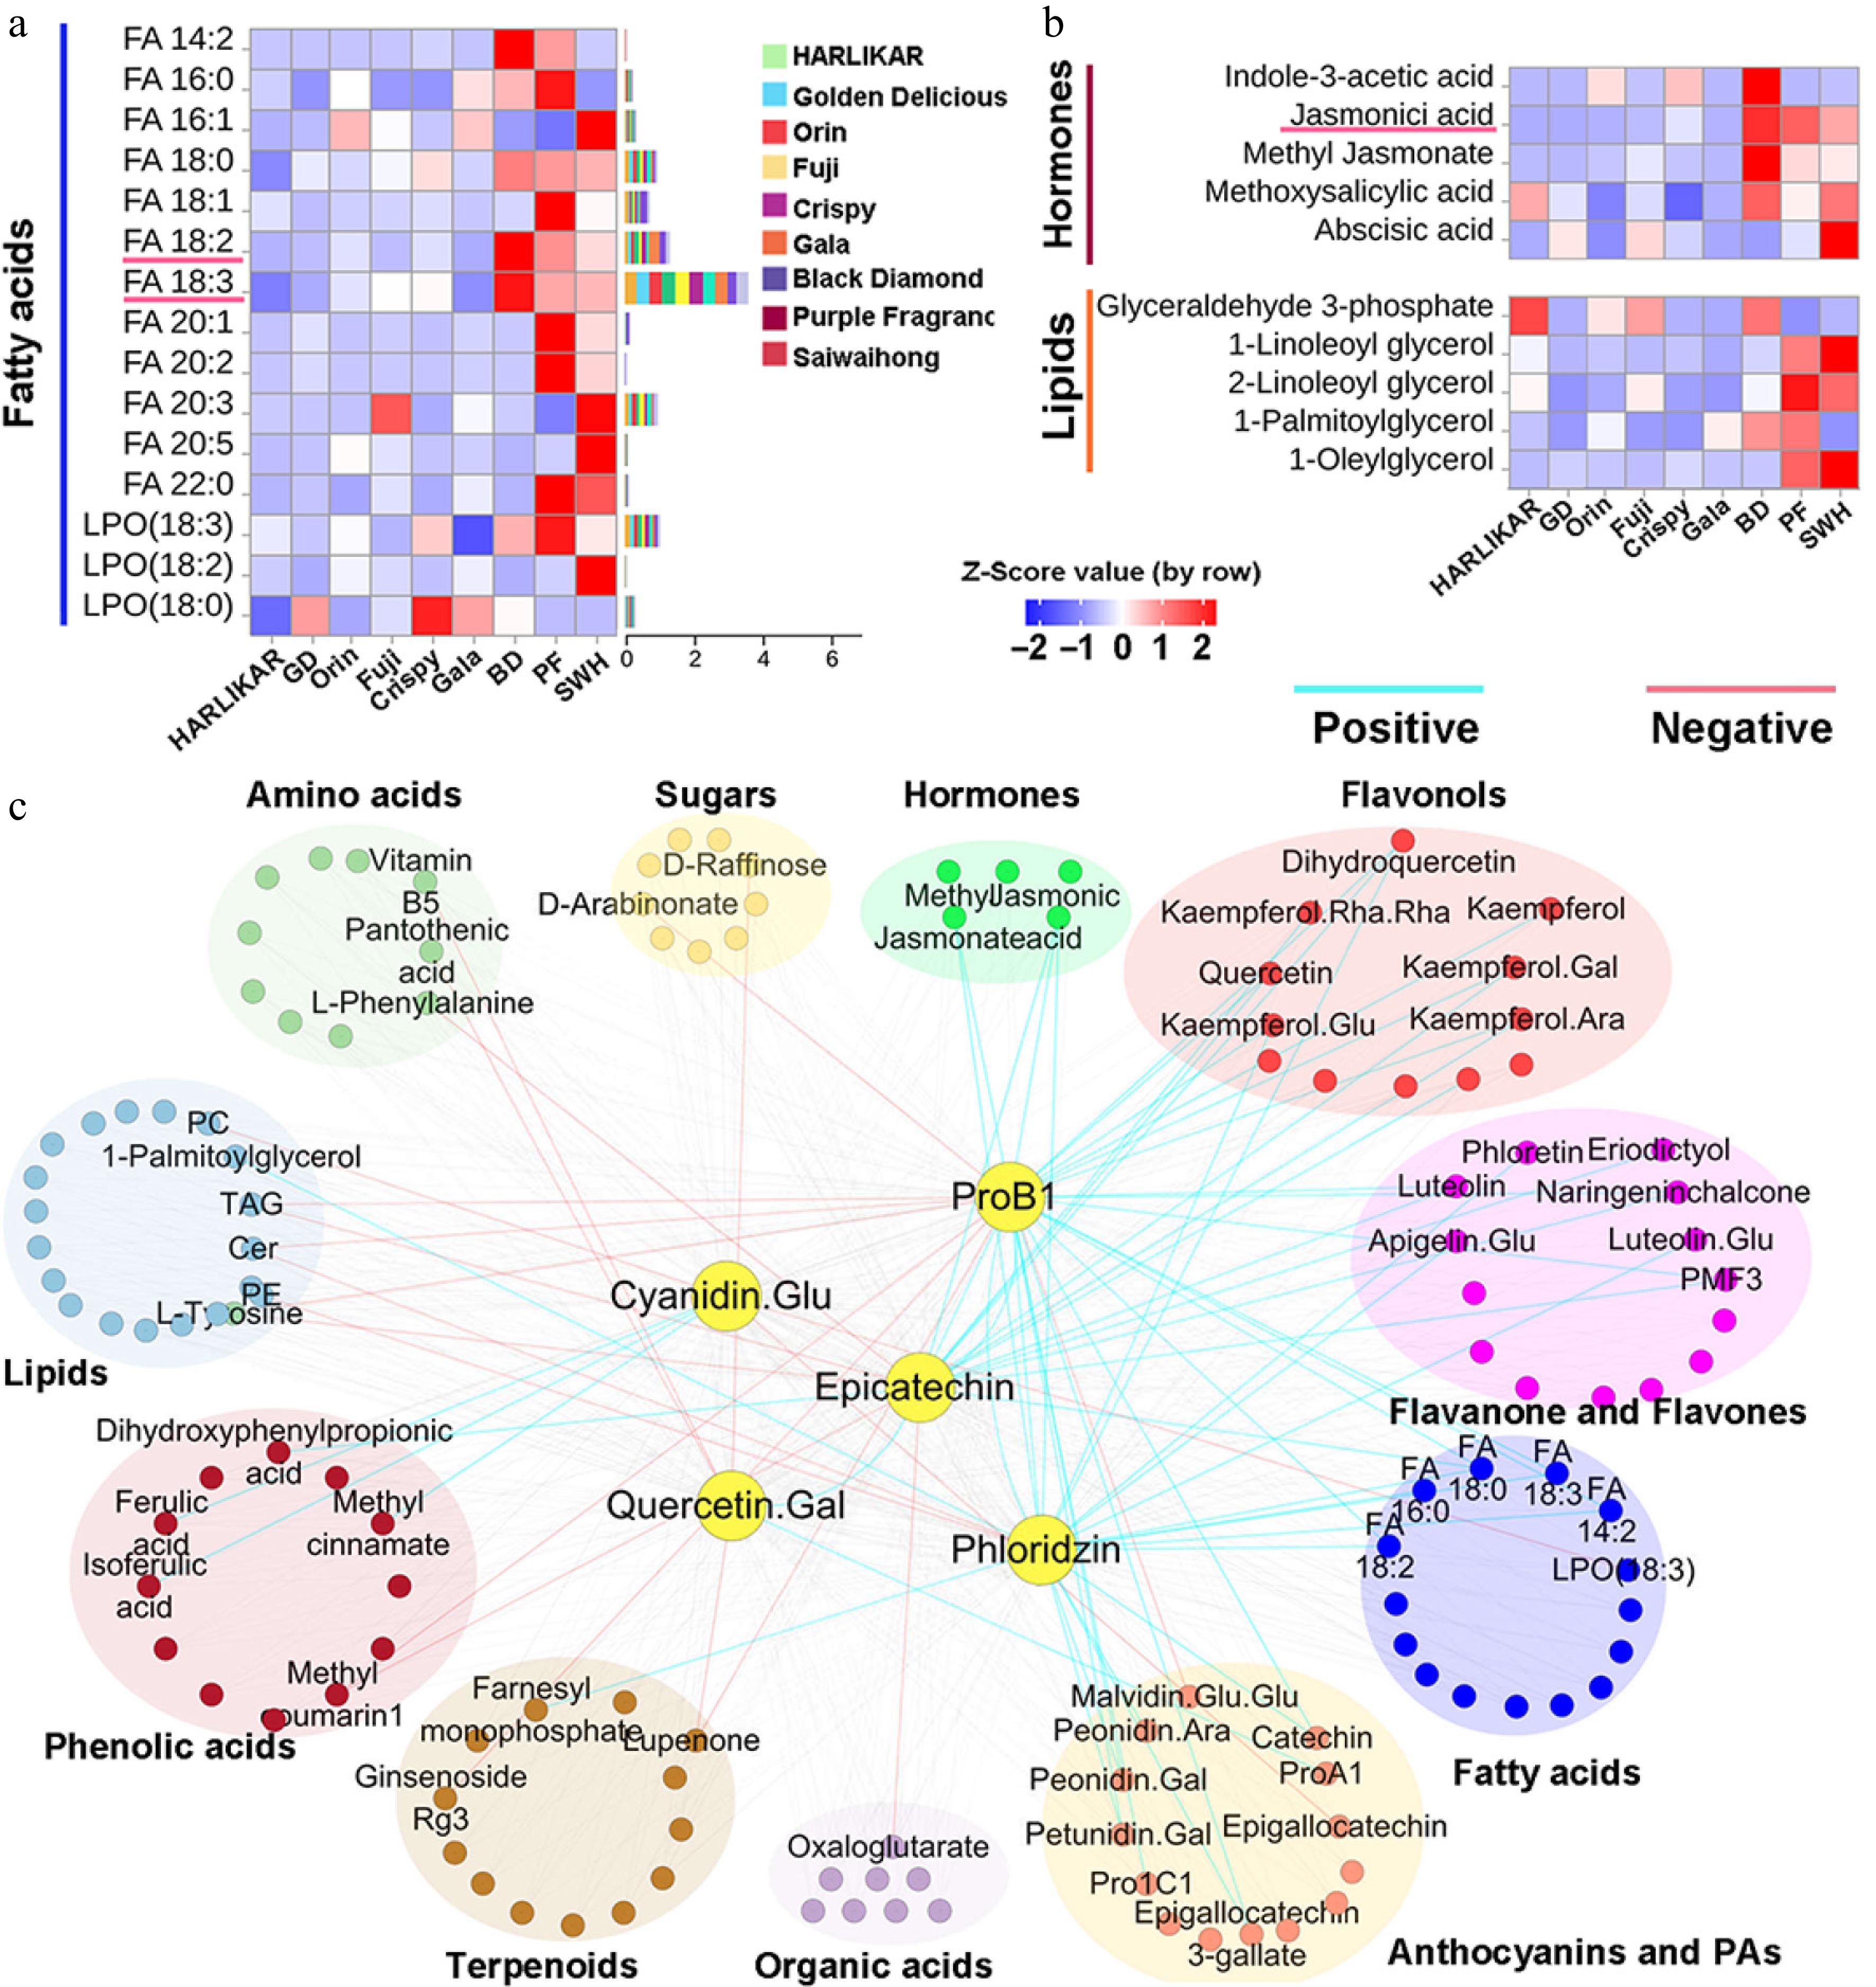
Figure 5.
Content variation of other metabolites and their correlation with major flavonoids. (a) and (b) Contents of fatty acids, hormones, and lipids measured by LC-Orbitrap-MS/MS. Color scales from red to blue represent values from high to low. Bars to the left of the heat map represent the total proportion of each compound in each subclass. (c) Correlation network of major flavonoid components and other metabolites. The correlation matrix was calculated using Pearson's correlation algorithm. The nodes represent metabolites and the edges represent the correlations between metabolites and the five flavonoids with a Pearson correlation coefficient above an absolute threshold of 0.7 and p ≤ 0.05. The edge colors represent positive (light blue) and negative (red) correlation coefficients between the pairs of metabolites.
Pearson correlation coefficients were calculated between the most abundant flavonoids from each subclass and other metabolites. The correlation results are presented as an association network to demonstrate the inter-relationships. Within the network, metabolites' names are presented when they show either significantly (correlation coefficient ≥ 0.7) positive correlations (indicated in blue lines) or significantly negative correlations (indicated in red lines) with other metabolites (Fig. 5c). In addition to the flavonoid components, the two JAs and 18: 3 and 18: 2 FA showed positive correlations with epicatechin, ProB1, and phloridzin.
Expression of genes in the flavonoid and β-oxidation metabolic pathways
-
Representative samples were selected from the three groups for RNA-Seq, including 'SWH' and 'BD' from the Dark group, 'Fuji' from the Red group, and 'Orin' from the Pale group (Supplementary Table S3). Similar to the results of the metabolic analysis, these samples were also clustered by groups via principal component analysis (PCA) (Fig. 6a). In total, 3,910, 1,650, and 2,719 upregulated DEGs and 2,269, 1,905, and 1,463 downregulated DEGs were screened for 'SWH', 'BD', and 'Fuji' relative to 'Orin', respectively (Fig. 6b). The consistently high accumulation of flavonoids in the Dark group and Red group indicated consistent up- or downregulation of flavonoid-related genes in these two groups (Fig. 2a). There were 648 overlapping upregulated and 418 overlapping down-regulated DEGs (Fig. 6c). KEGG pathway analysis of the 648 overlapping upregulated genes revealed significant enrichment of the 'flavonoid biosynthesis' and fatty acid-related metabolic pathways, such as 'alpha-linolenic acid metabolism' (Pathway 1) and 'fatty acid degradation' (Pathway 2) (Fig. 6c), while the 418 overlapping downregulated DEGs were enriched in 'phenylpropanoid biosynthesis' and two other fatty acid-related metabolic pathways, namely 'fatty acid elongation' (Pathway 3) and 'cuin, suberine, and wax biosynthesis' (Pathway 4) (Fig. 6d). Pathways 1 and 2 transform 18-carbon fatty acids into JA and malonyl-CoA, whereas Pathways 3 and 4 elongate 18-carbon fatty acids into very long-chain fatty acids and then into cuticular lipids[39]. Therefore, more 18-carbon fatty acid might be directed into Pathways 1 and 2 in 'SWH', 'BD', and 'Fuji' compared with 'Orin'. The different distribution of 18-carbon fatty acids among these four pathways might account for the different contents of flavonoids in different apple cultivars. In order to validate the RNA-seq results, RT-qPCR was carried out on six differentially expressed flavonoid-related genes. The r2 values calculated from the RT-qPCR and transcriptional FPKM values for these six genes were 0.82, 0.98, 0.98, 0.92, 0.70, and 0.92, respectively (Supplementary Fig. S1). Thus the reliability of our RNA-seq assay was validated.
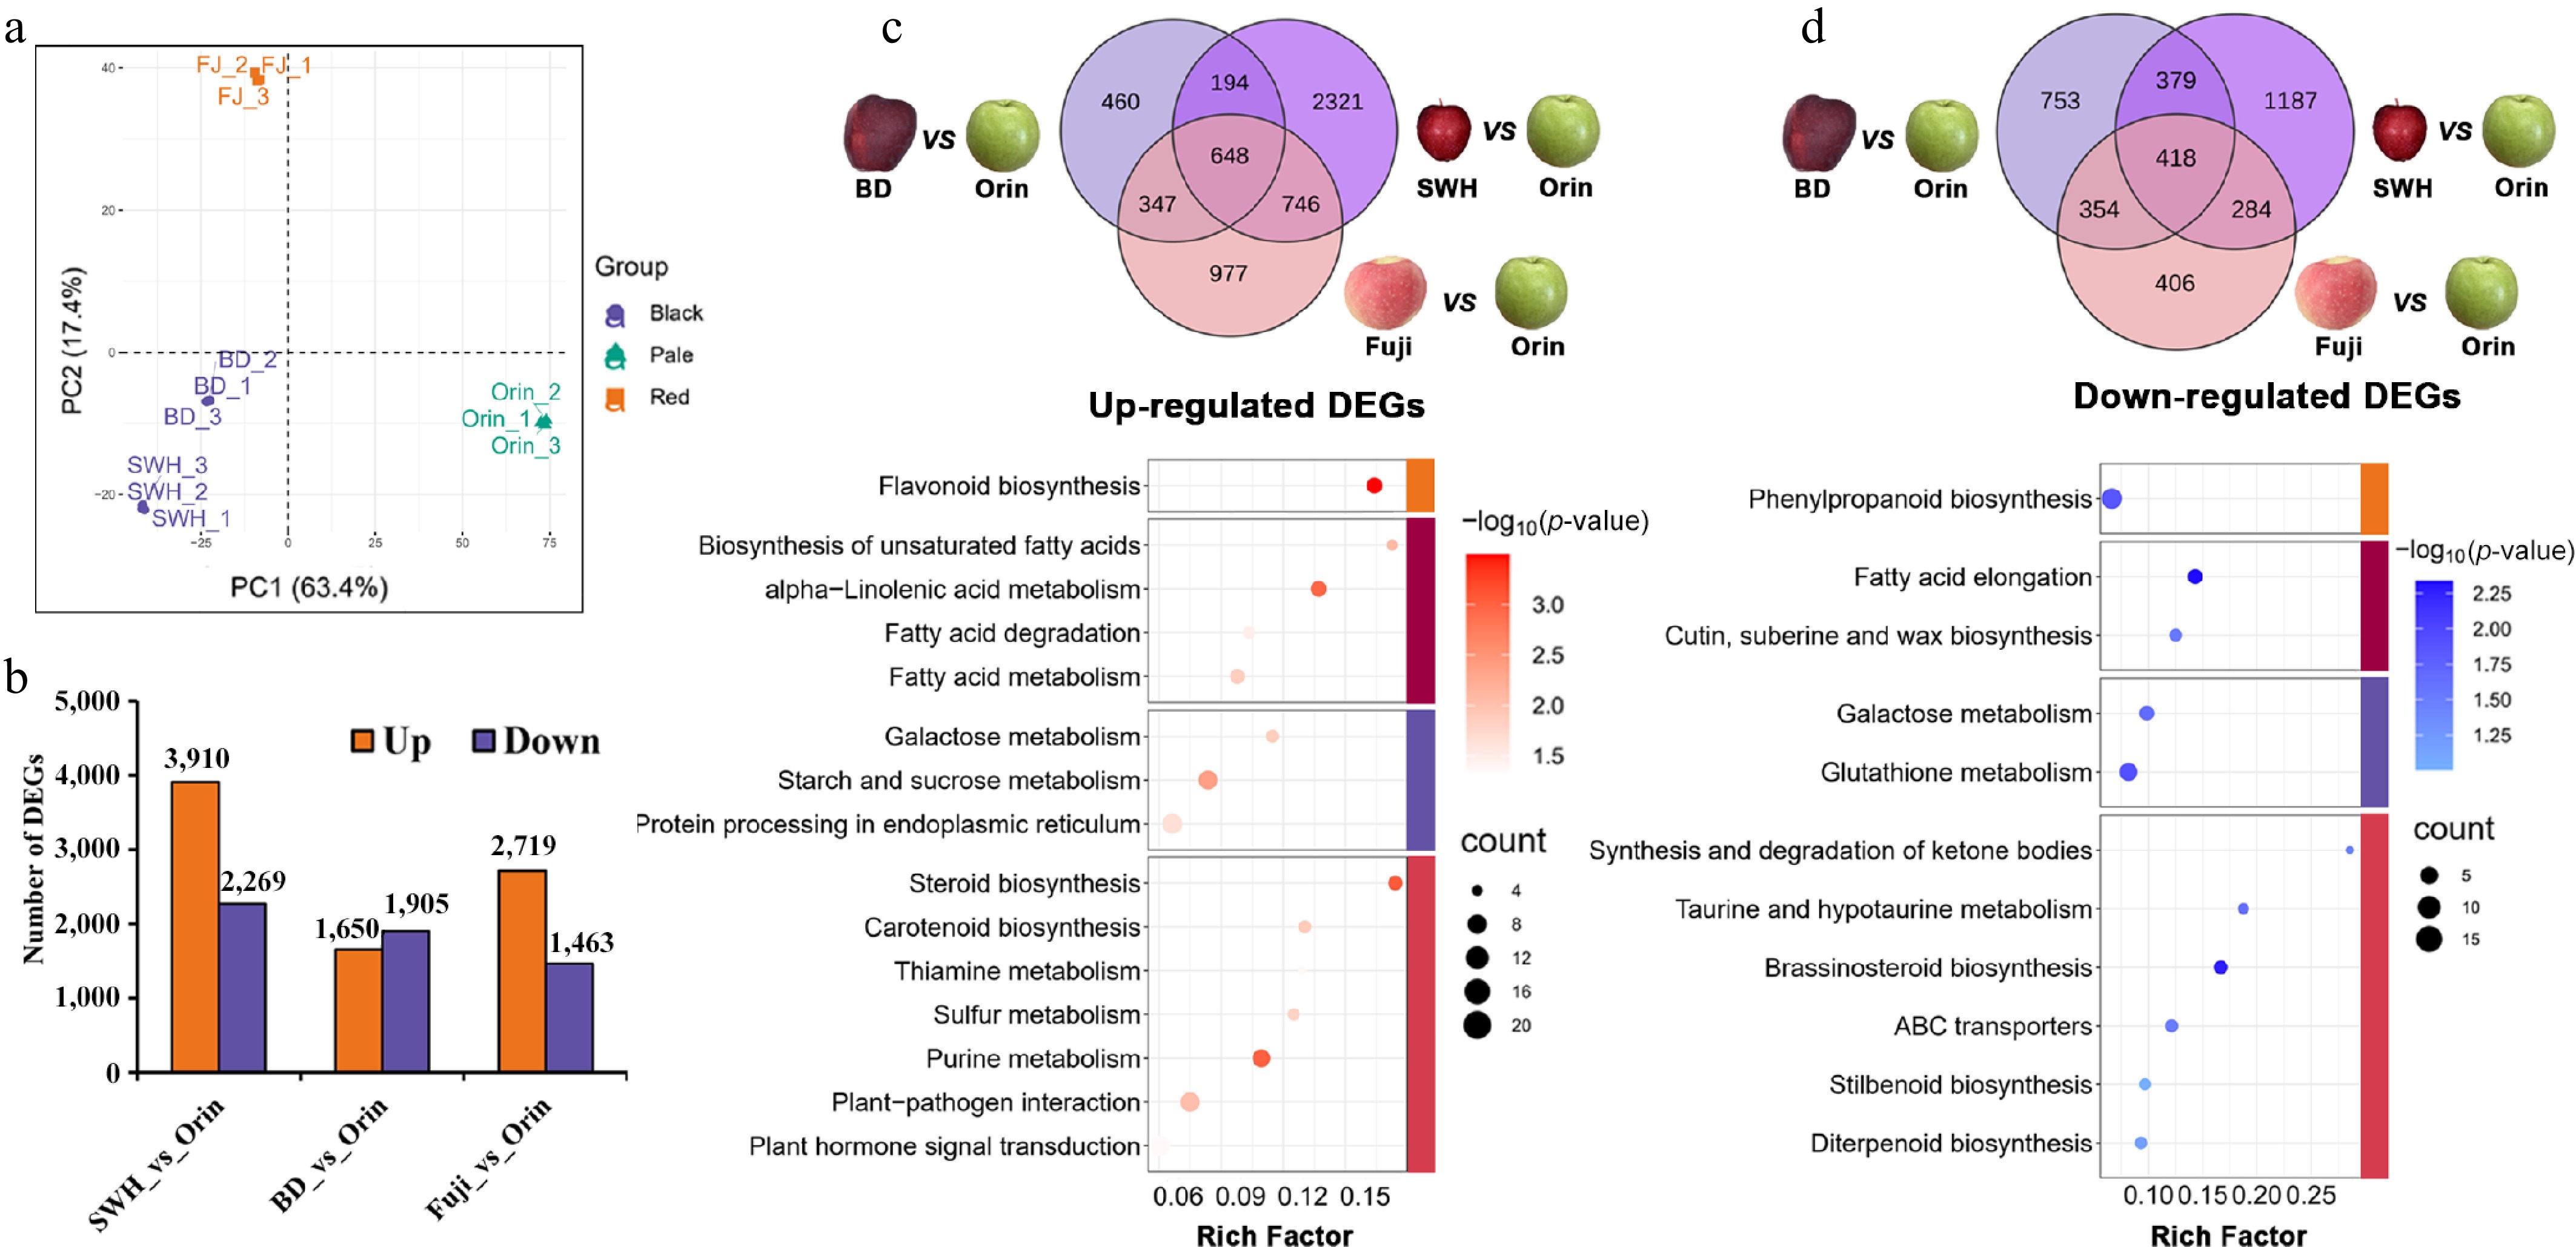
Figure 6.
DEGs among representative cultivars from the three groups. (a) PCA results of the samples used for transcriptome measurements. (b) Number of up- or downregulated genes between 'Orin' and other cultivars. (c) overlapping upregulated genes and their KEGG pathway enrichment results. (d) Overlapping downregulated genes and their KEGG pathway enrichment results.
The expression levels of genes related to flavonoids, JA, and fatty acid β-oxidation were then compared among these cultivars (Fig. 7a, b). For flavonoid backbone biosynthesis, three previously reported CHS genes, MdCHS1 (MD04G1003300), MdCHS2 (MD04G1003000), and MdCHS3 (MD04G1003400), were upregulated in 'Fuji', 'BD', and 'SWH' compared with 'Orin'[40]. Consistent with the upregulation of the three CHSs, three CHIs, one flavanone-3-hydroxylase (F3H), and flavanone-3'-hydroxylase (F3'H) were also upregulated in the three cultivars. Seven of the eleven differentially expressed FLSs were upregulated in the three cultivars, which could explain the higher accumulation of flavonol glycosides in the Red group and Dark group[41]. Cyanidin is biosynthesized by the successive catalyzation of Dihydroflavonol 4-reductase (DFR) and Anthocyanidin synthase (ANS)[41]. One DFR and two of the three differentially expressed ANSs were upregulated in 'Fuji' and 'BD'. Both anthocyanidin reductase (ANR) and leucoanthocyanidin reductase (LAR) can catalyze the formation of epicatechin and proanthocyanidins (PAs)[42−44]. No ANR was simultaneously upregulated in 'Fuji', 'BD', and 'SWH', while MdLAR1 (MD16G1048500) was upregulated in all the three cultivars. In all, the expression of DEGs from the flavonoid pathway was highly consistent with the distribution of flavonoids among these cultivars. Most DEGs in the phenylpropanoid pathway were significantly downregulated in 'Fuji', 'BD', and 'SWH', including two out of three PALs, three out of four 4CLs, seven out of nine HCTs, one out of two C3'Hs, and four out of five CCRs.
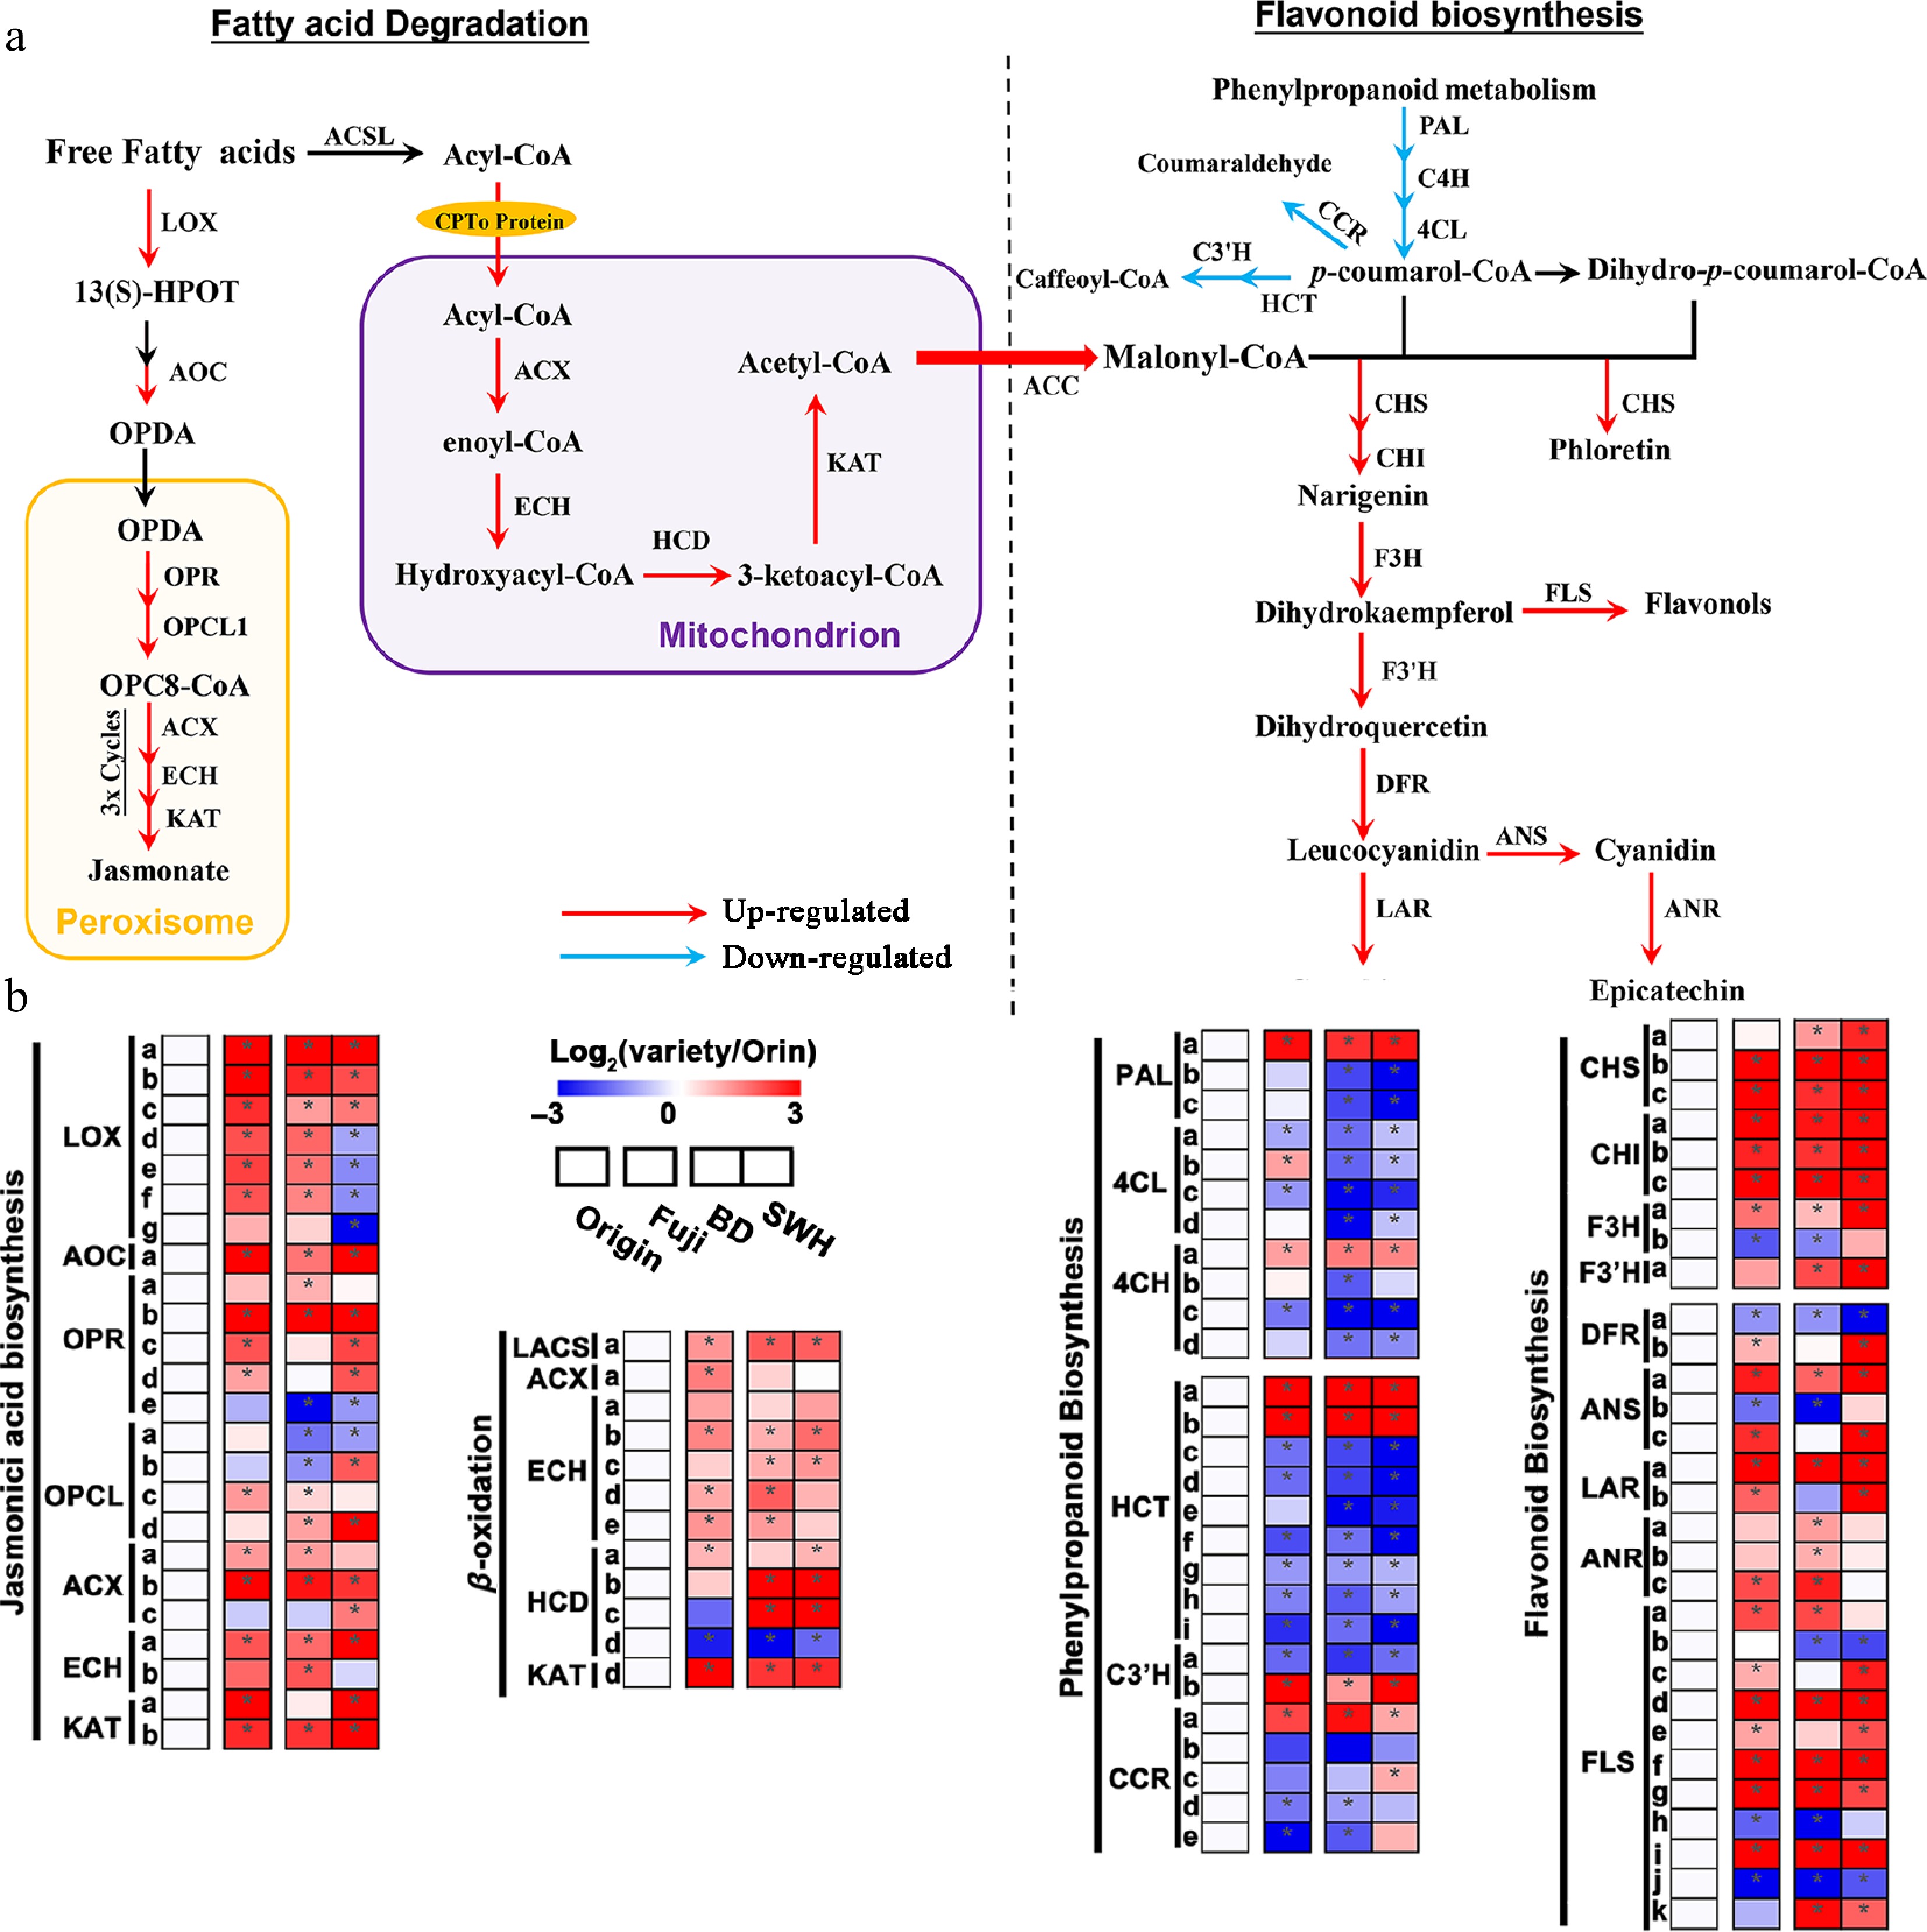
Figure 7.
Up- or down-regulated pathways in 'Fuji', 'BD' and 'SWH' compared with 'Orin'. (a) Schematic diagram revealing the up- or down-regulated genes from the JA biosynthesis, flavonoid biosynthesis and fatty acid β-oxidation pathways. Arrows in red or blue indicate up- or down-regulated genes in this step. (b) Expression of DEGs from the JA biosynthesis, flavonoid biosynthesis and fatty acid β-oxidation pathways. Values were scaled to 'Orin'.
In the β-oxidation process, we observed 1.43-, 1.88- and 2.48-fold increases in LACS (MD08G1163100) in 'Fuji', 'BD', and 'SWH' compared with 'Orin', which can activate fatty acids into fatty acyl-CoA before β-oxidation[45]. Consistent with the upregulation of LACS, two ACXs, four ECHs, and three HCDs involved in the subsequent catalyzation of fatty acid β-oxidation process were highly expressed in 'BD', 'SWH', and 'Fuji'. KAT is the core enzyme in β-oxidation, catalyzing the final step to produce acetyl-CoA to generate cytosolic malonyl-CoA[46]. Both KAT2 and KAT5 have been extensively studied. KAT2 is located in the peroxisome and has been reported to increase the biosynthesis of JA[47], while KAT5 is located in the mitochondria and is co-expressed with flavonol biosynthetic genes[5,10]. KAT2 was increased by 8.81-, 4.22-, and 4.8-fold and KAT5 by 4.76-, 4.32-, and 12.76-fold in 'Fuji', 'BD', and 'SWH' compared with 'Orin', respectively (Fig. 7b). The up-regulation of KAT2 and KAT5 suggests that β-oxidation in both the peroxisome and mitochondria was activated in these three colored cultivars relative to the pale-colored 'Orin' (Fig. 7b). JA is one of the end-products of the β-oxidation cycle in peroxisomal tissues. Consistent with the increase in JA in the Dark group and Red group at metabolic level, several vital enzymes in the initiation of JA biosynthesis were also upregulated in the three cultivars, including three 13-lipoxygenases (LOXs), one allene oxide cyclase (AOC), and one 12-oxophytodienoate reductase (OPR). Therefore, the elevated levels of JAs were also confirmed at the transcriptomic level.
Inhibition of β-oxidation by etomoxir in apple
-
To verify the effect of fatty acid β-oxidation on flavonoid biosynthesis in apple, we harvested 'Fuji' apple fruit at the coloring stage and treated them with 0 (control, CT), 100, and 200 μM etomoxir. After seven days of lighting, coloration was evidently inhibited in the two treatment groups compared with that of the CT group in a dose-dependent manner (Fig. 8a, b). The total flavonoid content was 0.49 mg CAE/g in the CT group, which was significantly (t-test p-value ≤ 0.05) higher than that under the 100 (0.43 mg CAE/g) and 200 μM (0.35 mg CAE/g) treatment groups. Variations in the total flavonoids in the CT, 100, and 200 μM groups were consistent with the change in the 'a' value (Fig. 8b, c). Epicatechin and phloridzin showed positive correlations with 18-carbon unsaturated fatty acids (Fig. 8c). Epicatechin decreased by 15.01% and 25.53% and phloridzin decreased by 34.28% and 31.30% in the 100 and 200 μM group compared with those of the CT, respectively (Fig. 8d). Cyanidin galactose is the major component in redness and decreased by 70.65% and 79.89% in the 100 and 200 μM groups, respectively. Similar decreases in quercetin galactose were also observed in the two treated groups. ProB1 showed no obvious change in the 100 μM group but decreased by 42.15% in the 200 μM group compared with the CT group.
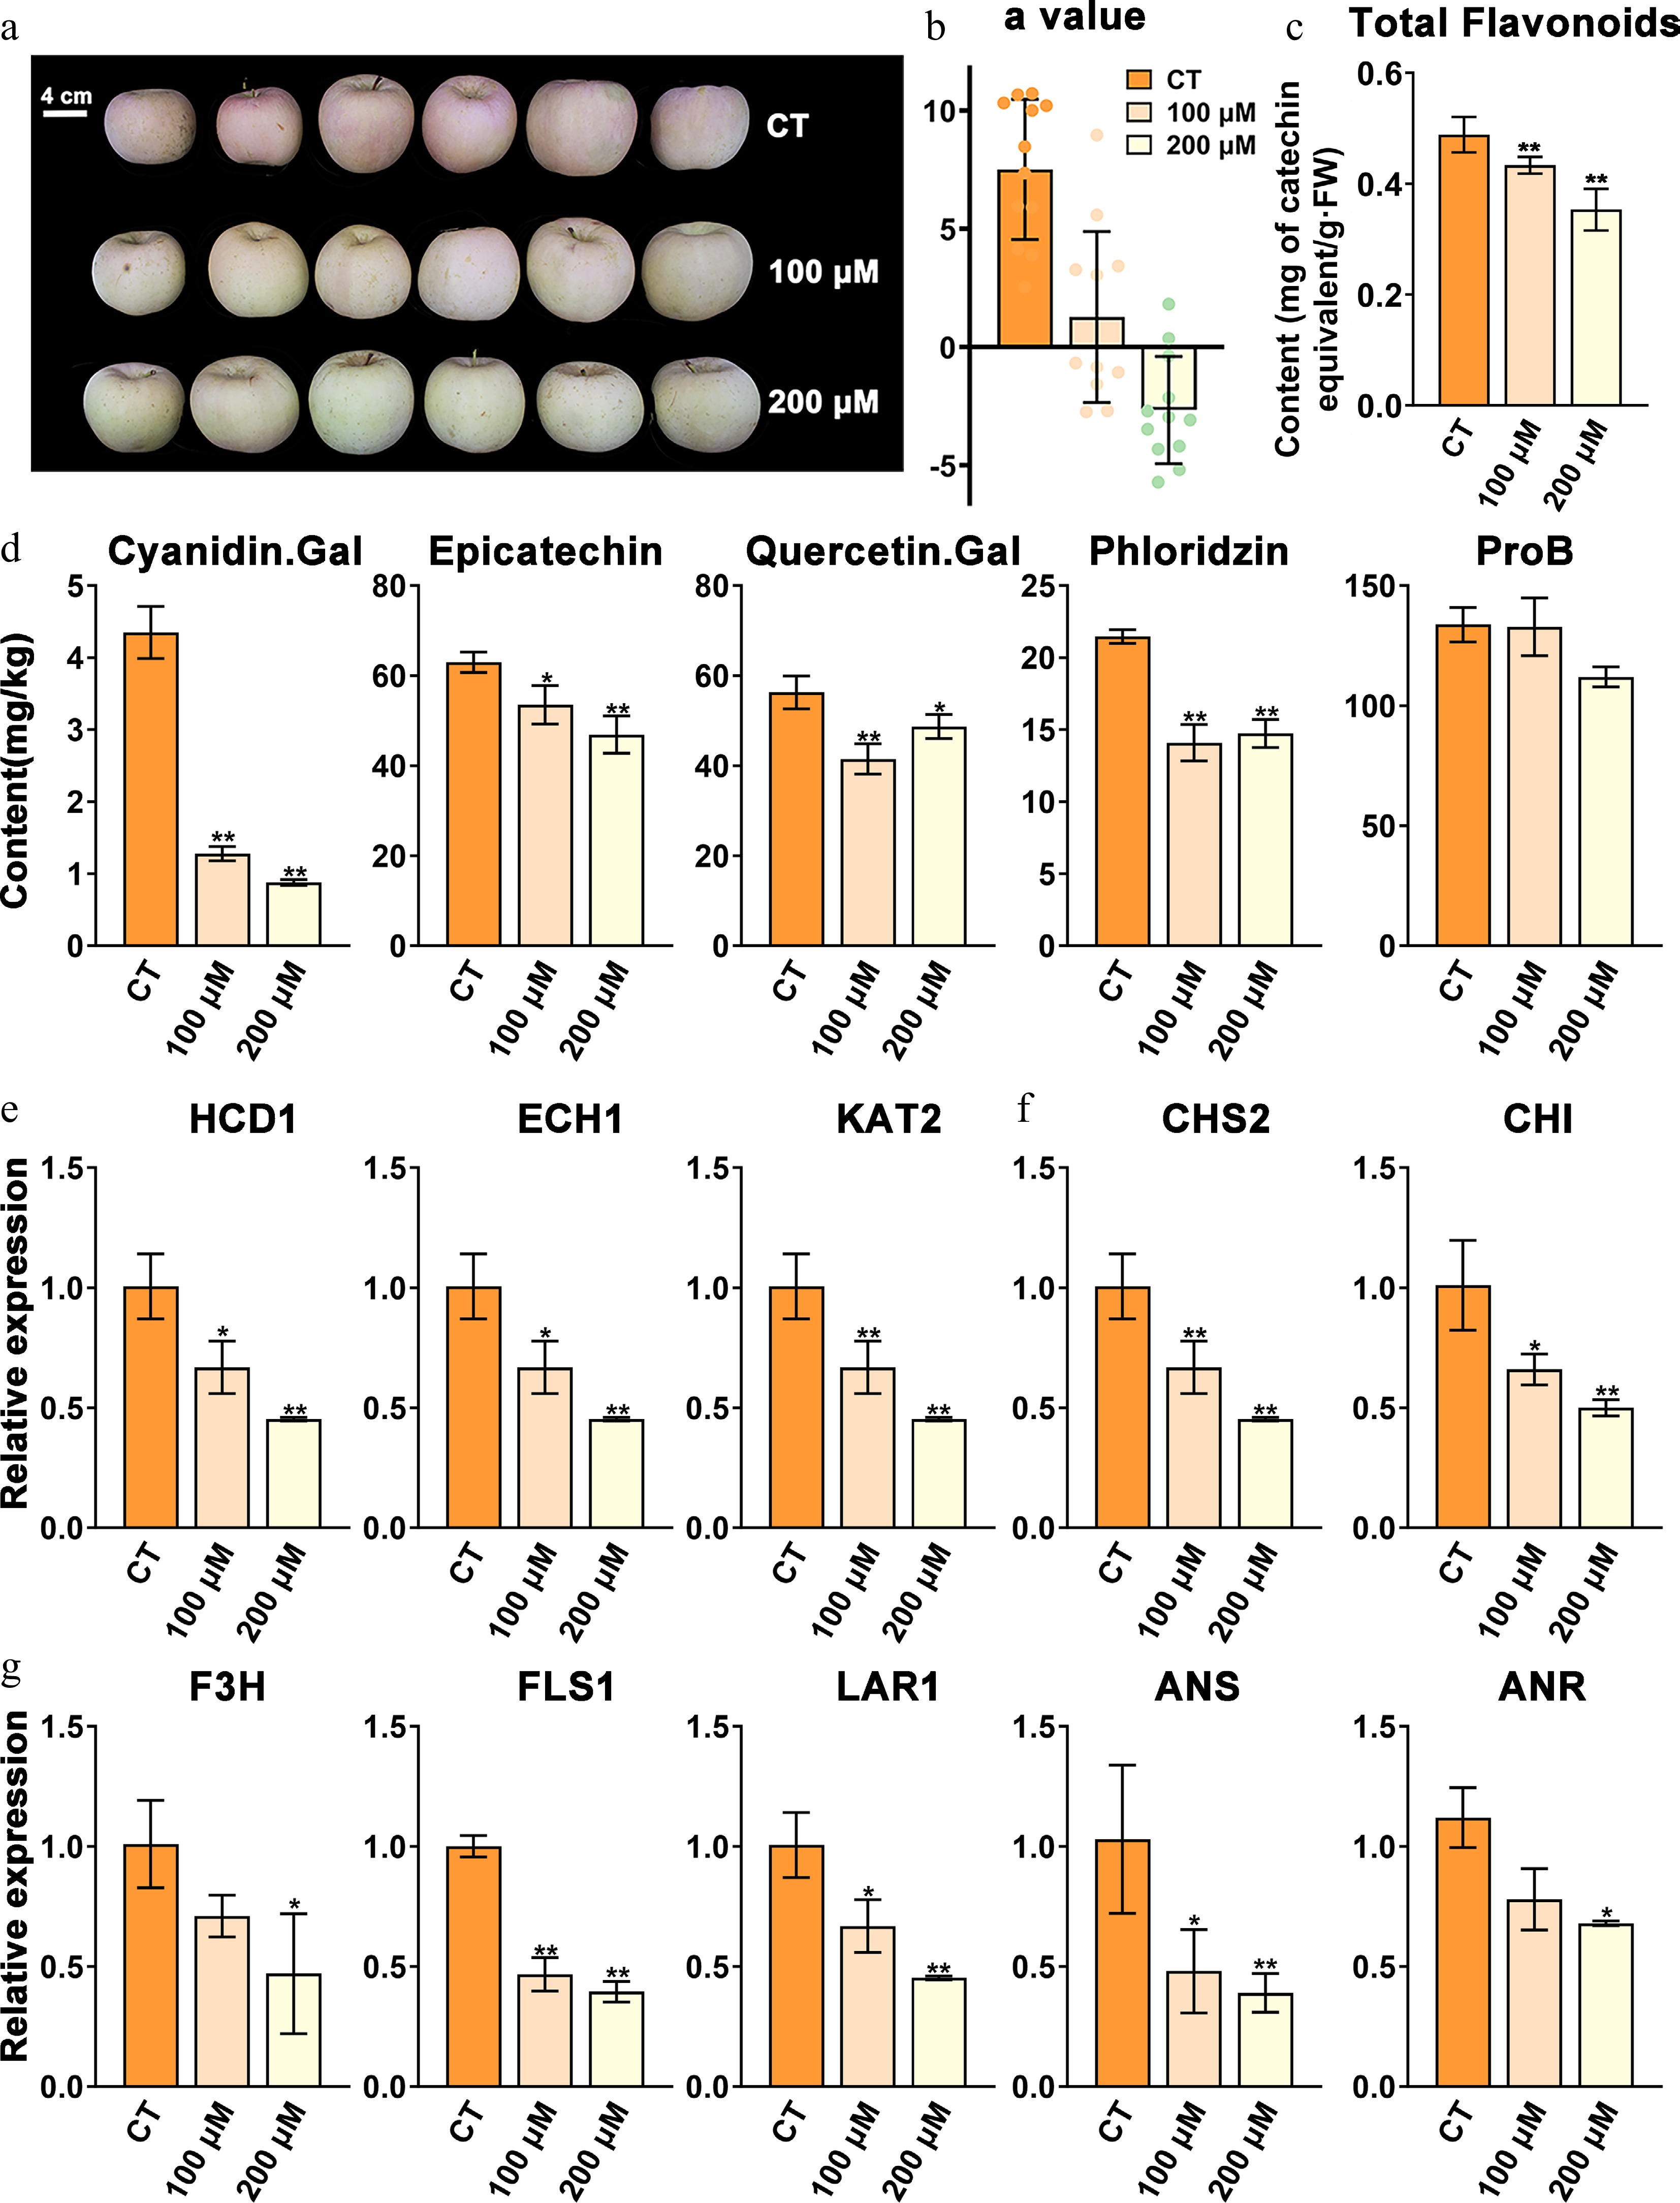
Figure 8.
Phenotypes of etomoxir-treated apples in the coloring stage and the control. (a) Phenotypes of apples treated with 100 and 200 μM etomoxir and the relative control (CT). (b) The colorimeter 'a' value of the two treated groups and the CT. (c) Total flavonoid contents of etomoxir-treated groups and the CT. (d) Contents of major flavonoid components of etomoxir-treated fruit and the CT. (e) Relative expression of key β-oxidation genes of etomoxir-treated fruit and the CT. (f) and (g) Relative expression of key flavonoid-related genes of etomoxir-treated fruit and the CT. Data are the means ± SD of three biological replicates. Student's t-test p-values were calculated between the CT and two treated groups. * and ** indicate Student's t-test p-values lower than 0.05 and 0.01, respectively (n = 3).
Three key β-oxidation related genes, which were upregulated in the Dark group and Red group compared with the Pale group, were selected for RT-qPCR validation (Supplementary Table S4). Among them, MdHCD1, MdECH1, and MdKAT2 significantly decreased by 33.52%, 44.70%, and 53.15% in the 100 μM group and 55.06%, 61.70%, and 51.60% in the 200 μM group, respectively (Fig. 8e). Seven key flavonoid-related genes, which were identified in previous studies[48,49] and upregulated in the Dark group and Red group compared with the Pale group (Supplementary Table S4), were selected for RT-qPCR validation. The expression of MdCHS2, the rate-limiting gene of β-oxidation, decreased by 81.15% and 86.40% in the 100 μM group and 200 μM groups, respectively (Fig. 8f). The other six genes, including CHI, F3H, FLS, LAR, ANR, and ANS, were also downregulated in a dose-dependent manner in the two treated groups compared with those in the CT (Fig. 8f, g). Therefore, our results demonstrated a clear decrease in flavonoid content at the metabolic and transcriptomic levels after inhibition of β-oxidation by different concentrations of etomoxir.
-
It has been reported that dark-skinned apples generally synthesize more flavonoids than pale-skinned apples[50], which is consistent with the sequence of flavonoid content in the Dark group, Red group, and Pale group. Flavanones are essential intermediates in the flavonoid biosynthetic pathway and can be further catalyzed to form the backbone of flavones and flavonols. The contents of the major flavanone (phloridzin) and two major flavones (apigenin-O-glucoside and luteolin-O-glucoside) followed a decreasing order of Dark group > Red group > Pale group (Fig. 3b), which was confirmed by the upregulation of key flavonoid genes in the activation of flavonoid biosynthesis, such as CHS, CHI, and F3H (Fig. 3b). However, the increase in flavanone did not contribute to the biosynthesis of flavonols, as the most abundant quercetin glycosides of the flavonol subclass exhibited no evident difference among these three groups (Fig. 3c). Similar results were also observed by previous studies, showing that 'GD' in the Pale group in this study had a higher content of quercetin-3-O-galactoside than 'Gala' and 'Fuji' in the Red group[51,52]. In most apple cultivars, flavan-3-ols usually account for the highest proportion (36.4%–65.2%) of total flavonoids and are involved in the formation of anthocyanins[31]. The contents of most of these abundant flavan-3-ols, such as epicatechin and procyanidins, followed the order of Dark group > Red group > Pale group (Fig. 4b, c; Supplementary Table S2), which could well explain the variation in total flavonoid content in these cultivars (Fig. 2a). For anthocyanins, the dominant cyanidin glycosides were observed in the Red group instead of the Dark group, whose peel color is purplish instead of dark red. However, we observed the highest peonidin glycoside content in the Dark group (Fig. 4d). Peonidin was reported to lead to blue-purple coloring and exists in large amounts in purple sweet potato[53], which is consistent with the pigmentation observed for the purplish color in the Dark group. As a result, different contents of major flavanone-flavones (phloridzin, apigenin-O-glucoside, luteolin-O-glucoside), major flavan-3-ols (epicatechin and procyanidins), and peonidin glycosides might mainly account for the gradient changes in color among the Dark group, Red group, and Pale group.
Phenylpropanoid biosynthetic pathway provides the p-coumaric acid precursor for flavonoid biosynthesis. However, we did not observe obvious differences in these 13 phenolic acids among these three groups. Additionally, expression levels of key genes related to the phenylpropanoid biosynthetic pathway were downregulated in cultivars from the Dark group and Red group compared with cultivars from the Pale group. Similar results were observed in a previous report that there was no apparent correlation between phenylpropanoids (phenolic acid substances) and flavonoids among different apple cultivars[54]. Therefore, the differences in flavonoid content among the Dark group, Red group, and Pale group might not be mainly determined by the phenylpropanoid pathway.
Overall, our metabolomic and transcriptomic data provide a comprehensive picture of how flavonoid subclasses are distributed and identify the major differential flavonoids throughout representative apple cultivars with different flavonoids by comparative analysis.
Flavonoid biosynthesis might be affected by the fatty acid β-oxidation process in apple
-
The contents of 18: 3 FA and 18: 2 FA were differentially accumulated among the three groups and showed positive correlations with differential flavonoids, such as epicatechin, ProB1, and phloridzin (Fig. 5). The positive correlation between 18: 3 FA and 18: 2 FA and these flavonoids might be attributed to the β-oxidation process, through which 18: 3 FA and 18: 2 FA could be transformed into malonyl-CoA to support flavonoid biosynthesis. At the transcriptomic level, we observed upregulation of key genes involved in the β-oxidation process in the colored cultivars relative to the pale-colored 'Orin', such as LACS, ACX, ECH, and KAT (Fig. 7b). Importantly, after treatment with different concentrations of etomoxir, downregulation of fatty acid oxidation gene expression accompanied inhibition of fruit color conversion. Moreover, the contents of major flavonoids, such as epicatechin, and phloridzin, as well as the expression levels of key flavonoid-related genes, decreased in a dose-dependent manner compared with those of the CT (Fig. 8). The positive effect of β-oxidation on flavonoid biosynthesis has also been indicated in Arabidopsis, where flavonoid components greatly decreased in kat5-1 mutants[5,10]. Therefore, the elevated levels of flavonoids in the Dark group and Red group can at least be partially ascribed to the activation of fatty acid β-oxidation.
It has been reported that the activation of fatty acid β-oxidation could increase the content of JAs[9], which could be reflected by both high contents of JAs and expression levels of key JA-related genes in the two colored groups compared with the Pale group (Figs 5b & 7b). The positive effects of JAs and major flavonoids in apple have been extensively reported in previous research, which showed that exogenous JA treatment could significantly promote the levels of flavonoids and accelerate apple fruit coloring[55,56]. In this study, JA and MeJA were also observed to have positive correlations with several major flavonoids (Fig. 5c). Hence, the increase in flavonoids in colored cultivars might also be achieved following the '18: 3 FA and 18: 2 FA→β-oxidation→JAs' metabolic route.
In summary, our data revealed an important role of fatty acid β-oxidation in promoting flavonoid biosynthesis in apple and further elucidated that the promoting effect might be achieved by increasing malonyl-CoA substrates and activating JA biosynthesis. For most apple varieties in China, color changing and ripening occur at the same time, resulting in the lower value of apple fruit in the market. Our study provides a theoretical basis for flavonoid biosynthesis in apple, and indicates the possibility of artificial adjustment of fruit color via the fatty acid metabolic pathway in a natural and green way.
-
Coordinated changes in the levels of key metabolites and expression of genes involved in both fatty acid β-oxidation and flavonoid biosynthesis were observed across apple cultivars with varying flavonoid contents. Moreover, inhibition of fatty acid β-oxidation by etomoxir decreased the flavonoid content and delayed apple fruit coloring.
This work was supported by the Shandong Key R&D Plan (Agricultural Variety Project) (2022LZGCQY008), the National Program for Quality and Safety Risk Assessment of Agricultural Products of China (GJFP20230210), the National Natural Science Foundation of China (32302514) and the Research Foundation for Evaluation of Quality Specification & Nutritional Function of Agricultural Products (PJ2023-019, GF-SGPZ-2024001).
-
The authors confirm contributions to the paper as follows: study conception and design: Wan H, Nie J; data collection: Wan H, Wang T, Wang Z; analysis and interpretation of results: Wan H, Zhou Y, Yang K, Yang M; draft manuscript preparation: Wan H, Wang T. All authors reviewed the results and approved the final version of the manuscript.
-
All data generated or analyzed during this study are included in this published article and its supplementary information files.
-
The authors declare that they have no conflict of interest.
-
# Authors contributed equally: Haoliang Wan, Tongtong Wang
- Supplementary Table S1 Information of metabolites by UHPLC-Orbitrap MS. Value represents the peak area.
- Supplementary Table S2 Content of major flavonoids in 9 apple cultivars by UPLC-MS/MS (μg/g).
- Supplementary Table S3 Differently expressed genes between 'Orin' and others. DEGs in the flavonoid, jasmonic acid and β-oxidation were listed in the front of the table.
- Supplementary Table S4 Primers used in this article.
- Supplementary Fig. S1 RT-qPCR validation of RNA-seq data by six DEGs.
- Copyright: © 2025 by the author(s). Published by Maximum Academic Press, Fayetteville, GA. This article is an open access article distributed under Creative Commons Attribution License (CC BY 4.0), visit https://creativecommons.org/licenses/by/4.0/.
-
About this article
Cite this article
Wan H, Wang T, Wang Z, Zhou Y, Yang M, et al. 2025. Transcriptome and metabolome analysis reveals the effects of fatty acid degradation on flavonoid biosynthesis in apple. Fruit Research 5: e038 doi: 10.48130/frures-0025-0028 

Transcriptome and metabolome analysis reveals the effects of fatty acid degradation on flavonoid biosynthesis in apple
- Received: 31 May 2025
- Revised: 19 August 2025
- Accepted: 26 August 2025
- Published online: 27 October 2025
Abstract: In flavonoid biosynthesis, the phenylpropanoid branch has received increasing attention, but little attention has been paid to the fatty acid β-oxidation branch involved in providing the necessary malonyl-Coenzyme A (CoA) moieties of flavonoids. Here, we conducted a qualitative and quantitative metabolomic analysis of nine apple cultivars with different flavonoid contents by using Orbitrap high-resolution and triple quadrupole (QQQ) mass spectrometry. The results showed that flavonoid-rich apple cultivars had higher accumulation of several major flavonoids (such as phloridzin, epicatechin, and proanthocyanin B1) and other compounds related to fatty acid β-oxidation (such as 18-carbon unsaturated fatty acids, jasmonic acid) compared with those with low flavonoid contents. Then transcriptomic analysis revealed upregulation of genes involved in fatty acid β-oxidation (such as ACX, ECH, and KAT), jasmonic acid biosynthesis (such as LOX, AOC, and OPR), and flavonoid biosynthesis (such as CHS, CHI, F3H, ANS, ANR, and several FLSs) in flavonoid-rich apple cultivars. Finally, apple fruits at the coloring stage were treated with 100 and 200 μM etomoxir (an effective inhibitor of fatty acid β-oxidation). The results showed that etomoxir significantly decreased the fruit color, the flavonoid content, and the expression of flavonoid-related genes in a dose-dependent manner. These results highlight the important role of fatty acid β-oxidation in apple flavonoid biosynthesis and provide a theoretical foundation for improving flavonoid biosynthesis from the perspective of malonyl-CoA instead of phenylpropanoid.
-
Key words:
- Apple flavonoid /
- β-oxidation /
- Fatty acid /
- Jasmonic acid