













-
Soil organic carbon (SOC) regulates atmospheric CO2 concentrations and supports soil fertility and ecosystem functioning[1]. Mechanistic interpretation of SOC change requires separating particulate organic carbon (POC) from mineral-associated organic carbon (MAOC), because the two pools differ in origin, turnover, and stabilization pathways[2−4]. POC derives mainly from recent residues and particulate detritus and generally turns over rapidly. MAOC is retained through interactions with clay minerals and Fe/Al oxides and is therefore usually more persistent[5,6]. Organomineral association, aggregation, and metal-mediated interactions can reduce microbial access and increase persistence[7−9]. Alongside these structural pools, dissolved organic carbon (DOC) can indicate short-term substrate supply and movement of soluble C[10]. Microbial biomass carbon (MBC) is widely used as an index of living microbial biomass[11]. Together, these variables can help interpret how newly added carbon may move toward, or away from, longer-term retention.
Biochar is widely proposed as a tool to increase SOC sequestration and improve soil function, but its effects on SOC partitioning are highly context dependent. Feedstock and pyrolysis conditions alter aromaticity, ash content, surface chemistry, porosity, and labile-C content[12−17]. Soil properties and site conditions then regulate aggregation, sorption, organomineral interaction, DOC dynamics, and priming[18−28]. As a result, some studies report strong increases in POC, whereas others report smaller, neutral, or even negative effects on MAOC[29−31]. Previous syntheses have summarized bulk SOC responses, CO2 fluxes, microbial biomass, and biochar stability or priming[32−36], but an integrated quantitative assessment of structural fractions (POC and MAOC), labile indicators (DOC and MBC), and allocation patterns remains limited. The key question is therefore not simply whether biochar increases SOC, but how the added carbon is distributed between soil carbon pools. We conducted a meta-analysis to quantify the effects of biochar on structural and labile C pools, identify the main moderators of response variability, and examine the relationships among major SOC fractions across studies.
-
We searched Web of Science and the China National Knowledge Infrastructure (CNKI) for peer-reviewed studies published before December 2025 that reported biochar effects on soil organic carbon fractions. The search string combined biochar-related terms with SOC-fraction terms: ('biochar' OR 'charcoal' OR 'pyrogenic carbon' OR 'black carbon') AND ('particulate organic carbon' OR 'particulate organic matter' OR POC OR POM OR 'mineral-associated organic carbon' OR MAOC OR MOC OR 'mineral associated carbon'). The broader terms 'pyrogenic carbon' and 'black carbon' were used only at the initial search stage to maximize recall. During title, abstract, and full-text screening, however, we retained only studies that tested applied biochar. Studies on wildfire ash, soot, coke, or naturally occurring pyrogenic C without an experimental biochar treatment were excluded. DOC and MBC were not included as primary search terms. Instead, these variables were extracted only from studies that had already met the inclusion criteria for studies examining biochar effects on SOC fractions, provided that they were reported for the same treatment–control comparison.
Studies were included when they met the following criteria. (1) SOC fractionation separated particulate and mineral-associated pools and reported operational definitions for POC and MAOC/MOC. Particle-size separation was used in 84% of trials, with a cutoff of 53 μm (95%; three studies used 50 μm). Density separation was used in 16% of studies, with the primary cutoff set at 1.80 g cm−3 (82%; two studies used 1.60, and 1.85 g cm−3). Following Lavallee et al.[3], fractions smaller than 50–63 μm or denser than 1.60–1.85 g cm−3 were treated as MAOC, whereas coarser or less dense fractions were treated as POC. Because density-defined and size-defined fractions show broadly similar SOC contents and turnover characteristics[3], we integrated them into a common POC–MAOC framework rather than treating them as separate classes. Although this approach does not eliminate all methodological variation, it improves comparability across analogous carbon pools. (2) Studies included a biochar treatment and a corresponding control without biochar under comparable background conditions. In factorial designs, contrasts were defined to isolate the biochar effect (biochar + X vs. X alone) when X was applied to both groups. (3) Means, a measure of dispersion (SD, SE, or CI), and replicate counts were available or could be estimated. When SD was not reported, it was assumed to equal 10% of the mean, and was later evaluated in sensitivity analyses. Essential descriptors, including biochar feedstock, application rate, and experiment duration, also had to be reported. When multiple sampling times were available, the latest observation was used. When multiple soil layers were reported, the surface layer (≤ 0.3 m) was prioritized, and depth-weighted averages were calculated when necessary.
Study selection followed the PRISMA framework (Supplementary Fig. S1). Twenty-six studies met the inclusion criteria and yielded 364 treatment-control comparisons across the aggregated datasets. Among them, 25 studies provided extractable effect sizes for at least one outcome included in the quantitative synthesis, whereas one study was retained in the review but did not contribute usable effect-size data. The included studies and their contributed outcomes are listed in Supplementary Table S1. The detailed screening workflow and reporting notes are provided in the Supplementary PRISMA file. To avoid pseudo-replication, we consolidated multiple contrasts from each reference into a single study-level effect size for each outcome when different rates and/or factorial treatments shared the same control, using inverse-variance weighting. We therefore report both the number of unique references (k) and the total number of extracted contrasts (n). Outcome-specific sample sizes were as follows: SOC (n = 127, k = 15), POC (n = 230, k = 23), MAOC/MOC (n = 194, k = 21), DOC (n = 78, k = 14), and MBC (n = 95, k = 14); allocation-ratio results are summarized in the Supplementary Information. Readily oxidizable carbon (ROC) was not included as a formal outcome because reporting was limited and operational definitions varied across studies, which precluded a robust synthesis. The reference list includes citations for all cited studies.
Data extraction and standardization
-
Soil organic carbon (SOC) concentrations were obtained directly from the original studies or calculated from SOC stocks when sufficient information was available. Unit conversion followed standard harmonization: SOCS (Mg C ha−1) = SOC (g kg−1) × BD (g cm−3) × D (cm)/10, or equivalently SOC (g kg−1) = 10 × SOCS/(BD × D), where BD is bulk density and D is soil layer thickness. Standard errors were converted to standard deviations using SD = SE × √n. When data were available only in figures, values were digitized with GetData Graph Digitizer (v2.2).
We extracted SOC and, where available, its fractions, particulate organic carbon (POC), and mineral-associated organic carbon (MAOC) from each eligible study. In the original studies, this mineral-associated fraction was reported either as MAOC or as mineral-associated carbon (MOC); both terms were treated as equivalent and unified here as MAOC. Fine POC (53–250 μm) and coarse POC (250–2,000 μm) were summed to obtain total POC. To evaluate SOC partitioning, we calculated allocation metrics including fPOC (POC/SOC) and fMAOC (MAOC/SOC). For these calculations, SOC was defined as POC + MAOC when both fractions were reported, because fractionation may not fully recover total carbon. Only observations from soil depths of 0–0.3 m were included. Readily oxidizable carbon (ROC) was not included as a formal outcome because reporting was limited and operational definitions varied across studies, which precluded a robust synthesis.
Moderator analyses considered site and design descriptors, including ecosystem type, climate zone (tropical/subtropical/temperate), biochar feedstock category, pyrolysis temperature class (< 500 vs. ≥ 500 °C), application rate, experiment duration, and treatment regime (biochar alone vs. co-applied with additional amendments). Application rates were classified as low (<10 t ha−1), medium (10−30 t ha−1), and high (> 30 t ha−1), and durations as short (< 1 year), medium (1−3 years), and long (> 3 years). Comparisons lacking adequate metadata were excluded from the relevant subgroup or meta-regression analyses. Moderators were analyzed only when they were sufficiently represented and consistently reported across studies.
Statistical analysis
-
Effect sizes were calculated as the natural log response ratio (lnRR = ln[Xt/Xc]), where Xt and Xc are the mean values for the biochar-amended, and control treatments, respectively. When a study reported multiple contrasts for the same outcome that shared a common control, these contrasts were aggregated into a single study-level lnRR and its corresponding sampling variance using inverse-variance weighting to reduce non-independence among effect sizes. Pooled effect sizes were estimated with random-effects models fitted by restricted maximum likelihood and subsequently back-transformed to percentage change for interpretation. All analyses were conducted in R using the metafor package. Cross-pool relationships were further evaluated using separate study-level mixed-effects meta-regression models for the SOC–MAOC, SOC–POC, and MAOC–POC relationships, based on aggregated lnRR values from studies reporting the corresponding paired outcomes. For the main pooled outcomes, Cochran's Q and I2 statistics were recalculated from the extraction tables after study-level aggregation.
Publication bias and sensitivity analysis
-
We evaluated publication bias and small-study effects for outcomes with adequate evidence (k ≥ 10 studies). Funnel plots were inspected visually using study-level effect sizes aggregated by reference and plotted against standard error, and an Egger-type regression test was used to assess funnel-plot asymmetry. We also applied Duval & Tweedie's trim-and-fill method as a sensitivity analysis. Robustness was further evaluated by re-running the main models after excluding comparisons for which SD had been imputed as 10% of the mean. Publication-bias diagnostics and sensitivity results are provided in the Supplementary Information (Supplementary Tables S2−S4; Supplementary Figs. S2−S8).
-
Biochar increased total SOC overall, but the pooled increase was concentrated more in POC than in MAOC (Fig. 1). Large increases in bulk SOC were therefore not matched by equally large increases in the mineral-associated pool. Allocation ratios changed much less than the absolute pools. Between-study heterogeneity was substantial for all pooled outcomes (Supplementary Table S2). This heterogeneity supports interpreting pooled effects together with moderator analyses, rather than as uniform responses across sites and management regimes. Publication-bias diagnostics showed no significant funnel-plot asymmetry for SOC, POC, DOC, MBC, or MAOC/SOC (p > 0.05), whereas MAOC and POC/SOC showed asymmetry (p < 0.01; Supplementary Table S2). Trim-and-fill indicated that any missing studies would be more likely to strengthen than reverse the positive direction of the pooled responses, and excluding imputed SD values changed pooled estimates by less than 1.4 percentage points (Supplementary Table S3).
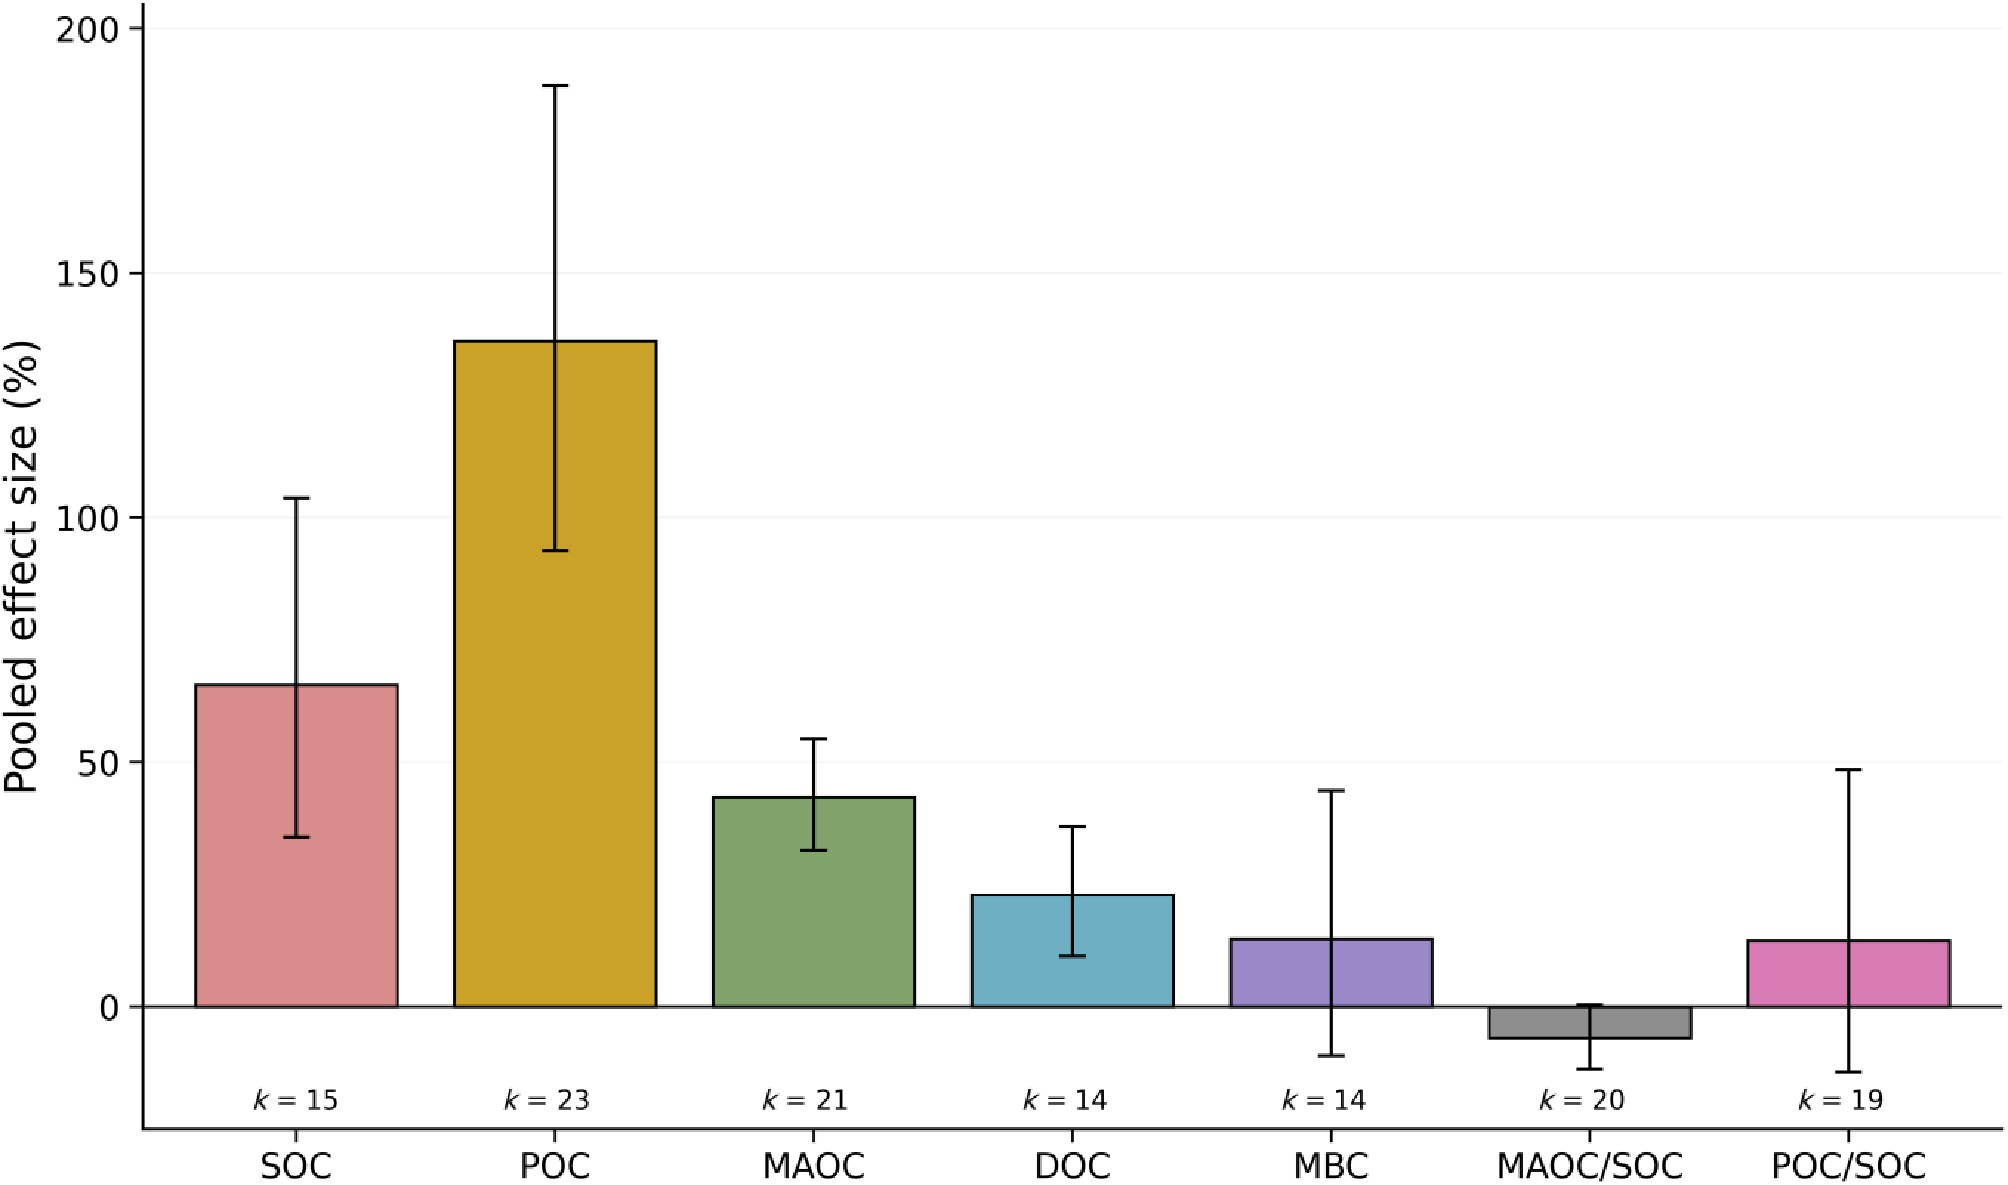
Figure 1.
The comprehensive impact of biochar on soil organic carbon pools and allocation ratios. The mean effect sizes (%) from the comprehensive meta-analysis of biochar amendment on soil organic carbon (SOC), particulate organic carbon (POC), mineral-associated organic carbon (MAOC), dissolved organic carbon (DOC), and microbial biomass carbon (MBC), along with alterations in SOC distribution represented as POC/SOC and MAOC/SOC. The bars represent the mean effect, while the error bars indicate the 95% confidence intervals. k indicates the number of independent studies. Exact Cochran's Q and I2 values for these pooled outcomes are reported in Supplementary Table S2.
Moderator analyses showed that feedstock, pyrolysis temperature, and environmental context largely controlled the magnitude and expression of SOC-fraction responses (Figs. 2, 3). SOC responses were larger in wetlands than in croplands, larger for woody than for herbaceous or manure-derived biochars, and larger for biochars produced above 500 °C than for lower-temperature materials. Climatic differences were also evident, with stronger SOC responses in tropical and subtropical regions and smaller or near-neutral responses in temperate systems. Co-applied amendments also produced larger effects than biochar alone. Fraction-specific patterns were more selective. Manure-derived biochars tended to favor short-term particulate accumulation, whereas higher-temperature biochars and warmer or wetter settings more generally favored larger MAOC increases.
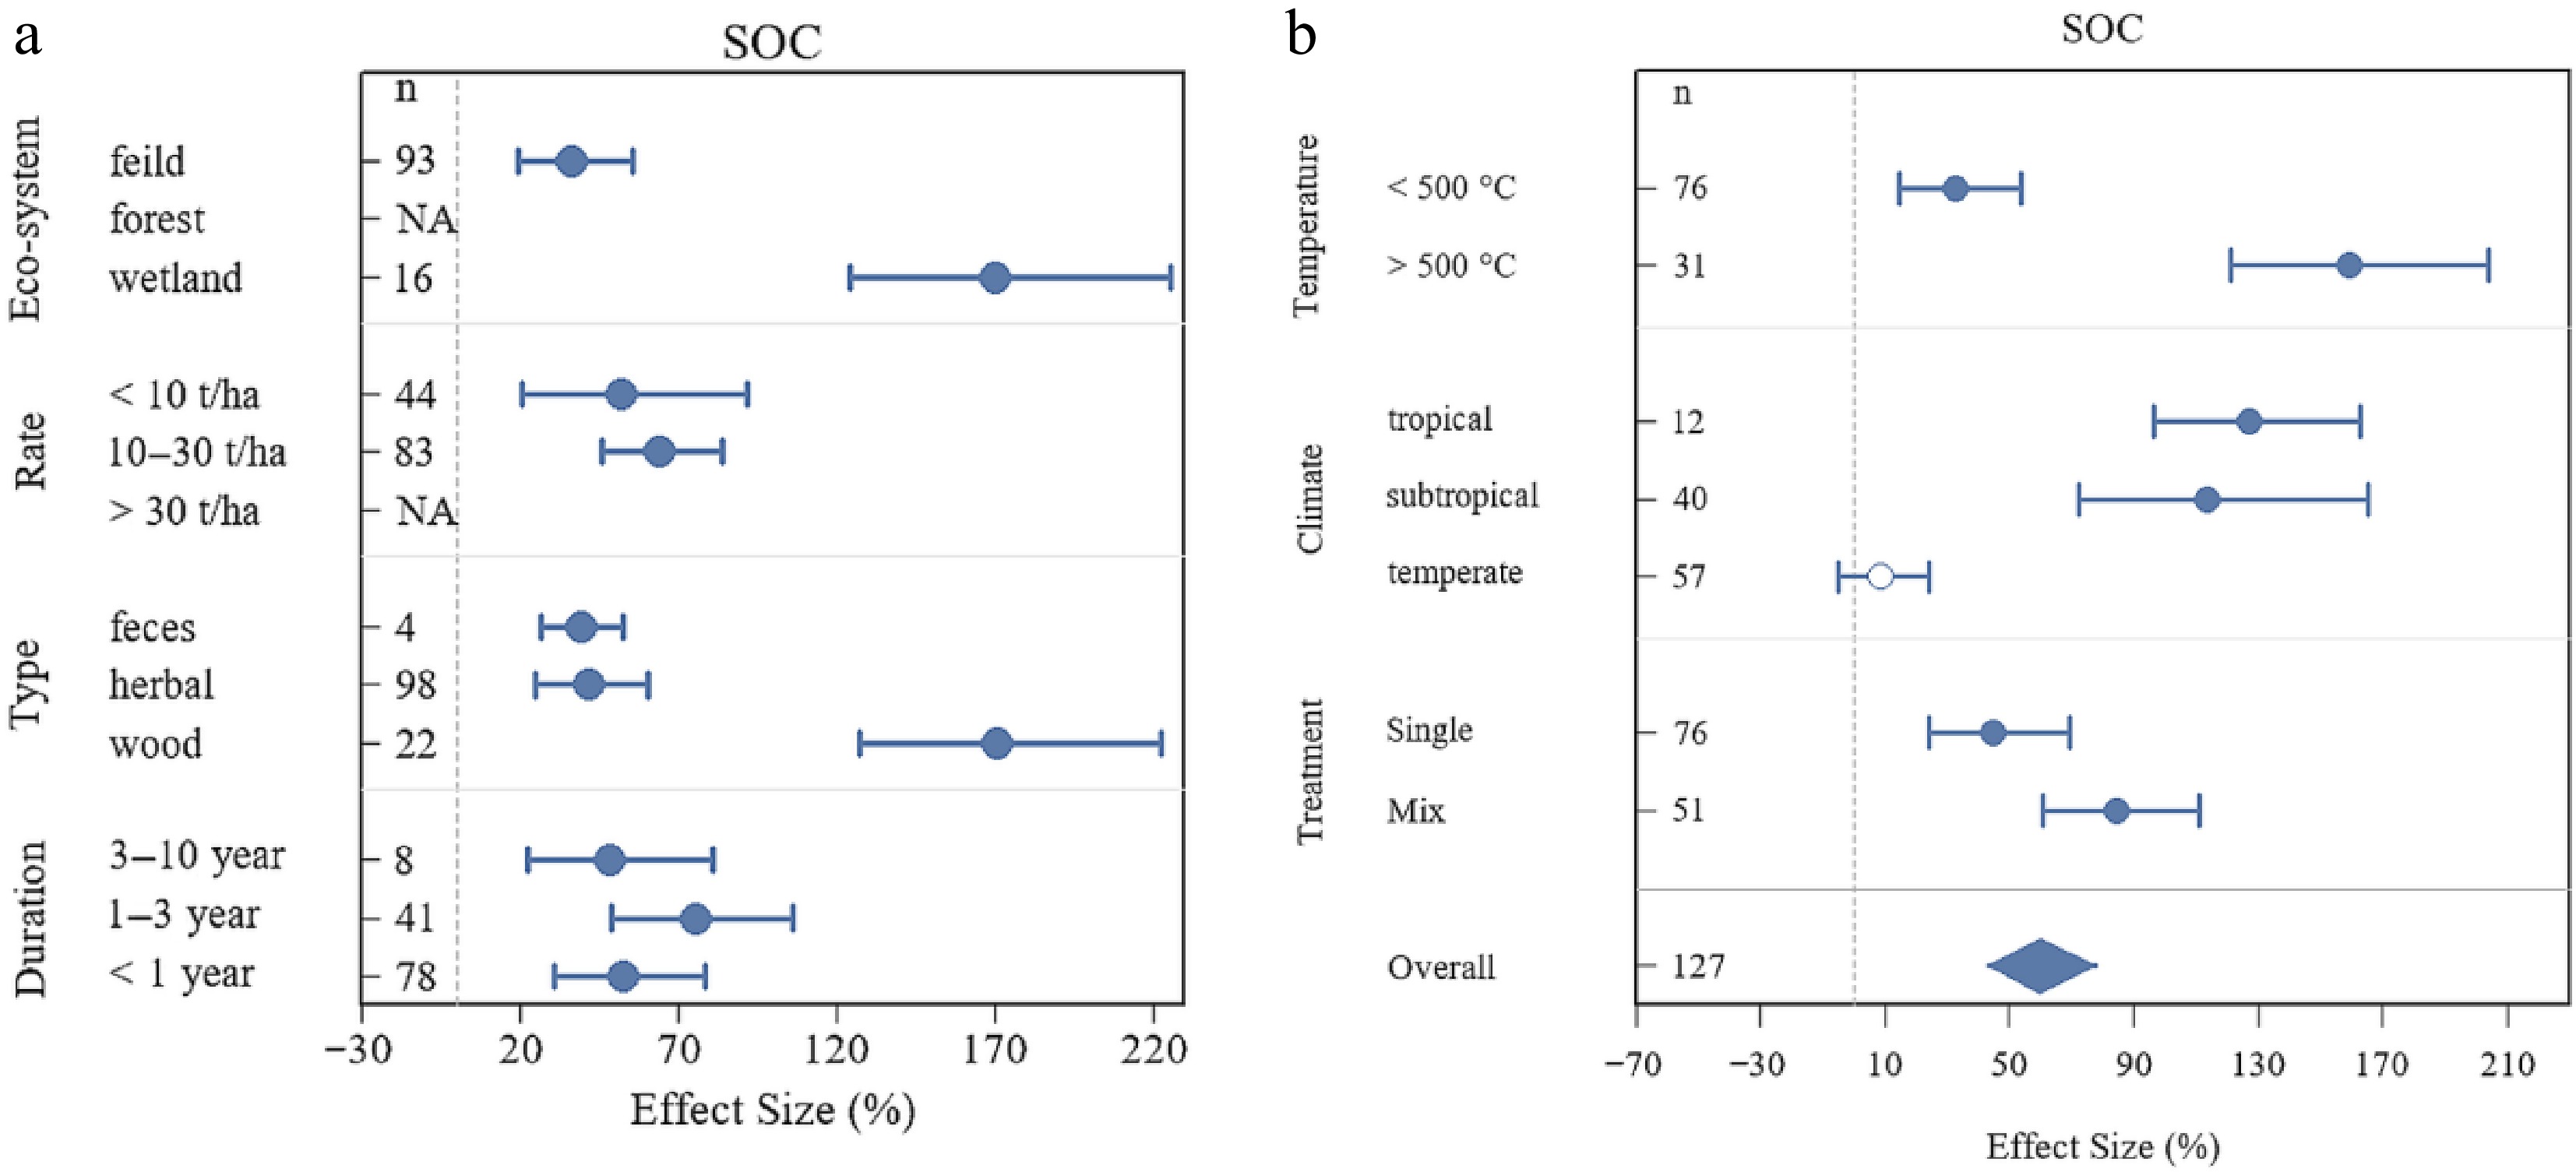
Figure 2.
Responses of soil organic carbon (SOC) to biochar across moderator groups. Forest plots summarizing subgroup meta-analyses of SOC responses to biochar by ecosystem type, application rate, feedstock type, experimental duration, pyrolysis temperature, climate zone, and treatment regime. Points indicate subgroup mean effect sizes, horizontal bars indicate 95% confidence intervals, and diamonds indicate the overall effect size. The vertical dashed line indicates no effect (0%). n indicates the number of paired treatment–control comparisons. Exact outcome-level heterogeneity statistics (Q and I2) are reported in Supplementary Table S2.
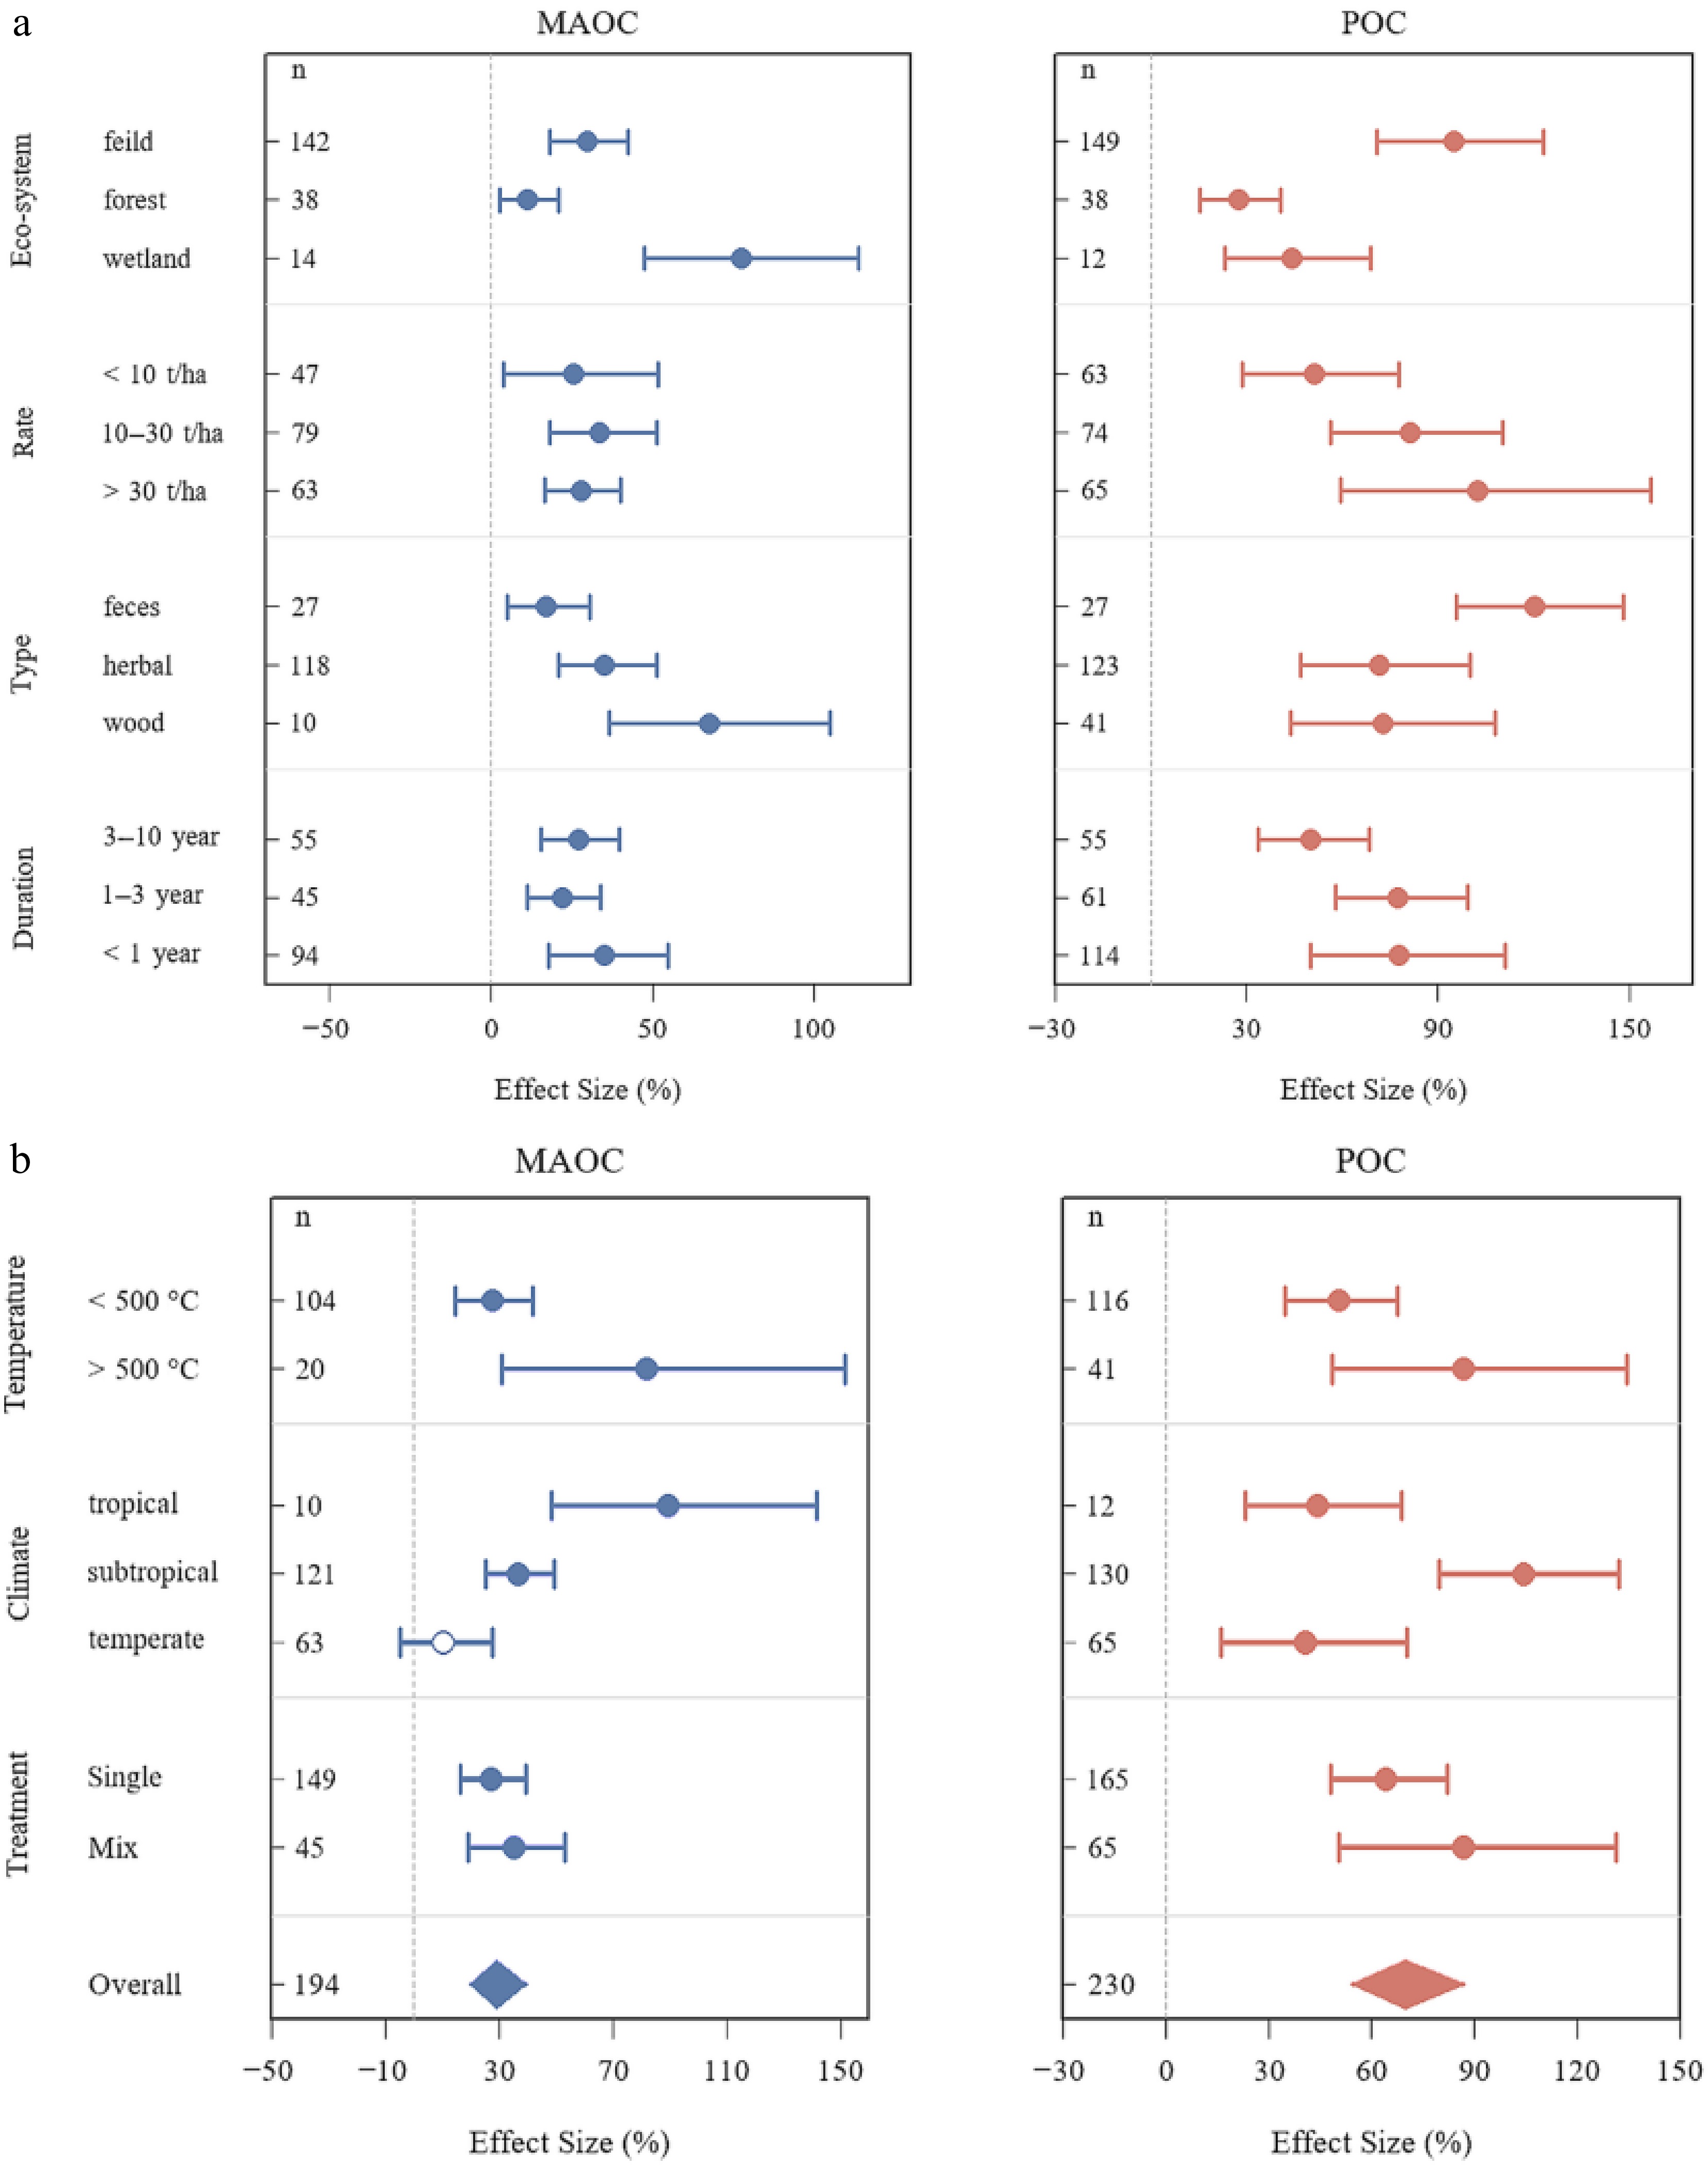
Figure 3.
Responses of mineral-associated organic carbon (MAOC) and particulate organic carbon (POC) to biochar across moderator groups. Subgroup meta-analyses showing the effects of biochar on MAOC and POC. Panels summarize responses by ecosystem type, application rate, feedstock type, experimental duration, pyrolysis temperature, climate zone, and treatment regime. Points represent subgroup mean effect sizes, horizontal bars indicate 95% confidence intervals, and diamonds indicate the overall effect size. The vertical dashed line denotes 0% effect. n indicates the number of paired treatment–control comparisons. Exact outcome-level heterogeneity statistics (Q and I2) are reported in Supplementary Table S2.
Allocation metrics and labile pools responded more weakly and more variably than the absolute structural fractions. MAOC/SOC and POC/SOC shifted only modestly and inconsistently across contexts (Fig. 4), which reinforces that bulk SOC increases were usually driven more by pool expansion than by major reorganization of relative partitioning. MBC responses were most pronounced in wetlands and tropical regions, whereas DOC remained variable in direction across climates and ecosystems (Fig. 5). Thus, process-sensitive labile pools did not mirror the structural fractions consistently.
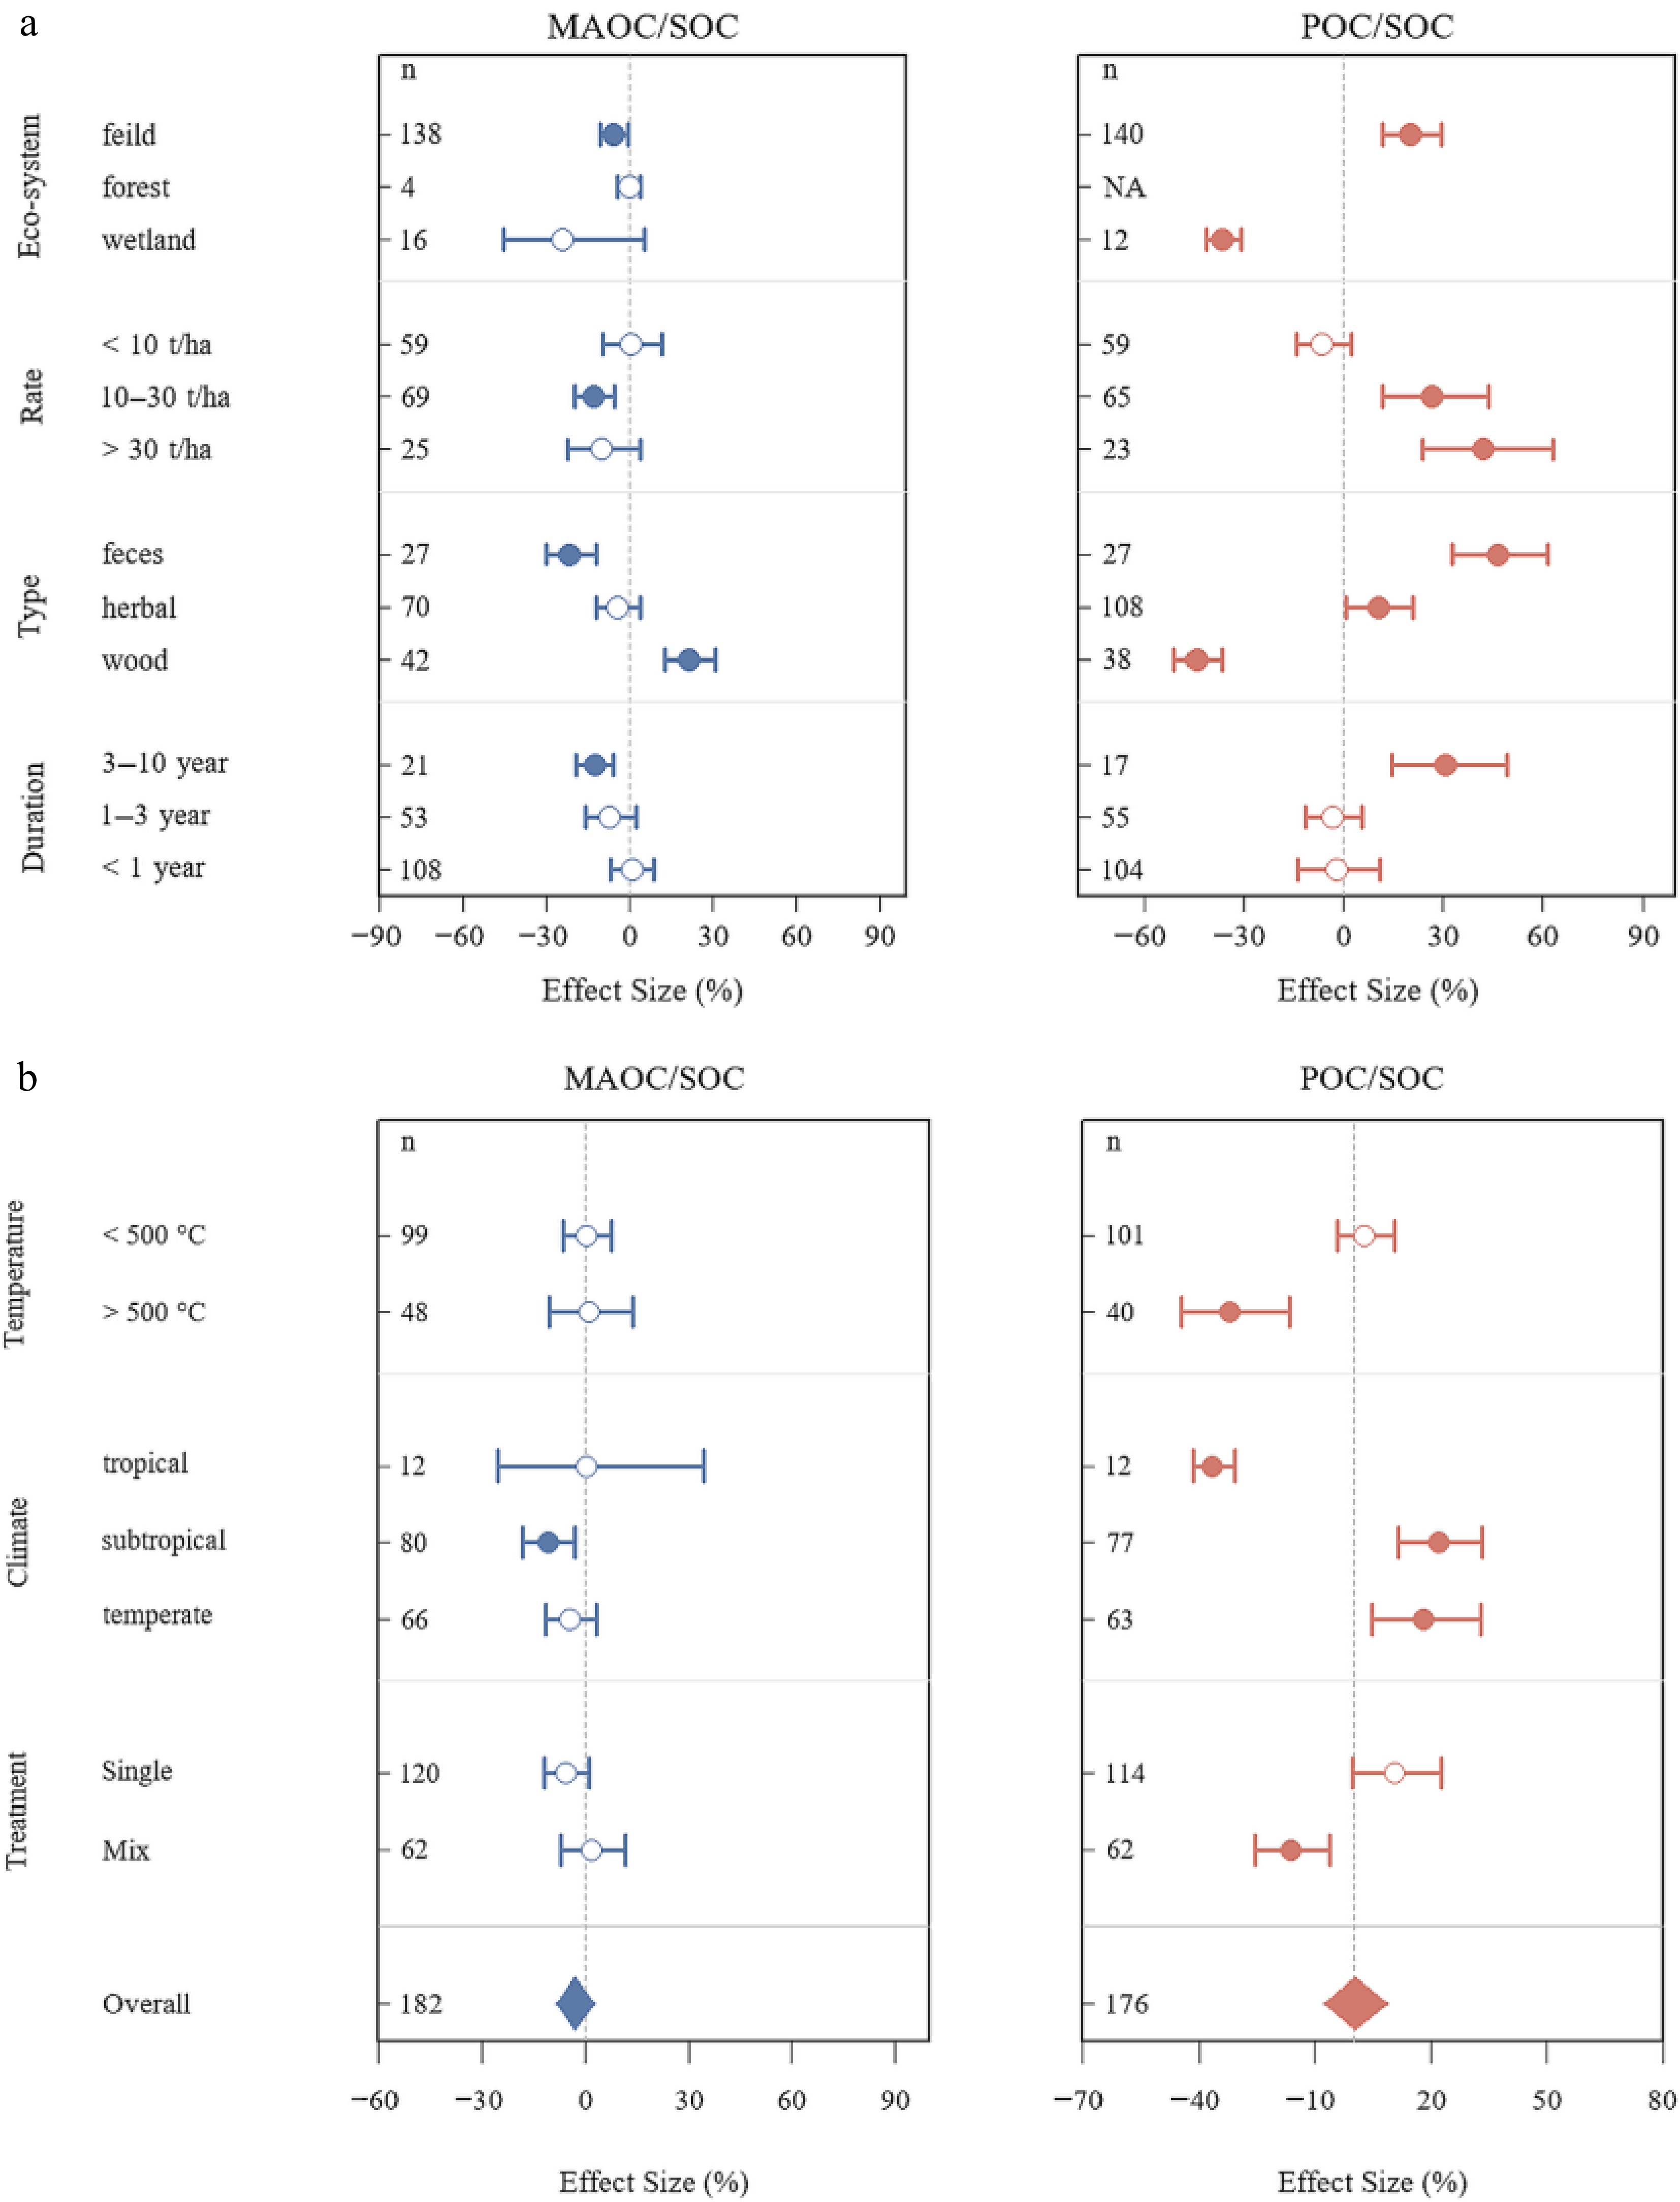
Figure 4.
Responses of SOC allocation ratios to biochar across moderator groups. Subgroup meta-analyses showing the effects of biochar on MAOC/SOC and POC/SOC. Panels summarize responses by ecosystem type, application rate, feedstock type, experimental duration, pyrolysis temperature, climate zone, and treatment regime. Points represent subgroup mean effect sizes, horizontal bars indicate 95% confidence intervals, and diamonds indicate the overall effect size. The vertical dashed line denotes 0% effect. n indicates the number of paired treatment–control comparisons. Exact outcome-level heterogeneity statistics (Q and I2) are reported in Supplementary Table S2.
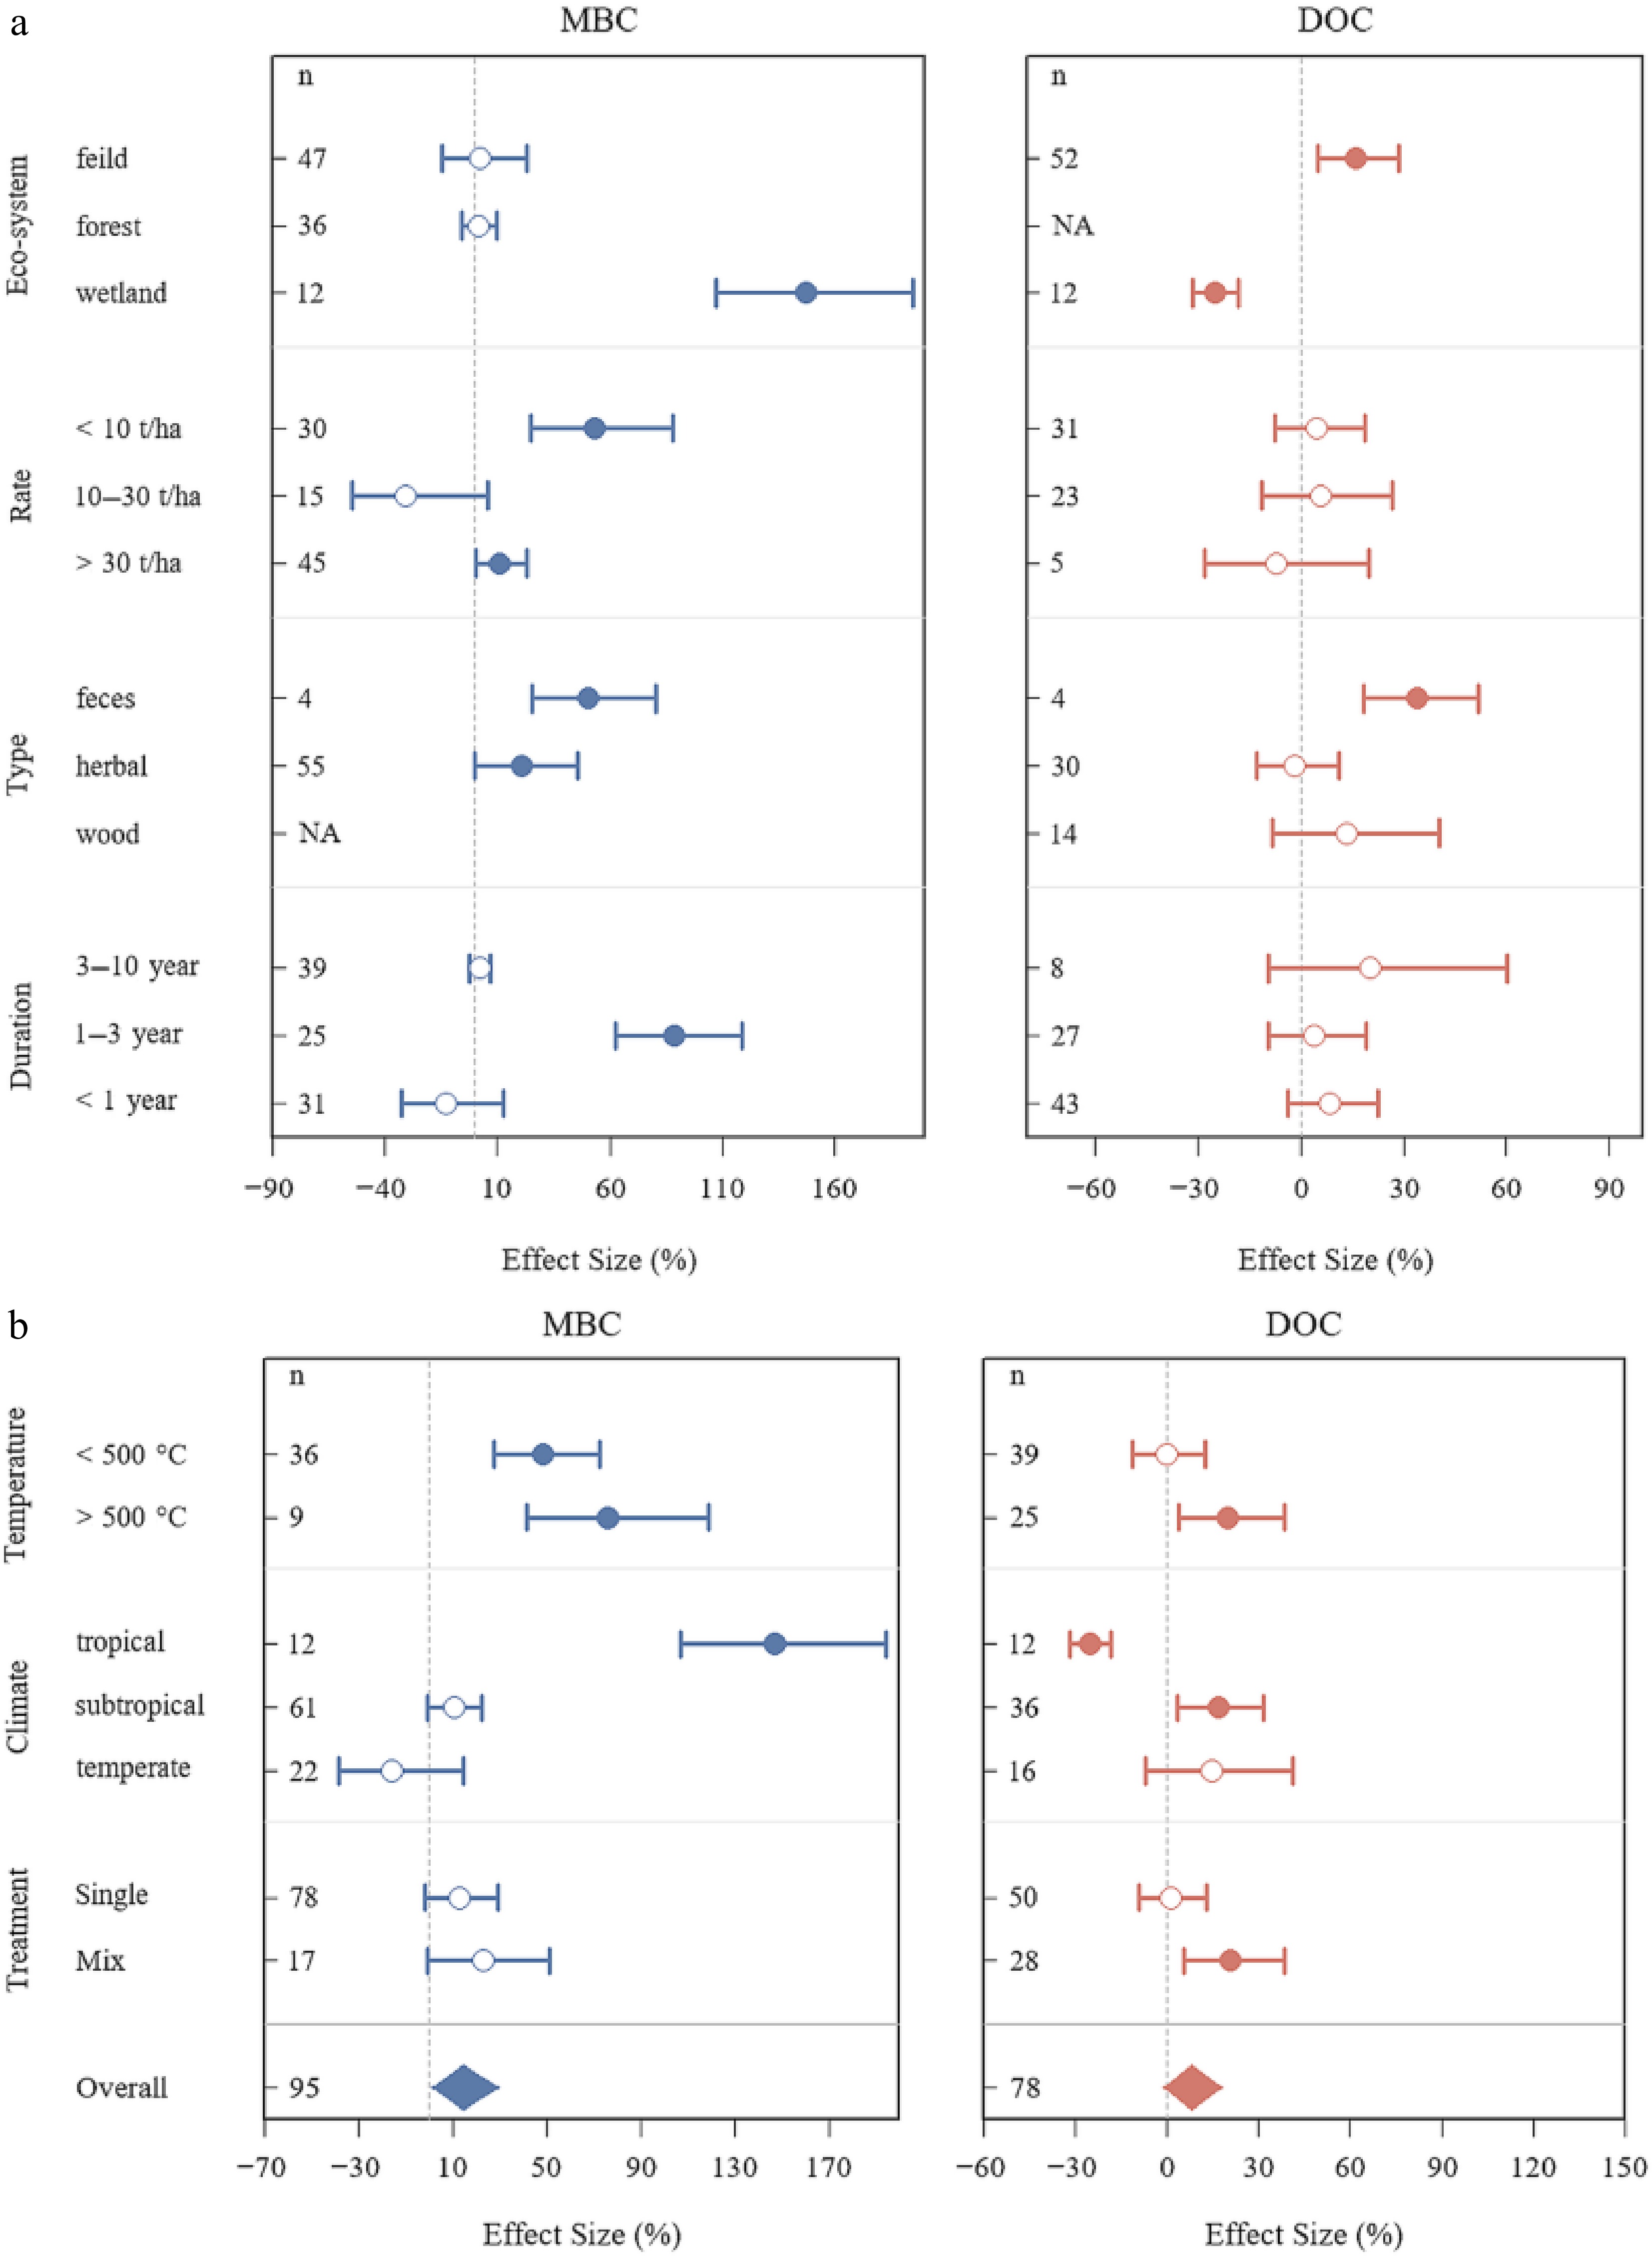
Figure 5.
Responses of microbial biomass carbon (MBC) and dissolved organic carbon (DOC) to biochar across moderator groups. Subgroup meta-analyses showing the effects of biochar on MBC and DOC. Panels summarize responses by ecosystem type, application rate, feedstock type, experimental duration, pyrolysis temperature, climate zone, and treatment regime. Points represent subgroup mean effect sizes, horizontal bars indicate 95% confidence intervals, and diamonds indicate the overall effect size. The vertical dashed line denotes 0% effect. n indicates the number of paired treatment–control comparisons. Exact outcome-level heterogeneity statistics (Q and I2) are reported in Supplementary Table S2.
Study-level mixed-effects meta-regression further clarified cross-pool relationships (Fig. 6). SOC was positively associated with MAOC response (k = 14, slope = 0.686, p = 0.001; residual I2 = 0.0%) and with POC response (k = 14, slope = 0.433, p < 0.001; residual I2 = 35.4%). By contrast, the association between MAOC and POC was weak and non-significant (k = 19, slope = 0.050, p = 0.692; residual I2 = 0.0%).
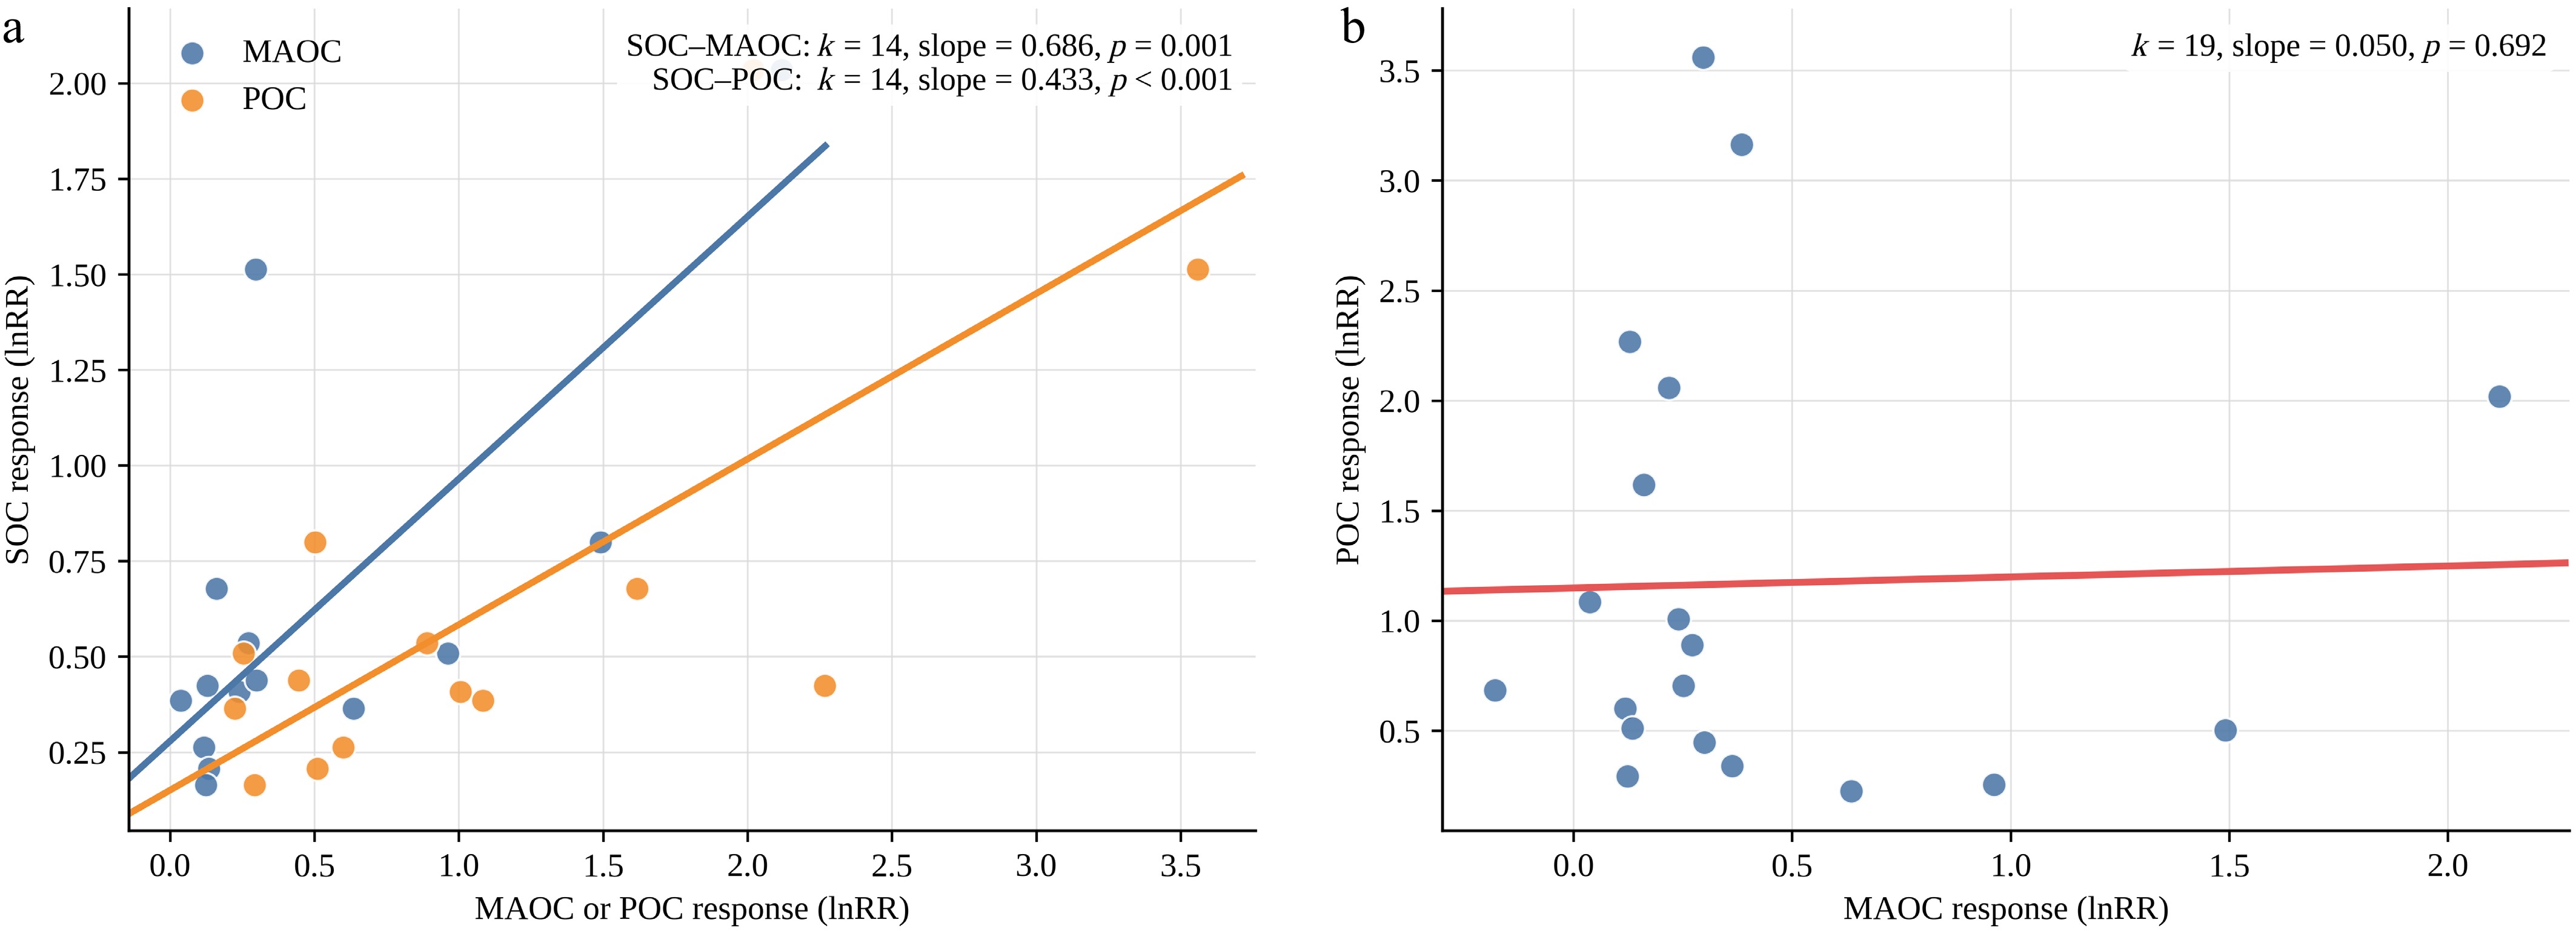
Figure 6.
Study-level mixed-effects meta-regression among SOC, MAOC, and POC responses. SOC was positively related to MAOC and POC responses, whereas the MAOC–POC relationship remained weak and non-significant. The fitted lines provide a descriptive visualization of study-level aggregated patterns among SOC, MAOC, and POC. They are included to illustrate the overall relationship rather than to provide formal mechanistic evidence or independent statistical inference.
-
Biochar increased bulk SOC, but the central finding of this synthesis is that the added carbon accumulated more strongly in POC than in MAOC. Both structural fractions increased after biochar addition, but the POC response was much larger, and the MAOC response was smaller and slower. Bulk SOC increase is therefore not a sufficient indicator of stabilization benefit. MAOC formation, by contrast, appears to depend more strongly on subsequent microbial processing, sorption, and organomineral interactions. This distinction matters because absolute pool growth and relative pool share do not convey the same information. MAOC can increase even when its share of SOC changes little or declines slightly, simply because POC expands faster. MAOC is therefore a more reliable indicator of stabilization than bulk SOC or POC alone, although it is not a direct measure of permanence.
The study-level mixed-effects meta-regression in Fig. 6 supports this interpretation, but it should not be taken as a mechanistic test. SOC was significantly related to both MAOC and POC, but the SOC–MAOC slope was steeper than the SOC–POC slope, whereas the MAOC–POC relationship remained weak and non-significant. Across studies, this pattern suggests that increases in particulate carbon were not consistently followed by similar increases in mineral-associated carbon[37,38]. We therefore interpret the particulate-first, mineral-later pattern as a useful framework for understanding the data rather than as a universal sequence. Short-term POC accumulation may reflect residue retention, aggregation, or occlusion[39], but it does not in itself demonstrate persistent stabilization. Whether increases in particulate carbon are followed by increases in MAOC likely depends on microbial processing, mineral surface availability, and site conditions[4,40,41].
Classification of ecosystem and climatic zone
-
Ecosystem-stratified results indicated particularly large SOC increases in wetlands (Fig. 2a). These increases, commonly accompanied by increases in MAOC and MBC, are compatible with slower decomposition under prolonged flooding and reducing conditions[42]. Reactive mineral phases, including Fe/Ca oxides and clay minerals, may further favor organomineral association and stabilization[40]. However, because some subgroups involved only a limited number of comparisons, the wetland pattern should be interpreted as suggestive rather than universally applicable. Cropland and wetland contrasts in DOC and MBC are discussed further below, because these labile pools reflect short-term processing dynamics rather than structural SOC storage alone. Although forest comparisons were limited, the available evidence suggests that bulk SOC alone is insufficient to explain forest responses. Compared with many cropland systems, forest soils are more strongly shaped by organic-layer inputs, mycorrhizal associations, and site-specific climatic and soil constraints[4,40,43]. Recent syntheses further indicate that POM/MAOM storage in forest soils varies with mycorrhizal type[43] as well as with climate and soil controls[4,40]. In forests, biochar-induced SOC increases may therefore reflect residue retention, altered microbial processing, or transient occlusion before substantial MAOC formation becomes evident. Given the limited representation of forest studies, these patterns should be viewed as preliminary, and their implications for forest management should be interpreted cautiously.
Croplands generally showed stronger POC responses, consistent with a residue-input–aggregate–occlusion pathway that can rapidly enlarge the particulate pool[39]. However, repeated disturbance may weaken aggregates and organomineral associations and thereby limit marginal increases in MAOC. Climate stratification likewise suggested stronger SOC responses, with MAOC increases also observed in tropical and subtropical regions, whereas temperate systems showed smaller or near-neutral responses (Figs. 2b, 3). This pattern suggests that turnover intensity and mineral protection capacity jointly regulate net retention[40,41]. Even when SOC increased, POC/SOC or MAOC/SOC generally changed little. Those small shifts are more consistent with structural dilution or reallocation than with true loss of a given pool.
Framework for application rate, duration, and amendments
-
Across rate classes, POC was more sensitive to application rate than MAOC, further distinguishing rapid particulate accumulation from slower mineral-associated stabilization. External C inputs can promote aggregation and physical protection, which may increase POC rapidly[39]. MAOC formation, however, is constrained by the availability and saturation of mineral binding sites and by the protective properties of clays and metal oxides. Once reactive surfaces become limiting, additional carbon is more likely to remain in POC or intermediate-turnover pools than to be converted into MAOC[40,41]. Higher application rates can therefore increase SOC and POC in absolute terms without yielding proportionate improvements in stabilization. Long-term field evidence indicates that SOC and POC generally rise most strongly at higher biochar rates[44], although higher inputs may also intensify priming-related trade-offs[45]. Field evidence further suggests non-linear dose responses, because particulate pools generally expand faster than mineral-associated pools[38,46,47]. Application rates should therefore be matched to soil retention capacity rather than simply maximized.
Combination treatments that pair biochar with compost, sludge, or other organic amendments can increase both POC and MAOC because mixed substrates stimulate microbial processing while also supplying material for organomineral retention[38,48]. This interpretation is consistent with a 9-year field experiment in which biochar co-applied with municipal solid waste compost or sewage sludge resulted in POC and MAOC values approximately three times and 1.5 times those of the unamended control, respectively[38]. Accordingly, combined amendments improved SOC more than biochar alone (Fig. 2b) and increased MAOC in some contexts (Fig. 3). Nevertheless, larger SOC increases did not guarantee proportional stabilization. When total SOC rose faster than a given fraction, changes in POC/SOC or MAOC/SOC were better interpreted as structural dilution or reallocation than as actual loss of that pool (Fig. 4). Together with the temporal synthesis shown in Fig. 7, these results suggest that management should not rely on short-term increases in SOC or POC alone. MAOC-related signals remain necessary when longer-term retention is inferred.
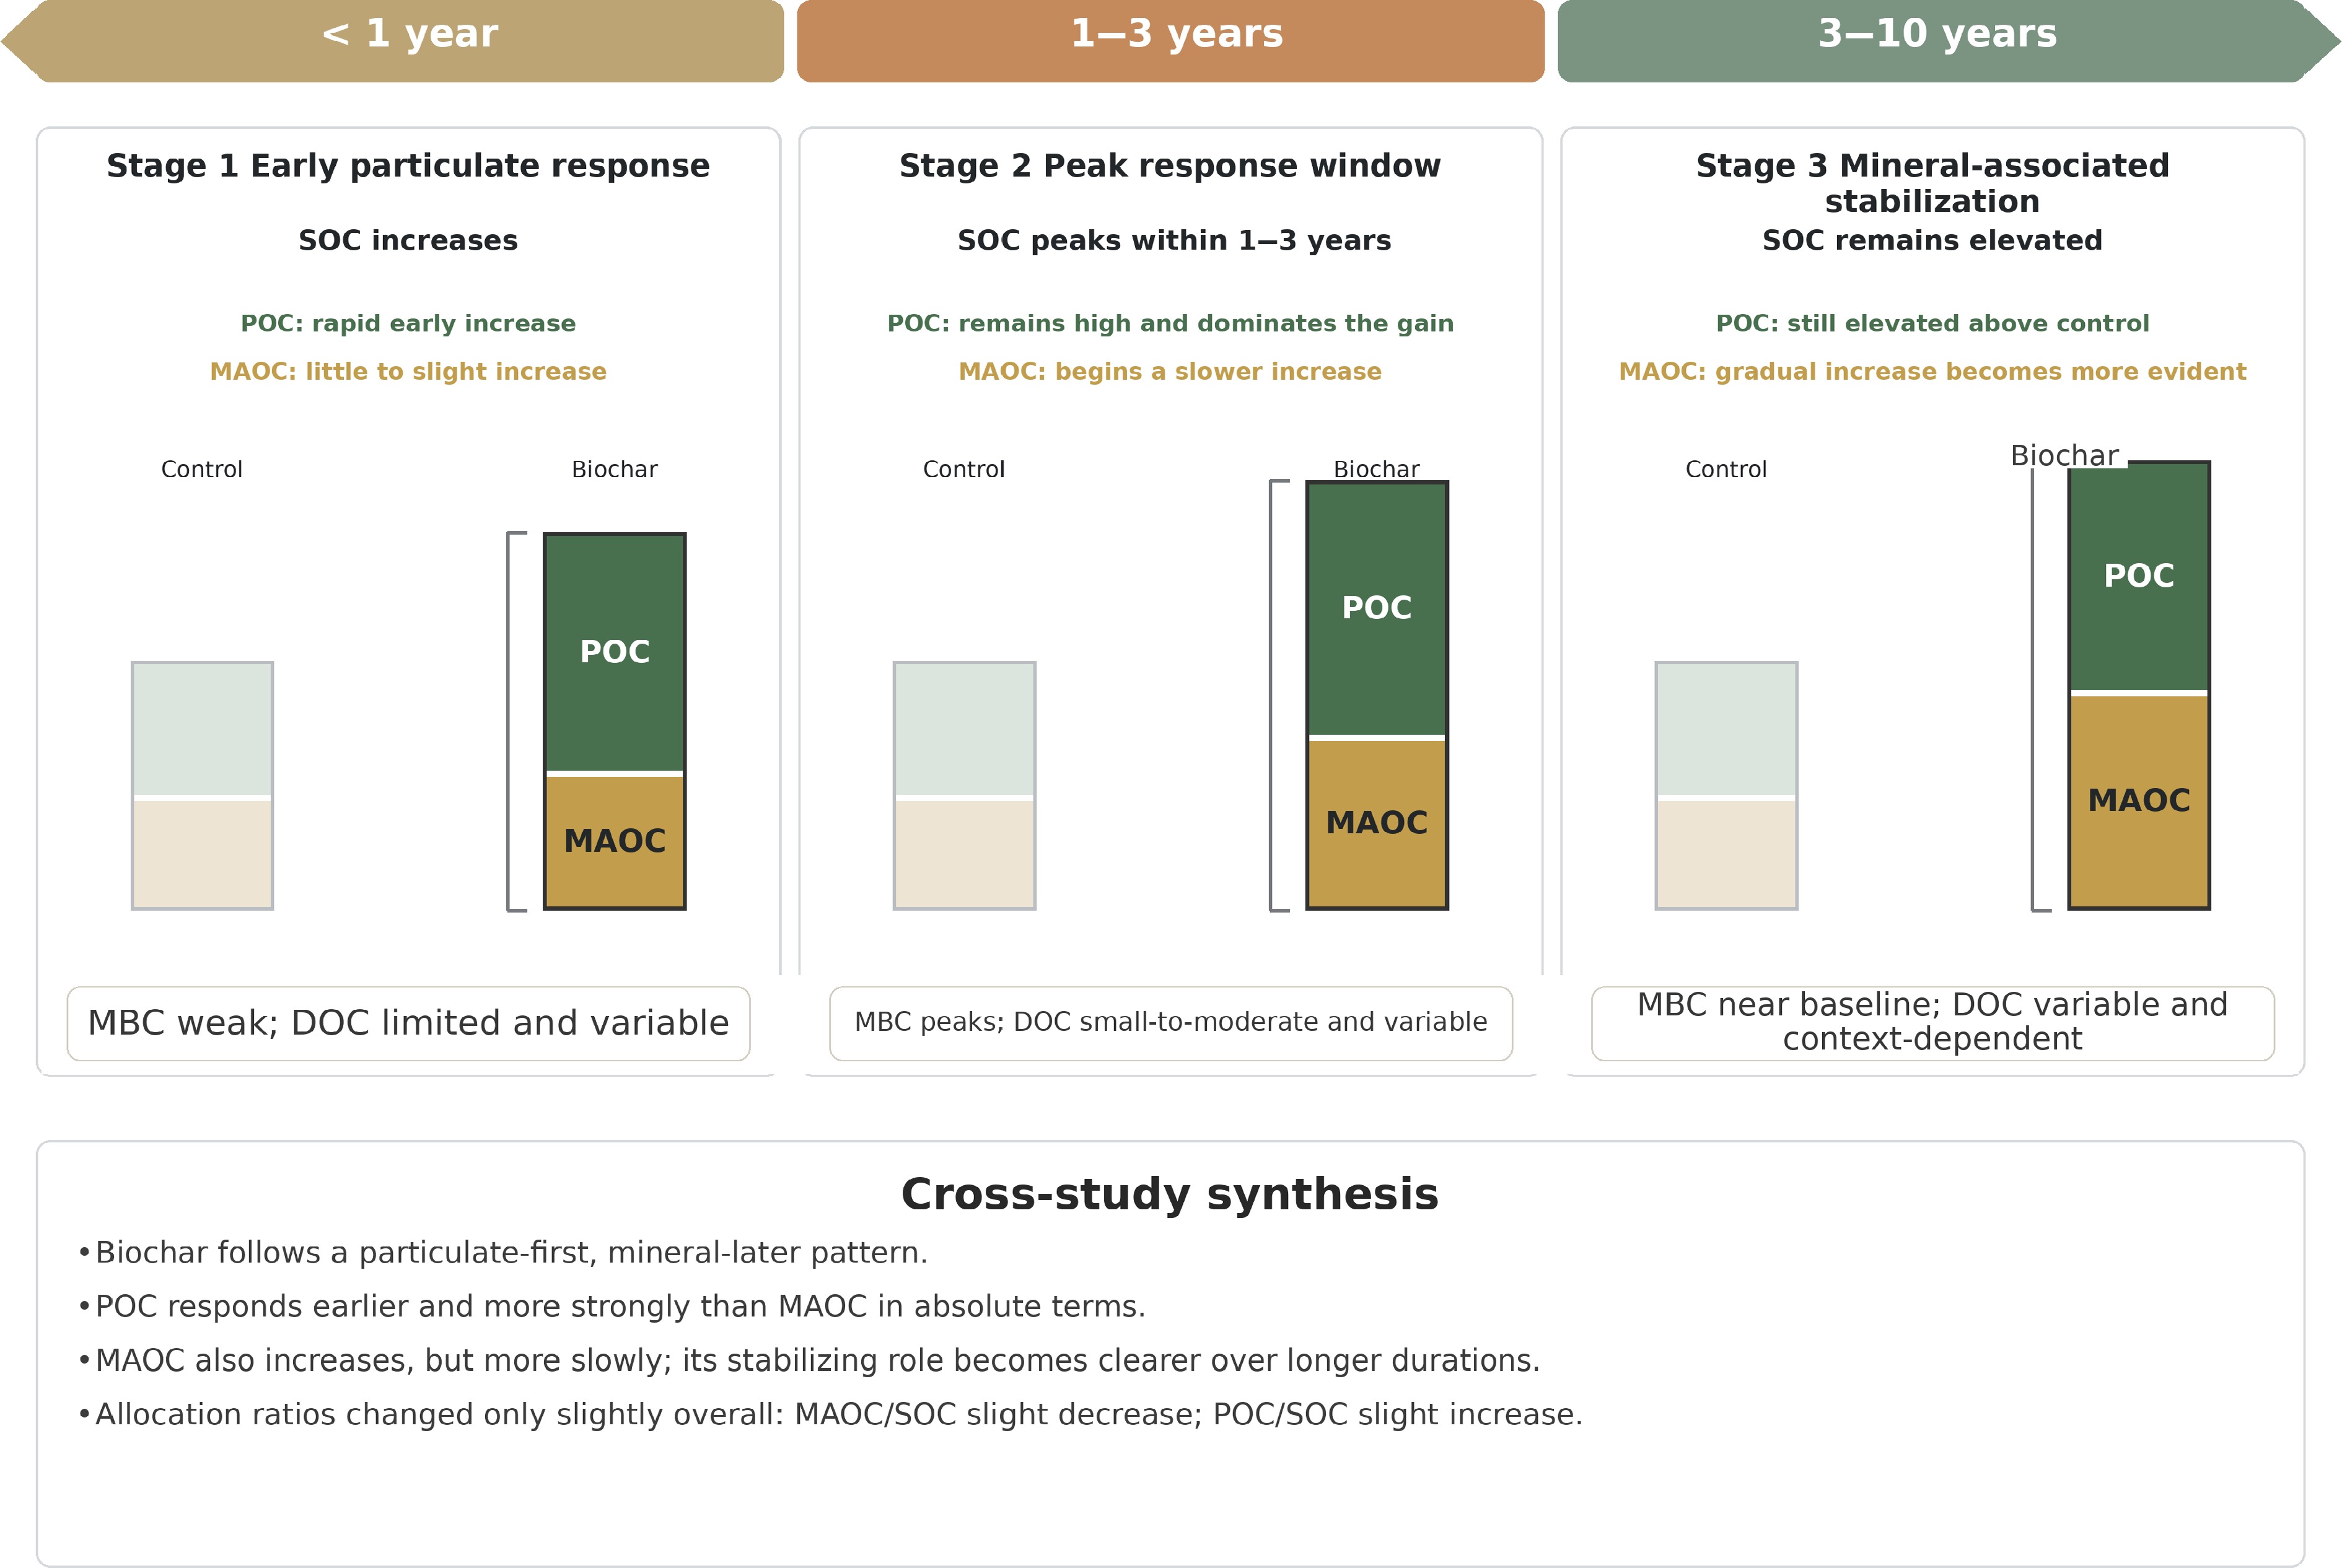
Figure 7.
Conceptual synthesis of time-dependent responses of soil organic carbon fractions to biochar amendment. The height of the stacked column indicates SOC stock, whereas the upper (POC) and lower (MAOC) segments denote absolute pool sizes (schematic, not to scale). The schematic illustrates a rapid early increase in POC, a transient microbial activation phase, and a slower rise in MAOC over time.
Feedstock type and pyrolysis temperature
-
Feedstock type and pyrolysis temperature affect biochar chemistry, nutrient composition, and surface properties, thereby influencing whether added carbon accumulates initially in POC or is incorporated more gradually into MAOC[29,49]. In our dataset, woody biochars produced larger SOC increases (Fig. 2a); a pattern consistent with evidence that wood-derived biochars and those produced at higher pyrolysis temperatures tend to have higher carbon contents, lower H/C ratios, greater aromaticity, and, in many cases, larger surface area or porosity[49−51]. By contrast, manure-derived biochars generally contain more nutrients and readily available compounds, which can stimulate microbial activity and short-term carbon turnover[52].
Pyrolysis temperature also influenced stabilization pathways. Biochars produced above 500 °C were associated with larger SOC increases and stronger MAOC responses (Figs. 2b, 3), a pattern consistent with evidence that higher pyrolysis temperatures tend to increase carbon content, pore volume, pH, specific surface area, and aromaticity[49,51]. However, the temperature effect was not strictly linear. Higher temperatures can reduce soluble substrates while also altering microbial responses and priming intensity, which may generate non-linear trajectories among fractions[45,53]. The relative shares of SOC allocated to POC and MAOC (i.e., POC/SOC and MAOC/SOC) in high-temperature or mixed-amendment contexts generally remained close to zero or declined slightly (Fig. 4). This pattern is more consistent with dilution during rapid SOC accumulation than with outright destabilization. Feedstock type and pyrolysis temperature should therefore be interpreted within a broader framework involving rapid particulate accumulation, delayed MAOC formation, mineral retention capacity, and experimental duration.
Labile pools (microbial biomass carbon and dissolved organic carbon)
-
Compared with the structural fractions, MBC and DOC showed smaller and more context-dependent responses (Fig. 5). These pools are therefore better interpreted as process-sensitive indicators rather than as proxies for persistent carbon storage. POC and MAOC represent structural SOC fractions, whereas DOC and MBC track short-term substrate availability, microbial activation, sorption, mineralization, and hydrological transfer. An increase in DOC or MBC does not necessarily correspond to an enlargement of the MAOC pool, nor does a decline in DOC necessarily signify weaker long-term carbon retention. These labile pools can provide useful insights into process activation, but they cannot replace evidence from SOC fractions when stabilization is being evaluated. Subgroup patterns further showed that MBC responses were strongest in wetlands and in tropical/subtropical regions, whereas DOC remained generally small and variable in direction across ecosystems and climates. In wetlands, DOC may be rapidly consumed by microbes, sorbed to mineral surfaces or colloids, or exported under dynamic hydrological conditions[54−56]. Large increases in SOC or MAOC, therefore, do not require parallel increases in dissolved carbon.
The temporal synthesis in Fig. 7 suggests that elevated MBC is best viewed as a transient pulse, especially within 1–3 years, reflecting intensified microbial processing rather than a sustained expansion of stable carbon pools. DOC can increase through desorption, pH-mediated release, or microbial activation, but it can also decline through sorption, mineral fixation, leaching, or consumption[21,55,56]. DOC and MBC are therefore useful for interpreting the pathway from carbon input through microbial processing to mineral fixation, but they cannot replace direct evidence from MAOC. Future meta-analyses should revisit these indicators as reporting improves.
Several limitations should be noted. First, although size-based and density-based fractionation methods were grouped within a common POC–MAOC framework, differences in operational definitions among studies likely contributed to residual heterogeneity. Second, some subgroups, especially wetlands, forests, and longer-term field studies, were represented by relatively few comparisons. These patterns should therefore be interpreted as directional rather than general. Third, long-term field evidence remains limited, which restricts our ability to assess whether early increases in POC are consistently followed by increases in MAOC. Fourth, reporting of ROC and related labile fractions was limited and inconsistent across studies, which prevented a formal synthesis. Finally, although Fig. 6 was re-evaluated using study-level mixed-effects meta-regression, the paired dataset for relationships among pools remained limited. The patterns in Fig. 6 should therefore be interpreted as comparative evidence across studies, rather than as a direct mechanistic test.
-
In this meta-analysis, we found that biochar-driven increases in SOC were associated more with rapid accumulation of POC than with comparable increases in MAOC. This result suggests that larger SOC stocks should not be interpreted as evidence of stronger long-term stabilization. Bulk SOC is therefore best treated as a preliminary indicator, whereas claims of long-term benefits should be supported by fraction-specific evidence, particularly MAOC. Biochar responses were further shaped by feedstock type, pyrolysis temperature, climate, ecosystem type, amendment regime, and mineral protection capacity. Overall, the practical value of biochar depends not only on whether it increases soil carbon, but also on whether site conditions favor the processing and retention of that carbon in more persistent forms.
-
The authors confirm their contributions to the paper as follows: data collection and writing: Peng S, Zhang X; review and editing: Han X, Liu N; supervision and project administration: Duan B. All authors reviewed the results and approved the final version of the manuscript.
-
The datasets generated and/or examined during this study are available from the corresponding author upon reasonable request.
-
The study received funding from the National Key R&D Program of China (2024YFF1306502) and the Integrated Scientific Expedition Project of Huanglong Nature Reserve (N5132112023000495).
-
The authors declare that they have no known competing financial interests or personal relationships that could have appeared to influence the work reported in this paper.
-
accompanies this paper online at: https://doi.org/10.48130/fra-0026-0006.
- Supplementary Table S1 Included studies (k = 26) and outcomes contributed to the quantitative synthesis.
- Supplementary Table S2 Outcome-specific heterogeneity statistics and funnel-plot asymmetry results.
- Supplementary Table S3 Publication-bias diagnostics (funnel plots, Egger test, and trim-and-fill).
- Supplementary Table S4 Sensitivity analysis excluding comparisons where SD was imputed as 10% of the mean.
- Supplementary Fig. S1 Simplified PRISMA flow diagram for study selection and quantitative synthesis.
- Supplementary Fig. S2 Funnel plot for SOC.
- Supplementary Fig. S3 Funnel plot for POC.
- Supplementary Fig. S4 Funnel plot for MAOC.
- Supplementary Fig. S5 Funnel plot for DOC.
- Supplementary Fig. S6 Funnel plot for MBC.
- Supplementary Fig. S7 Funnel plot for MAOC/SOC.
- Supplementary Fig. S8 Funnel plot for POC/SOC.
- Copyright: © 2026 by the author(s). Published by Maximum Academic Press, Fayetteville, GA. This article is an open access article distributed under Creative Commons Attribution License (CC BY 4.0), visit https://creativecommons.org/licenses/by/4.0/.
-
About this article
Cite this article
Peng S, Zhang X, Han X, Liu N, Duan B. 2026. Factors influencing biochar impacts on MAOC and POC: the significance of feedstock, pyrolysis temperature, climate, and application methodology. Forestry Research Advances 1: e009 doi: 10.48130/fra-0026-0006 

Factors influencing biochar impacts on MAOC and POC: the significance of feedstock, pyrolysis temperature, climate, and application methodology
- Received: 09 March 2026
- Revised: 16 April 2026
- Accepted: 29 April 2026
- Published online: 24 July 2026
Abstract: Biochar generally increases bulk soil organic carbon (SOC), but it remains unclear whether that increase is retained mainly as particulate organic carbon (POC) or as mineral-associated organic carbon (MAOC), and thus whether larger SOC stocks indicate stronger long-term stabilization. We conducted a random-effects meta-analysis of 26 studies (364 paired comparisons) to quantify biochar effects on SOC, POC, MAOC, allocation ratios (POC/SOC and MAOC/SOC), and the labile indicators dissolved organic carbon (DOC), and microbial biomass carbon (MBC). We also tested whether responses varied with feedstock, pyrolysis temperature, climate, ecosystem type, application rate, and duration. Biochar increased SOC by 65.8% (95% CI: 34.7%–104.0%), but the increase was driven mainly by a much larger rise in POC (136.1%; 93.3%–188.3%) than in MAOC (42.9%; 32.0%–54.8%). DOC increased by 22.9% (10.4%–36.8%), whereas the overall MBC response was positive, but not significant. Woody feedstocks and biochars produced above 500 °C were more strongly associated with larger increases in MAOC, whereas manure-derived biochars were more closely linked to short-term POC accumulation. SOC and SOC-fraction responses were generally larger in tropical and subtropical regions and in wetlands than in temperate systems. Overall, biochar more consistently promoted rapid particulate-C accumulation than mineral-associated retention. Bulk SOC should therefore be treated as a preliminary indicator rather than direct evidence of stabilization, and claims of long-term benefits should be supported by fraction-specific evidence, particularly MAOC, under the site conditions in which biochar is applied.