











-
Greenhouse gas emissions occupy a central position in the climate challenge because they translate everyday patterns of production, consumption, and land use into a sustained disruption of Earth’s energy balance. Scientific understanding has evolved from early physical explanations of the greenhouse effect to integrated Earth system frameworks that link atmospheric chemistry, ocean circulation, terrestrial ecosystems, and feedback dynamics. Within this framework, carbon dioxide, methane, and nitrous oxide are recognized as interacting drivers of radiative forcing whose combined effects shape both near-term warming and long-run climate stability[1−4]. Empirically, atmospheric carbon dioxide concentrations have risen from about 280 μmol/mol in the preindustrial era to over 420 μmol/mol in the early 2020s, while methane concentrations have more than doubled over the same period, underscoring the cumulative and multi-gas nature of anthropogenic warming. Despite periodic debate around attribution, the contemporary literature converges on the conclusion that recent global warming is overwhelmingly driven by human greenhouse gas emissions, with natural variability acting primarily as a modulating influence rather than an alternative explanation[5−8].
As a result, the core challenge has shifted from attribution to governance. The central question is no longer whether greenhouse gases drive climate change, but how emissions are generated, measured, reported, and regulated across sectors and jurisdictions. Global inventories estimate that total anthropogenic greenhouse gas emissions now exceed 50 Gt CO2-equivalent per year, yet substantial uncertainty remains for non-energy sources such as soils, wastewater, and diffuse methane emissions[9]. Differences in reporting standards, incomplete sector coverage, and systematic underrepresentation of biologically mediated fluxes can distort mitigation priorities and obscure high-impact sources, particularly for methane and land-based emissions[10,11]. Even where national inventories exist, persistent constraints remain, including uncertainty in flux estimation, weak treatment of soil carbon, and limited verification capacity, all of which affect the credibility of mitigation targets and carbon market mechanisms[12−14].
These emissions also intersect directly with human welfare systems, linking climate dynamics to health outcomes, food security, and economic stability. Climate change poses substantial health risks through heat exposure, extreme weather, infectious diseases, and related environmental pathways, with risks expected to increase as warming intensifies[15,16]. At the same time, mitigation actions in energy, transport, and waste systems often generate measurable co-benefits, including reduced air pollution, lower health expenditures, and improved productivity[17,18]. These interactions are particularly salient in African contexts, where per capita emissions remain low, but vulnerability to climate impacts is high. In Nigeria, for example, emissions from transport systems, gas flaring, and rapidly growing urban energy demand intersect directly with livelihoods, institutional capacity, and environmental justice concerns, making mitigation inseparable from broader development governance challenges[19−22].
Beyond energy-sector CO2 emissions, substantial measurement and accounting challenges remain for diffuse and biologically mediated greenhouse gas sources. Agricultural soils are a major anthropogenic source of nitrous oxide, but estimates vary with nitrogen inputs, soil moisture, organic amendments, climate, management practices, and the emission factors applied[23,24]. Wastewater and sanitation systems emit methane and nitrous oxide through treatment, conveyance, storage, and disposal processes; decentralized and non-sewered systems may be poorly represented where activity data and locally appropriate emission factors are unavailable[25]. Reservoir surfaces also release measurable methane and carbon dioxide, although gross surface fluxes must be distinguished from natural background emissions and the anthropogenic increment attributable to reservoir creation and management[26]. Land-based mitigation introduces a related accounting problem because terrestrial carbon sinks are neither uniform nor necessarily permanent. Climate stress, land-use change, drought, wildfire, and other disturbances can reduce sequestration or reverse previously accumulated carbon gains[27−29]. Against this background, this structured integrative review examines how coverage, measurement, parameterization, attribution, boundary, and reporting or verification gaps affect mitigation priorities and the credibility of net-zero greenhouse gas targets. It addresses three questions: (1) which accounting gaps are documented across major gases and sectors; (2) how these gaps affect the identification and prioritization of mitigation opportunities; and (3) which measurement, monitoring, reporting, verification, and governance interventions can improve the credibility of multi-gas net-zero strategies?
-
This study employed a narrative literature review with thematic synthesis to examine greenhouse gas emissions, sectoral sources, accounting gaps, mitigation priorities, and implications for net-zero credibility. This approach was appropriate because the evidence base was methodologically diverse, comprising empirical studies, reviews, international assessments, emissions inventories, institutional reports, authoritative datasets, and policy literature. Differences in gas coverage, sectoral boundaries, geographic scale, measurement methods, climate metrics, and analytical objectives precluded direct statistical pooling. The review was guided by established principles of narrative literature review, which support transparent but flexible literature identification and interpretive synthesis of heterogeneous evidence to identify patterns, methodological differences, and knowledge gaps[30−32].
Literature identification and selection
-
Relevant literature was identified iteratively through Scopus, Web of Science, Google Scholar, publisher platforms, and backward citation searching of key studies and international assessments. Searches combined greenhouse gas terms with concepts related to gases, sectors, accounting, mitigation, monitoring, and sustainable development. Examples included 'greenhouse gas emissions' with 'sectoral sources' or 'emissions accounting'; 'carbon dioxide', 'methane', or 'nitrous oxide' with 'mitigation'; and sector-specific terms such as 'agriculture', 'wastewater', 'sanitation', 'inland waters', 'energy', and 'waste'.
The search was purposive and iterative rather than exhaustive, with terms refined as relevant themes emerged. No formal publication-year restriction was applied, although recent studies were prioritized where they reflected advances in measurement, inventory methods, monitoring technologies, mitigation strategies, or climate policy. Sources were included when they provided substantive empirical, analytical, methodological, emissions, or policy-relevant evidence on greenhouse gas sources, accounting, mitigation, environmental and development implications, or governance. Sources with limited relevance or analytical contribution were excluded. The final evidence base comprised 83 substantive sources, including peer-reviewed publications, international assessments, institutional reports, emissions inventories, authoritative datasets, and three methodology publications, which were used to guide the narrative review design, giving a total bibliography of 86 references.
Data organization and narrative synthesis
-
Evidence was organized by greenhouse gas, emission sector, geographic context, methodological approach, accounting issue, principal finding, and mitigation or monitoring implication. Attention was given to carbon dioxide, methane, and nitrous oxide and to sectors with recurring measurement or accounting uncertainty, including energy, agriculture and managed land, wastewater and sanitation, solid waste, fossil-fuel infrastructure, and reservoirs and inland waters. The evidence was synthesized narratively and thematically to identify recurring patterns, areas of agreement and disagreement, and methodological uncertainties. The analysis focused on recurrent accounting limitations, including incomplete source coverage, measurement constraints, generalized emission factors, attribution difficulties, inconsistent system boundaries, and weaknesses in reporting and verification. Quantitative estimates were compared descriptively where useful but were not statistically pooled because studies differed in geographic scale, accounting boundaries, gas coverage, climate metrics, study periods, and estimation methods. Numerical findings were therefore interpreted within their original methodological contexts.
Interpretation and methodological limitations
-
The synthesis assessed how accounting gaps influence the visibility of emission sources, mitigation priorities, and the credibility of net-zero claims. Greater interpretive weight was given to findings supported by multiple studies or corroborated by authoritative assessments and emissions inventories. Differences between estimates were considered in relation to measurement methods, emission factors, geographic conditions, and inventory boundaries. Because this was a narrative rather than protocol-driven systematic review, no meta-analysis or formal risk-of-bias assessment was conducted. Complete database-specific search histories, retrieval counts, duplicate-removal records, screening numbers, and independent reviewer assessments were also unavailable. The findings should therefore be interpreted as a thematic synthesis rather than an exhaustive systematic assessment. Nevertheless, the use of multiple databases, authoritative inventories, international assessments, and sector-specific studies provided a sufficiently broad evidence base to identify recurring accounting gaps and their implications for mitigation and net-zero governance, as shown in Table 1.
Table 1. Summary of the narrative review methodology
Component Method used Review design Narrative literature review with thematic synthesis Literature sources Scopus, Web of Science, Google Scholar, publisher platforms, and backward citation searching Selection approach Purposive and iterative; sources retained for substantive empirical, analytical, methodological, emissions, or policy relevance Evidence base 83 substantive sources, including journal articles, international assessments, reports, inventories, and authoritative datasets Synthesis Evidence organized by gas, sector, geography, methodology, accounting issue, and key finding, then synthesized narratively and thematically; no statistical pooling was undertaken Methodological limitation No formal risk-of-bias assessment or complete systematic-search and screening record was retained -
Global greenhouse gas emissions continued to increase in 2024. The Emissions Database for Global Atmospheric Research (EDGAR) estimated total anthropogenic emissions at 53.2 Gt CO2-eq, representing an increase of 1.3%, or approximately 665 Mt CO2-eq, from 2023[33]. This estimate excludes land use, land-use change, and forestry (LULUCF). EDGAR converts methane, nitrous oxide, and fluorinated gases into CO2-equivalent values using the 100-year global warming potential factors applied in its inventory (GWP100)[33]. The resulting percentages represent shares of annual GWP100-weighted emissions rather than each gas’ contribution to observed warming. Within this excluding-LULUCF boundary, fossil CO2 accounted for 74.5% of global emissions in 2024, followed by methane at 17.9%, nitrous oxide at 4.8%, and fluorinated gases at 2.8%[33]. Between 1990 and 2024, fossil CO2 emissions increased by 74.9%, methane emissions by approximately 30%, nitrous oxide emissions by 34%, and fluorinated gas emissions by approximately 310%[33]. Apart from temporary declines in 2009 and 2020, EDGAR records a sustained increase in global emissions during the 21st century, driven mainly by rising fossil CO2 emissions in emerging and developing economies[33].
The International Energy Agency (IEA) applies a narrower accounting boundary focused on energy-related CO2[34]. Under this framework, energy-related CO2 emissions reached 37.8 Gt CO2 in 2024, an increase of 0.8% from 2023. Emissions from fuel combustion increased by approximately 357 Mt CO2, whereas emissions from industrial processes declined by approximately 62 Mt CO2[34]. The IEA estimate should not be combined directly with the EDGAR multi-gas total because the two datasets differ in gas coverage and sectoral boundaries. Global economic output increased by approximately 3.2% in 2024, indicating a reduction in CO2 emissions intensity relative to economic activity but not an absolute decline in emissions[34]. Global mean atmospheric CO2 concentration reached approximately 422.5 μmol/mol in 2024, about 3 μmol/mol higher than in 2023 and approximately 50% above the preindustrial level[34]. Atmospheric concentration reflects the cumulative balance between CO2 emissions and removals rather than emissions from a single year. Oceans and terrestrial ecosystems absorb only part of annual anthropogenic CO2 emissions, allowing the remainder to accumulate in the atmosphere[9]. Under current emission trajectories, the remaining carbon budget associated with limiting warming to 1.5 °C is being rapidly depleted[9].
The United Nations Environment Programme (UNEP) projects warming of approximately 2.3–2.5 °C by 2100 if current Nationally Determined Contributions are fully implemented and approximately 2.8 °C under current policies[35]. UNEP attributed approximately 0.1 °C of the improvement from its previous assessment to methodological updates rather than stronger national commitments. At the time of the assessment, UNEP also estimated that the announced withdrawal of the US from the Paris Agreement would offset approximately 0.1 °C of the projected improvement[35]. Figure 1 presents the percentage distribution of the 2024 total value across the ten highest-ranking countries and the rest of the world. The Rest of the World accounts for the largest combined share at 32.99%, followed closely by China at 29.97%. The US contributes 11.40%, while India represents 8.43% and Russia 4.97%[33].
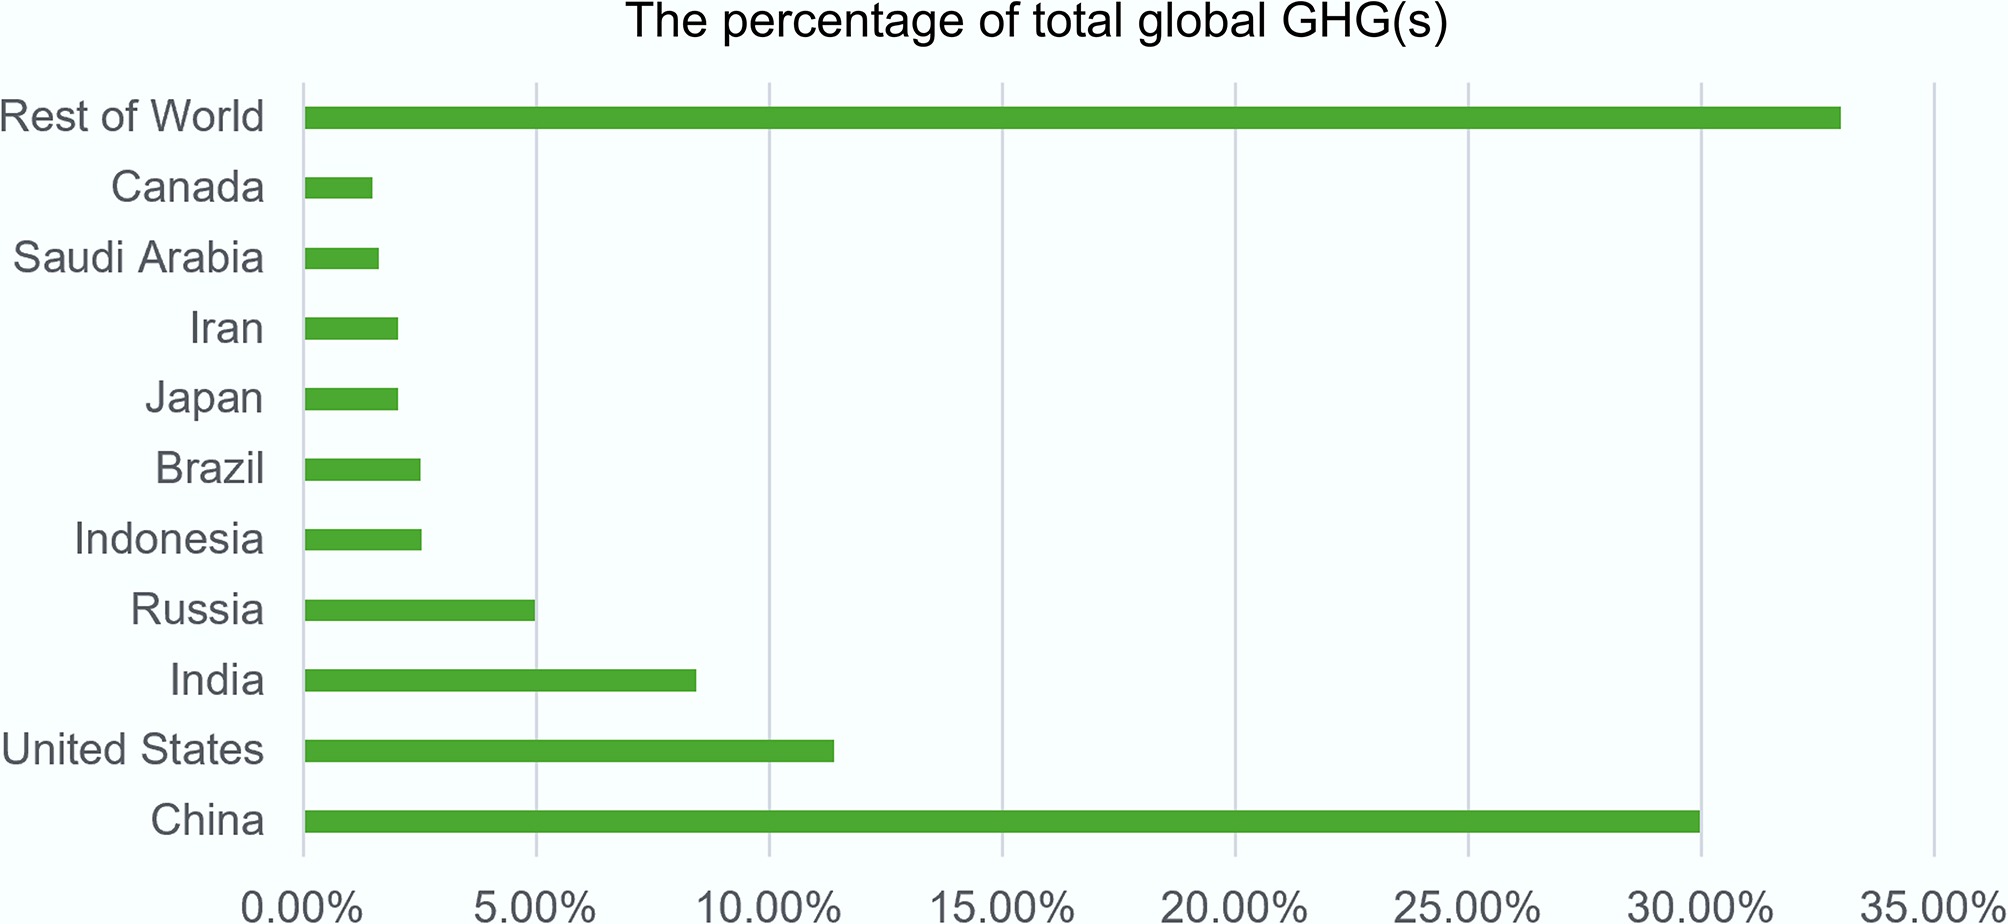
Figure 1.
Distribution of 2024 values among the top 10 countries and the rest of the world. Source: adapted from Crippa et al.[33].
Table 2 shows that the power industry is the dominant emissions sector in most of the top 20 emitting countries. China’s power industry alone represents approximately 12.82% of global emissions, making it by far the largest country-sector contribution. Transport is the leading sector in the US, while agriculture is particularly important in Brazil and Pakistan. Fuel exploitation is the largest sector in Iran, Canada, and Iraq. This distribution highlights the dominant role of major emitting economies in global greenhouse gas emissions and underscores the importance of targeted mitigation efforts in the highest-emitting countries.
Table 2. Leading emission sector in the top 20 emitting countries, 2024
Country Emission sector 2024 value Global total (%) China Power industry 6,646.88 12.82% USA Transport 1,702.83 3.28% India Power industry 1,532.63 2.96% Russia Power industry 854.99 1.65% Indonesia Power industry 353.49 0.68% Brazil Agriculture 633.99 1.22% Japan Power industry 435.64 0.84% Iran Fuel exploitation 234.61 0.45% Saudi Arabia Power industry 279.16 0.54% Canada Fuel exploitation 212.26 0.41% Mexico Power industry 155.49 0.30% Germany Power industry 173.10 0.33% South Korea Power industry 267.21 0.52% Australia Power industry 163.92 0.32% Viet Nam Power industry 202.24 0.39% Türkiye Power industry 143.66 0.28% South Africa Power industry 233.54 0.45% Pakistan Agriculture 261.24 0.50% Thailand Power industry 90.23 0.17% Iraq Fuel exploitation 199.48 0.38% Adapted from Crippa et al.[33]. Sectoral patterns in inventory coverage and uncertainty
-
The EDGAR total of 53.2 Gt CO2-eq does not show how inventory coverage and uncertainty differ among sectors[33]. Agricultural soils are a major anthropogenic source of nitrous oxide, but estimates vary with nitrogen inputs, soil moisture, organic amendments, climate, management practices, and the emission factors applied[23,24]. Global fertilizer datasets provide activity data for agricultural inventories, but they do not capture local differences in soil conditions, management, or nitrogen-use efficiency[23,36,37]. European inventory assessments have also identified inconsistent treatment of soil carbon, affecting comparisons of land-sector emissions and removals among countries[13].
Reservoir studies report methane and carbon dioxide fluxes from water surfaces, but gross surface fluxes must be separated from natural background emissions and the anthropogenic increment associated with reservoir construction and management[26]. Wastewater and sanitation systems emit methane and nitrous oxide through treatment, conveyance, storage, and disposal processes, while decentralized and non-sewered systems may be poorly represented where infrastructure and activity data are incomplete[25]. Facility-level measurements further show that emissions vary with treatment technology, operating conditions, oxygen availability, and wastewater characteristics[25,38−40]. Global methane-budget estimates documented continued growth in anthropogenic methane emissions during 2000–2017, including emissions from energy and waste sources[41].
-
Emission drivers and accounting boundaries differ among energy supply, transport, industry, buildings, agriculture, land use, and waste systems[14]. Cross-country comparisons can be affected when territorial inventories record emissions produced within national borders but exclude emissions embodied in imported electricity, food, cement, steel, and manufactured goods[14,42]. Consequently, a decline in territorial emissions may coincide with the displacement of emissions through international trade rather than an equivalent reduction in the associated consumption footprint[14,42]. Cities illustrate this boundary problem because urban energy use, transport, buildings, infrastructure, and consumption connect locally emitted greenhouse gases with emissions occurring outside municipal boundaries[43]. Territorial city inventories quantify direct emissions within the reporting area, whereas consumption-based approaches also attribute emissions embodied in imported goods, electricity, and services[14,43]. Differences between these approaches can change the apparent contribution of urban sectors and the mitigation measures prioritized by local governments[14,43]. Corporate and national inventories also differ in source coverage, methodological assumptions, and verification practices, limiting comparability between reported reductions[10,11]. Methane estimates are particularly sensitive to the treatment of intermittent leaks and high-emitting facilities, while land-sector estimates depend on the boundaries used for emissions, removals, and soil-carbon changes[13,41].
Figure 2 shows that greenhouse gas emissions by sector in 2024 are highly concentrated among a relatively small number of countries. China is the largest contributor, accounting for approximately 30% of global emissions, followed by the US at 11.4% and India at 8.4%. Together, these three countries contribute nearly half of the global total. The top 20 countries collectively account for about 78% of emissions, while the rest of the world contributes approximately 22%.
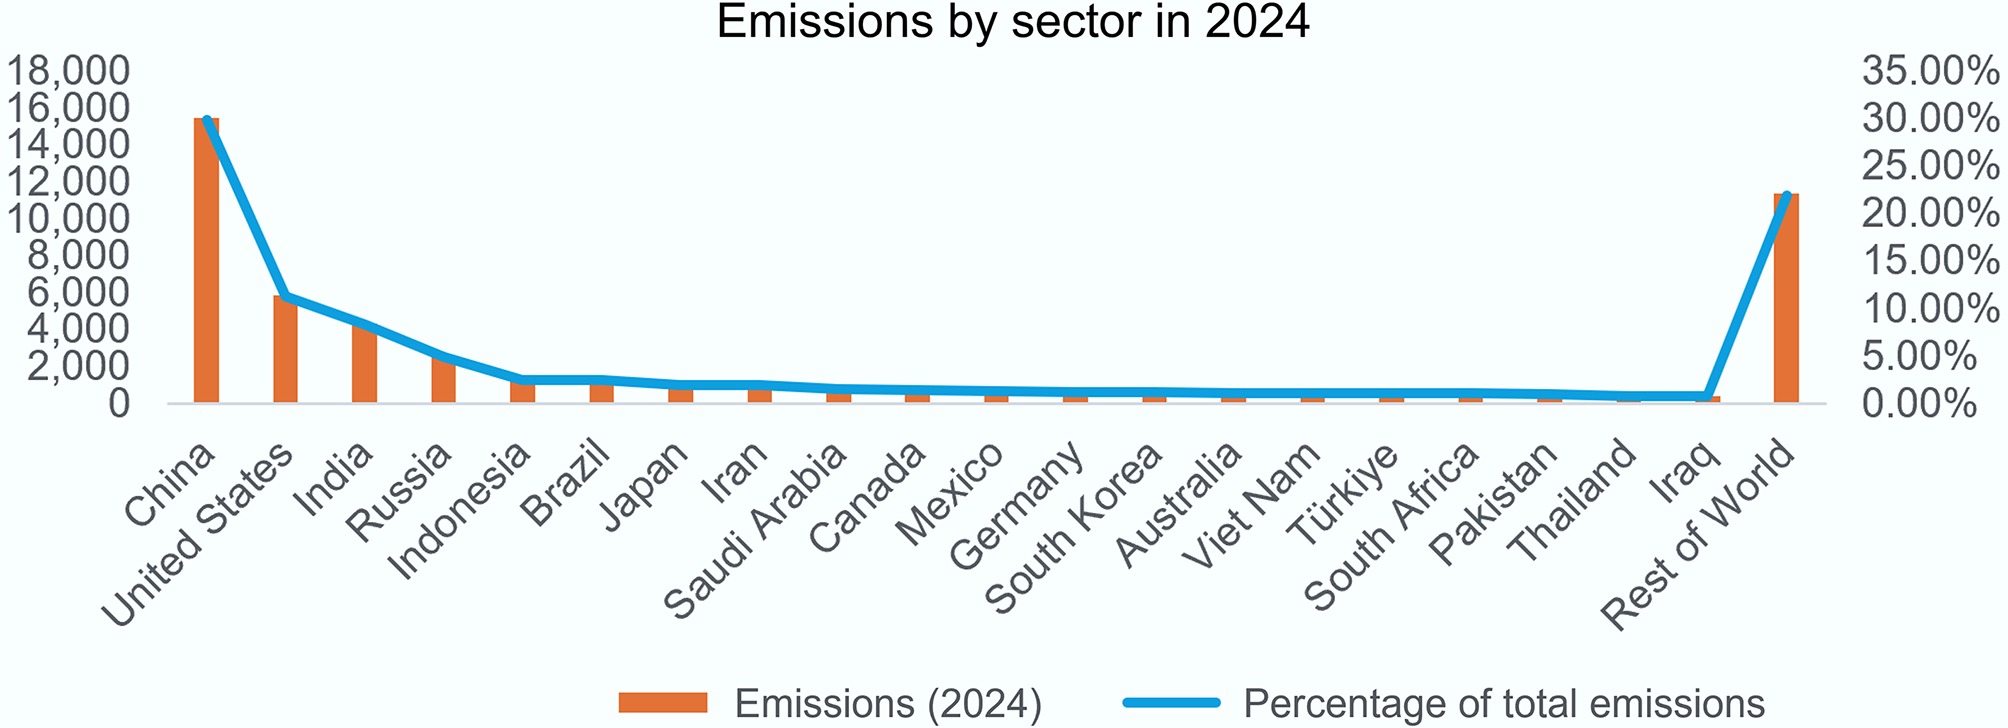
Figure 2.
Global sector greenhouse gas emissions. Adapted from Crippa et al.[33].
Agriculture and land systems
-
Agricultural greenhouse gas estimates are strongly influenced by biological processes and management conditions. Agricultural soils constitute a major anthropogenic source of nitrous oxide, primarily through nitrification and denitrification following nitrogen inputs[24]. Emission rates vary with fertilizer type and application rate, soil moisture, temperature, organic amendments, crop type, and management practices[23]. Flooded rice systems are also an important agricultural source of methane because anaerobic soil conditions promote methanogenesis[9]. Variation among production systems limits the accuracy of uniform emission factors. A global meta-analysis found that nitrous oxide emission factors following organic amendments differed according to amendment characteristics, soil conditions, and management context[44]. Inventories based primarily on generalized emission factors may therefore fail to represent differences among locations and management systems[23,44]. Field measurements are needed to evaluate mitigation practices such as improved fertilizer timing and placement, nitrification inhibition, residue management, and water control under locally relevant conditions[23,24].
Agricultural mitigation also interacts with production, land use, and climate variability. Cross-country analysis has identified relationships among agricultural production, greening indicators, greenhouse gas emissions, and climate variability, indicating that changes in production intensity do not produce uniform emission outcomes[45]. Dynamic computable general equilibrium modeling further indicates that agricultural production and greenhouse gas emissions are closely linked to material inputs and production patterns, highlighting the importance of improved input-use efficiency, manure management, and low-carbon farming practices[46]. In African agricultural systems, mitigation options must also be evaluated in relation to food production, technology access, implementation costs, and smallholder livelihoods[47]. These factors require reporting of both absolute sectoral emissions and emission intensity per unit of agricultural output. Land-sector accounting introduces additional uncertainty because inventories must distinguish annual emissions, carbon-stock changes, removals, and the durability of stored carbon. An assessment of European national inventories identified soil carbon as a persistent reporting weakness and documented differences in how countries represent soil-carbon changes[13].
Forest mitigation estimates are also affected by drought, heat, wildfire, and other climate-driven disturbances that can reduce carbon uptake or release previously stored carbon[27]. Terrestrial carbon exchange varies with climate, atmospheric CO2, ecosystem structure, and disturbance, preventing the use of a single stable sink baseline across regions and time periods[29]. Experimental and modeling studies further show that ecosystem greenhouse gas budgets can change as environmental conditions and vegetation composition shift. Elevated atmospheric CO2 can modify exchanges of carbon dioxide, methane, and nitrous oxide, although the direction and magnitude of the response differ among ecosystems[48]. Earth-system projections remain sensitive to uncertainty in ecological responses and feedback[49]. Gu et al.[50] also reported greater soil greenhouse gas emissions associated with invasive C4 plants than with C3 plants in the ecosystems examined. These findings support the use of repeated measurements and periodically updated baselines when land-sector removals are included in net-zero accounting.
Wastewater and non-sewered sanitation
-
Wastewater and sanitation systems emit methane and nitrous oxide through conveyance, treatment, containment, storage, sludge management, and disposal processes[25]. Measurements at municipal wastewater-treatment plants have identified methane emissions from dissolved methane, anaerobic zones, sludge handling, and other process stages where methane is produced but not captured[38]. Long-term monitoring has also shown that methane and nitrous oxide emissions vary over time and among treatment stages, limiting the representativeness of short measurement campaigns and uniform emission factors[39]. Nitrous oxide formation depends on the microbial pathways involved in nitrification and denitrification. Oxygen availability, nitrogen loading, temperature, nitrite accumulation, and process configuration influence both the magnitude and timing of emissions[40,51]. Plant-wide assessments further demonstrate that changes intended to improve nutrient removal can alter energy use, effluent quality, operating costs, and greenhouse gas emissions[52,53].
Non-sewered sanitation presents a separate coverage problem. A meta-analysis identified measurable greenhouse gas emissions from pit latrines, septic tanks, and other non-sewered systems and found that their exclusion can affect sanitation-sector estimates in regions where decentralized containment is widespread[54]. Emissions from these systems vary with technology, containment time, emptying practices, sludge treatment, and final disposal[25]. Field studies have measured methane, carbon dioxide, and nitrous oxide emissions from septic and blackwater systems, confirming that decentralized infrastructure creates spatially distributed sources that are not represented adequately by treatment-plant data alone[55,56]. Satellite observations have also identified urban methane enhancements associated with areas containing substantial untreated wastewater[57]. Such observations can locate possible emission hotspots but do not independently determine the proportion attributable to wastewater rather than landfills, fossil-fuel infrastructure, or other urban sources. Inventory improvement therefore requires activity data covering both sewered and non-sewered populations, locally appropriate emission factors, measurements across complete treatment and disposal chains, and source-level verification of remotely detected methane hotspots[25,54,57].
Reservoir and inland-water fluxes
-
Reservoirs release carbon dioxide and methane through diffusion, ebullition, and degassing associated with water passing through turbines, spillways, and downstream channels[26,58]. Emission rates vary with reservoir age, latitude, climate, water depth, organic-matter availability, nutrient inputs, and measurement method[26,58,59]. Barros et al.[59] reported higher carbon emissions from younger reservoirs and reservoirs in warmer regions, while Deemer et al.[26] documented substantial variation among reservoir types and geographic settings. Measured reservoir-surface emissions represent gross fluxes rather than the net climatic effect attributable to impoundment. Estimating the anthropogenic increment requires comparison between post-impoundment emissions and the emissions and carbon uptake that would have occurred in the pre-impoundment landscape and river system[58,60]. Carbon burial within reservoir sediments must also be considered when estimating the net carbon balance rather than atmospheric emissions alone[58]. The IPCC inventory framework[61] distinguishes land converted to flooded land from flooded land remaining flooded and applies different methods according to reservoir age and greenhouse gas. Allocation presents an additional accounting issue for multipurpose reservoirs. Reservoir emissions may be associated with electricity generation, irrigation, drinking-water supply, navigation, or flood control, and the allocation method can change the reported carbon intensity of hydropower[60,62]. Hydropower life cycle estimates also vary depending on whether they report gross surface emissions, net emissions relative to the pre-impoundment baseline, or emissions per unit of electricity generated[60,62].
Energy- and waste-sector methane: inventory underestimation and verification
-
Methane emissions from fossil-fuel production, processing, transmission, storage, and waste disposal are difficult to quantify because releases may be intermittent, spatially concentrated, or associated with a small number of high-emitting facilities. Global methane-budget assessments identify fossil-fuel systems and waste management as major anthropogenic methane sources but also report substantial uncertainty in their estimated magnitudes[41]. Studies of the US oil and gas supply chain have documented differences between bottom-up inventories and independent measurements. Alvarez et al.[63] combined facility-scale measurements and synthesis methods and estimated supply-chain methane emissions above the corresponding inventory estimate. Measurements of natural-gas transmission and storage infrastructure also identified equipment- and facility-level variation that is difficult to represent using uniform emission factors[64]. Rutherford et al.[65] found that production inventories underestimated emissions where abnormal operating conditions and high-emitting sites were not represented adequately. Aerial measurements across a large sample of oil and gas facilities further showed that emissions were concentrated among a comparatively small proportion of high-emitting sites[66].
Landfills present a related monitoring problem because methane generation varies with waste composition, landfill age, moisture, gas-collection efficiency, and operating conditions. Satellite-based analysis of US landfills identified persistent methane sources and temporal trends that were not fully represented by conventional reporting approaches[67]. Remote observations can identify large plumes and recurrent hotspots, but facility inspections and operational data are required to determine the specific equipment, waste management practice, or failure responsible for each release[67]. Bottom-up inventories remain necessary for estimating emissions across facilities that are not continuously monitored, but their activity data and emission factors require periodic comparison with ground-based, aerial, and satellite observations[63,65,66]. Reconciliation of inventory estimates with independent measurements can distinguish routine emissions from abnormal events, identify high-emitting facilities, and direct leak detection, repair, and gas-capture measures toward the sources responsible for the largest observed releases[65,66].
Table 3 compares major sectors using a consistent gas-by-sector structure and identifies the accounting problem documented for each sector. EDGAR reports that fossil CO2, methane, nitrous oxide, and fluorinated gases represented 74.5%, 17.9%, 4.8%, and 2.8%, respectively, of global GWP100-weighted emissions in 2024, excluding LULUCF[33]. These percentages describe the composition of annual emissions and are not estimates of each gas’ contribution to observed warming. The sector studies apply different boundaries, measurement periods, and estimation methods; therefore, they do not provide a comparable global percentage of emissions omitted from inventories. Table 3 reports the documented direction and mechanism of each accounting gap rather than assigning unsupported global omission values[26,54,65].
Table 3. Sector-by-gas emission profiles, accounting gaps, and priority responses
Sector or system CO2 CH4 N2O F-gas Documented accounting gap and quantification status Priority mitigation and MRV response Ref. Energy supply and fossil-fuel systems Primary gas from fuel combustion, flaring, and energy use Fugitive emissions from production, processing, transmission, and storage Secondary combustion-related source Limited direct contribution Bottom-up estimates may underrepresent intermittent leaks, abnormal operating conditions, and high-emitting facilities. Measurement studies document underestimation, but the magnitude varies by region and infrastructure type Decarbonize energy supply; measure facility-level emissions; combine inventories with ground, aerial, and satellite observations; prioritize high-emitting sites [33,63−66] Industry Fuel- and process-related emissions, including cement and chemical production Source-specific process and fugitive emissions Emissions from nitrogen-related industrial processes Major source through refrigerants, electronics, and other industrial applications Facility coverage, process assumptions, refrigerant leakage, and inconsistent treatment of fluorinated gases affect comparability. No single global estimate of industrial undercounting is available in the reviewed evidence Electrification and efficiency; low-carbon process changes; refrigerant substitution and recovery; facility-level reporting and verification [9,33,34] Transport and buildings Primary gas from direct fuel use and purchased energy Smaller combustion and fuel-distribution contribution Smaller combustion-related contribution Refrigerant leakage from cooling and heat-pump systems Territorial inventories may exclude emissions embodied in imported electricity, fuels, construction materials, and services. Refrigerant leakage may be estimated using generalized equipment assumptions Electrification; energy efficiency; low-carbon electricity; refrigerant management; reporting of territorial and consumption-based boundaries [9,34,43] Agriculture and managed land Energy use, land-use change, and changes in soil and biomass carbon stocks Livestock, manure management, and flooded rice Managed soils, fertilizer use, manure, and crop residues Not a principal source in the reviewed agricultural evidence Uniform emission factors may not represent local soil, climate, amendments, or management. Soil-carbon estimates differ in coverage and treatment of emissions, removals, and permanence. No harmonized global omission percentage is available Improve nitrogen-use efficiency; use locally representative emission factors; manage livestock, manure, and rice systems; repeat soil-carbon measurements; report reversals and permanence risks [13,23,24,44] Wastewater and non-sewered sanitation Mainly biogenic CO2, with treatment-related energy emissions reported separately Treatment plants, sewers, septic tanks, pit latrines, and sludge systems Nitrification, denitrification, and nitrogen-rich effluent treatment Not a principal source Decentralized and non-sewered systems may be excluded where infrastructure and activity data are incomplete. Default factors may not represent technology or operating conditions. Available studies confirm non-negligible emissions but do not provide a harmonized global missing share Extend inventories across the complete sanitation chain; measure plant-level CH4 and N2O; improve process control; develop technology- and region-specific emission factors [25,38−40,54] Solid waste and landfills Mainly biogenic CO2, with operational energy reported separately Principal climate-relevant gas from anaerobic decomposition Minor or poorly characterized contribution Not a principal source Reported emissions depend on waste composition, landfill age, moisture, oxidation, and gas-capture efficiency. Satellite observations identify persistent hotspots that may not be represented fully by conventional reporting Reduce organic waste disposal; capture and use landfill gas; combine facility reporting with aerial and satellite verification; investigate persistent hotspots [41,67] Reservoirs and inland waters Gross surface fluxes, carbon burial, and changes relative to the pre-impoundment landscape Diffusion, ebullition, and downstream degassing Not evaluated consistently in the reviewed reservoir evidence Not applicable Gross surface fluxes cannot be equated directly with anthropogenic or inventory-accountable emissions. Estimates depend on the pre-impoundment baseline, reservoir age, measurement pathway, and allocation among reservoir services Report gross and net fluxes separately; establish pre-impoundment baselines; measure multiple emission pathways; disclose allocation to hydropower, irrigation, water supply, and flood control [26,58−62] MRV, monitoring, reporting, and verification. -
Greenhouse gas mitigation can reduce health risks associated with warming and fossil-fuel-related air pollution. European evidence links greenhouse gas emissions with adverse health outcomes, while reductions in combustion emissions can provide near-term air-quality benefits[16,68]. Healthcare systems also generate emissions through energy use, procurement, transport, and service delivery, making emissions management an operational and ethical concern[18]. Evidence from Kenya shows that healthcare decarbonization must also account for electricity reliability, service coverage, and resource constraints[69]. Accounting for land-based mitigation requires attention to the durability of carbon storage. Drought, wildfire, and ecosystem degradation can weaken terrestrial carbon sinks or reverse previously reported sequestration gains[27,29]. Ecosystem responses to elevated CO2 also vary by climate, vegetation, and nutrient availability, limiting the reliability of mitigation estimates based on fixed sequestration assumptions[48,49]. Food-system interventions affect emissions through agricultural production, land use, and consumption. Dietary shifts toward healthier patterns can reduce greenhouse gas emissions, although outcomes depend on production methods and resource requirements[70]. Changes in food demand may also alter land management and soil greenhouse gas emissions[71]. In Nigeria, agricultural mitigation must be assessed alongside food security, productivity, and livelihood objectives because climate exposure and development constraints influence the feasibility of particular interventions[22,47].
-
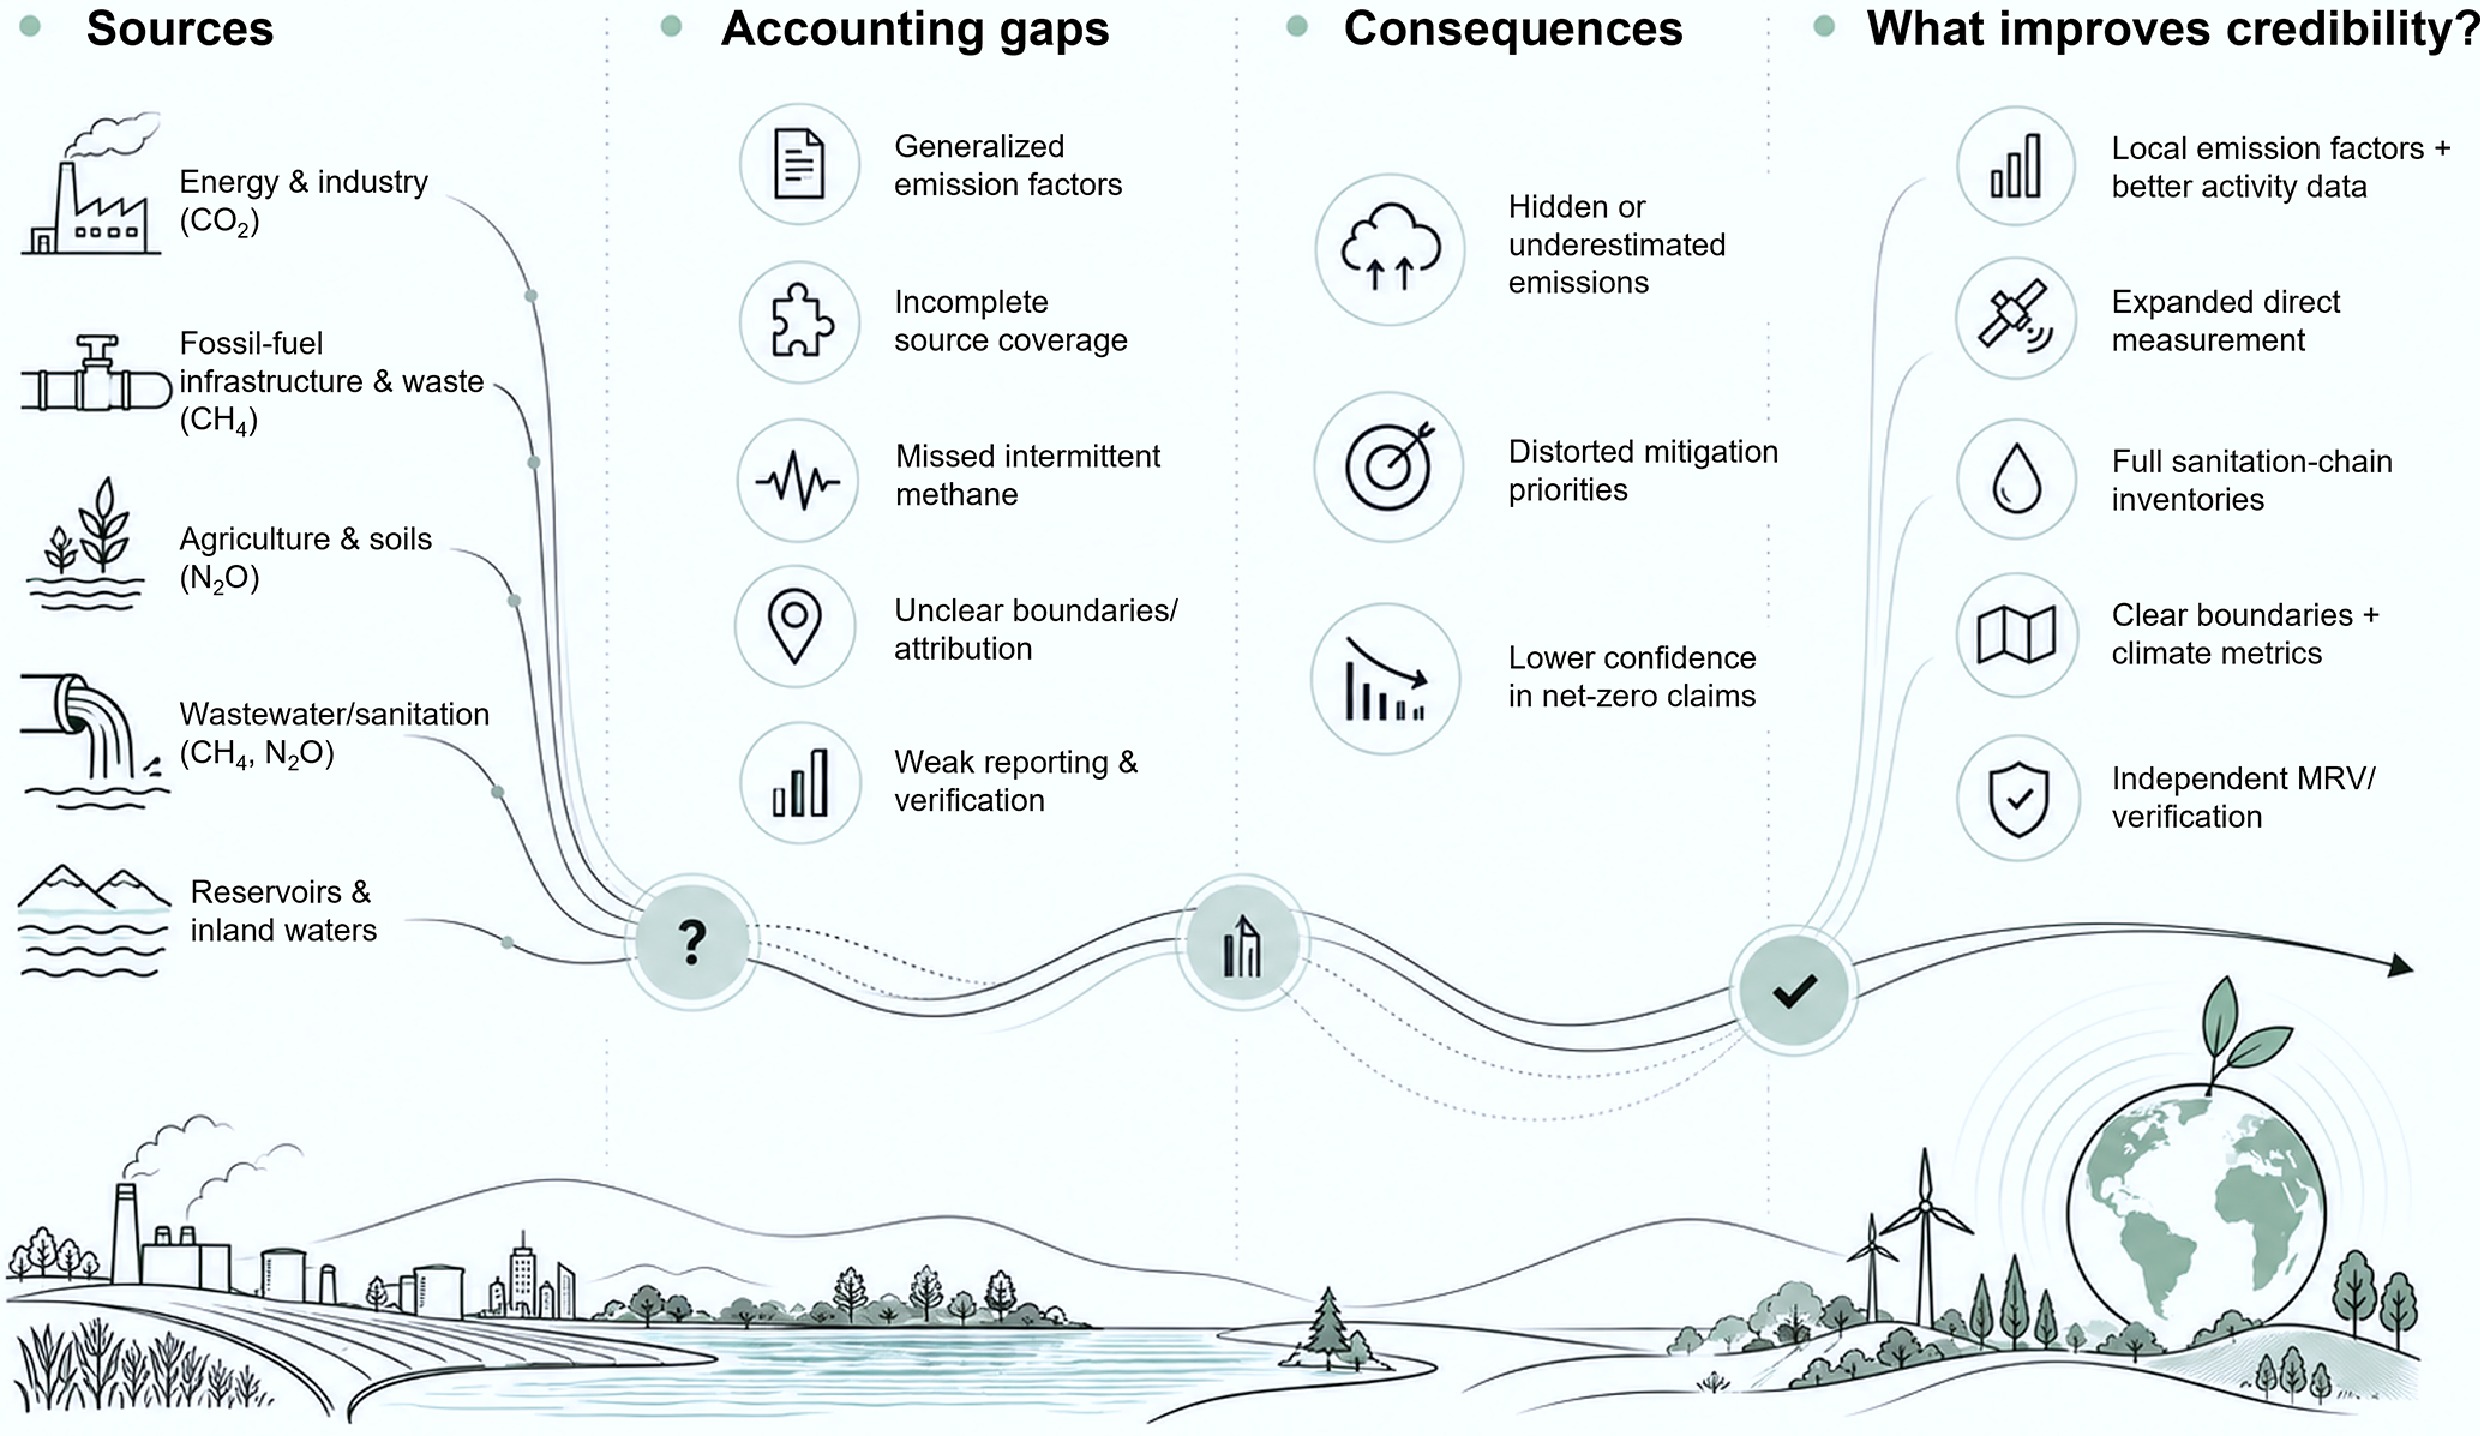
Technological innovation can support emissions reductions, but its effectiveness depends on appropriate policy incentives, investment, and deployment conditions[17,72,73]. Mitigation priorities should also reflect differences among gases and sectors. Carbon dioxide reductions require sustained energy and industrial transformation. Methane control can deliver comparatively rapid climate benefits, and nitrous oxide mitigation depends substantially on nitrogen and soil management[23,24,34,41]. Net-zero claims are credible only when inventories cover material sources and reported reductions can be verified. Machine-learning estimates of unreported corporate emissions and analyses of methane disclosures show that reported values may differ substantially from independently estimated emissions[10,11]. Similar limitations arise when land, inland-water, and other dispersed sources are represented by incomplete measurements or generalized emission factors[12,13]. Figure 3 illustrates the progression from major anthropogenic emission sources through greenhouse gas generation, measurement and accounting challenges, climate and development impacts, and mitigation responses. The figure emphasizes the interconnected nature of emissions production, monitoring, governance, and sustainable development outcomes.
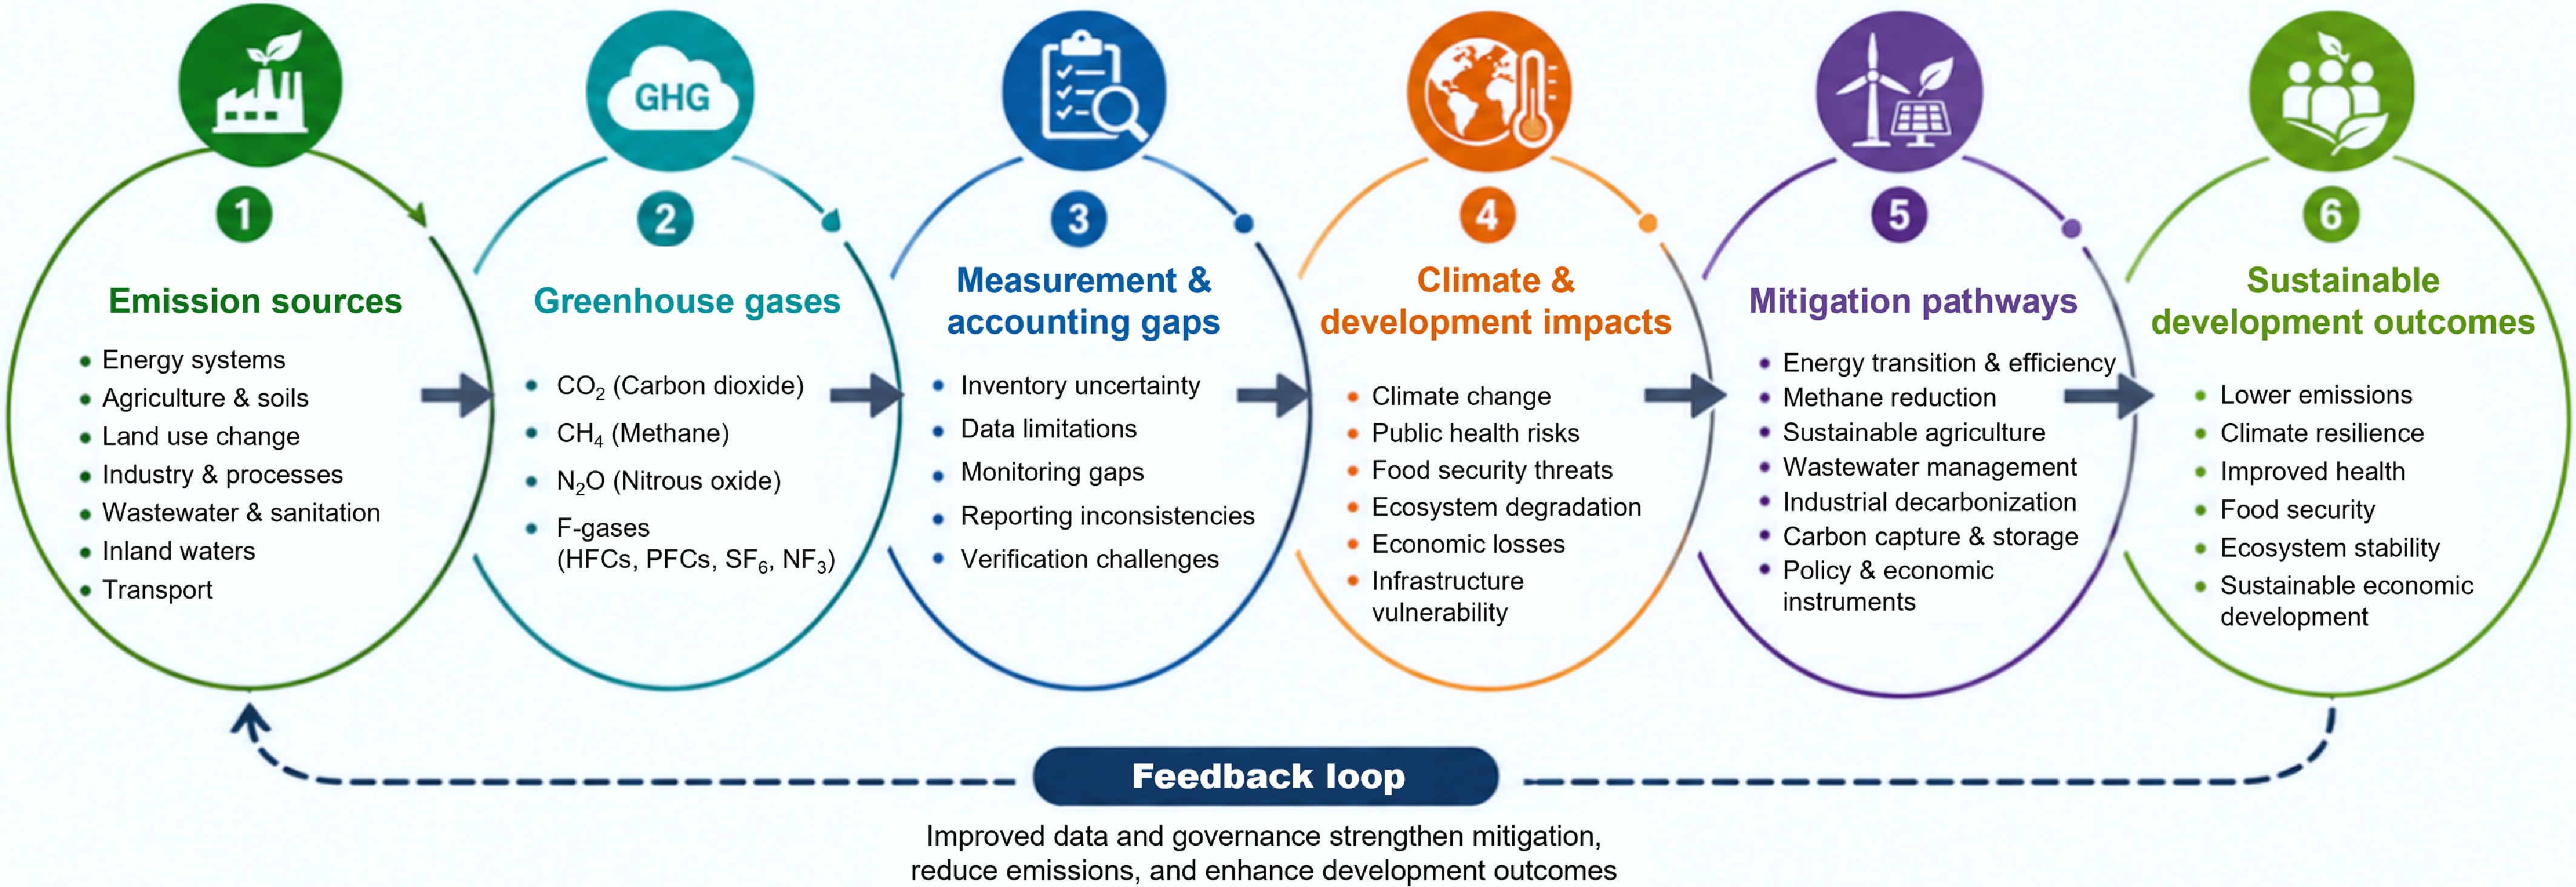
Figure 3.
Integrated framework of greenhouse gas sources, measurement gaps, climate impacts, and mitigation pathways.
Illustrative regional governance cases
-
The following cases illustrate how emissions profiles, accounting capacity, and mitigation priorities differ across governance contexts.
Kenya and Nigeria
-
Solar mini-grids in Kenya and Nigeria demonstrate how mitigation investments can support electricity access and local economic activity while reducing dependence on fossil-fuel generation[74,75]. Kenya has established statutory and institutional climate frameworks, although implementation remains constrained by coordination and enforcement capacity[76,77]. In Nigeria, transport fuel use, port operations, and gas flaring remain important mitigation and regulatory concerns[19,21,78]. Ambient measurements have also detected localized methane and carbon dioxide concentrations, but these observations require source attribution before they can be used to quantify inventory underestimation[79].
China, Russia, and the US
-
China’s emissions profile reflects extensive coal use, industrial production, and urban energy demand[33,34]. Progress toward China’s carbon-peaking and carbon-neutrality targets requires substantial reductions in unabated coal use, expansion of low-carbon electricity, and decarbonization of major energy-intensive sectors[9,80,81]. Russia’s fossil-fuel production and natural-gas infrastructure make methane leakage, flaring, and energy-related carbon dioxide central mitigation priorities. Its climate strategy also assigns an important role to forest carbon sinks, whose contribution depends on transparent baselines, monitoring, and treatment of disturbance risks[82−86]. Measurements from oil and gas infrastructure show that methane emissions can exceed estimates derived from conventional bottom-up inventories, particularly where high-emitting facilities or intermittent events are missed[63−66]. Satellite observations of landfill methane provide similar evidence that independent monitoring can identify persistent sources not fully represented in facility reporting[67].
-
The reviewed evidence identifies four recurring accounting gaps. First, generalized emission factors may not represent differences in soil, climate, nutrient inputs, and agricultural management[13,23,24,44]. Second, wastewater inventories may omit decentralized and non-sewered sanitation where infrastructure and activity data are incomplete[25,38,39,54]. Third, bottom-up inventories may underestimate intermittent methane releases and high-emitting oil, gas, and waste facilities[63−67]. Fourth, reservoir accounting depends on distinguishing gross surface fluxes from changes caused by impoundment and determining how emissions are allocated among reservoir services[26,58,61].
These gaps affect mitigation priorities differently. Coarse agricultural emission factors can obscure the effects of fertilizer timing, amendments, and soil management on nitrous oxide emissions[23,44]. Excluding non-sewered sanitation can reduce the visibility of methane and nitrous oxide mitigation opportunities in cities where septic tanks and pit latrines are common[25,54]. Failure to detect intermittent methane releases can direct resources away from facilities where repairs could achieve rapid reductions[63,65,66]. For reservoirs, reporting gross surface emissions without a pre-impoundment baseline can overstate the anthropogenic component, whereas incomplete measurement of ebullition and downstream degassing can underestimate it[26,58].
The findings also have implications for net-zero credibility. Estimates of unreported corporate emissions and comparisons between reported and independently observed methane emissions demonstrate that incomplete coverage and weak verification can produce material discrepancies[10,11]. Ground measurements, facility surveys, aerial campaigns, and satellite observations can identify sources missed by conventional inventories, although these observations must be reconciled with clearly defined inventory boundaries[12,63,66,67]. Accounting choices also influence the recognition of health, ecosystem, and food-system outcomes. Reduced fossil-fuel combustion can provide health benefits through lower air pollution and climate-related exposure[16,68]. Land-based mitigation estimates must account for drought, wildfire, and other disturbances that can weaken carbon sinks or reverse stored carbon[27,29]. Agricultural mitigation must similarly be evaluated alongside food production, soil fertility, and livelihood requirements[22,23,47,70].
Regional evidence shows that governance priorities depend on emissions profiles and institutional capacity. In Kenya and Nigeria, mitigation is closely connected to energy access, infrastructure investment, and regulatory implementation[74−76]. China’s transition depends heavily on coal reduction, industrial restructuring, and low-carbon electricity deployment[33,34,80]. Russia’s priorities include fossil-fuel methane, flaring, and transparent accounting of forest sinks[82,84,86]. Evidence from the US demonstrates the contribution of independent methane measurements to identifying underestimated sources[63,66,67]. Across these cases, mitigation technologies require reporting rules and verification systems capable of demonstrating that reported reductions correspond to atmospheric outcomes.
-
This structured integrative review shows that greenhouse gas accounting gaps are source-specific and have direct implications for mitigation priorities and net-zero credibility. Carbon dioxide from energy and industrial systems remains the largest component of global emissions, while methane and nitrous oxide require targeted interventions in fossil-fuel systems, agriculture, waste, and sanitation. The principal gaps identified were the use of generalized emission factors for variable biological processes, incomplete coverage of decentralized infrastructure, under-detection of intermittent methane releases, and uncertain attribution of reservoir fluxes. These limitations can obscure mitigation opportunities, distort comparisons, and weaken the credibility of reported reductions. Priority responses include locally representative agricultural emission factors, complete sanitation-chain inventories, direct methane monitoring, transparent reservoir baselines, and independent verification of reported emissions. Net-zero strategies should disclose their boundaries, climate metrics, treatment of removals, and methods for addressing reversals and measurement uncertainty.
Not applicable.
-
The authors confirm their contributions to the paper as follows: Zipporah Simiyu Nafula: conceptualization, methodology, formal analysis; Zipporah Simiyu Nafula, Tiyamike Mazaza-Jere, Godspower Oke Omokaro, Shirley Adanma Ogboi: manuscript design; Zipporah Simiyu Nafula, Tiyamike Mazaza-Jere, Godspower Oke Omokaro, Shirley Adanma Ogboi, Irene Okezimena Okpro, Kolawole Abiola, Sifuna Eugine Balayo, Adedamola Oluwagbemi: writing – original draft, writing – review & editing; All authors reviewed the results and approved the final version of the manuscript.
-
No new datasets were generated or analyzed. All evidence supporting this review is derived from publicly available literature cited in the manuscript.
-
The authors declare that they have no known competing financial interests or personal relationships that could have appeared to influence the work reported in this paper.
-
Full list of author information is available at the end of the article.
- Copyright: © 2026 by the author(s). Published by Maximum Academic Press, Fayetteville, GA. This article is an open access article distributed under Creative Commons Attribution License (CC BY 4.0), visit https://creativecommons.org/licenses/by/4.0/.
-
About this article
Cite this article
Nafula ZS, Mazaza-Jere T, Omokaro GO, Ogboi SA, Okpro IO, et al. 2026. Greenhouse gas accounting gaps and their implications for mitigation priorities and net-zero credibility: a review. Energy & Environment Nexus 2: e026 doi: 10.48130/een-0026-0020 

Greenhouse gas accounting gaps and their implications for mitigation priorities and net-zero credibility: a review
- Received: 28 July 2026
- Revised: 24 August 2026
- Accepted: 21 September 2026
- Published online: 20 October 2026
Abstract: Credible net-zero strategies depend on greenhouse gas inventories that adequately represent emission sources, accounting boundaries, measurement uncertainty, and verification. This narrative literature review with thematic synthesis examines how greenhouse gas accounting gaps influence mitigation priorities and the credibility of net-zero targets across gases, sectors, and regions. A purposively assembled evidence base of 83 substantive sources, including peer-reviewed studies, international assessments, emissions inventories, institutional reports, authoritative datasets, and policy literature, was synthesized thematically. These quantitative estimates were compared descriptively rather than statistically pooled because of differences in system boundaries, climate metrics, geographic scales, and measurement methods. The synthesis organized accounting limitations into six analytical categories: coverage, measurement, parameterization, attribution, boundary, and reporting and verification gaps. These limitations are particularly important for diffuse, intermittent, and poorly monitored sources, including agricultural soils, wastewater and non-sewered sanitation, methane emissions from fossil-fuel infrastructure and waste systems, and reservoirs and inland waters. Recurring problems include generalized emission factors that inadequately represent local conditions, incomplete coverage of decentralized infrastructure, under-detection of intermittent and high-emitting methane sources, and uncertainty in distinguishing gross emissions from anthropogenic contributions. Such gaps can obscure material emission sources, distort mitigation priorities, and weaken confidence in reported progress toward net zero. Improving inventory credibility therefore requires more representative emission factors and activity data, expanded direct measurement, clearer accounting boundaries and climate metrics, independent verification, and sector-specific monitoring, reporting, and verification systems. Greenhouse gas accounting should consequently be treated as an integral component of mitigation governance and net-zero implementation rather than solely as a technical reporting exercise.