


-
Coffee, as one of the 'three non-alcoholic beverages', accounts for the largest worldwide production, output and consumption[1]. Coffee belongs to Coffea genus, Rubiaceae family, with 124 species[2, 3]. Among all the species, Coffea Arabica L. (Arabica) and C. canephora L.(Robusta) are the most widely cultivated ones. Arabica accounts for 60% and Robusta accounts for 39% of the total worldwide production[4].
Good quality is not only the main factor that determines the price of coffee, but is also an important factor influencing the income of coffee farmers. The content of lipids, protein and sucrose directly determines coffee quality[5, 6]. Flavor and taste (FT) are also important evaluation factors determining coffee quality. Large amounts of research on coffee quality focus on the serving temperature[7], cup texture[8], cup color[9], noise control[10] and state of fermentation[11, 12]. Secondary metabolites such as caffeic acid, chlorogenic acid, caffeine and terpenes play important roles affecting coffee FT making coffee taste bitter, astringent or sweet depending on the levels. Profile and identification of these secondary metabolites have been used for the evaluation of coffee FT[11, 13].
Caffeine, phenolic acids and terpenoids are important FT-related secondary metabolites: 1) Caffeine is an important quality indicator for the bitterness of coffee. Caffeine synthesis begins with the conversion of guanine and adenine nucleotides to xanthine nucleotides[1]. 7-Methyl-Xanthine Synthase (7XS), Theobromine Synthetase (TS) and Caffeine Synthase (CS) play important roles in caffeine synthesis[14, 15]. Tea Caffeine Synthase (TCS1) is considered to be the most critical enzyme in the caffeine biosynthesis pathway of tea plants[16]. 2) Chlorogenic acid, caffeic acid, catechin and anthocyanin are referred to as phenolic acids. They are produced by the phenylpropanoid pathway (chlorogenic acid and caffeic acid) and the flavonoids pathway (catechin and anthocyanin)[17]. Phenolic acids affect the resistance, flavor and color of coffee beans. Qian et al. found that sucrose affects the synthesis and transportation of phenolic acids in Camellia sinensis[18]. Chlorogenic acid affects the final acidity and bitterness of the raw coffee beans[19], making it an important indicator for coffee flavor. 3) Terpenoids are referred to as aroma compounds that affect coffee flavor[20]. The biosynthesis of terpenoids begins from the mevalonate (MVA) pathway and 2-C-methyl-D-erythritol 4-phosphate (MEP) pathway which is produced from glycolytic products such as pyruvic acid and acetyl-CoA[21]. In general, these metabolites play important roles in the FT quality of coffee beans. The biosynthesis of FT-related metabolites use the products of sucrose metabolism as precursors[22]. However, few studies have been conducted on the effect of sucrose metabolism on FT-related metabolism in coffee varieties.
Arabica generally produces more sucrose than Robusta. The differences of sucrose anabolism and catabolism between Arabica and Robusta have been revealed through the expression of genes and enzyme activity analysis[23]. Sucrose is synthesized in the cytoplasm by two pathways: 1) sucrose and uridine diphosphate (UDP) are produced from fructose and uridine diphosphate glucose (UDPG) by the conversion of Sucrose Synthase (SuSy); 2) sucrose-6-phosphate is firstly produced from fructose-6-phosphate and glucose-1-phosphate catalyzed by Sucrose Phosphate synthesis (SPS)[24, 25], the phosphate group will then be cleaved by Sucrose Phosphatase (SPP) to produce sucrose[26, 27]. SPS is the speed-limiting enzyme of the sucrose biosynthesis process[26]. On the other hand, sucrose is degraded into fructose and glucose by Invertase (Inv)[28].
Comparative studies of FT have been performed in cocoa[29], kiwifruit[30], melon[31] and tea[32]. However, the comparative transcriptomic studies of coffee FT have not been performed to date. In this study, we selected two materials with significant differences in sucrose content, namely Arabica #161 (A161, high sucrose content) and Robusta #6 (R6, low sucrose content) to perform comparative transcriptome analysis.
-
Eighteen varieties of Arabica and Robusta coffee were planted in the #53 coffee plantation base of Flavor Beverage Institute, Chinese Academy of Tropical Agriculture Sciences (E110’11’’−111’29’’, N18’12’’−20’15’’, Xinglong Town, Wanning City, Hainan Province, China). Fresh fruits at the ripening stage from three plants of Arabica or Robusta were collected as one biological replicate for measurement of caffeine, chlorogenic acid and sucrose. Three biological replicates were prepared as follows: firstly, we removed the mesocarp and washed off the pectin, the beans were then dried in oven at 50 °C for 72 h until the moisture content decreased to about 12%, followed finally by peeling off the seed coat.
Quantification of caffeine, chlorogenic acid and sucrose
-
For chlorogenic acid analysis, powdered coffee samples (0.4 g) were accurately weighed and dissolved with 70% ethanol/water (20 mL), followed by ultrasonic associated extraction for 30 min. The sample was filtered through 0.45 µm PET syringe membranes before analysis. For caffeine measurement, samples (1.0 g) were extracted by boiling deionized water (200 mL) for 30 min with occasional stirring. Magnesium oxide (5 g) was then added to the water sample after cooling, and placed in a boiling water bath for 20 min. Finally, the solution was diluted into a 250 mL volumetric flask using deionized water. All the samples for quantification of chlorogenic acids and caffeine were filtered through 0.22 µm Hydrophilic PTFE syringe filters (SCAA-104, ANPEL, Shanghai, China). Sucrose was determined using the acid hydrolysis method according to the Chinese standard GB/T 5009.8-2008.
Coffee extracts analysis was performed with an Agilent 1290 series Ultra Performance Liquid Chromatography (UPLC) system (Agilent Technologies, Inc., Santa Clara, CA, USA), equipped with a G4204A quaternary pump, a G4226A autosampler, a G1316C column oven, and a G4212A DAD detector. The separation was carried out on an Alltech Alltima C-18 column (2.1 × 100 mm, 1.7 μm). The mobile phases consisted of A (0.1% acetic acid in water) and B (methanol). A linear gradient elution procedure was used as follows: 0–30 min, 5%–100% B; 30–32 min, 100%–100% C. The flow rate was set as 0.2 mL/min and injection volume was 1.5 μL, and the post run equilibration time was 7 min. Quantification was performed using the external standard method, a calibration curve was established by linear regression based on corresponding standard solution. Quantification of compounds was conducted using a DAD detector by integrating peak areas at 325 nm for chlorogenic acid and 275 nm for caffeine. Data analysis was performed using the Agilent ChemStation software.
Transcriptomic analysis
Sample collection and RNA extraction
-
Fruits at different development stages were sampled from A161 and R6 for RNA-seq. The fruits were harvested at 2 months (2F), 4 months (4F), 6 months (6F) and 8 months (8F) after fertilization for Arabica and Robusta, 10 or 12 months (MF) after fertilization for Arabica or Robusta, respectively (Supplemental Fig. S1). These fruits from three plants of Arabica or Robusta were collected as one biological replicate. All samples were stored directly in liquid nitrogen after collection and transferred to the refrigerator at −80 °C for long-term preservation. Total RNAs were extracted from frozen samples using RNAprep Pure Plant Kit (Tiangen Biotech Co., Ltd). Quality and concentration of RNAs were determined using a Nanodrop 2000 spectrophotometer (Thermo Scientific, Wilmington, DE, USA) and an Agilent 2100 Bioanalyzer (Agilent Technologies, Santa Clara, CA, USA).
Transcriptomic sequencing and data analysis
-
Transcriptome sequencing and data analysis were performed by Novogene Co., Ltd. (Beijing, China). Briefly, a library per sample was generated using 3 μg of RNA and then sequenced using the Illumina HiSeqX ten platform. The clustering of the index-coded samples was performed on a cBot Cluster Generation System using TruSeq PE Cluster Kit v3-cBot-HS (Illumia) according to the manufacturer's instructions. After cluster generation, the library preparations were sequenced on an Illumina Novaseq platform and 150 bp paired-end reads were generated. Raw data (raw reads) of fastq format were firstly processed through in-house perl scripts. In this step, clean data (clean reads) were obtained by removing reads containing adapter, reads containing ploy-N and low-quality reads from raw data. At the same time, Q20, Q30 and GC content of the clean data were calculated. All the downstream analyses were based on the clean data with high quality. The filtered reads were mapped to a Coffee reference genome[1] using the Bowtie2-2.2.3 software with default parameters.
HTSeq v0.6.1 was used to count the reads numbers mapped to each gene. Fragments per kilobase million (FPKM) was used for gene/transcript level quantification. The FPKM of genes were compared to profile the DEGs in the following dimensions: 1) same developmental stages between A161 AND R6 (same stage in different species); 2) the mature stage verses the immature stages in A161 OR R6 (different stages in same species). Based on the raw count data, R package was adopted to identify the DEGs using the following criteria: (1) false discovery rate (FDR) < 0.05; (2) Log2(fold change) is greater than 1 or less than −1.
Gene Ontology (GO) enrichment analysis of DEGs was implemented by the GOseq R package, in which gene length bias was corrected. GO terms with corrected P-value less than 0.05 were considered significantly enriched by differentially expressed genes. Kyoto Encyclopedia of Genes and Genomes (KEGG) is a database resource for understanding high-level functions and utilities of the biological system, such as the cell, the organism and the ecosystem, from molecular-level information, especially large-scale molecular datasets generated by genome sequencing and other high-throughput experimental technologies (http://www.genome.jp/kegg). We used KOBAS software to test the statistical enrichment of DEGs in KEGG pathways. GO, KEGG data set were used for Gene Set Enrichment Analysis (GSEA) independently with the local version of the GSEA analysis tool (http://www.broadinstitute.org/gsea/index.jsp).
Validation of gene expression through quantitative real-time polymerase chain reaction (qRT-PCR)
-
Total RNAs isolation, DNase I digestion, and first-strand cDNA synthesis were performed as previously described[17]. Reactions were carried out on a Lightcycler 480 Real-Time PCR Detection System (Roche, Germany) using transStart Top/Tip Green qPCR (TransGen Biotech, China). The amplification cycling program was as follows: 94 °C for 30 s, 45 cycles of 94 °C for 5 s, 59 °C for 15 s, and 72 °C for 10 s. Primers used are listed in Supplemental Table S10. The relative expression was calculated using the
$2^{-\Delta \Delta} $ Cᴛ method[33]. In this study, Glyceraldehyde 3-phosphate dehydrogenase (GAPDH) was used as the housekeeping gene[34]. Data from three independent biological replicates were analyzed by one-way analysis of variance. P-values of < 0.05 and < 0.01, calculated using Dunnett's test, were regarded as statistically significant and highly significant, respectively. -
It is generally accepted that cup quality can be improved with higher sucrose content in coffee beans[35]. Sucrose is one of the major sources of the free reducing sugars participating in the Maillard reaction that occurs during the roasting of coffee beans. The Maillard reaction generates caramel, sweet and burnt-type fragrances, and dark color substances, which are typically associated with coffee flavor[23]. The Arabica cultivar appreciably contains more sucrose (7.3%–11.4%) than the Robusta (4%–5%)[36]. Robusta is considered inferior to Arabica in terms of flavor, globally. Arabica and Robusta should be suitable samples to elucidate the effect of sucrose on coffee quality.
The sucrose, caffeine and chlorogenic acid content in 18 Arabica and Robusta coffee varieties were measured to evaluate the general quality. Sucrose, chlorogenic acid and caffeine content ranged from 5.46 g ~ 7.55 g, 1.82 g ~ 4.73 g and 1.37 g ~ 2.51 g per 100 g dry weight (DW), respectively (Supplemental Table S1, Fig. 1). All the Arabica varieties contain more than 6% sucrose but half of the Robusta varieties contain less than 6% sucrose. Half the Robusta varieties had sucrose content similar to that of the Arabica varieties which needs to be noted. This has significant implications for the development of better flavored Robusta.
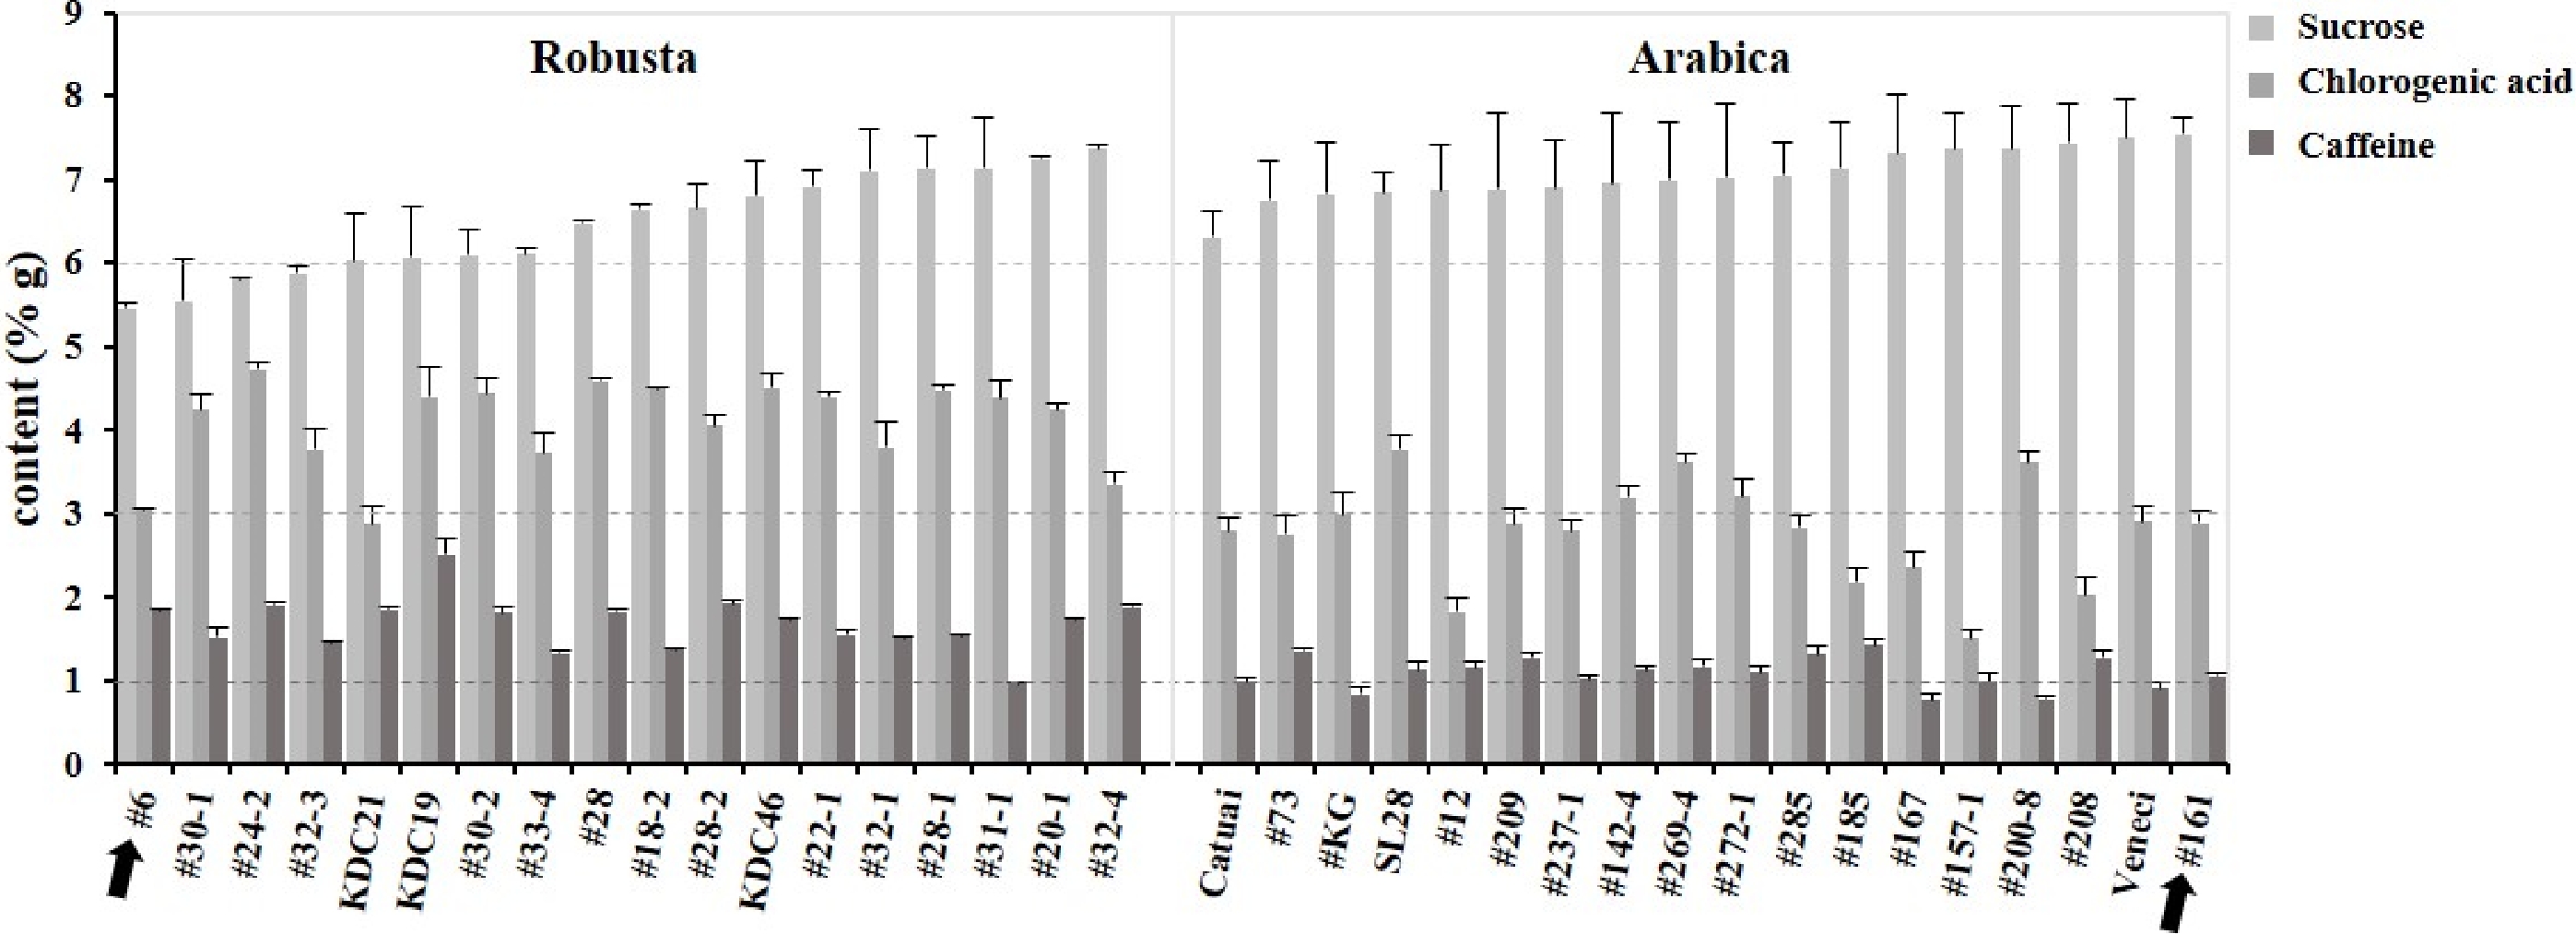
Figure 1. Content of sucrose, caffeine and chlorogenic acid in 18 Robusta and Arabica varieties.
On the other hand, Arabica varieties possessed significantly less caffeine than Robusta. Sucrose and caffeine content of A161 were 7.55 ± 0.19 g/100 g and 1.05 g/100 g respectively; while these contents in R6 were 5.46 ± 0.07 g/100 g and 1.85 g/100 g respectively (black arrows in Fig. 1). These data suggest that the sucrose content and related secondary compounds maybe one of the reasons why Arabica cultivars provide better cup quality than Robusta. The Arabica variety (A161) with the highest sucrose content and the Robusta (R6) with the lowest sucrose content were then selected as samples for transcriptomic analysis.
Transcriptomic analysis
Global analysis of transcriptomic data from coffee beans at different development stages of A161 and R6
-
The total clean bases of 30 pieces of RNA-seq data ranged from 6.13G to 9.14G in data quality statistics. The mean error rate of RNA-seq data for analysis was only about 0.03%. More than 90% of clean reads reached the level of Q30 (99.9% base pairs per read were correctly authenticated) (Supplemental Table S2). Pearson correlation coefficients (R2) (Supplemental Fig. S2) and the FPKM distribution (Supplemental Table S3) showed the similarity and differences among the different samples. Generally, it meets the requirement of comparative analysis of gene expression levels for further analysis.The RNA-seq data set is available in the National Genomics Data Center (accession No. CRA002812).
Strong association between sucrose-related metabolisms and FT-related metabolisms exhibited by the DEGs in GO terms and KEGG pathways
-
25,047 genes were identified in this study, among which 21,972 genes were functionally annotated. Comparative transcriptomics were performed to find out the differences of expression levels of genes throughout the entire developmental stages of coffee beans. DEGs were profiled and used to show the development changes in different stages of coffee beans (Fig. 2, Supplemental Figs. S3 & S4). The number of DEGs between A161 and R6 decreased from 2F to 6F but then increased sharply from 6F to MF (blue background in Fig. 2). The least and most DEGs between A161 and R6 occurred in the 6F and 8F, respectively (white arrows in Fig. 2). The least and most DEGs between 8F and MF were profiled in A161 and R6, respectively (black and gray arrows in Fig. 2). Both coffee types have different pollination mechanisms, which could be playing a role in the gene expression differences especially in the genetic process from 6F to MF between Arabica and Robusta. We could therefore infer that the final ripening stages (6F to MF) are probably the key period affecting the final cup quality between the two species.
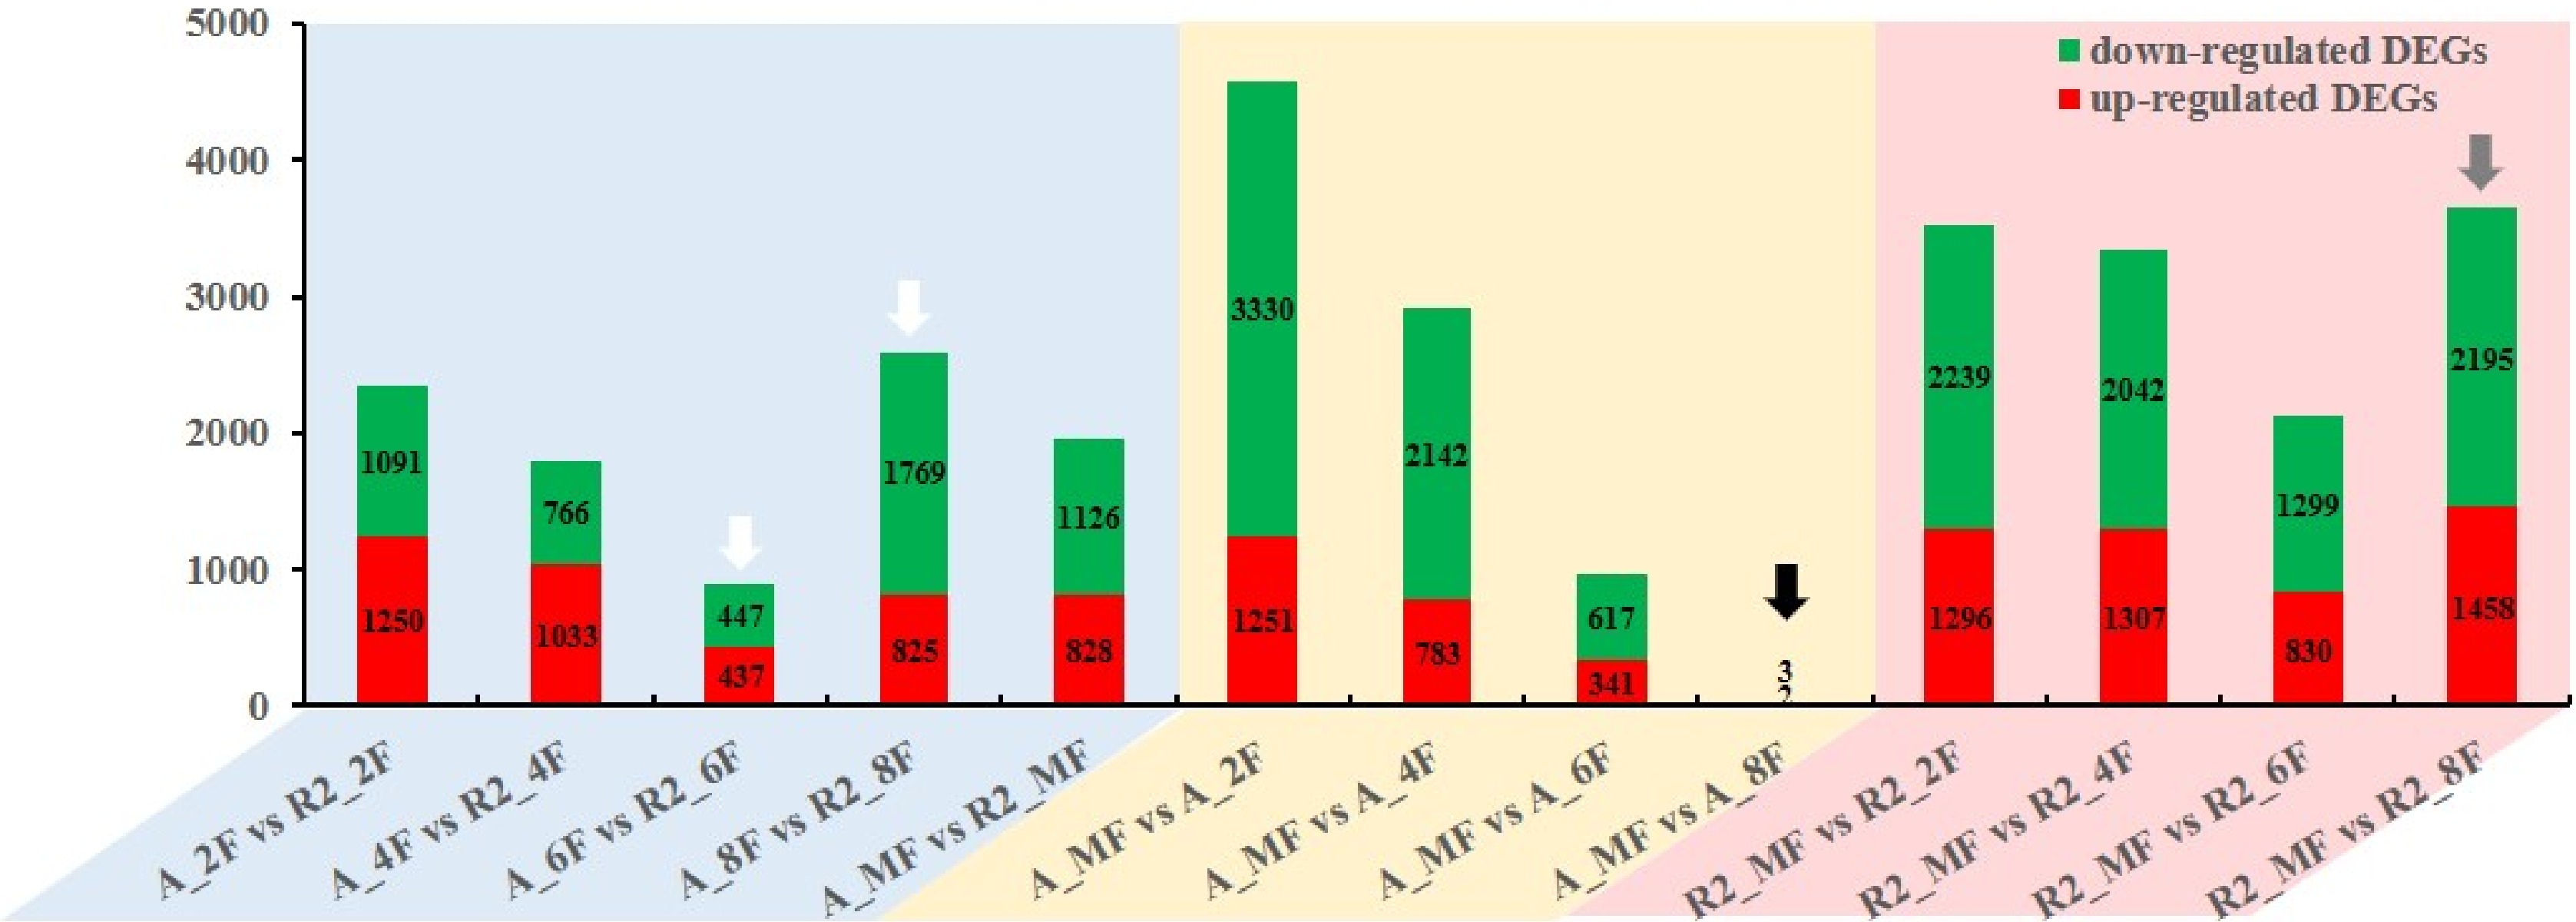
Figure 2. Number of DEGs at different developmental stages in A161 and R6.
The GO terms enriched by DEGs were classified into three categories: biological process, cellular component and molecular function (Supplemental Figs. S5 & S6; Supplemental Tables S4−S6). After comparison of the top 20 GO terms enriched by the DEGs (Supplemental Figs. S5 & S6), seven biological processes enriched by the most significant DEGs were classified into two types (Fig. 3): fruit developmental processes (DNA metabolic process and Nucleic acid process) and metabolism processes (nucleobase-containing compound, heterocycle, cellular aromatic compound, cellular nitrogen compound and organic cyclic compound metabolic processes). Caffeine belongs to nucleobase-containing, cellular nitrogen and heterocycle compounds, while chlorogenic acid belongs to cellular aromatic and organic cyclic compounds. These metabolism processes were responsible for the content differences of flavor substances such as caffeine and chlorogenic acid between A161 and R6.
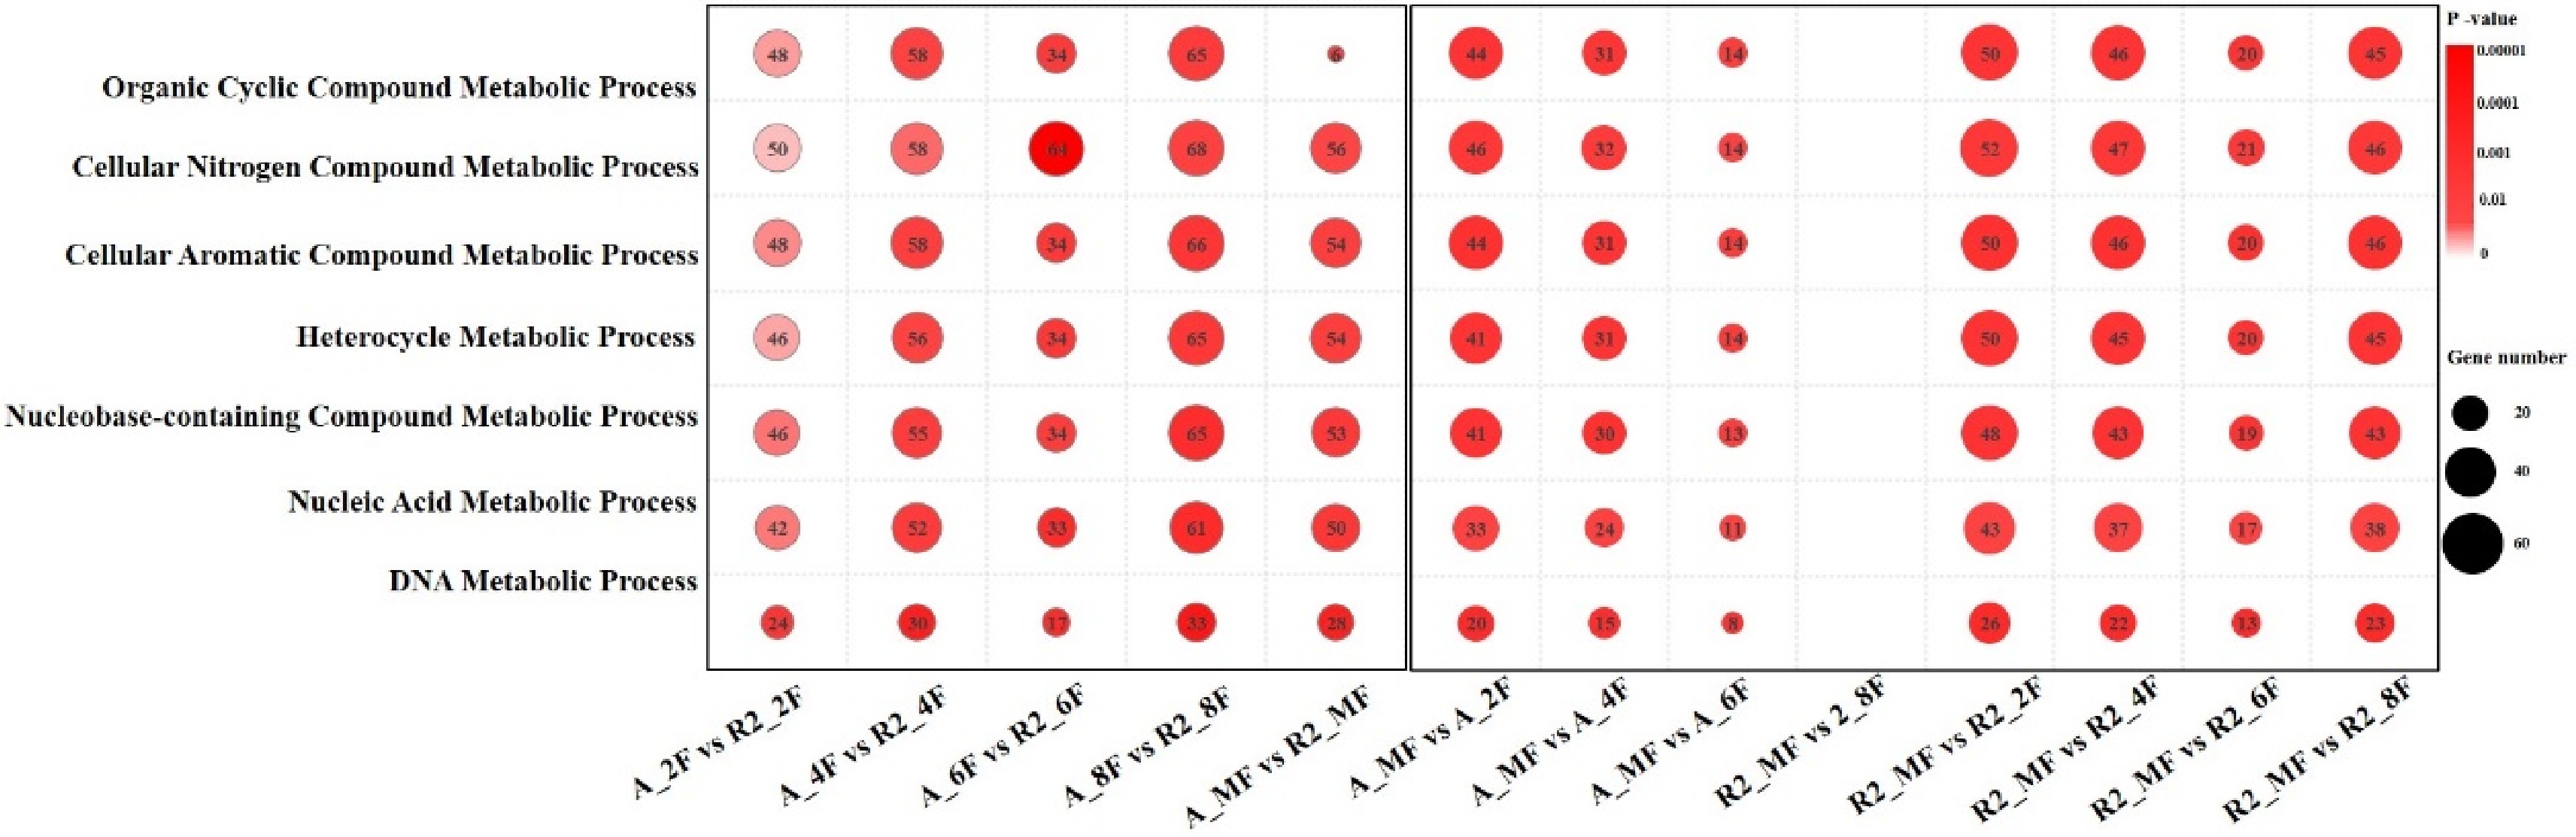
Figure 3. Seven biological processes of GO terms enriched by most significantly different DEGs.
Dozens of KEGG pathways enriched by most significant DEGs were frequently distributed in 'Nucleotide Excision Repair'; 'Mismatch Repair'; 'Homologous Recombination'; 'DNA Replication'; 'Starch and Sucrose Metabolism'; 'Amino Sugar and Nucleotide Sugar Metabolism'; 'Phenylpropanoid Biosynthesis'; 'Sesquiterpenoid and Triterpenoid Biosynthesis'; 'Biosynthesis of Secondary Metabolites', 'Plant-Pathogen Interaction' (Supplemental Tables S7−S9; Supplemental Figs. S7 & S8). After comparing these KEGG pathways, 16 pathways enriched by the most DEGs were selected and classified into five types: I) Genetic processes, II) Amino acid metabolism, III) Carbohydrate metabolism, IV) Secondary metabolism and V) Environmental adaptation (Fig. 4). Genetic processes showed the most significant differences during the whole development stages between A161 and R6 (dotted box in Fig. 4). Sucrose synthesis provides energy for the growth and development of fruits in the early stages of development (2F to 6F). The DEGs involved in 'III. Carbohydrate Metabolism' especially 'Starch and Sucrose Metabolism' mainly occurred during the early stages (2F, 4F) between A161 and R6 (gray arrow and solid box in the yellow background of Fig. 4). The DEGs enriched in the pathways of 'IV. Secondary Metabolism' especially 'Biosynthesis of Secondary Metabolites' mainly occurred at the ripening stages (8F, MF) between A161 and R6 (black arrow and solid box in the red background of Fig. 4).
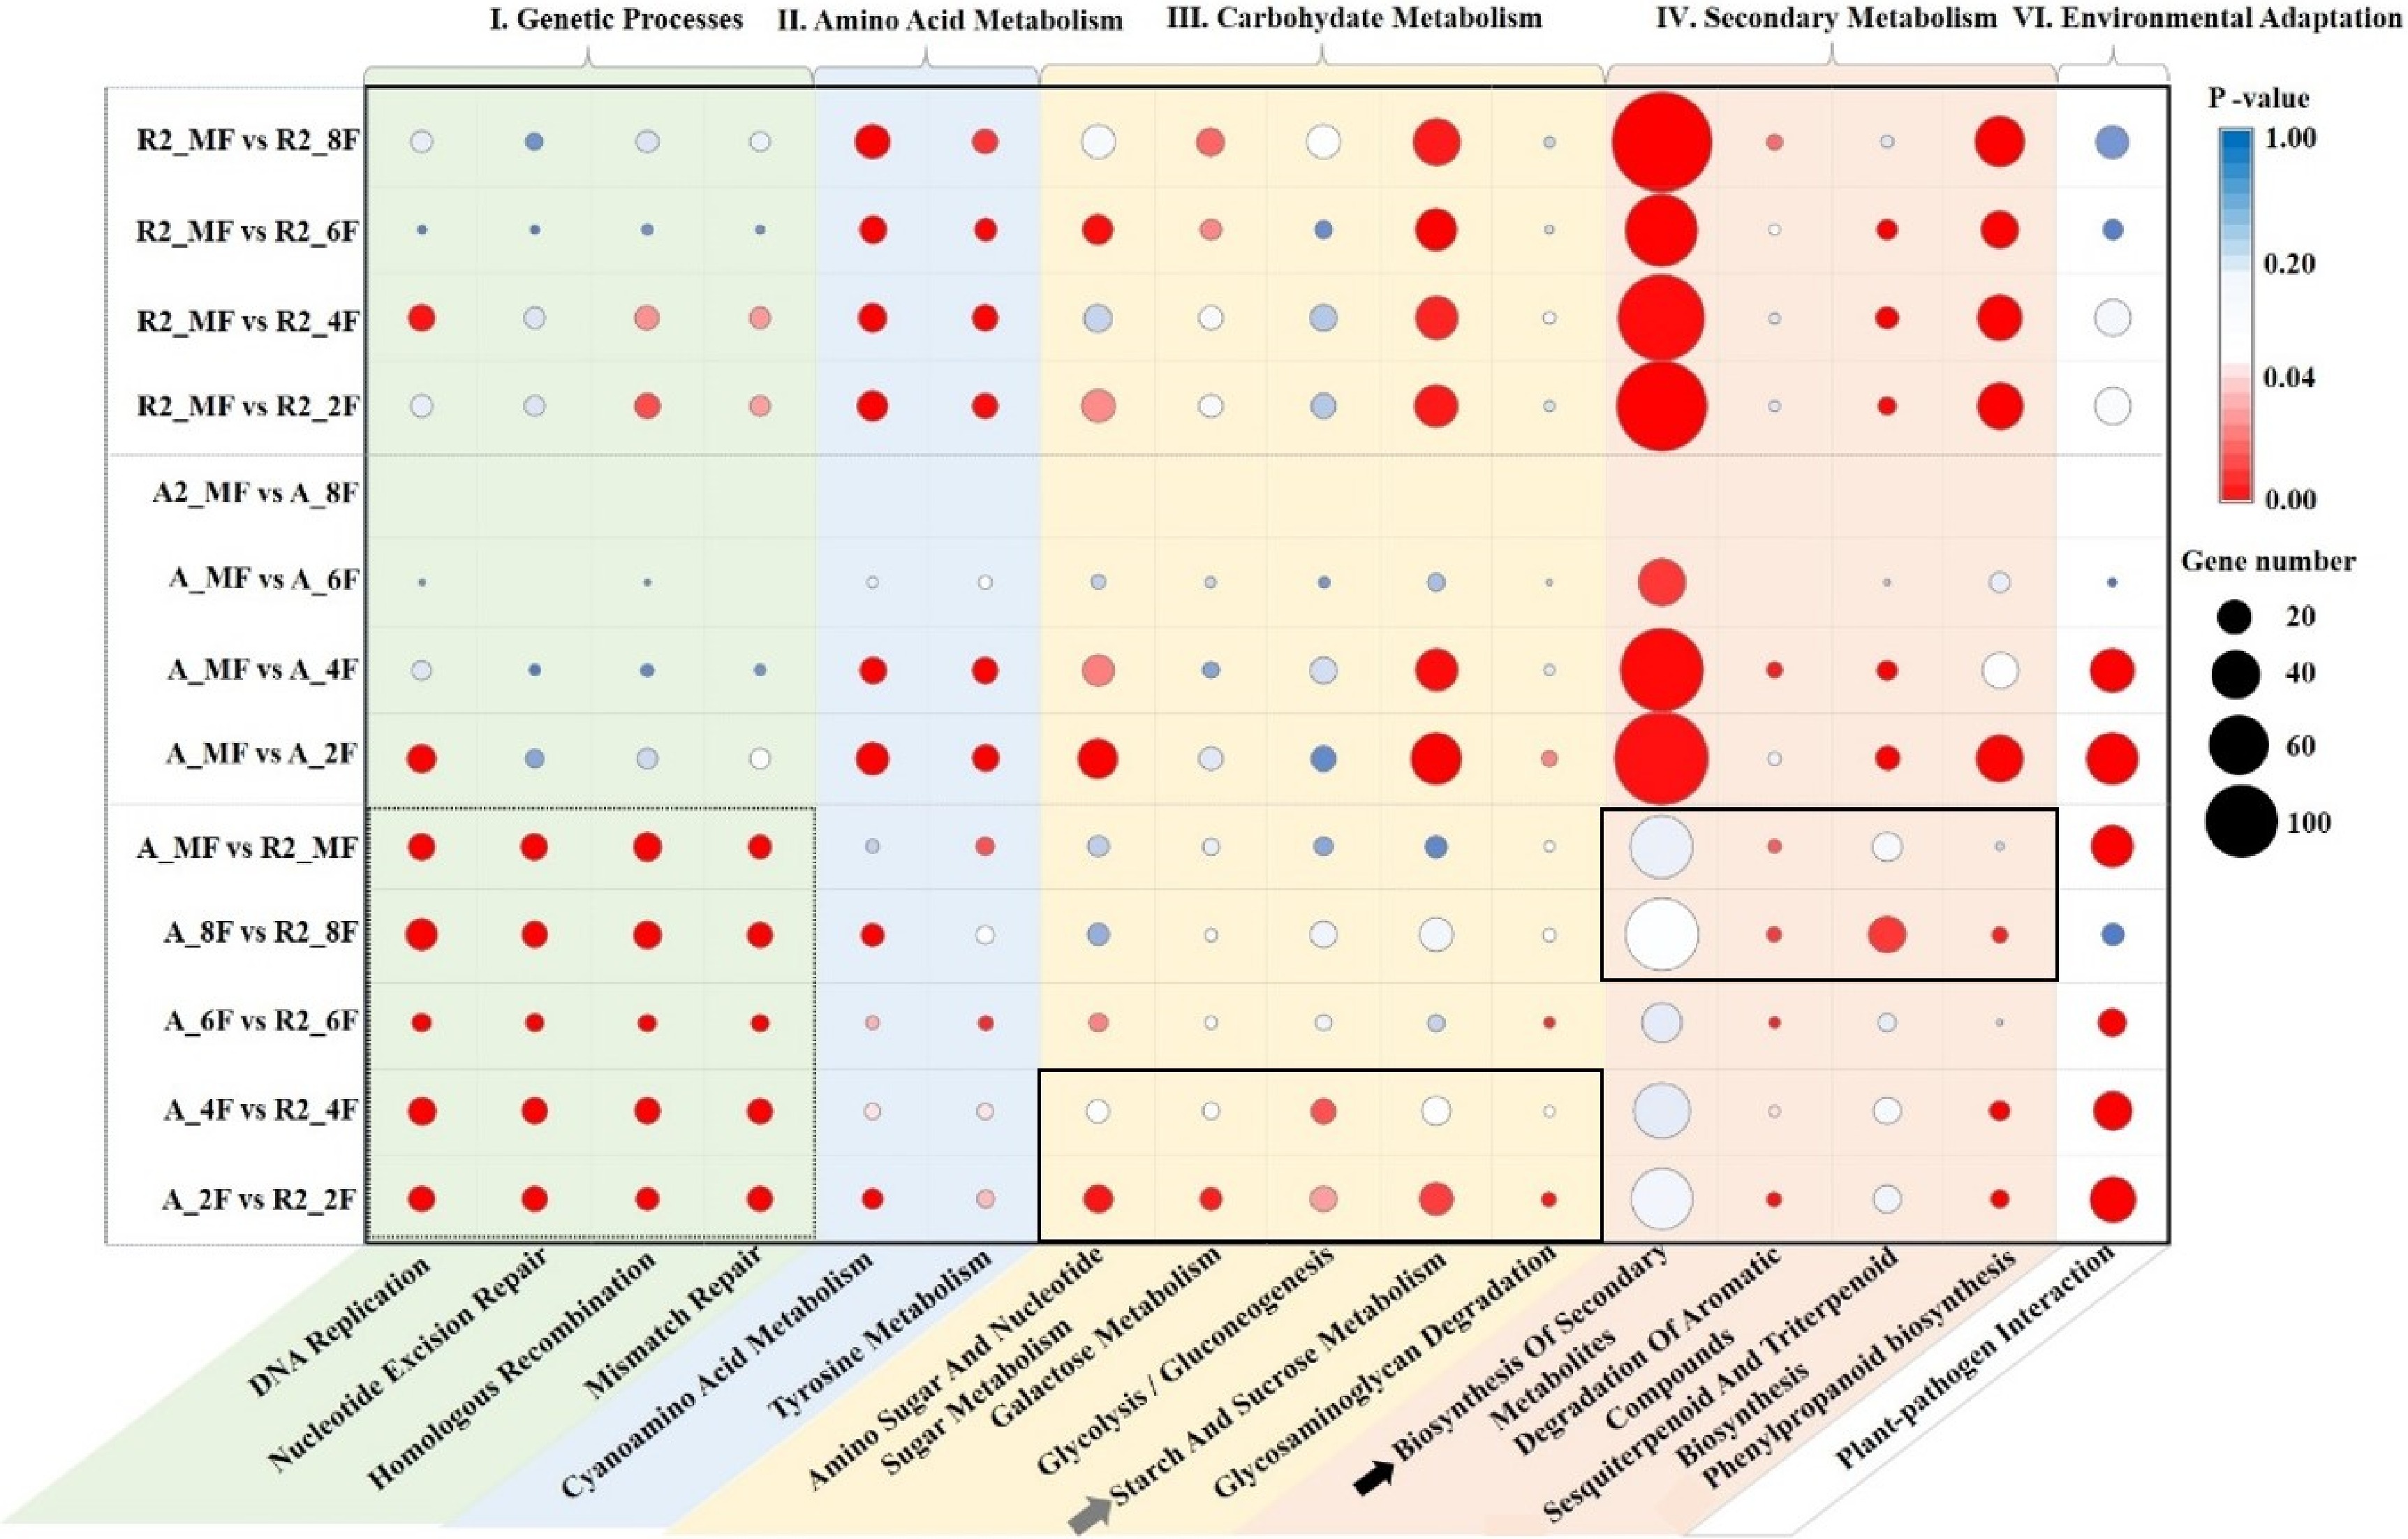
Figure 4. Sixteen KEGG pathways were selected to elucidate the main differences between the growth stages in A161 or R6.
The significant differences in gene expression between Arabica and Robusta exhibited by GO terms and KEGG pathways mainly focused on three categories: 1) genetic process; 2) sucrose-related metabolism and 3) FT-related metabolism. The significantly different sucrose-related metabolism mainly occurred in 2F to 4F, but FT-related metabolism happened in 6F to MF. The DEGs in the early developmental stages of fruit (2F to 6F) were mainly involved in nucleic acid synthesis and energy storage responsible for cell division and differentiation. Metabolites involved in flavor substances responsible for fruit quality began to accumulate at 6F (Supplemental Figs. S5 & S7; Supplemental Tables S4 & S7). This implied that the development processes of coffee beans could be ambiguously divided into two different stages: i) from 2F to 6F, where the coffee beans mainly focused on the primary metabolisms for cell division and differentiation to increase their sizes; and ii) from 6F to MF, where the metabolism of the coffee beans probably switched to secondary metabolite biosynthesis to determine their FT quality. The final ripening stages (6F to MF) are probably the key period affecting the final cup quality between Arabica and Robusta. Further studies should focus on this period to find out the factors that influence final cup quality in coffee.
Generally, sucrose-related metabolism was strongly associated with FT-related substance accumulation, of which these mechanisms need to be further studied.
Profile and quantification of candidate DEGs resulted in different content of sucrose and FT-related metabolites
-
Specific pathways should be resolved after the global analysis of GO terms, KEGG pathways. Caffeine[14], phenolic acids[37−39] and terpenoids[21, 40] are the major components that influence the final FT quality of coffee beans[35, 41−43]. Transcription level of the genes involved in these metabolite biosynthesis partly reflects the degree of their metabolic activities. The DEGs involved in these pathways maybe the candidate genes that affect the final differences in cup quality.
Thirty-four DEGs involved in FT-related biological processes and pathways were screened from the aforementioned GO terms and KEGG pathways. These genes took part in 'Sucrose Metabolism' (#6), 'Caffeine Synthesis' (#3), 'Phenylpropanoid and Flavonoids Pathway' (#13), 'Terpenoid Metabolism' (#12). Fifteen of them were quantified and validated by qRT-PCR (Fig. 5).
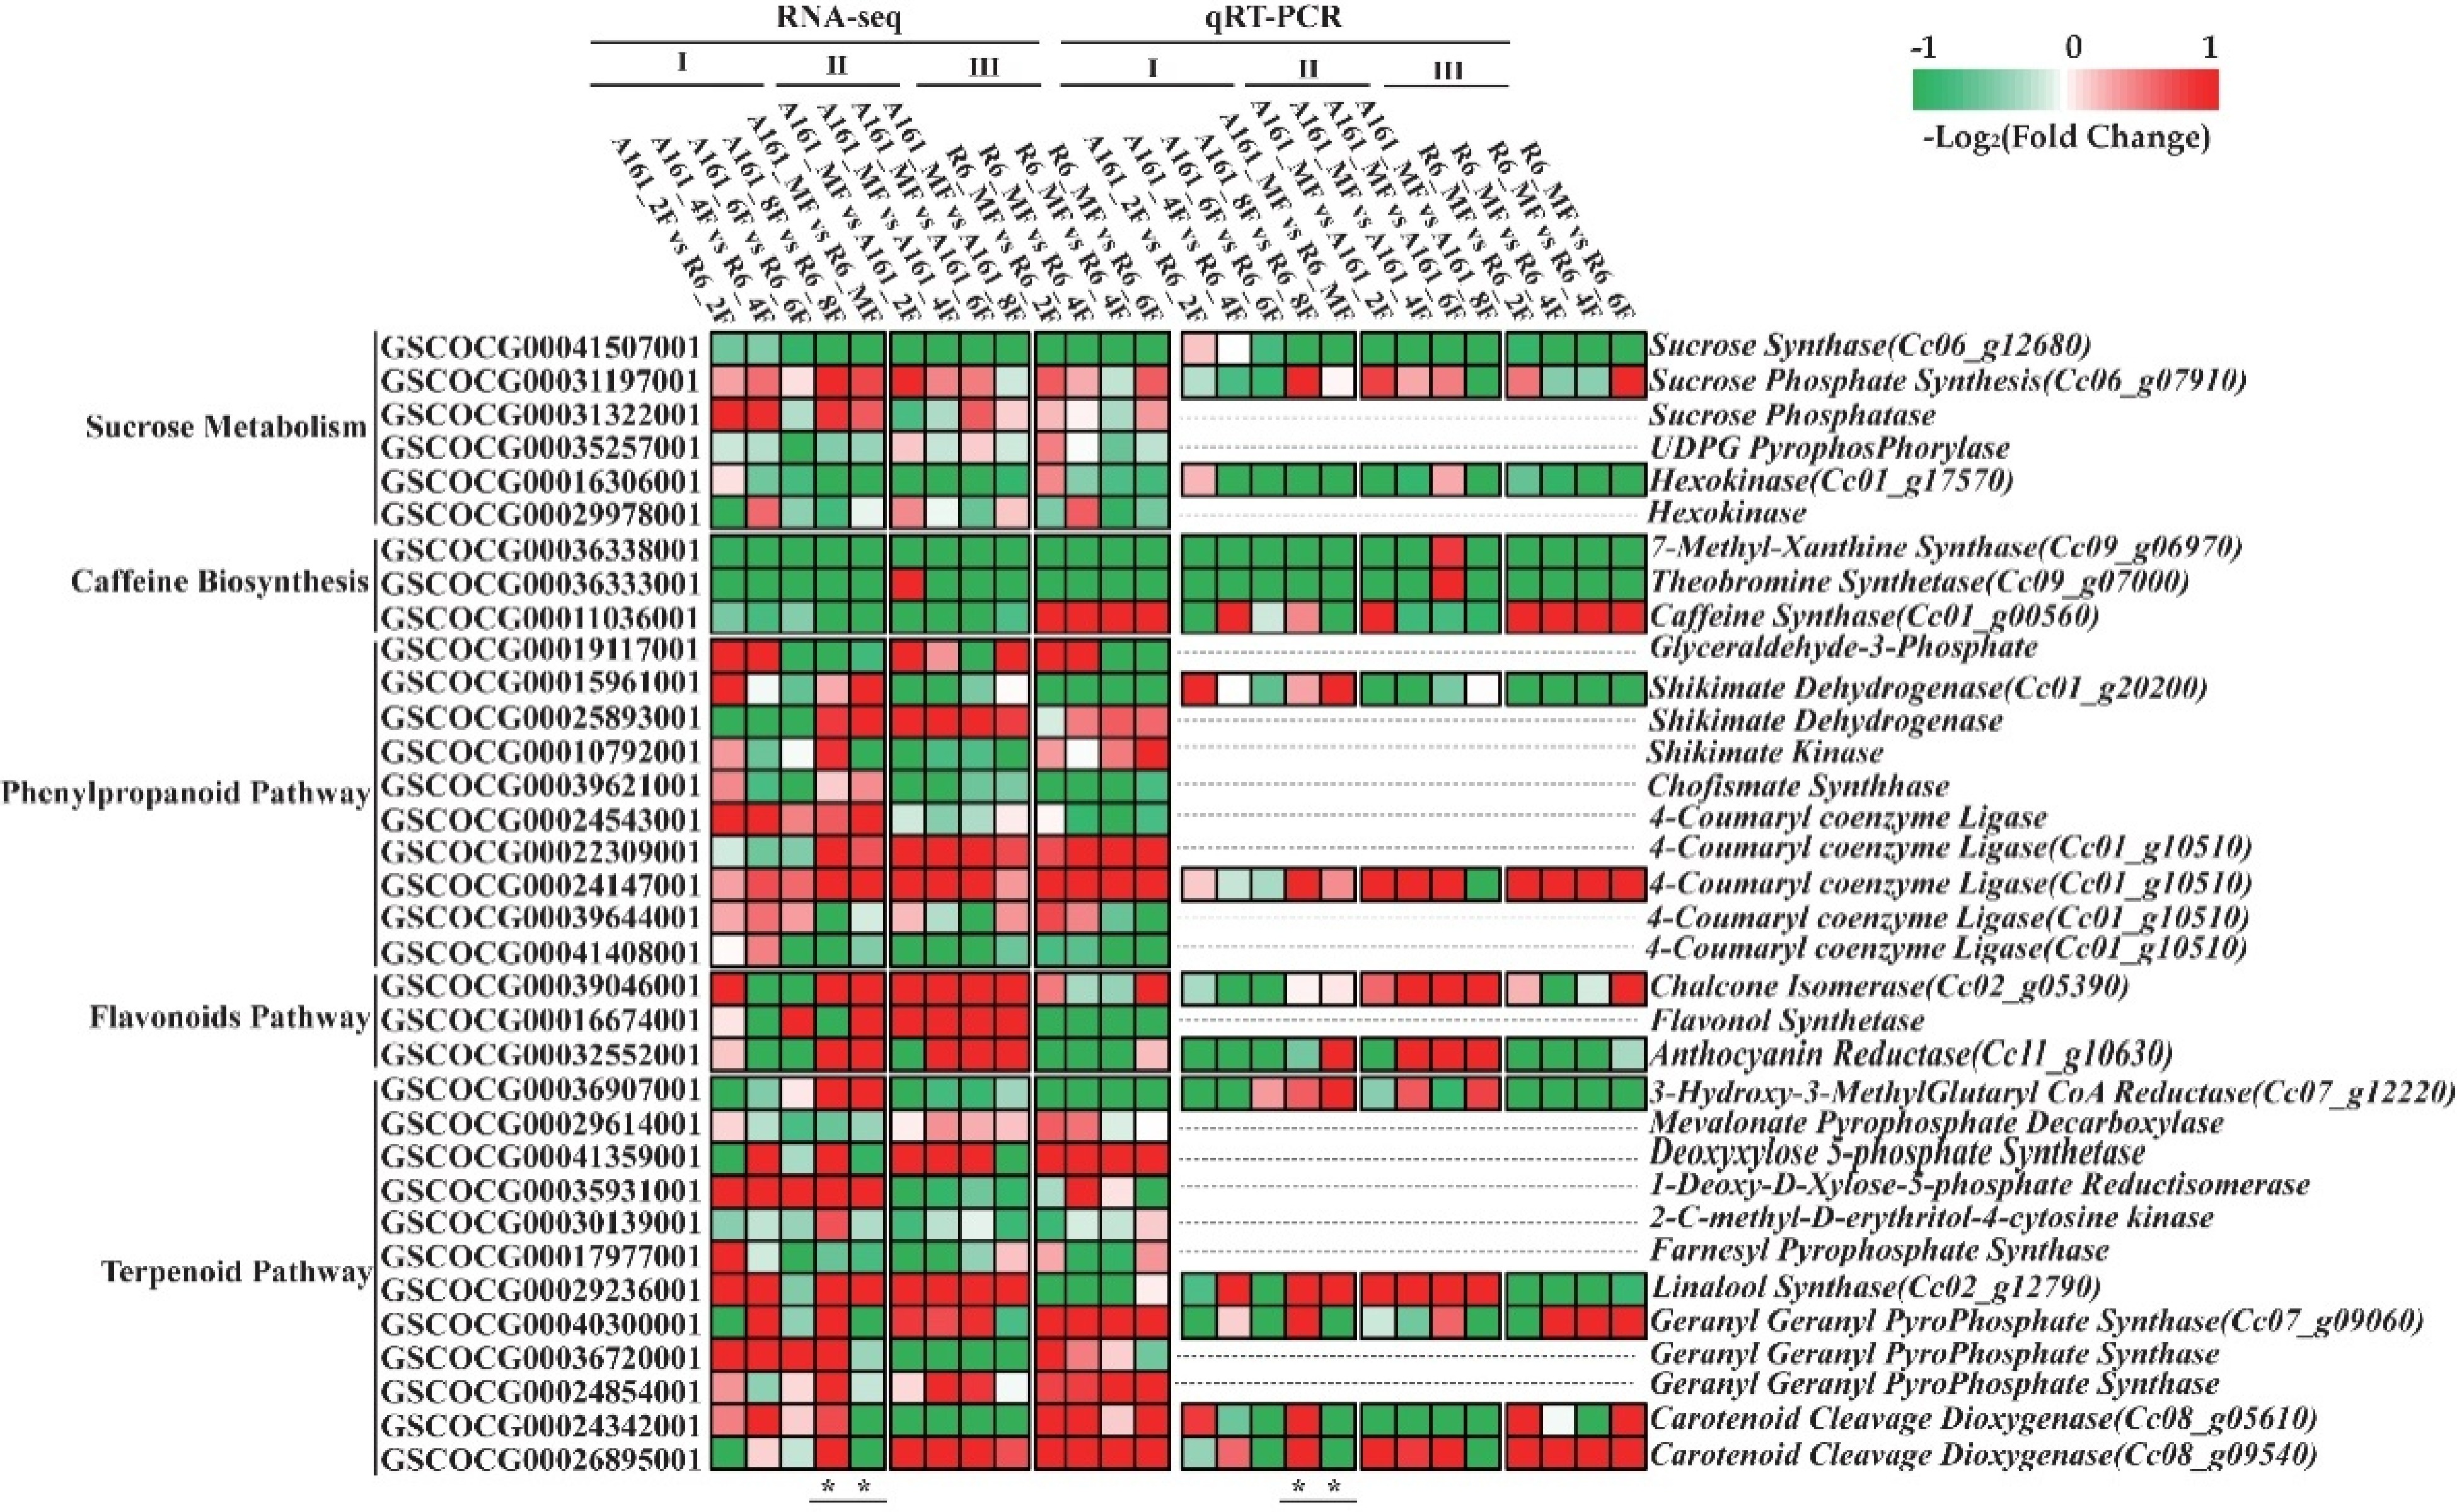
Figure 5. Candidate DEGs validated by qRT-PCR resulted in different content of sucrose and FT-related metabolites.
Sucrose metabolism
-
SuSy, SPS and SPP are beneficial for sucrose biosynthesis, while UDPG pyrophosphorylase (UPP), Hexokinase (HK) are in charge of sucrose glycolysis. The expression levels of SPS (Cc06_g07910) in A161 were higher during all the developmental stages while that of HK (Cc01_g17570) in R6 were lower than that in A161 from the 4F to MF. The higher sucrose content of mature fruits in A161 is the result of relatively more efficient biosynthesis while the relatively less efficient decomposition compared with that in R6. qRT-PCR results showed the same changes in R6 and A161 as 2F to MF (''Sucrose Metabolism'' in Fig. 5).
Our findings are consistent with the conclusions of Isabelle et al.[23] where the expression level differences of SPS, SuSy, and HK resulted in a higher sucrose content in Arabica than that in Robusta. Which transcription factors control the higher expression of SPS but lower expression of HK in A161 should be further investigated.
Caffeine synthesis
-
Transcript abundance changes of three genes (7XS, TS, CS) involved in caffeine synthesis were quantified by RNA-seq. The expression levels of all three genes in R6 were significantly higher than that in A161 from 2F to MF. Their expression was validated by qRT-PCR ('Caffeine Biosynthesis' in Fig. 5). This maybe one of the reasons why the caffeine content of mature fruits in R6 is higher than A161 (Table 1, Fig. 1).
Table 1. Fifteen genes related to coffee quality screened out for qRT-PCR.
Metabolism Gene name Gene ID Sucrose biosynthesis Sucrose Synthetase Cc06_g12680 Sucrose Phosphate Synthase Cc06_g07910 Hexokinase Cc01_g17570 Caffeine synthesis 7-methyl-xanthine synthase Cc09_g06970 theobromine synthetase Cc09_g07000 caffeine synthase Cc01_g00560 Phenolic metabolism shikimate dehydrogenase Cc01_g20200 4-coumaryl coe-nzyme ligase Cc10_g00840 chalcone isomerase Cc02_g05390 anthocyanin reductase Cc11_g10630 Terpene metabolism 3-Hydroxy-3-MethylGlutaryl CoA Reductase Cc07_g12220 linalool synthase Cc02_g12790 geranyl geranyl pyrophosphate synthase Cc07_g09060 carotenoid cleavage dioxygenase Cc08_g05610 carotenoid cleavage dioxygenase Cc08_g09540 Caffeine is an important quality indicator for the bitterness of coffee. Prashant et al. found that caffeine content negatively affects tea quality due to its bitter taste[14]. So, these genes can be the efficient targets for quality improvement in coffee.
Phenylpropanoid/flavonoid pathways
-
Phenylpropanoids and flavonoids belong to the Shikimate Pathway. Glyceraldehyde-3-phosphate (G3P), Shikimate Dehydrogenase (SKD), Shikimate Kinase (SKK) and Chofismate Synthase (CFS) play important roles in the conversion from glucose to phenylalanine, tyrosine and tryptophan. The expression levels of SKD, SKK, CFS were higher in A161 than that in R6 from 8F to MF. The higher level of SKD (Cc01_g20200) in A161 probably enhanced the shikimic acid metabolic pathway ('Phenylpropanoid Pathway' in Fig. 5). 4-coumaryl coenzyme ligase (4CL) is the important enzyme for phenylpropanoid biosynthesis, Chalcone Isomerase (CHI), Flavonol Synthetase (FLS) and Anthocyanin Reductase (ANR) are responsible for the biosynthesis of anthocyanin. They were also certificated by qRT-PCR ('Flavonoids Pathway' in Fig. 5).
Phenolic acids and anthocyanin improve the FT quality[37]. The chlorogenic acid content in 18 Arabica varieties was slightly lower than that in Robusta (Fig. 1). But the expression levels of genes involved in anthocyanin (a kind of flavonoids) were generally higher in Arabica. These genes may result in the higher anthocyanin of Arabica than Robusta and may affect the final FT quality.
Terpenoid metabolism
-
Terpenoid metabolism was another distinct pathway according to GO and KEGG pathways analysis (Fig. 4). Terpenoids, referred to as aroma compounds, play an important role in coffee quality. Terpenoid metabolism related genes including 3-hydroxy-3-methylglutaryl-coa reductase (HMGR), Mevalonate Pyrophosphate Pecarboxylase (MVD), deoxyxylose 5-phosphate synthetase (DXS), 1-deoxy-d-xylose-5-phosphate reductisomerase (DXR), 2-c-methyl-d-erythritol-4-cytosine kinase (CMEK), farnesyl pyrophosphate synthase (FPPS), geranyl geranyl pyrophosphate synthase (GGPPS), linalool synthase (LS), carotenoid cleavage dioxygenase (CCD) were selected for analysis. The expression level of DXR and LS (Cc02_g12790) was higher in A161 than that in R6 during all the developmental stages. This may enhance the biosynthesis of dimethyl acrylate pyrophosphate in A161. GGPPS is an important speed-limiting enzyme for carotenoid metabolism. The expression levels of GGPPS (Cc07_g09060), CCD (Cc08_g05610, Cc08_g09540) were significantly higher in mature fruits from R6 than that from A161. Five genes related to terpene metabolism were identified and quantified by qRT-PCR ('Terpenoid Pathway' in Fig. 5).
Carotenoids and linalool belong to terpenoids which are referred to as aromatic compounds. Geranylpyrophosphate (GPP) is the common precursor to produce them resulting in the competition between their biosynthesis[20, 21, 40]. Transcription levels of the above genes were higher in 8F from Arabica compared with that from Robusta. However, they were lower in MF from Arabica compared with that from Robusta. The two varieties prefer different terpenoids biosynthesis metabolisms: linalool was more efficiently biosynthesized in Arabica, while the carotenoid metabolism pathway, which was decomposed by CCD to produce flavoring substances, seemed to be more efficient in Robusta. This is an important reason for the production of different flavoring substances in the two varieties.
In summary, differences in gene expression levels between A161 and R6 were the main reason for higher content of sucrose, anthocyanin and linalool in A161, and higher content of caffeine and carotenoid in R6. These mentioned metabolites and genes should be the efficient targets to investigate for quality improvement of coffee fruit in the future research.
-
In this study, we measured the content of sucrose, chlorogenic acid and caffeine in 18 Robusta and Arabica varieties. Arabica varieties generally possessed more sucrose but less caffeine compared with Robusta[44]. A161 (highest sucrose content variety) and R6 (lowest sucrose content variety) were selected as samples for comparative transcriptomic analysis: Firstly, the development processes of coffee beans could be ambiguously divided into two different stages. The DEGs in the early developmental stages of fruits (2F to 6F) were mainly involved in nucleic acid synthesis and energy storage responsible for cell division and differentiation. The final ripening stages (6F to MF) are probably the key period that affect the final cup quality between Arabica and Robusta. Secondly, the significant differences in gene expression between Arabica and Robusta exhibited by GO terms and KEGG pathways mainly focused on three categories: 1) genetic process; 2) sucrose-related metabolism and 3) FT-related metabolism. Sucrose-related metabolism was strongly associated with FT-related substance accumulation. Finally, different expression levels of 34 genes between A161 and R6 mainly resulted in higher content of sucrose, anthocyanin and linalool in A161, and higher content of caffeine and carotenoid in R6. Our results provide valuable information regarding the influence of sucrose on FT quality of coffee beans.
- This work was supported by the Hainan Provincial Natural Science Foundation of China (2018CXTD342), and Central Public-interest Scientific Institution Basal Research Fund for Chinese Academy of Tropical Agricultural Sciences (No.1630142017001).
- The authors declare that they have no conflict of interest.
- Supplemental Fig. S1 Fruits at different development stages were sampled from A161 (A) and R6 (B) for RNA-seq. 2F/4F/6F/8F: 2/4/6/8 months after fertilization; MF: 10 (Arabica coffee beans) or 12 (Robusta coffee beans) months of fruits after fertilization.
- Supplemental Fig. S2 Pearson correlation coefficient (R2) of gene expression among biological replicates.
- Supplemental Fig. S3 Venn diagram of the differentially expression genes from sampled fruits. the same developmental stage between A161 and R6 (A) and mature fruits contrast to unmatured fruits from A161 (B) OR from R6 (C) .
- Supplemental Fig. S4 Volcano plot of the differentially expression genes from sampled fruits. (A) the same developmental stage between A161 and R6; (B) mature fruits contrast to unmatured fruits from A161; (C) mature fruits contrast to unmatured fruits from R6.
- Supplemental Fig. S5 The top GO terms about molecular functions, cellular component and biological process compared by the developmental stages of 2F (A) , 4F (B) , 6F (C) , 8F (D) and MF (E) between A161 and R6. The metabolism processes in the early developmental stage of fruits were mainly involved in nucleic acid synthesis and energy storage responsible for cell division and differentiation. Metabolites about flavor substances responsible for fruit quality began to accumulate since 6F. The GO terms in more than two developmental stages were indicated by bold character and the italics superscript referred to the developmental stages.
- Supplemental Fig. S6 The top GO terms about molecular functions, cellular component and biological process enriched by DEGs from the developmental stages of MF vs 2F (A) , MF vs 4F (B) , MF vs 6F (C) of A161 and MF vs 2F (D) , MF vs 2F (E), MF vs 6F (F) , MF vs 8F (G) of R6. No DEGs were expressed between MF and 8F of A161. The frequently DEGs of MF vs 2F, MF vs 4F, MF vs 6F from A161 and R6 were mainly enriched into 7 biological processes: DNA metabolic process, nucleic acid metabolic process, nucleobase-containing compound metabolic process, heterocycle metabolic process, cellular aromatic metabolic process, organic cyclic compound metabolic process, cellular nitrogen compound metabolic process. The GO terms in more than two developmental stages were indicated by bold character and the italics superscript referred to the developmental stages.
- Supplemental Fig. S7 The top 20 KEGG pathways enriched by DEGs about Genetic processes, Metabolism and Environmental adaptation compared by the developmental stages of 2F (A) , 4F (B) , 6F (C) , 8F (D) and MF (E) between A161 and R6.
- Supplemental Fig. S8 The top 20 KEGG pathways about Genetic processes, Metabolism and Environmental adaptation enriched by DEGs from the developmental stages of MF vs 2F (A) , MF vs 4F (B) , MF vs 6F (C) of A161 and MF vs 2F (D) , MF vs 2F (E) , MF vs 6F (F) , MF vs 8F (H) of R6.
- Supplemental Tables S1 Content of sucrose, caffeine and chlogogenic acid in different varieties.
- Supplemental Tables S2 List of data quality evaluation.
- Supplemental Tables S3 The FPKM distribution of 30 samples.
- Supplemental Tables S4 GO enrichment analysis of DEGs from different samples between A161 and R6.
- Supplemental Tables S5 GO terms of DEGs from different developmental stages of A161.
- Supplemental Tables S6 GO terms of DEGs from different developmental stages of R6.
- Supplemental Tables S7 KEGG enrichment analysis of DEGs from different samples between A161 and R6.
- Supplemental Tables S8 KEGG enrichment analysis of DEGs from different developmental stages of A161.
- Supplemental Tables S9 KEGG enrichment analysis of DEGs from different developmental stages of R6.
- Supplemental Tables S10 Primers for qRT-PCR.
- Copyright: © 2021 by the author(s). Exclusive Licensee Maximum Academic Press, Fayetteville, GA. This article is an open access article distributed under Creative Commons Attribution License (CC BY 4.0), visit https://creativecommons.org/licenses/by/4.0/.
-
About this article
Cite this article
Huang L, Hu L, Fan Y, Wang X, Dong Y, et al. 2021. Comparative transcriptome analysis revealed the influence of sucrose on flavor and taste quality of Coffea arabica and C. canephora varieties. Beverage Plant Research 1: 11 doi: 10.48130/BPR-2021-0011

Comparative transcriptome analysis revealed the influence of sucrose on flavor and taste quality of Coffea arabica and C. canephora varieties
- Received: 20 June 2021
- Accepted: 14 October 2021
- Published online: 27 October 2021
Abstract: Coffea arabica (Arabica) and C. canephora (Robusta) are the most popular coffee species in the world, accounting for 99% of overall consumption of coffee beans. Arabica generally possesses better coffee quality than Robusta partly due its higher sucrose content. The flavor and taste (FT) of coffee, as important aspects of coffee quality, are mainly affected by the content of caffeine, phenolic acid and terpenoid compounds, which use sucrose as an important precursor. However, how sucrose affects the coffee FT remains unclear. In this study, coffee beans at different developmental stages from Arabica #161 (A161, high-sucrose variety) and Robusta #6 (R6, low-sucrose variety) were sampled to perform transcriptomic analysis. Most differentially expressed genes (DEGs) between them were enriched in sucrose-related metabolisms and the FT-related metabolism processes: caffeine biosynthesis, phenylpropanoid and flavonoid pathway, terpenoid metabolism. Thirty-four candidate DEGs probably contributed to the higher content of sucrose, anthocyanin and linalool in A161, and higher content of caffeine and carotenoid in R6. Generally, sucrose-related metabolisms were strongly associated with FT-related substance accumulation. The content of sucrose and its influence on the downstream secondary metabolism probably play important roles in the FT quality of coffee beans. Our results provide efficient targets for investigation regarding the influence of sucrose on FT quality of coffee beans.
-
Key words:
- Arabica /
- Caffeine /
- Chlorogenic acids /
- Robusta /
- Terpenoid /
- Transcriptomics