


-
Seashore paspalum (Paspalum vaginatum Sw.) is a warm-season turfgrass species mainly used on golf courses[1, 2]. The species has desirable characteristics, such as a fast-spreading growth habit and good turfgrass density, and it is known to have excellent tolerance to abiotic stresses, especially to saline soils[2, 3]. In 1993, the seashore paspalum breeding program was initiated at University of Georgia (UGA) by collection and evaluation of germplasm. However, crosses started only in 2003 after overcoming limitations in dormancy of hybrid seed and understanding the extent of sexual compatibility among the germplasm accessions[3]. Due to the low levels of genetic variability in the germplasm collection[3−5], in vitro culture has been used as a breeding tool to induce additional genetic variability[6, 7].
Foliar shade or structural shade influence turfgrass morphology and physiology[8−10]. In addition to modification of microenvironments in terms of temperature and humidity, both types of shade reduce light intensity and can also change spectral quality, which affect levels of photosynthetically active radiation[11, 12]. Light is perceived by photosensory receptors, which modulate the extent of avoidance and acclimation responses[12, 13]. Shade avoidance responses produce changes in plant morphology that reduce exposure to shade, whereas shade acclimation responses reduce the impact of shade, for example, by chloroplast accumulation and stem respiration[12]. In turfgrass, summarized by Gardner and Goss[14], morphology changes caused by shade include decreases in leaf thickness, leaf width, stem diameter, dry weight, rhizome and stolon growth; reduced tillering and shoot density; and increased internode and leaf length, plant height and vertical leaf orientation[15−17]. Consequentially, these morphological changes can result in decreased turfgrass quality[18, 19] and density[18], reduced persistence[9] and traffic tolerance[20], and slower establishment rates[19].
Previous studies evaluated the performance of seashore paspalum cultivars under shade[18, 21]. Jiang et al.[18] observed that most paspalum entries exhibited better low light tolerance than hybrid bermudagrasses under both low light levels evaluated (70 and 90%). Baldwin et al.[21] evaluated the performance of warm-season turfgrass species under different light spectral qualities at 65% shade reduction, and the seashore paspalum entry performed similar or superior to bermudagrass entries but inferior to the zoysiagrass entry. However, screening genotypes under shade in the earlier stages of selection in a breeding program is important to facilitate the development of cultivars with superior shade tolerance.
Multi-environment trials are useful in plant breeding because they allow screening of genotypes for adaptability and stability across target environments, and to verify the relationship between those target environments[22−24]. Type-B genetic correlation is the correlation among genotypes across environments (locations or measures), and it indicates the amount of genotype-by-environment interaction (GEI) across target environments[25]. Additionally, the crossover type of GEI is the biggest challenge for breeders because it results in changes in genotype rankings, and subsequently, the best performing genotype might not be the same in all target environments[26]. For this reason, quantifying changes in genotype rankings between pairs of environments is essential. Therefore, the objective of this study was to evaluate the performance of seashore paspalum breeding lines under shade in multi-environment trials. The specific objectives were to: (i) estimate type-B and Spearman genetic correlations of seashore paspalum breeding lines across measures and between target environments, respectively, and (ii) assess the performance of breeding lines for target environments.
-
For the residual matrix, the heterogeneous power (EXPH) matrix structure resulted in the lowest Bayesian Information Criterion (BIC) for each trait in each location, except for CH in Raleigh, and significance by the likelihood ratio test (LRT, p < 0.05) was also observed by comparing this model to that using compound symmetry (CS;Supplemental Table 2). For the genetic matrix, the lowest BIC was observed in the model using CS for each trait in each location (Supplemental Table 2). Significant genetic variance was observed by LRT (p < 0.05) for %GC at Citra, DGCI and CH at Citra and Tifton, and TQ at Raleigh (Fig. 1; Supplemental Table 3). The variance of entries-by-measures interaction was non-null by LRT (p < 0.05) for %GC at Citra and Tifton, DGCI at Citra, CH at Raleigh, and TQ at Tifton (Supplemental Table 3). Heritability values ranged from null (0.00) to moderate (0.55) for %GC, moderate (0.69) to high (0.88) for DGCI, low (0.34) to high (0.83) for CH, and null (0.00) to moderate (0.62) for TQ (Fig. 1).

Figure 1. Type-B genetic correlation (rg) across measures and generalized measures of heritability (H2) of 2016−2019 shade field trials evaluated for canopy height (CH), dark green color index (DGCI), percent living ground cover (%GC), and turf quality (TQ) in Citra (FL), Raleigh (NC) and Tifton (GA). * Entry variance significant by LRT at 0.05 probability level.
The type-B genetic correlation was higher for CH at Citra and Tifton, TQ at Raleigh, and DGCI at Tifton (Fig. 1). Meanwhile, moderate estimates of this parameter were observed for %GC and DGCI at Citra. Low and null estimates were obtained for all other traits (Fig. 1).
Spearman correlations between predicted values from single location analysis ranged from moderate negative to high positive across traits (Fig. 2). For CH, the correlation estimate was high for Citra-Tifton (0.76), whereas it was moderate for Citra-Raleigh and Raleigh-Tifton. For TQ, the correlation estimates ranged from low (Tifton-Raleigh and Citra-Raleigh) to moderate (Citra-Tifton). The estimates were low for all pairs of locations for %GC, and moderate for Citra-Tifton for DGCI.
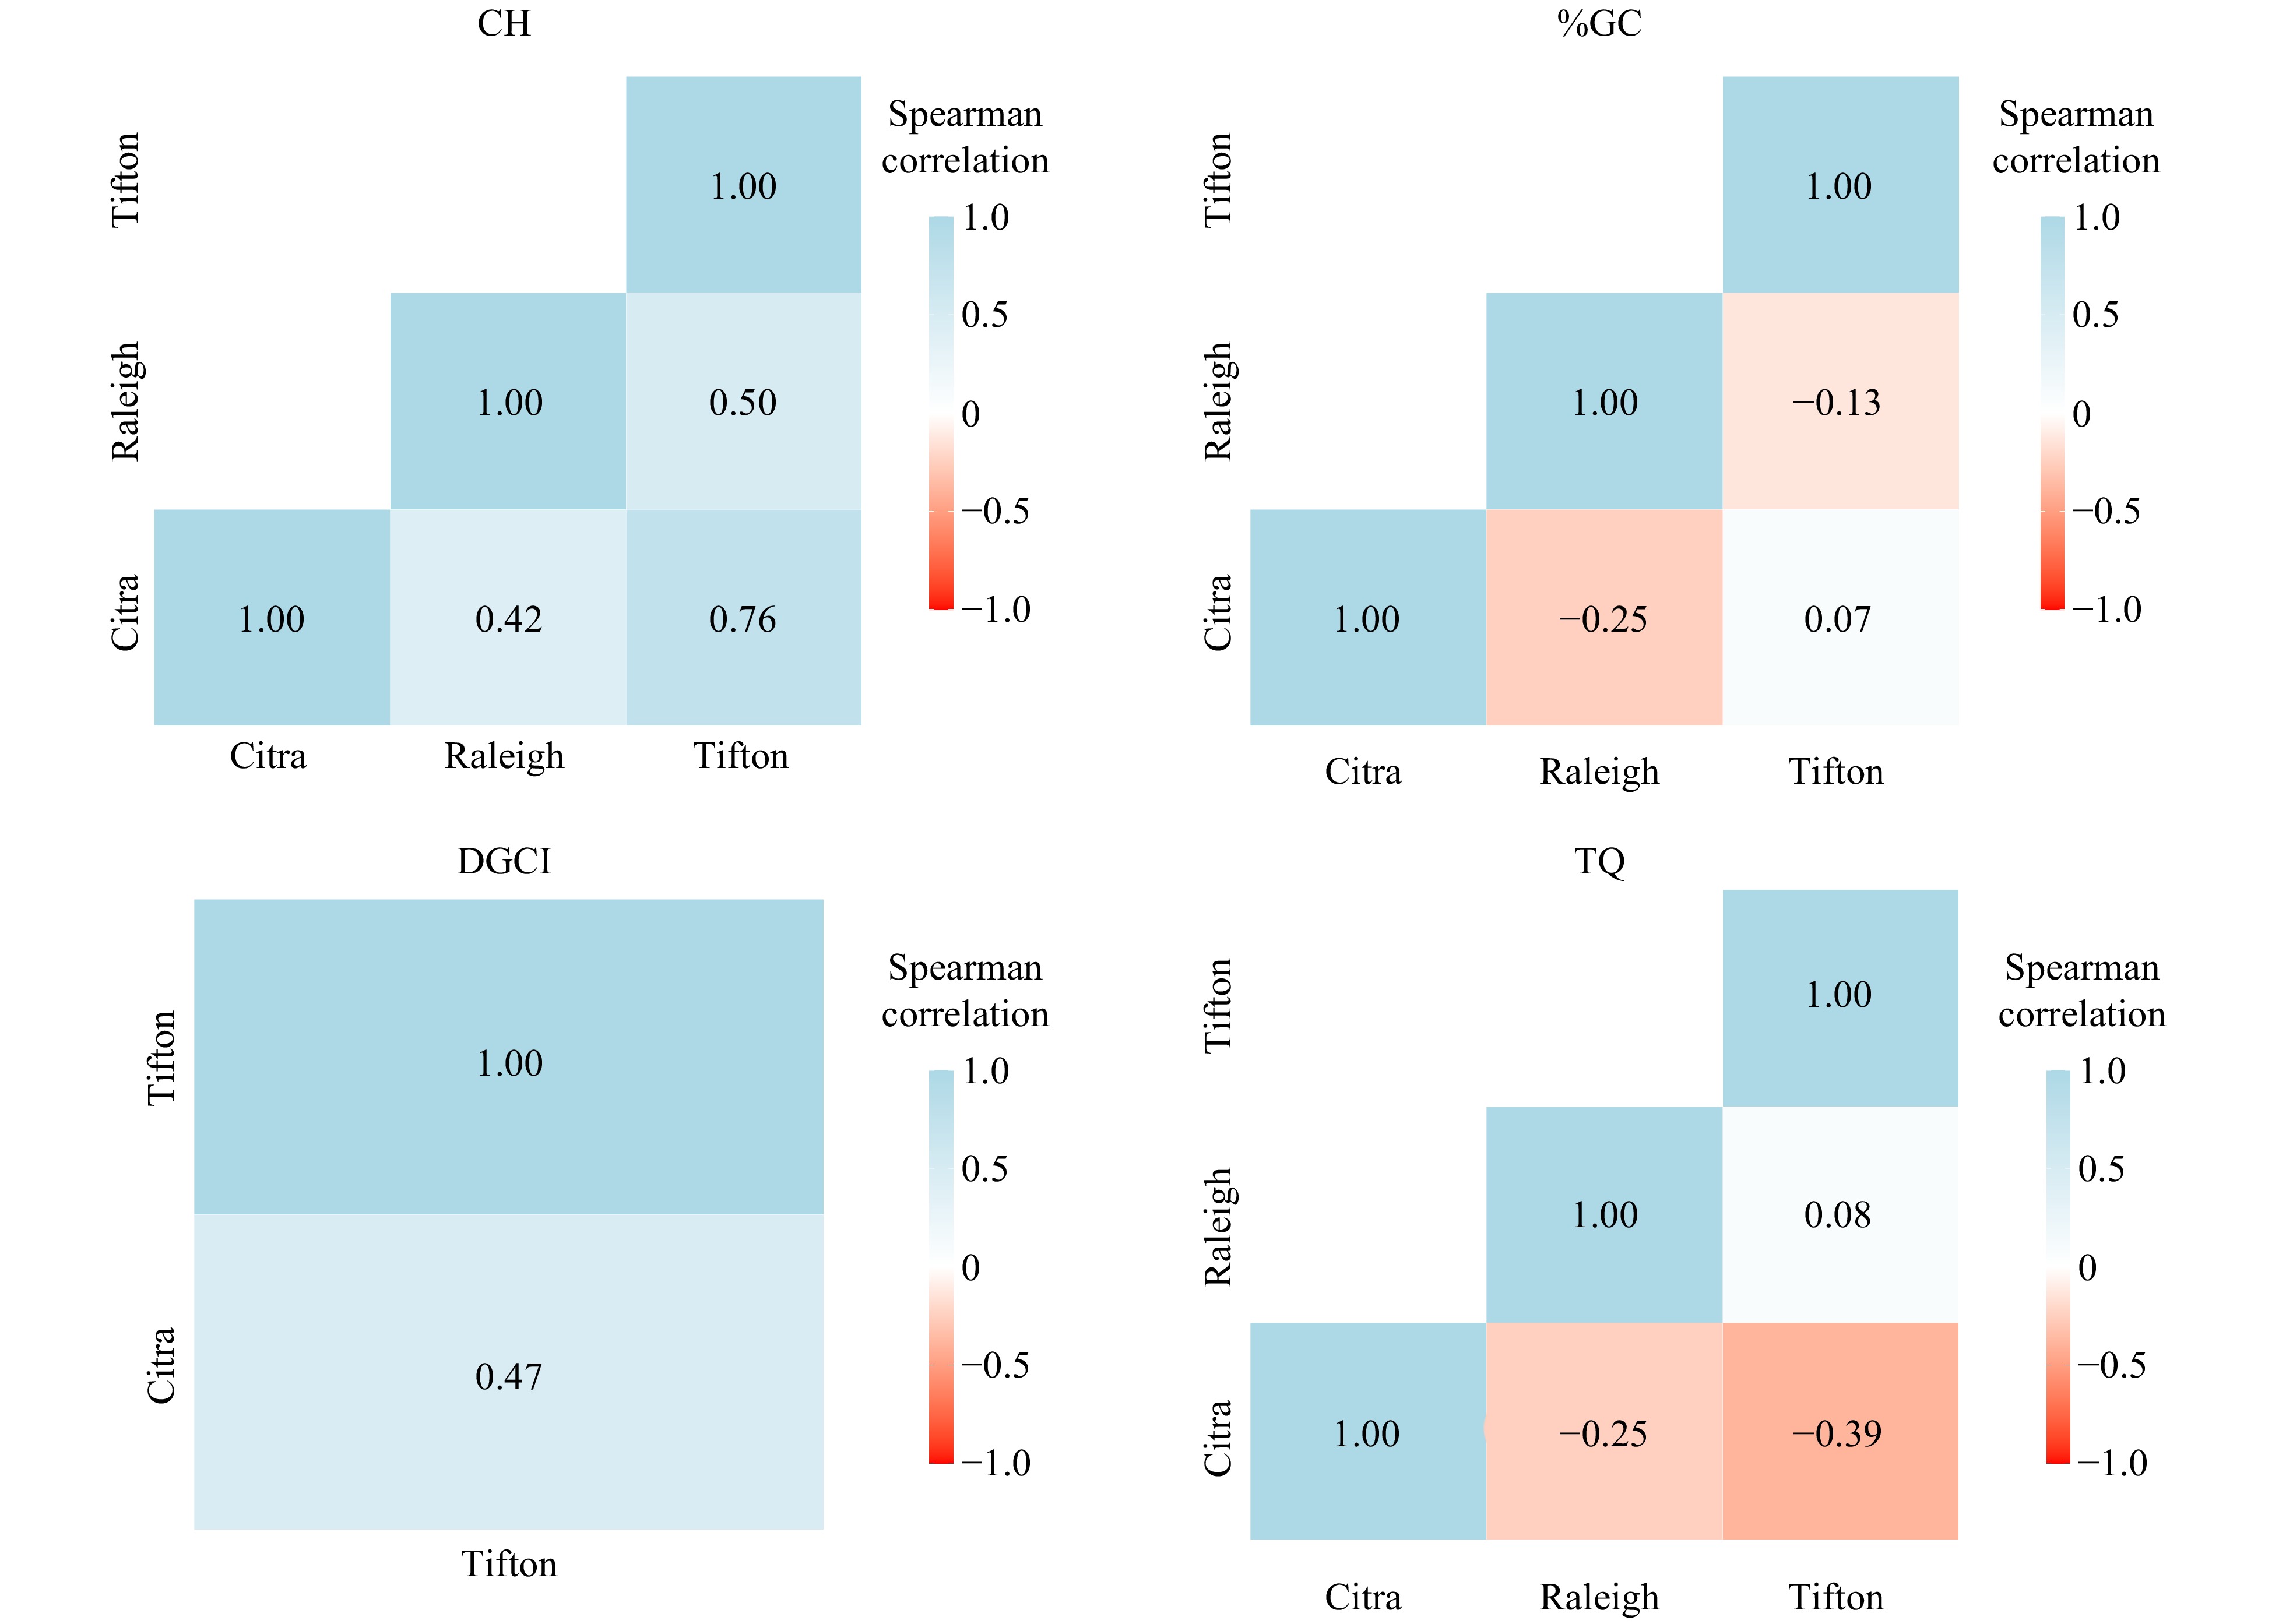
Figure 2. Spearman correlation estimates of 2016−2019 seashore paspalum shade field trials evaluated for canopy height (CH), dark green color index (DGCI), percent living ground cover (%GC), and turf quality (TQ) in Citra (FL), Raleigh (NC) and Tifton (GA).
In the principal components analyses (PCA), the first two principal components explained 71, 88 and 73% of the variation at Citra, Raleigh, and Tifton, respectively (Fig. 3). The correlation between locations or traits can be visualized by the angle between vectors, where 0° and 180° indicate that they are positive and negatively correlated, respectively, and 90° indicates that they are not correlated. In the multi-trait PCA, correlation estimates between traits varied across locations: %GC-CH at Citra and %GC-TQ at Raleigh were highly positively correlated, DGCI-TQ at Citra and DGCI-CH at Tifton were highly negatively correlated, and the rest presented low correlation estimates (Fig. 3). In turfgrass, genotypes with higher %GC, TQ and DGCI, and smaller CH are desirable. At Citra, breeding lines UGP228 and UGP269 had better performance for %GC; 'SeaStar' for TQ; UGP73, UGP198 and 31.15-2 for DGCI; and UGP198, SR31-15-15, SR31-15-14 and 'SeaDwarf' for CH (Fig. 3). In Raleigh, while SR31-15-14, UGP73 and both checks, 'SeaStar' and 'SeaDwarf', had superior performance for CH, UGP198, UGP3, UGP145, UGP171 and SR31-15-15 were the best entries for both TQ and %GC. In Tifton, UGP182 and UGP198 had good performance for both CH and DGCI. Meanwhile, UGP250 and 'SeaStar' were the top performing entries for TQ and %GC.

Figure 3. Multi-trait principal component analysis using the predicted values of single-location analysis from seashore paspalum shade field trials evaluated for canopy height (CH), dark green color index (DGCI), percent living ground cover (%GC), and turf quality (TQ) in Citra (FL), Raleigh (NC) and Tifton (GA).
Experimental lines performed above the t-BLUP average, at 0.05 significance level, in all locations and for all traits for which the entry variance was significant (Fig 4). In Citra, UGP228 performed better than the t-BLUP average for %GC; 31.15-2, UGP198 and UGP73 for DGCI; and UGP182, UGP198, SR31-15-14 and SR31-15-15 for CH. In Tifton, UGP198 and SR2014-1E had superior performance for CH; and UGP198 and UGP182 for DGCI. In Raleigh, UGP198 and UGP3 performed better than the entry t-BLUP average for TQ. Neither of the checks performed statistically above the t-BLUP average for each trait with exception of 'SeaDwarf' for CH in Citra.

Figure 4. Entries Best Linear Unbiased Predictors (BLUPs) of seashore paspalum shade trials evaluated for canopy height (CH), dark green color index (DGCI), percent living ground cover (%GC), and turf quality (TQ) in Citra (FL), Raleigh (NC) and Tifton (GA). DGCI was not evaluated at Raleigh, whereas the BLUPs of %GC at Raleigh and Tifton, and TQ at Tifton were close to zero. * Entry studentized Best Linear Unbiased Predictors significant at 5% probability by t-Student test.
-
Previous studies have identified low levels of morphological variation[2] and narrow genetic diversity[4] among cultivars of this species. Furthermore, low levels of genetic variation for TQ were observed among early generation seashore paspalum breeding lines in multi-environment trials[5]. Given that genetic gain is directly related to the presence of genetic variability in a breeding program, this apparent lack of variation poses a critical challenge to seashore paspalum breeders. However, some adaptive characters are expressed only when genotypes are exposed to a given environment[27], and thus, a population can present higher genetic variability under stress conditions. Despite the lower genetic variability usually observed in seashore paspalum, we observed significant genetic variability under stress conditions for all traits evaluated in the present study, except for TQ in Citra; %GC and TQ in Tifton; and %GC and CH in Raleigh. Therefore, these results suggest there is some genetic variability for adaptative characteristics such as shade avoidance and acclimation responses in this germplasm, since morphological changes can affect %GC, CH and TQ[14, 18, 19], and DGCI can be related to chlorophyll content[28, 29]. Moreover, genetic variance directly influences the heritability of a trait, which ranged across traits. Estimates of heritability were higher at Citra for all traits, except TQ (Fig. 1).
Significant interactions between genotypes and measures were observed for some traits in some locations. Similarly, type-B genetic correlation estimates were below 75% for the majority of traits and locations, indicating genotype performance was not consistent across measures. Interaction between genotypes and measures (or seasons) was also observed in other warm-season turfgrass studies[30, 31]. This poses a challenge in warm-season turfgrass breeding, especially in transitional zones where warm-season species go dormant in winter, because good performance across seasons is desirable in turfgrass cultivars. Thus, genotype-by-environment interaction (GEI) studies are important to identify more stable genotypes across seasons, and cold tolerance studies are essential to develop cultivars with good performance in lower temperature seasons.
The variation for magnitude and significance of genetic variance across locations is due to GEI. Spearman correlation estimates confirmed the presence of crossover GEI for the target environments for all traits. Local predictable and unpredictable factors influence genotype responses, resulting in unstable genotype performance across target environments[23, 24, 32]. In our study, the evaluations at Citra started one year later, which perhaps contributed to increased effect differences for unpredictable factors, such as year-to-year variation in rainfall and solar radiation. This, consequently, would affect the magnitude of GEI across the target locations. Additionally, in our study, the shading percentage of the neutral density shade cloth used ranged from 60% to 73% across locations. Perhaps these differences also contributed to the presence of GEI. In a pasture mixture of four species (Lolium perenne L., Holcus lanatus L., Trifolium repens L., and Lotus pedunculatus Cav.), higher performance impact was observed in shade levels above 60% and/or periods of shade longer than 4 months[33]. In turfgrass, an increment of 9% of shade, from 56 to 65%, resulted in a greater reduction in dry matter percentage of clipping material and turfgrass quality in bermudagrass (Cynodon dactylon L.) and bentgrass (Agrotis palustris Huds.), whereas bluegrass (Poa supina Schrad.) and tall fescue (Festuca arundinacea Schreb.) were less affected by those changes in shade level[34]. In our study, the effects of location and shade level could not be separated because the shading percentage was different for each location. Therefore, we could not verify the effects of those different shade levels on seashore paspalum performance. However, this was not an objective of this study. Meanwhile, it was possible to identify superior genotypes and verify some parameters under shade.
The heritability estimates and significances of genetic variances obtained at Citra suggest that this site was the best location to discriminate among genotypes, whereas Raleigh was the worst. Raleigh is located in the transitional climatic zone of the US (USDA plant hardiness zone 7), whereas Tifton and Citra are at lower latitudes (USDA plant hardiness zones 8 and 9, respectively) and are more suitable for warm-season turfgrasses. Therefore, weather factors might have affected the performance of the seashore paspalum breeding lines at Raleigh. In addition, in perennial crops, the number of measures on an individual influence the efficiency of predicting its genotypic value, which can be verified by the repeatability coefficient[35]. In our study, the higher number of measurements collected at Citra might have improved estimation of those parameters. However, studies of the number on measures needed to select superior genotypes with a satisfactory level of confidence in turfgrass are not available at this time.
Estimates of genetic correlation are useful to understand the relation between traits and ultimately to perform indirect selection. To estimate correlation, it is important that there is genetic variation in both traits since correlation quantifies the linear association between them. In our study, only %GC-CH at Citra and DGCI-CH at Tifton presented significant genetic variance for both traits and showed high correlation estimates, positive and negative, respectively. In addition, correlation for %GC-CH and DGCI-CH were not consistent across locations, the estimates were low for %GC-CH at Tifton and DGCI-CH at Citra, where all these traits presented also significant genetic variance. Unlike our study, Leinauer et al.[36] observed a higher coefficient of determination between DGCI and %GC (0.78) in seashore paspalum. The improvement of any species for multiple traits is a challenge in plant breeding, mainly when the traits are highly negatively correlated, because the goal usually is to get a cultivar with superior performance across those traits. In turfgrass, it is desirable that genotypes present high TQ, good %GC, lower CH and green color in any environment. However, our results suggested that all traits evaluated are weakly correlated, making it possible to identify superior genotypes for all evaluated traits.
A joint analysis could not be performed in this study because the evaluations at Citra started one year later and the shade level was not the same across locations. However, in all locations, we were able to identify breeding lines with superior performance for all traits for which the genetic variance was significant. Furthermore, breeding line UGP198 ranked high across locations because of its superior performance for CH and DGCI at Citra and Tifton, and TQ at Raleigh. The genotypes evaluated in our study were selected from a breeding nursery evaluated for two years at seven locations: Citra (FL), College Station and Dallas (TX), Griffin and Tifton (GA), Stillwater (OK), and Jackson Springs (NC)[5]. This evaluation was possible due to a partnership between five different breeding programs (NCSU, UF, UGA, Oklahoma State University and Texas A&M University System) across the southeastern United States that allowed participating breeders to screen their breeding lines in a greater number of environments. The shade tolerant lines identified here, like UGP198, will be tested for drought resistance, salinity tolerance, and turf quality among other traits of interest in those evaluations. Although UGP198 will require further evaluation for potential commercial release, it provides a valuable genetic resource for paspalum breeding programs wishing to improve shade tolerance. The observed genetic variability in this research justifies continued efforts to identify paspalum lines with improved shade tolerance. Future research should focus on improving shade tolerance screening techniques to reduce GEI and to improve the selection efficiency in breeding for this trait in warm season grasses.
-
Field trials were performed from 2015 to 2019 at research facilities from three partnering universities: Citra, FL (University of Florida, UF); Tifton, GA (University of Georgia, UGA); and Raleigh, NC (North Carolina State University, NCSU). For guaranteed shade in these trials, shade structures were built using a poly-fiber black shade cloth of 60% neutral density at Citra, 63% at Raleigh and 73% at Tifton. The shade cover at Citra is in place year-round; therefore, the shade was present at the time of planting and for the duration of the study. The entire structure is 20.1 × 45.7 × 2.7 m pole and cable shade structure (Long's Greenhouse Enterprise, Inc, Jacksonville, FL) installed at the Plant Science Research and Education Unit (PSREU, Lat: 29.4086096°, Long: −82.1711333°). The poles are on 3.4 m centers on the ends and 8.8 m centers on the sides (angled at 70 degrees), with six poles within the interior of the structure. The north half of the structure contains the 60% polyfiber black shade cloth used for the study. The shade cloth was 2.7 m above the soil surface and also covered the sides of the structure (Long's Greenhouse Enterprise, Inc, Jacksonville, FL). In Raleigh, the trial was conducted at Lake Wheeler Turfgrass Field Laboratory (Lat: 35.7380556°, Long: −78.6788889°). The shade cloth was installed, after planting, by connecting it to a 29.3 × 29.3 × 2.7 m pole and cable shade structure (Long's Greenhouse Enterprise, Inc, Jacksonville, FL) surrounding the plots, and the shade fabric was removed in late fall in order to simulate deciduous tree leaf drop in autumn. In Tifton, the trial conducted at Coastal Plain Experiment Station (Lat: 31.4779792°, Long: −83.5299572°), the 73% shade cloth was fastened to a permanent 20.1 × 8.2 × 4.0 m A-frame structure with Wiggle Wire® (Poly-Tex, Castle Rock, MN) after planting, and removed each fall in a smilar fashion to the Raleigh shade structure.
Twenty breeding lines from the UGA seashore paspalum breeding program and two commercial checks, 'SDX-1' (SeaDwarfTM)[37] and 'UGA-31' (SeaStar®)[38], were evaluated in this study. These lines were selected from a breeding nursery evaluated for drought tolerance for two years at seven locations: Citra (FL), College Station and Dallas (TX), Griffin and Tifton (GA), Stillwater (OK), and Jackson Springs (NC)[5]. Each trial was arranged in a randomized complete-block design with three replications at Citra and Tifton, and two replications at Raleigh. The trials were established in the spring of 2015 at Raleigh and Tifton, and 2016 at Citra using one 10.2 × 10.2 cm plug transplanted in 1.2 × 1.2 m plots with 0.3 m alleys in between. Management practices varied slightly across locations based on each location's recommendations for seashore paspalum management[39, 40]. Overall, plots were mowed weekly at 5 cm. Nitrogen (N) was applied at a rate of 146, 196 and 245 kg N/ha per year in Tifton, Citra and Raleigh, respectively, and split into three, four and six applications per year, respectively. Other nutrients were applied as needed based on soil sampling at each location and following fertility management recommendations for each state[39, 40]. Weed management was performed using chemical and mechanical control as needed in all locations. Plots were irrigated (12−26 mm) weekly (more frequently if needed) only during the establishment year in all locations.
Phenotypic data
-
The response variables evaluated were percent living ground cover (%GC), dark green color index (DGCI), canopy height (CH) and turfgrass quality (TQ). Both %GC and DGCI were evaluated using digital image analysis[41] taken inside a 61 L × 52 W × 56 H cm light box fitted with four 9-watt compact fluorescent light bulbs (TCP 5800965K, TruStart). Then, images were batch analyzed using the software SigmaScan[42]. Canopy height was measured using a graduated ruler (cm). Turfgrass quality was visually rated using a 1−9 scale as described by National Turfgrass Evaluation Program[43]. A rating of 9 indicated outstanding or ideal turfgrass quality, and 1 reflected very poor or dead turf. A TQ rating equal to or greater than 6 was generally considered as acceptable TQ[44]. Similarly, a rating of less than 6 was considered unacceptable.
Data collection was performed for three years at all locations. However, the planting date was not the same in all locations. Therefore, initiation of data collection and number of repeated measurements differed among locations and details on this are presented in Supplemental Table 1.
Statistical analysis
-
Data were analyzed using the ASReml-R package v.4[45] in the R environment[46]. The mixed model approach was performed with variance components estimation using the residual maximum likelihood (REML), tests of random effects variances by likelihood ratio test (LRT) and fixed effects by Wald test[47].
For each location and trait, except for TQ at Citra, single-location-repeated-measures analysis was performed using the model:
$ \bar {{y}}={\rm{\mu }{{1}}}+{{X}}_{1}{{b}}+{{X}}_{2}{{m}}+{{Z}}_{1}{{g}}+{{e}} $ (1) where, y is the vector of phenotypic values; µ is the overall mean; X and Z are the incidence matrices for fixed and random effects, respectively; b is the fixed vector of block effects; m is the fixed vector of measure effects; g is the random vector of entries effects with
$g\sim NMV\left(0, G \otimes \mathrm{I}\right)$ ; and e is the random vector of errors with$e\sim NMV\left(0, R \otimes \mathrm{I}\right)$ . R is the covariance matrix of residuals, G is the genetic covariance matrix, 1 is a vector of ones and I is an identity matrix of its proper size. The Kronecker product is denoted by$ \otimes $ .In Citra, the trial was evaluated once for TQ (Supplemental Table 1). Thus, the single-location analysis was performed using the model:
$ \bar {{y}}={\rm{\mu }}{{1}}+{{X}}_{1}{{b}}+{{Z}}_{1}{{g}}+{{e}} $ (2) where, y is the vector of phenotypic values; µ is the overall mean; X and Z are the incidence matrices for fixed and random effects, respectively; b is the fixed vector of block effects; g is the random vector of entries effects with
$g\sim {MVN}(0, \sigma_g^2 I)$ , where$\sigma_g^2 $ is the variance component of the entries; and e is the random vector of residual effects with$e\sim{MVN}(0, \sigma_e^2 I)$ , where$\sigma_e^2 $ is the variance component of the residuals. 1 is a vector of ones and I is an identity matrix of its proper size.The modeling of the residual (R) and genetic (G) variance/covariance matrices was performed for each trait and location in Eq. [1], except for TQ at Citra. The change in matrix structure was done sequentially by increasing their complexity from CS (simplest structure) to unstructured (US) (most complex)[48]. First, the best structure for R was identified, and then for G. The best structure for R and G was indicated by the lower Bayesian Information criterion (BIC) as proposed by Schwarz[49]. Then, the LRT test was used to verify significance of the most complex structure for each matrix, R and G, in the fitted model.
The Spearman correlation between locations was estimated with the package Agricolae[50] in R, using predicted values of the entries obtained from single trial analyses. Type-B genetic correlations were calculated using the estimator
$ {r}_{g}=\dfrac{{\sigma }_{g}^{2}}{{\sigma }_{g}^{2}+{\sigma }_{i}^{2}} $ for Eq. (1), where$\sigma_g^2 $ is the variance component of the entries and$ \sigma_i^2 $ is the variance component of the entries-by-measures interaction. Generalized measures of heritability, proposed by Cullis et al.[51], were estimated using the standard estimator H2 =$ 1-\dfrac{{{\bar {v}}_{\Delta }^{\mathrm{B}\mathrm{L}\mathrm{U}\mathrm{P}}}}{{2{\sigma }_{g}^{2}}} $ for Eq. (1) and Eq. (2), where$ {{ \bar {v}}_{\Delta }^{\mathrm{B}\mathrm{L}\mathrm{U}\mathrm{P}}} $ is the mean variance of the difference between two Best Linear Unbiased Predictions (BLUPs) for the genotypic effect.Principal component analyses (PCA) were carried out using predicted values of entries for each trait in Eq. (1) and (2), followed by the construction of biplots of the first two principal components. The R package stats[46] was used to perform these analyses, and the packages ggfortify[52] and ggplot2[53] were used to construct biplots. The studentized BLUP (t-BLUP) was estimated based on the expression
$ t-BLUP=\dfrac{BLUP}{SE} $ , where BLUP is the prediction for each hybrid and SE is the standard error of the respective BLUP[54]. - Funding for this project was provided by a Specialty Crop Research Initiative grant [2015-51181-24291] from the USDA National Institute for Food and Agriculture
- The authors declare that they have no conflict of interest.
- Supplemental Table 1 Measures across time from 2016 to 2019 for percentage of turfgrass coverage (%GC), dark green color index (DGCI), canopy height (CH) and turfgrass quality (TQ) in seashore paspalum trials conducted in Citra, FL, Raleigh, NC and Tifton, GA.
- Supplemental Table 2 Bayesian information criterion (BIC) for single-location-repeated-measures analysis models using different structures in the genetic (G) and residual (R) variance/covariance matrix.
- Supplemental Table3 Estimates of entry variance (${\sigma }_{g}^{2}$), entry-by-measures interaction variance (${\sigma }_{i}^{2}$) and predicted mean of genotypes ($\overline y $) evaluated in single location repeated-measures analysis for percent living ground cover (%GC), dark green color index (DGCI), canopy height (CH) and turfgrass quality (TQ).
- Copyright: © 2021 by the author(s). Exclusive Licensee Maximum Academic Press, Fayetteville, GA. This article is an open access article distributed under Creative Commons Attribution License (CC BY 4.0), visit https://creativecommons.org/licenses/by/4.0/.
-
About this article
Cite this article
Gouveia BT, Raymer P, Schwartz BM, Rios EF, Kenworthy KE, et al. 2021. Seashore paspalum (Paspalum vaginatum Sw.) performance under shade in multi-environment trials. Grass Research 1: 6 doi: 10.48130/GR-2021-0006

Seashore paspalum (Paspalum vaginatum Sw.) performance under shade in multi-environment trials
- Received Date: 23 March 2021
- Accepted Date: 09 July 2021
- Published Online: 26 July 2021
Abstract: Shade caused by trees or buildings can affect the quality and growth of turfgrasses. Thus, breeding for shade tolerance is an essential component of most turfgrass improvement programs. The objective of this study was to evaluate the performance of seashore paspalum (Paspalum vaginatum Sw.) breeding lines under shade in multi-environment trials. Germplasm sources were 20 lines from the University of Georgia seashore paspalum breeding program and two checks, the cultivars 'SeaDwarf' and 'SeaStar'. Field trials were conducted from 2016 to 2019 under shade structures designed to reduce ambient sunlight at three locations: Citra (FL), Tifton (GA), and Raleigh (NC). The response variables evaluated were percent living ground cover (%GC), dark green color index (DGCI), canopy height (CH) and turfgrass quality (TQ). Data were analyzed by mixed model approaches using ASReml-R, and the t-statistics were used to group the entries. Significant genetic variances were observed in the single-location-repeated-measures analysis for CH and DGCI at Citra and Tifton, %GC at Citra, and TQ at Raleigh. Spearman correlations of the predicted values for entries between locations ranged from low to moderate, with the exception of between Citra and Tifton (0.76) for CH. There were a few breeding lines with superior performance to the entry average for all traits for which the entry variance was significant. In conclusion, genetic variability was observed for all traits and superior seashore paspalum breeding lines for multiple traits were identified under shade.
-
Key words:
- shade tolerance /
- breeding /
- genotype by environment interaction /
- heritability