-
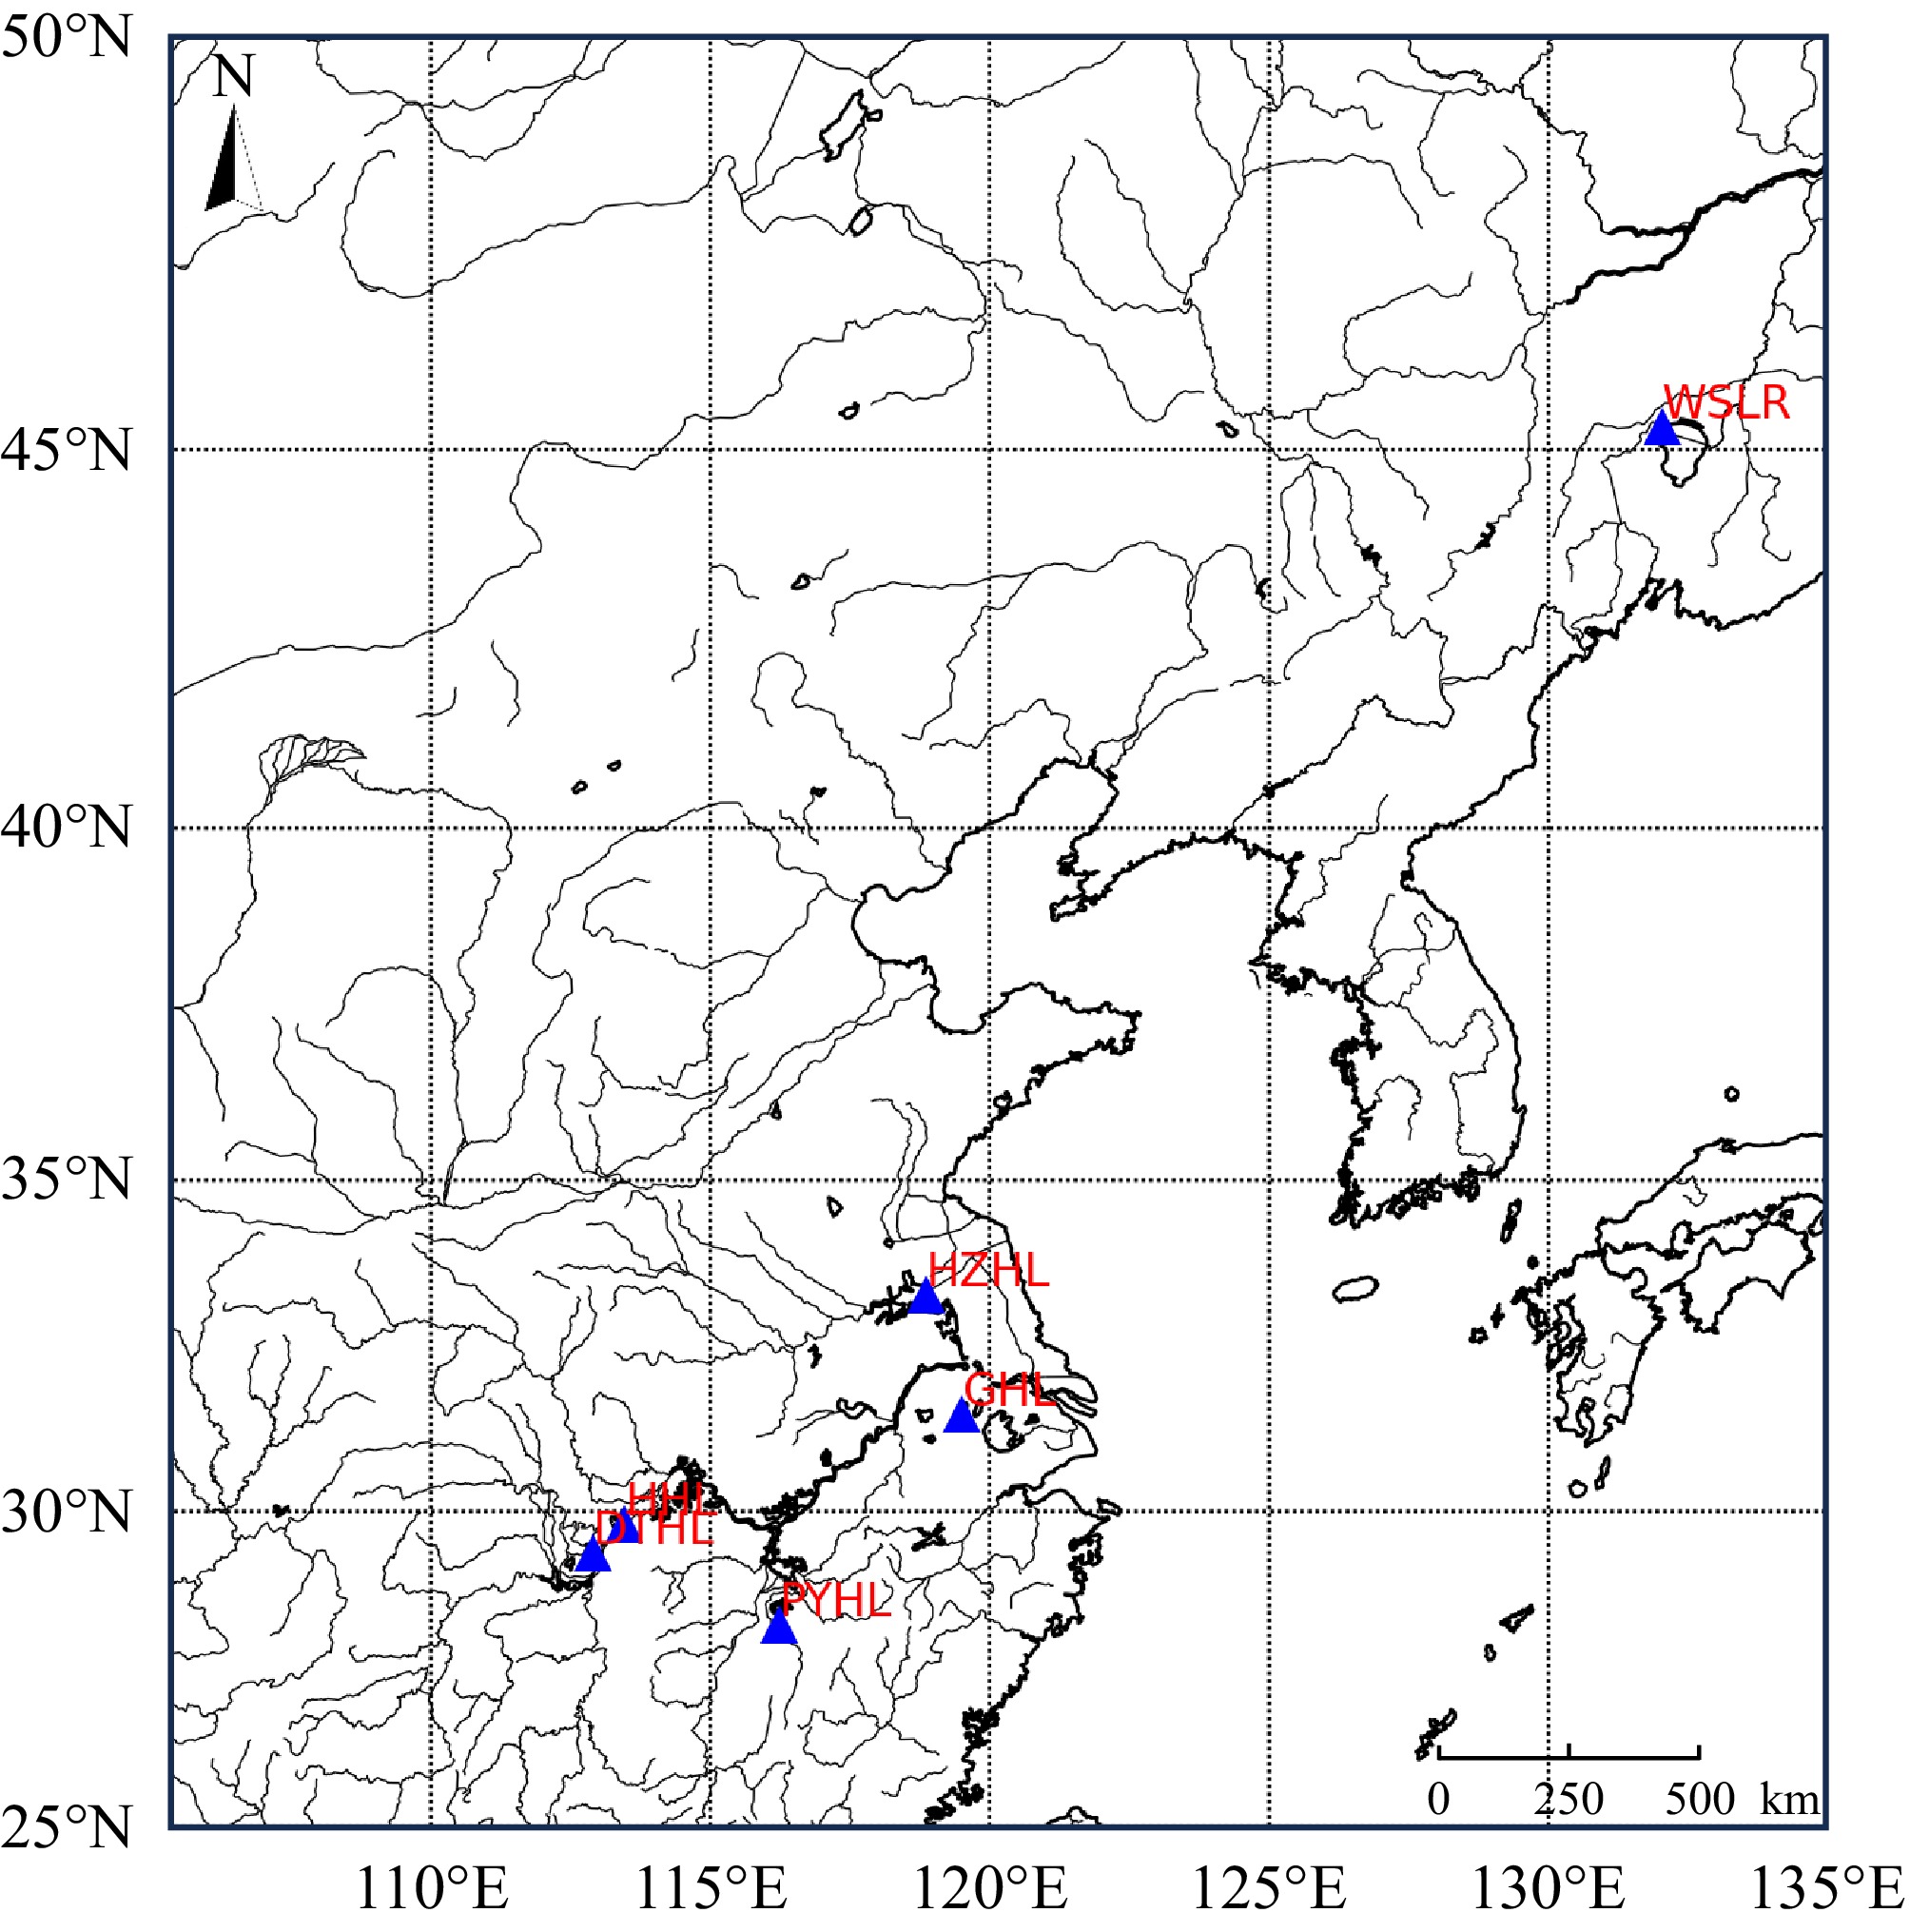
Figure 1.
Sampling localities of six yellow catfish populations.
-
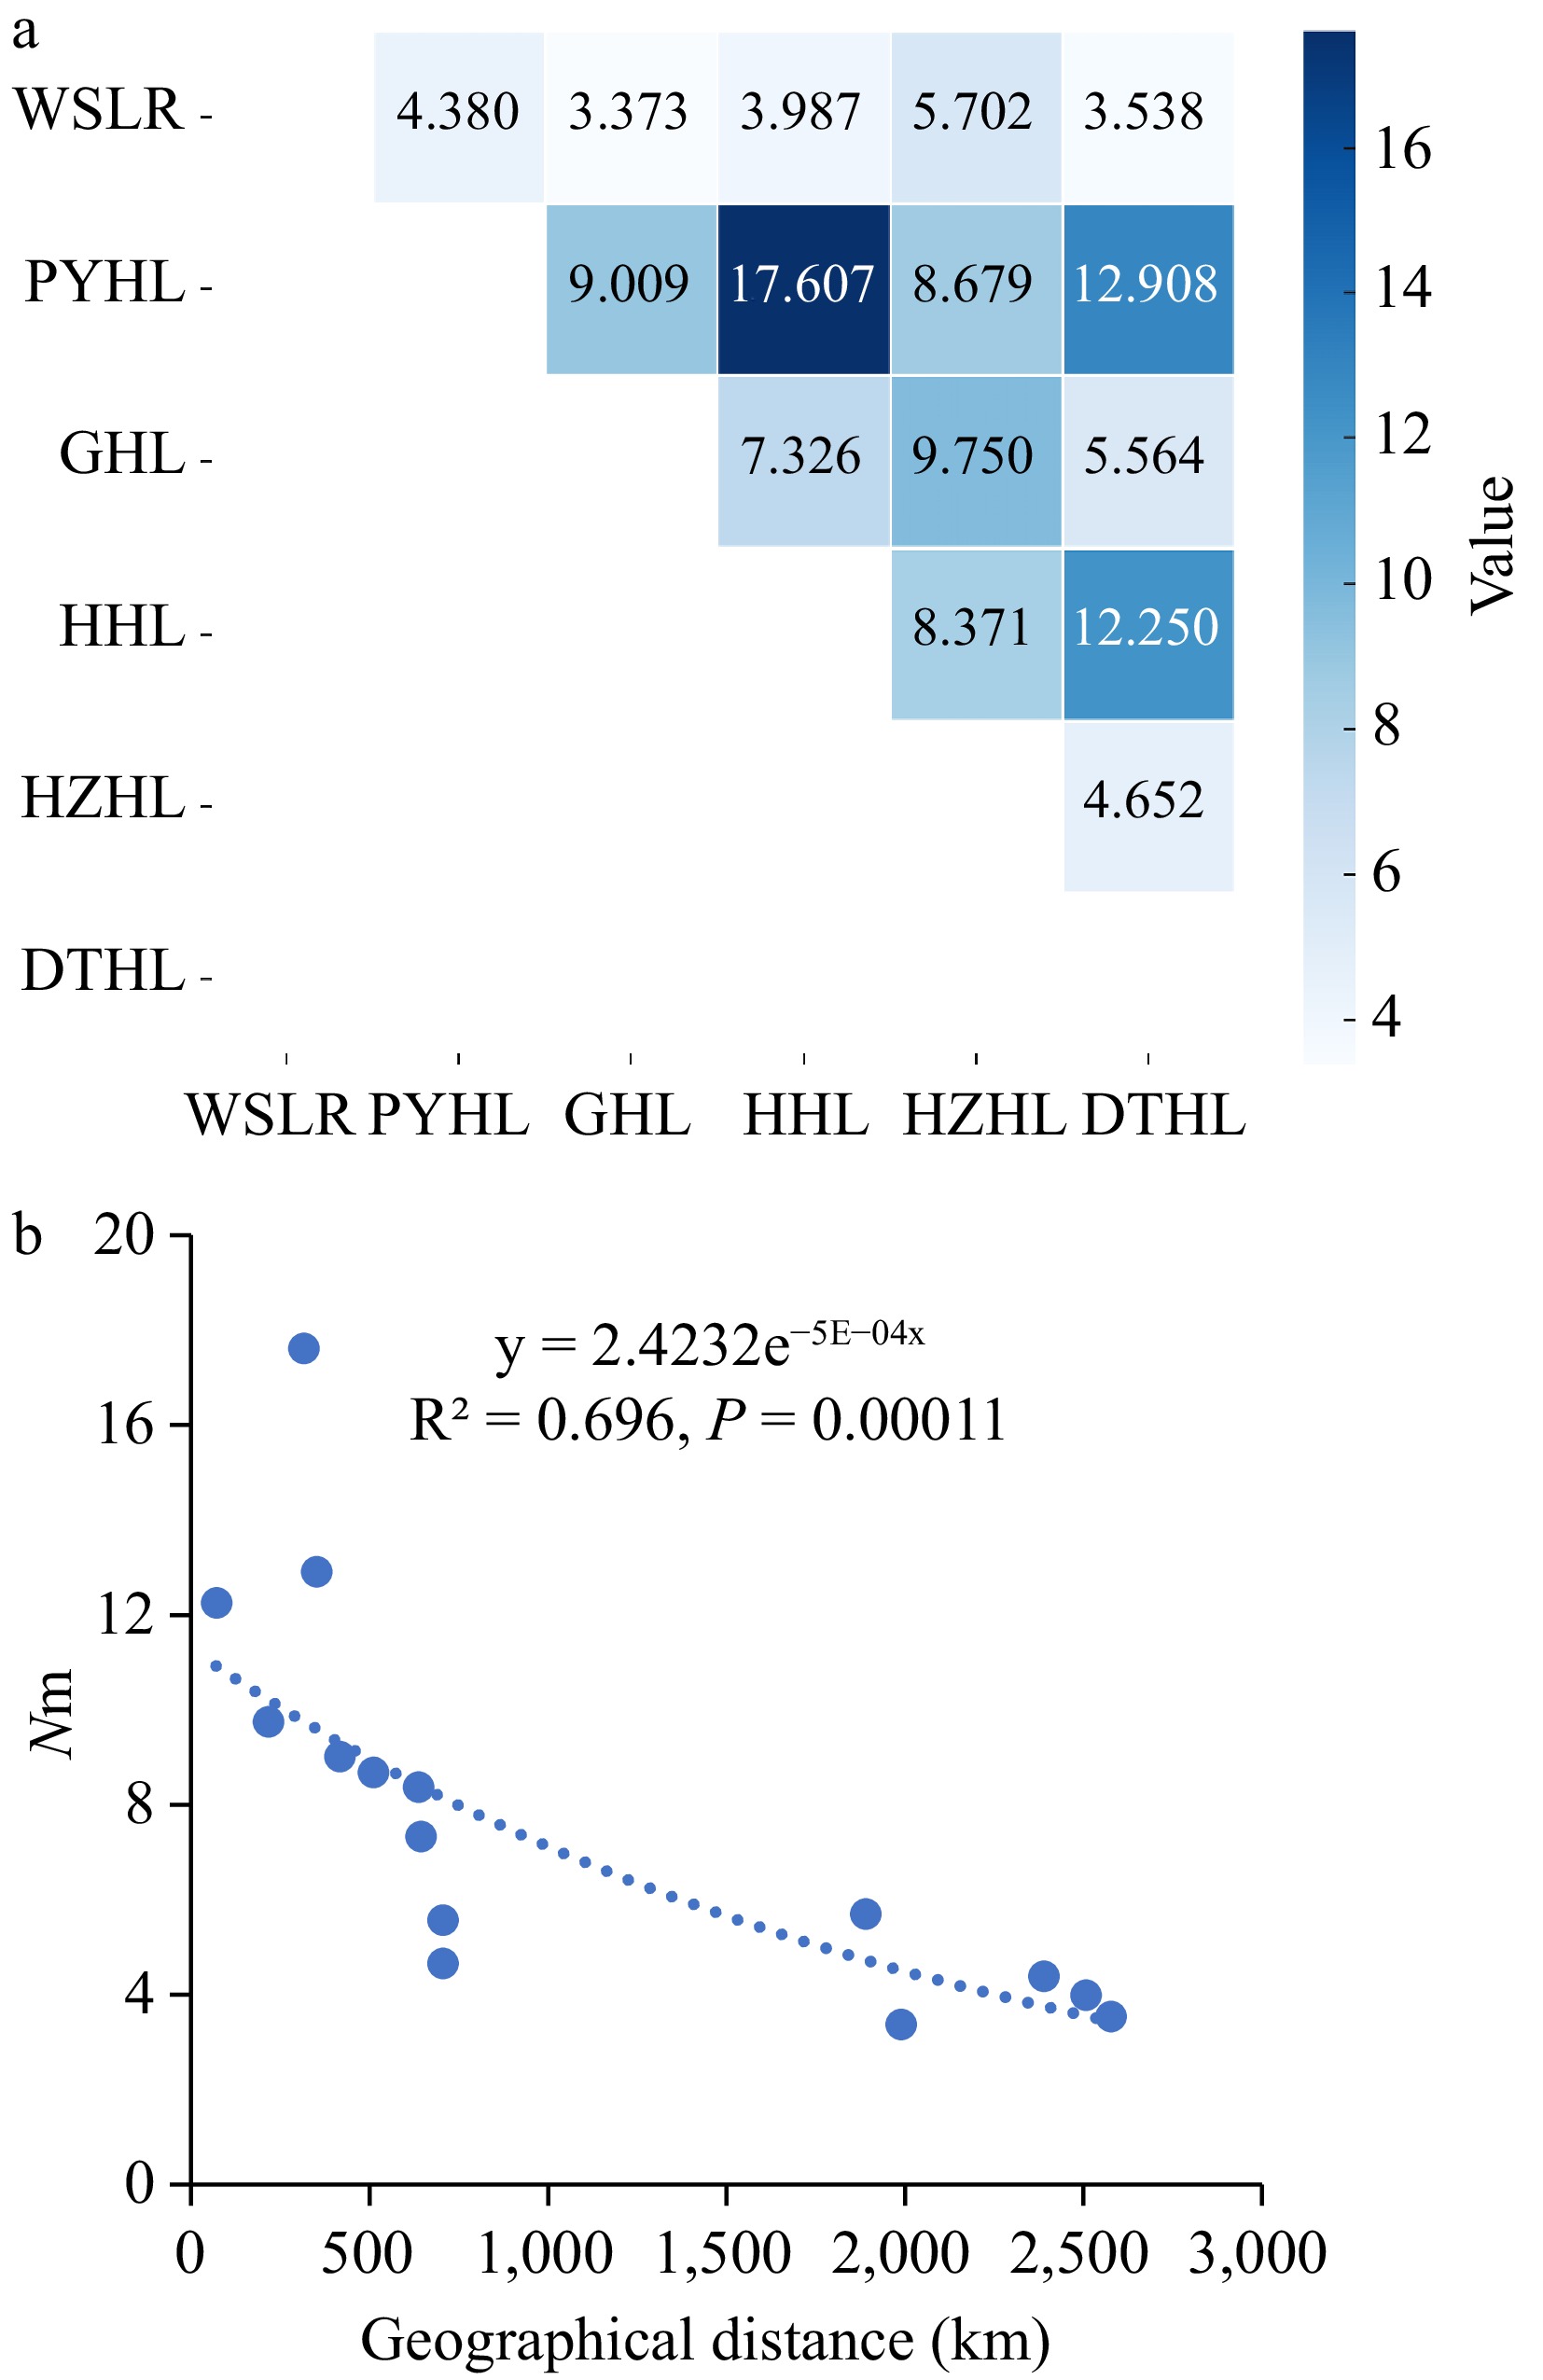
Figure 2.
Gene flow (Nm) analysis of six yellow catfish populations. (a) Matrix of pair-wise estimated gene flow (Nm) among six yellow catfish populations; (b) Linear regression analysis of gene flow (Nm) and geographic distance.
-
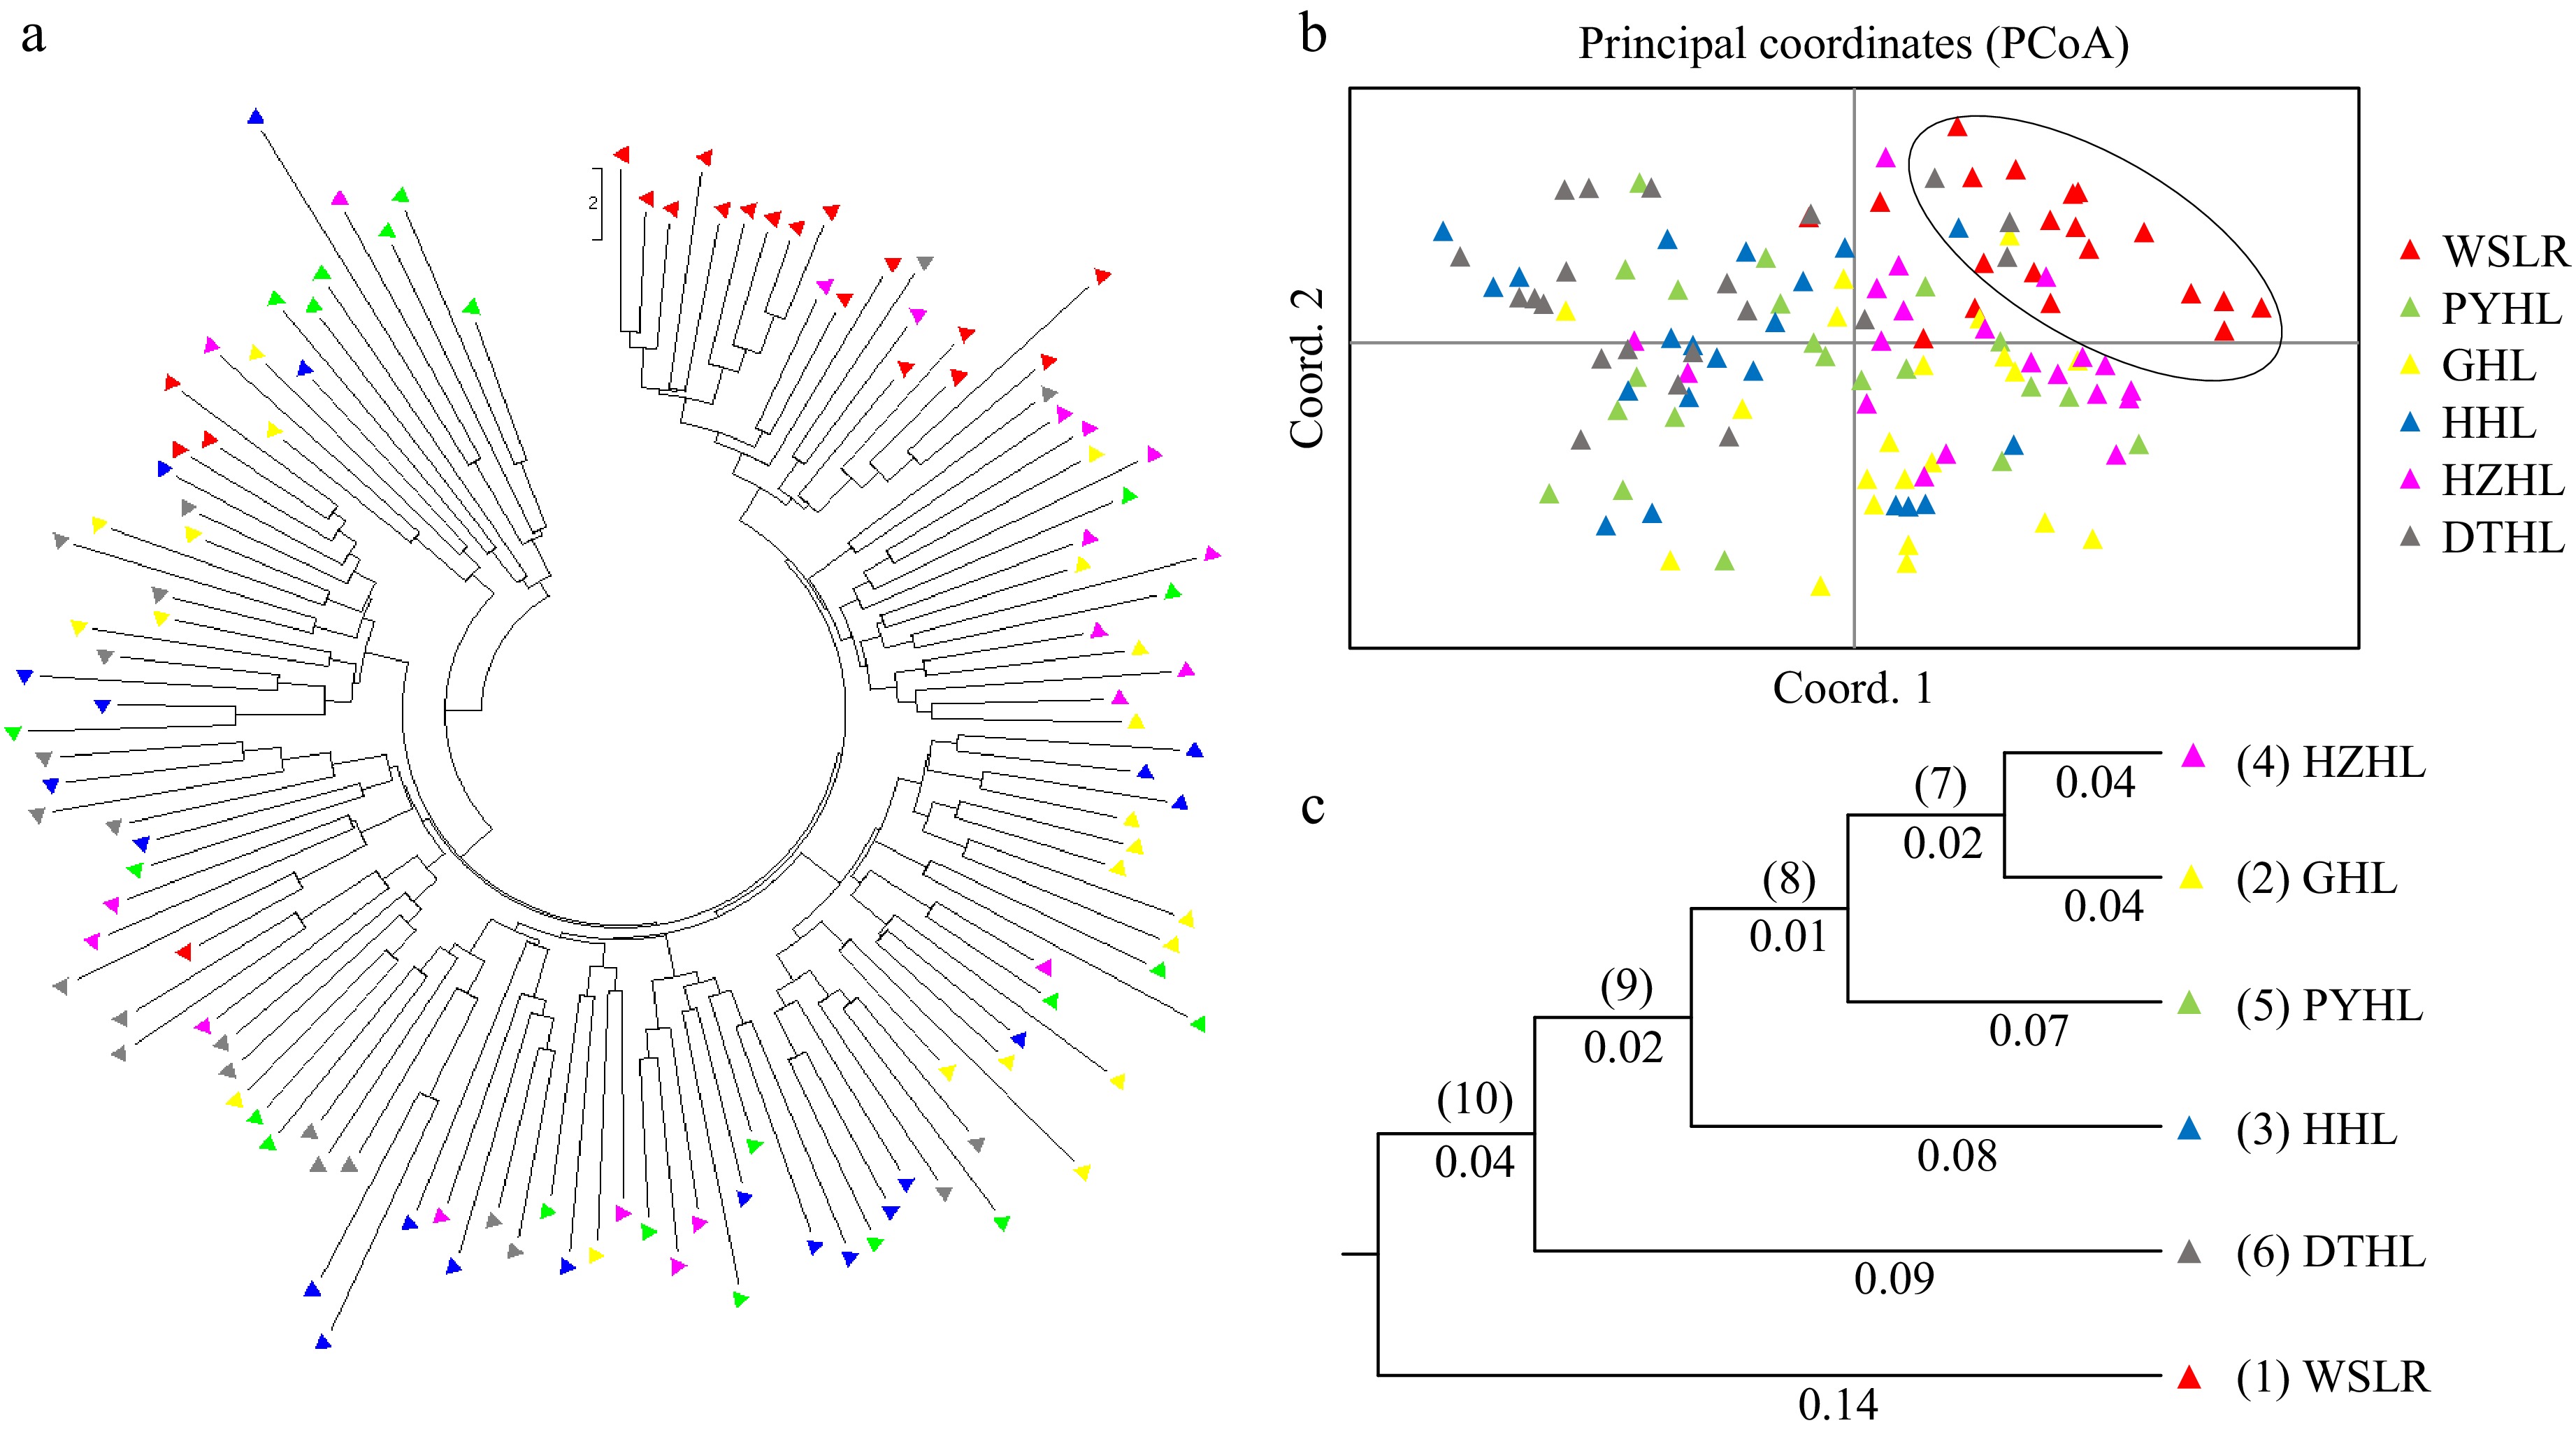
Figure 3.
Population and individual clustering analysis of six yellow catfish populations. (a) Genetic relatedness of 124 individuals depicted by a circular phylogenetic tree; (b) Principal coordinates analysis (PCoA) plot of 124 individuals in six yellow catfish populations; (c) UPGMA dendrogram based on Nei's genetic distance among six yellow catfish populations.
-
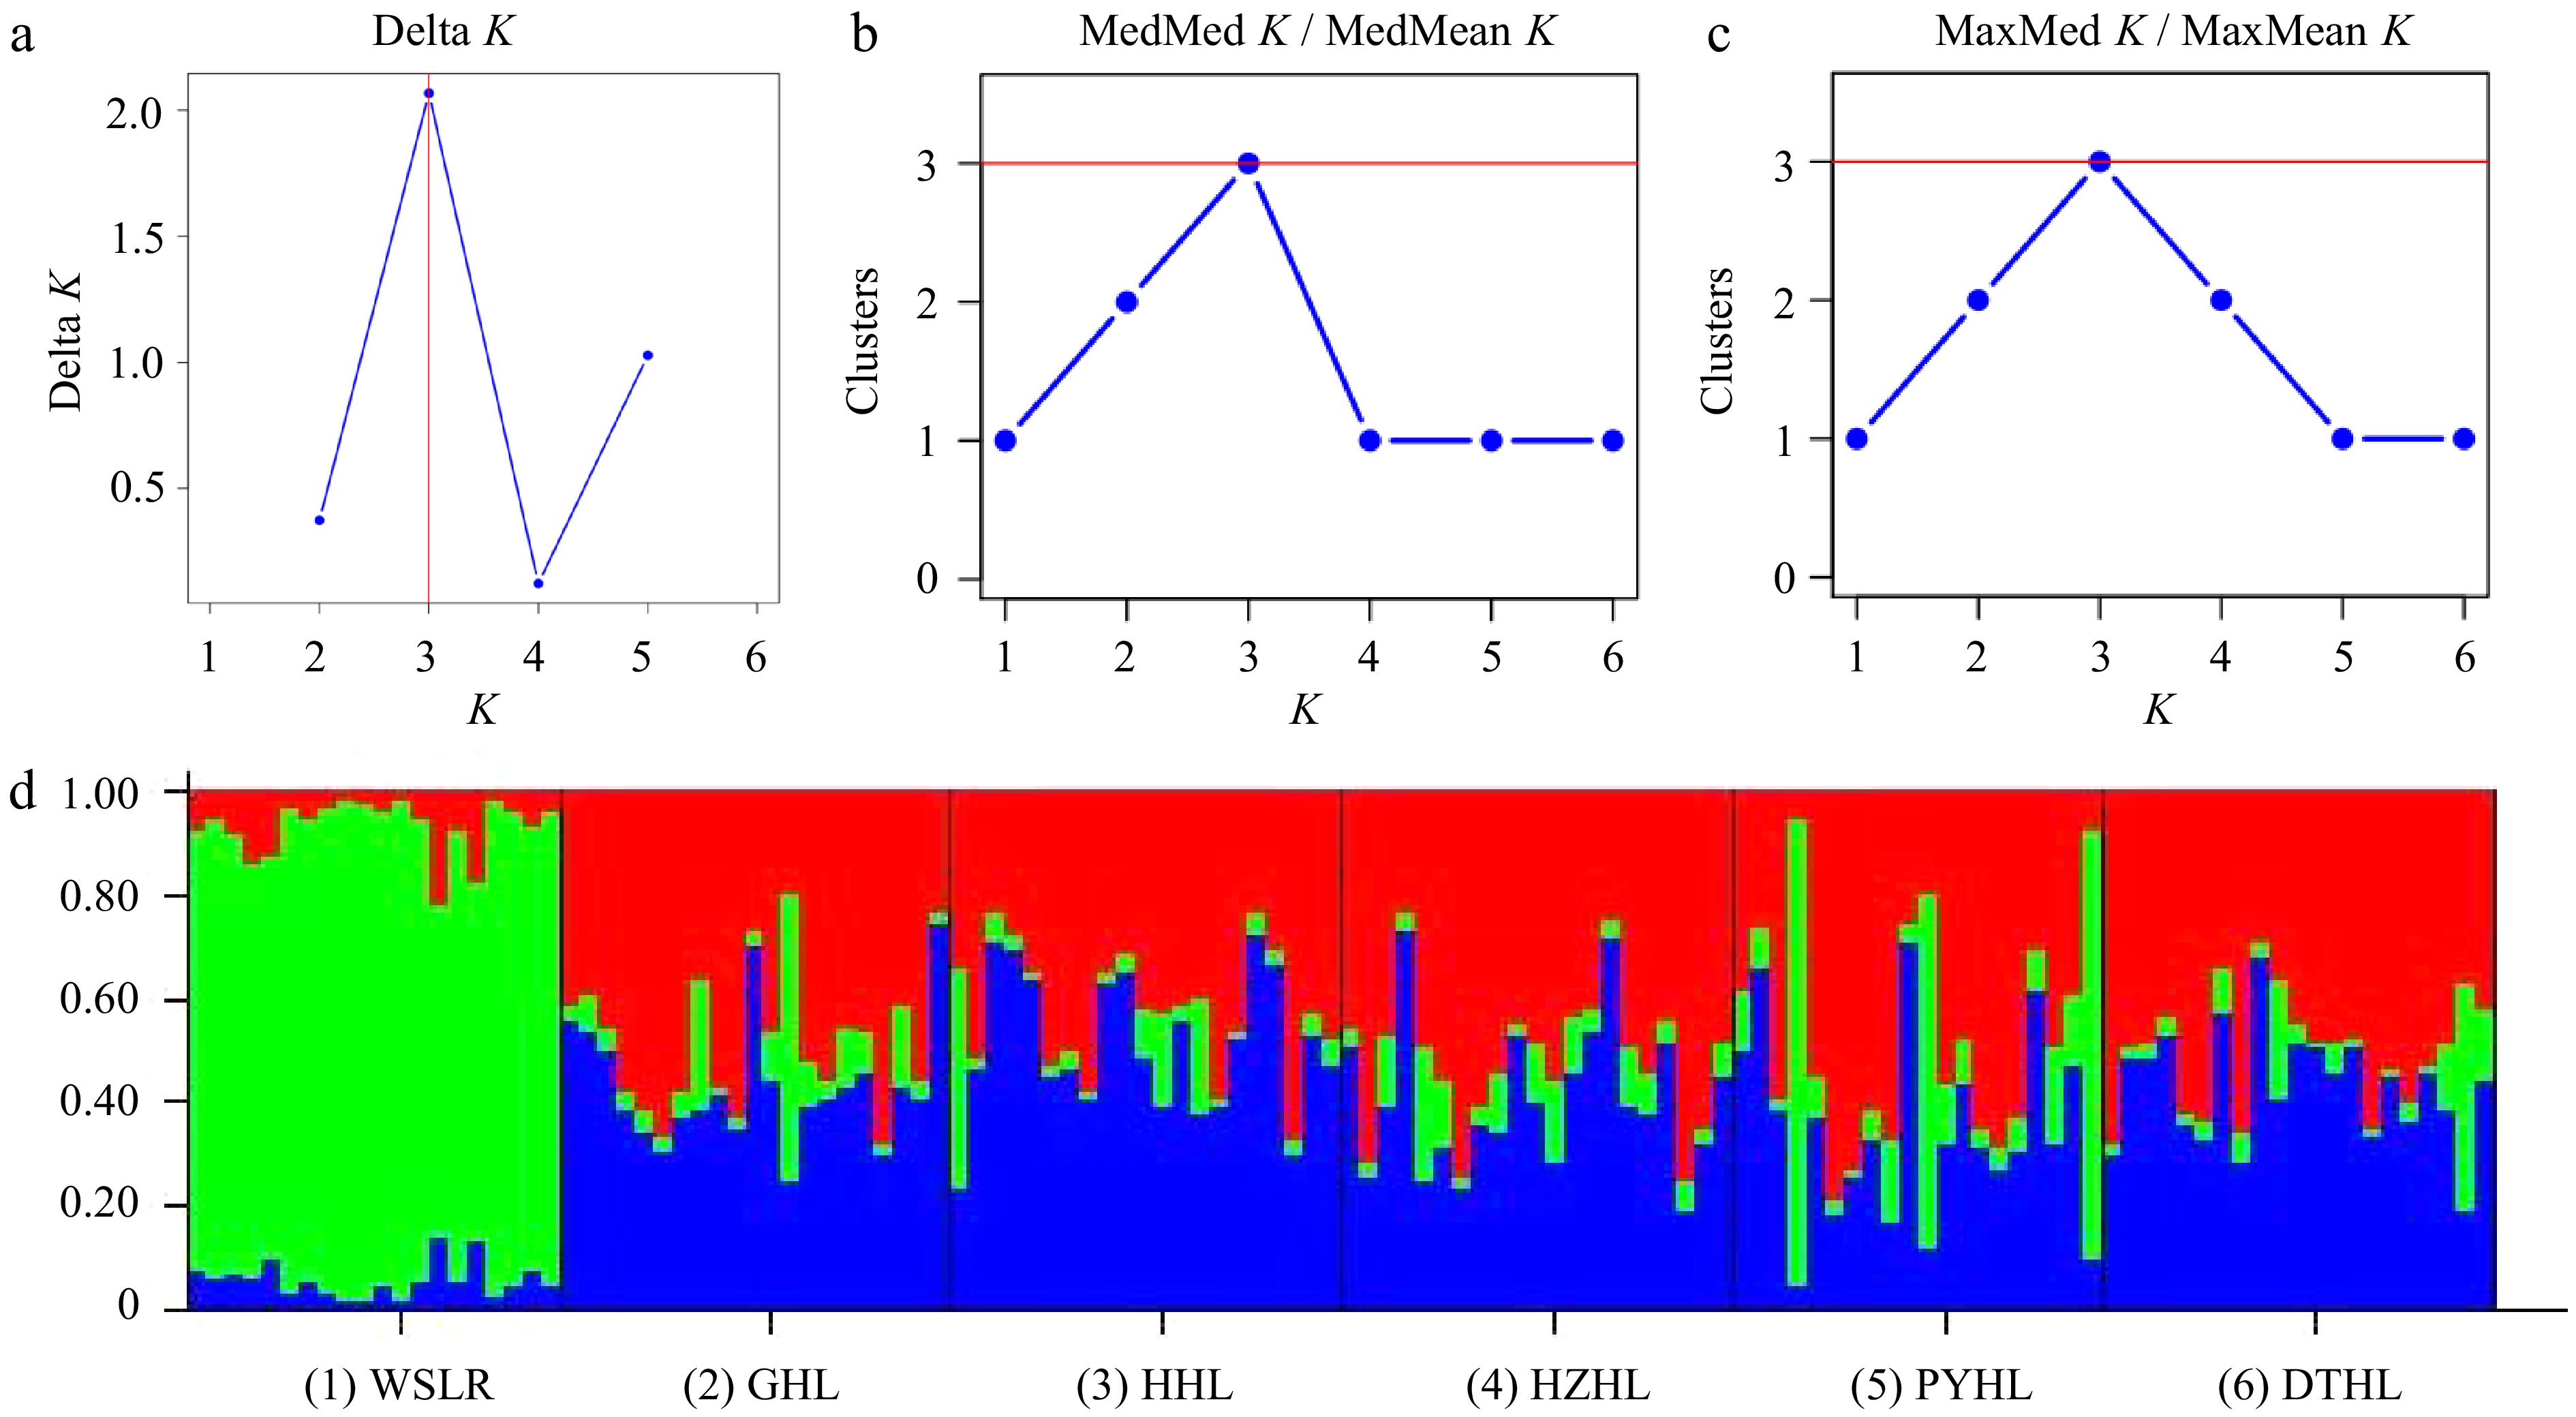
Figure 4.
Ancestral lineage analysis of six yellow catfish populations. (a) Delta K, (b) MedMed K / MedMean K, and (c) MaxMed K / MaxMean K plots indicating the best number of clusters (K) of the STRUCTURE analysis. (d) Cluster assignment from STRUCTURE averaged over six replicated runs for K = 3. Colors represent different clusters.
-
Population Collection date Geographic locations Sample size DTHL 2018-4-6 Hunan (113°0′58″ E, 29°23′35″ N) 21 GHL 2018-6-13 Jiangsu (119°53′35″ E, 31°38′1″ N) 21 HHL 2018-4-8 Hubei (113°28′40″ E, 29°52′44″ N) 21 HZHL 2018-6-9 Jiangsu (118°49′12″ E, 33°21′36″ N) 20 PYHL 2018-4-10 Jiangxi (116°38′7″ E, 29°10′13″ N) 21 WSLR 2018-9-21 Heilongjiang (133°41′7″ E, 45°59′20″ N) 20 Table 1.
Sampling information of six populations of yellow catfish.
-
Locus Chromosome Location Primer sequences (5'-3') Tm ( °C) Label Size Ref. AG12 15 5859684…5859993 F: TTCTGAGGGGATGGTG 52 FAM 255−335 [10] R: GCGGTGCTCTGTGGTTGTC AG128 17 22452450...22452570 F: AAACCGACGGGACAAAAGAT 53 HEX 104−140 R: CTCTGCCTCACTAACT CT81 9 22532293…22532445 F: GTCTCCATCACTGCCACAT 55 FAM 135−161 R: TCAGCAATTATGTGAAAAGTGTCT PF01 1 3380349…3380609 F: TCTGCTGTGCCACCTTCATCT 54 HEX 254−280 [15] R: GGCAGGTTCCAGCCGTCAATA PF03 23 3321850…3322202 F: GCAACAACAGAACGAAAAAAG 55 FAM 346−354 R: ACGCTACACAGCAGAGGAAGT PF05 7 11753992…11754513 F: GAGTAAGTAAGTGATAATATGGAG 56 HEX 467−527 R: TCCTACTGTCTTTCACTCTACT PF08 20 18894877…18895050 F: AACATCACATTGTTTCTCACCATCC 56 FAM 149−227 R: AAAGTGAAAGAGAAGTTACGGAGGC PF130 10 18287250…18287472 F: CTTTGTAACTGGTATCGTTCTCTAC 55 HEX 203−277 R: TGCTATTGCTAAAGAGGGAGA PF448 19 2770597…2770941 F: TGCTCGAGTGAGCTACGA 54 FAM 312−392 R: CATCTCTATCTTTTTATTTCACATT PF532B 6 28255806…28255978 F: CGTCGTATCACCTGAAAT 53 HEX 134−200 R: TGAGAGGAGGAGTCTTTGA Table 2.
Sequence of the primers used to amplify SSR markers.
-
Populations Na Ne Ho He PIC I WSLR (n = 20) 9.000 3.764 0.614 0.588 0.569 1.425 PYHL (n = 21) 10.700 6.715 0.622 0.714 0.696 1.818 GHL (n = 21) 10.100 6.052 0.662 0.684 0.665 1.717 HHL (n = 21) 11.200 6.997 0.661 0.727 0.710 1.872 HZHL (n = 20) 11.500 7.292 0.632 0.695 0.682 1.849 DTHL (n = 21) 10.300 6.619 0.667 0.705 0.685 1.765 Table 3.
Genetic polymorphic parameters of six yellow catfish populations.
-
Locus WSLR PYHL GHL HHL HZHL DTHL n = 20 n = 21 n = 21 n = 21 n = 20 n = 21 AG12 1.000 0.186 0.801 0.693 0.614 0.260 AG128 1.000 0.016* 0.032* 0.198 0.597 0.931 CT81 1.000 0.991 0.967 1.000 1.000 0.773 PF01 1.000 0.098 0.345 0.790 0.002** 0.774 PF03 0.305 0.780 0.685 0.605 0.581 0.514 PF05 0.988 0.995 0.381 0.000*** 0.000*** - PF08 0.995 0.805 0.085 0.101 0.372 0.707 PF130 0.772 0.919 0.761 0.062 0.968 0.988 PF448 0.000*** 0.000*** 0.000*** 0.000*** 0.001** 0.003** PF532B 0.987 0.058 1.000 0.411 0.070 0.024* * Indicates a deviation from Hardy-Weinberg equilibrium (p < 0.05); ** Indicates significant deviation from Hardy-Weinberg equilibrium (p < 0.01); *** Indicates very significant deviation from Hardy-Weinberg equilibrium (p < 0.001). Table 4.
Hardy-Weinberg equilibrium chi-square test in six yellow catfish populations.
-
Source of variation df Sum of squares Variance components Percentage
of variationAmong populations 5 5.362 0.015 3% Among individuals 118 54.876 0.027 6% Within individuals 124 51.000 0.411 91% Total 247 111.238 0.453 100% Table 5.
Molecular variance analysis (AMOVA) of six yellow catfish populations.
-
WSLR PYHL GHL HHL HZHL DTHL WSLR − 0.054 0.069 0.059 0.042 0.066 PYHL 0.324 − 0.027 0.014 0.028 0.019 GHL 0.261 0.135 − 0.033 0.025 0.043 HHL 0.281 0.084 0.181 − 0.029 0.020 HZHL 0.254 0.157 0.134 0.166 − 0.051 DTHL 0.305 0.098 0.190 0.109 0.231 − Table 6.
Matrix of pair-wise Nei's genetic distance (below diagonal) and Fst values (above diagonal) among six yellow catfish populations.
Figures
(4)
Tables
(6)