


-
The yellow catfish (Pelteobagrus fulvidraco), belonging to the order Siluriformes, family Bagridae, and genus Pelteobagrus, is an important small-sized economic freshwater fish widely distributed across lakes and rivers in East and South Asia, especially in most water systems of China[1]. Due to its high nutritional value and lack of intramuscular spines, the yellow catfish is highly favored by consumers in China. It has thus become one of the most important freshwater species in the country's aquaculture industry, with an annual production exceeding 600,000 tons[2]. However, yellow catfish exhibits slow growth during farming, along with significant sexual dimorphism, where males grow significantly faster than females[3]. This sex-based difference significantly affects the economic profitability of the aquaculture industry, highlighting the need to enhance both the growth rate and genetic diversity of this species. Addressing these challenges in growth and sexual dimorphism requires the implementation of sex-specific breeding programs and growth-focused genetic selection strategies to improve production efficiency.
Genetic diversity is a critical factor for species' adaptability to environmental changes, and its level determines the evolutionary potential and survival capacity of populations[4]. However, due to long-term artificial selection and intensive farming, the genetic resources of yellow catfish are at risk of depletion, especially in geographically isolated populations where limited gene flow leads to increased inbreeding and a decline in genetic diversity[5]. Therefore, assessing the genetic diversity of yellow catfish across different geographic populations is essential for germplasm conservation and scientific breeding.
Microsatellite markers (SSR), known for their high polymorphism, widespread distribution, and stable co-dominant inheritance patterns, have been widely used in genetic diversity studies of aquatic animals[6]. Using SSR markers allows for effective assessment of population genetic structure and diversity levels in aquatic species, providing theoretical support for germplasm conservation and the development of breeding strategies[7]. For instance, previous studies have employed SSR markers to conduct in-depth analyses of the genetic diversity of economically important freshwater fish species such as Chinese perch (Siniperca chuatsi)[8], and grass carp (Ctenopharyngodon idella)[9], revealing genetic differentiation and gene flow among different geographic populations.
Research on the genetic diversity of yellow catfish is relatively limited, particularly regarding the genetic structure analysis of different geographic populations. Previous studies have preliminarily revealed genetic differences among wild populations of yellow catfish in various geographic regions through microsatellite marker analysis[10,11]. However, with the expansion of farming regions and changing environmental conditions, the genetic structure of yellow catfish populations in different geographic areas may have undergone new changes. Therefore, this study aims to systematically analyze the genetic diversity and population differentiation among six yellow catfish populations from the Yangtze River, Huaihe River, and Ussuri River basins using ten highly polymorphic microsatellite markers. By comparing the genetic structure of different geographic populations, the aim is to provide a scientific basis for the conservation of genetic resources, germplasm improvement, and sustainable aquaculture of yellow catfish.
-
Between April and September 2018, yellow catfish samples were collected from the Yangtze River system (Dongting Lake, DTHL; Poyang Lake, PYHL; Honghu Lake, HHL; Gehu Lake, GHL), the Huaihe River system (Hongze Lake, HZHL), and the Ussuri River system (Ussuri River, WSLR). These samples were used to establish the breeding base populations of yellow catfish. Detailed information on the sampling date, latitude and longitude coordinates of the sampling sites for each population are provided in Table 1, with sampling locations shown in Fig. 1. From each of these six populations, approximately 20 individuals were randomly selected. Caudal fin tissues were clipped for genomic DNA extraction using the FastPure Tissue DNA Isolation Mini Kit (Vazyme, Nanjing, China). The extraction was performed according to the kit's instructions. The concentration and quality of genomic DNA were measured using a NanoDrop ND-1000 spectrophotometer (Thermo Fisher Scientific, Waltham, USA), and DNA samples were diluted to a working concentration of 100 ng/μL.
Table 1. Sampling information of six populations of yellow catfish.
Population Collection date Geographic locations Sample size DTHL 2018-4-6 Hunan (113°0′58″ E, 29°23′35″ N) 21 GHL 2018-6-13 Jiangsu (119°53′35″ E, 31°38′1″ N) 21 HHL 2018-4-8 Hubei (113°28′40″ E, 29°52′44″ N) 21 HZHL 2018-6-9 Jiangsu (118°49′12″ E, 33°21′36″ N) 20 PYHL 2018-4-10 Jiangxi (116°38′7″ E, 29°10′13″ N) 21 WSLR 2018-9-21 Heilongjiang (133°41′7″ E, 45°59′20″ N) 20 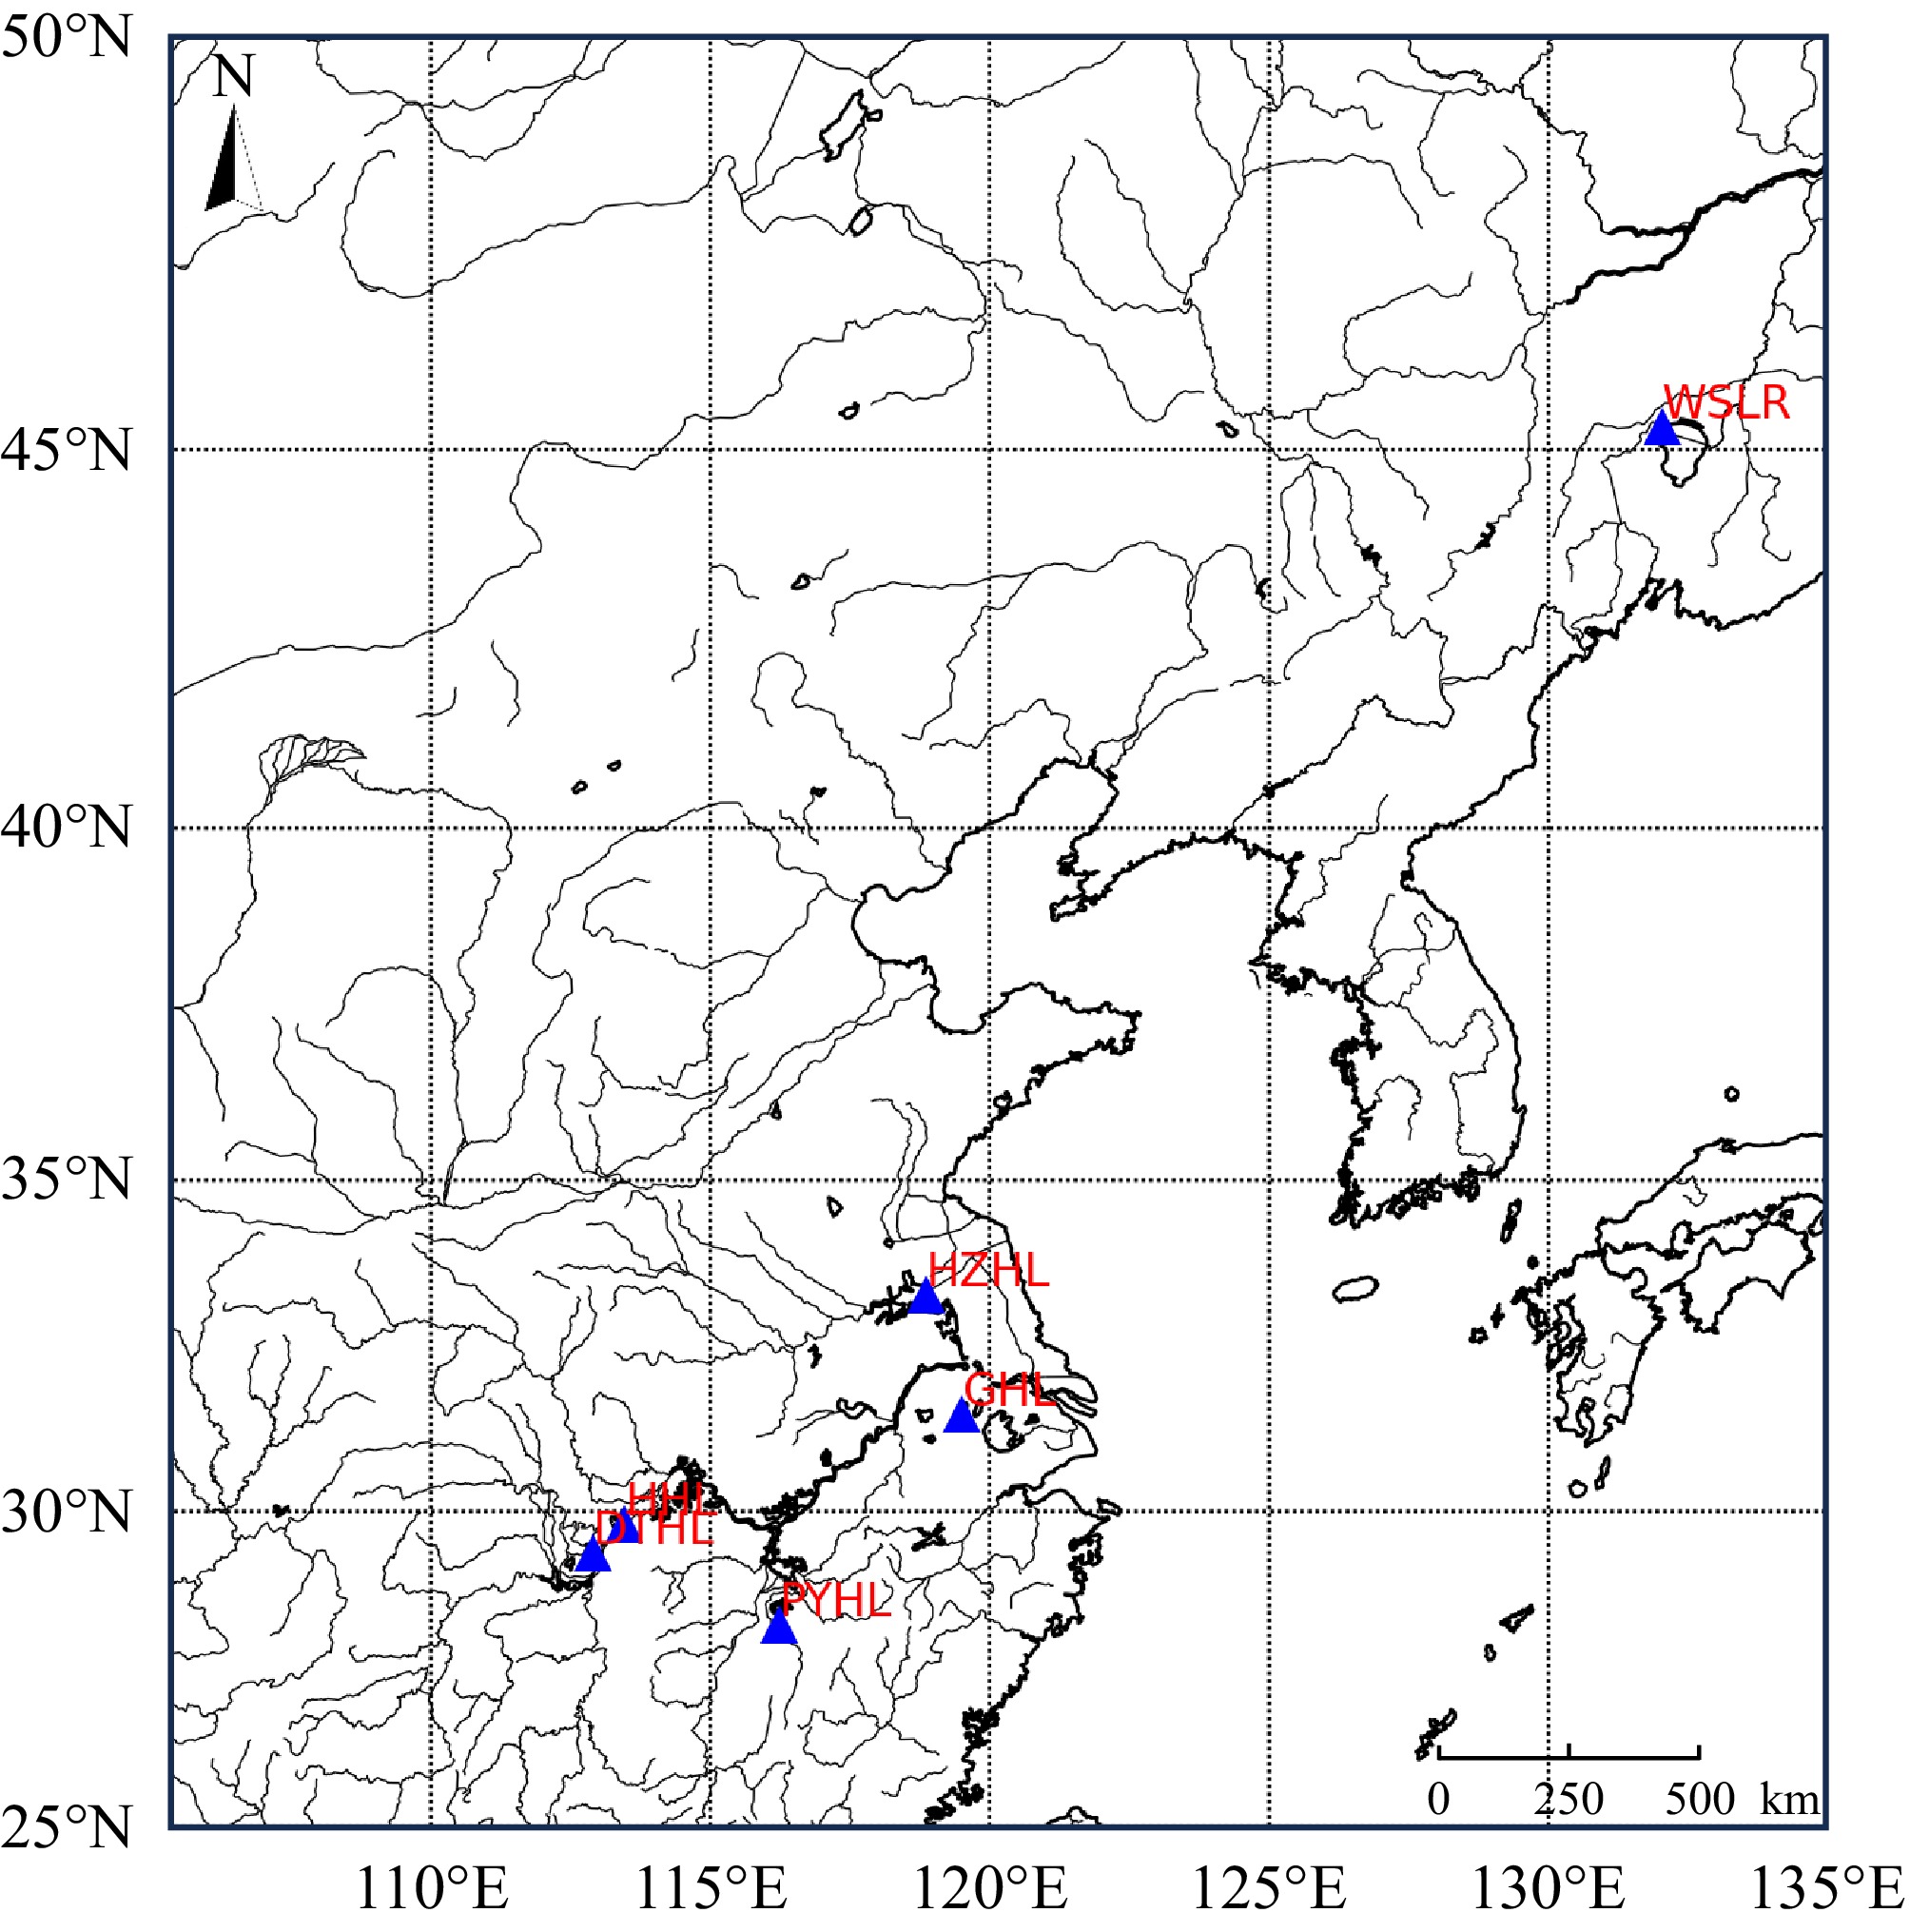
Figure 1.
Sampling localities of six yellow catfish populations.
Polymorphic microsatellite marker screening and reaction system optimization
-
Ten highly polymorphic SSR loci (Table 2) were selected from published microsatellite primers and mapped onto the yellow catfish genome, The SSR loci were located on different chromosomes. These loci were distributed across different chromosomes. Based on the primer sequence information from the literature, ten pairs of SSR amplification primers were synthesized by Sangon Biotech Co., Ltd (Shanghai, China), with the forward primers labeled with fluorescent tags at the 5' end. The 10 loci were grouped into pairs according to size intervals for duplex PCR amplification. The optimized PCR reaction system consisted of 10 μL of 2× Taq Master Mix (Vazyme, Nanjing, China), 1 μL of genomic DNA, 0.25 μL of 10 μM forward and reverse primers, and 6.5 μL of ddH2O. Multiplex PCR amplification was performed on a PCR instrument (Eppendorf, Hamburg, Germany) under the following conditions: initial denaturation at 94 °C for 5 min, followed by nine cycles of 94 °C for 30 s, annealing from 58 to 51 °C (decreasing 1 °C per cycle) for 30 s, and extension at 72 °C for 60 s. This was followed by 15 cycles of 94 °C for 30 s, 55 °C for 30 s, and 72 °C for 60 s, and another 15 cycles of 94 °C for 30 s, 50 °C for 30 s, and 72 °C for 60 s, with a final extension at 72 °C for 10 min.
Table 2. Sequence of the primers used to amplify SSR markers.
Locus Chromosome Location Primer sequences (5'-3') Tm ( °C) Label Size Ref. AG12 15 5859684…5859993 F: TTCTGAGGGGATGGTG 52 FAM 255−335 [10] R: GCGGTGCTCTGTGGTTGTC AG128 17 22452450...22452570 F: AAACCGACGGGACAAAAGAT 53 HEX 104−140 R: CTCTGCCTCACTAACT CT81 9 22532293…22532445 F: GTCTCCATCACTGCCACAT 55 FAM 135−161 R: TCAGCAATTATGTGAAAAGTGTCT PF01 1 3380349…3380609 F: TCTGCTGTGCCACCTTCATCT 54 HEX 254−280 [15] R: GGCAGGTTCCAGCCGTCAATA PF03 23 3321850…3322202 F: GCAACAACAGAACGAAAAAAG 55 FAM 346−354 R: ACGCTACACAGCAGAGGAAGT PF05 7 11753992…11754513 F: GAGTAAGTAAGTGATAATATGGAG 56 HEX 467−527 R: TCCTACTGTCTTTCACTCTACT PF08 20 18894877…18895050 F: AACATCACATTGTTTCTCACCATCC 56 FAM 149−227 R: AAAGTGAAAGAGAAGTTACGGAGGC PF130 10 18287250…18287472 F: CTTTGTAACTGGTATCGTTCTCTAC 55 HEX 203−277 R: TGCTATTGCTAAAGAGGGAGA PF448 19 2770597…2770941 F: TGCTCGAGTGAGCTACGA 54 FAM 312−392 R: CATCTCTATCTTTTTATTTCACATT PF532B 6 28255806…28255978 F: CGTCGTATCACCTGAAAT 53 HEX 134−200 R: TGAGAGGAGGAGTCTTTGA Genotyping of microsatellite markers
-
After the PCR reactions, 3 μL of the PCR product was added to a 96-well plate along with 0.5 μL of GeneScan™ 350ROX™ size standard (Applied Biosystems, Foster City, CA, USA) and 6.5 μL of Hi-Di™ formamide (Applied Biosystems, Foster City, CA, USA). The plate was denatured at 95 °C for 10 min using a PCR machine (Eppendorf, Hamburg, Germany) and immediately placed on ice. The denatured samples were loaded onto the ABI 3730XL Genetic Analyzer (Applied Biosystems, Foster City, CA, USA) for capillary electrophoresis. Alternatively, the plate was sealed with aluminum foil and stored at −20 °C for future analysis. After capillary electrophoresis, electropherogram files were exported, and the genotypes at each microsatellite locus were determined using GeneMarker software (v2.2.0). Missing genotypes were represented as 0, and only datasets with a missing rate below 5% were included in subsequent analyses.
Data analysis
-
The number of alleles (Na), number of effective alleles (Ne), observed heterozygosity (Ho), expected heterozygosity (He), Shannon's index (I) and Nei's standard genetic distance were calculated for each microsatellite locus using GenAlEx software (v6.51). The polymorphic information content (PIC) was calculated using Cervus software (v3.0.7), and Hardy-Weinberg equilibrium tests were conducted using Genepop software (v4.2.1). Genetic differentiation indices (Fst) between populations were calculated using Arlequin software (v3.5.2.2) based on the pairwise differences method, and analysis of molecular variance (AMOVA) was also performed. Gene flow (Nm) between each population was calculated based on the following formula: Nm = [(1 / Fst) − 1] / 4.
Subsequently, the phylogenetic tree of individuals and unweighted pair-groups method using arithmetic averages (UPGMA) tree of populations were constructed using MEGA-X software (v10.1.8) based on genetic distance and Nei's genetic distance, respectively. GenAlEx software (v6.51) was used to conduct principal coordinates analysis (PCoA). Population structure analysis was conducted using STRUCTURE software (v2.3.4). Parameters for selecting K were estimated following the delta K method[12] and Puechmaille's MedMed K, MedMean K, MaxMed K, and MaxMean K estimators[13] using STRUCTURESELECTOR software (v0.6.94)[14].
-
The genetic parameters for each population are shown in Table 3 and Supplementary Table S1. A total of 201 alleles were amplified from the six yellow catfish populations using 10 pairs of microsatellite primers. However, the number of alleles varied significantly among populations. The WSLR population had 90 alleles, while the HZHL population had 115 alleles. The populations, DTHL, HHL, PYHL, and GHL, from the Yangtze River system, had 103, 112, 107, and 101 alleles, respectively. The average number of alleles per population ranged from 9 to 11.5, and the average number of effective alleles ranged from 3.764 to 7.292, with WSLR having the lowest and HZHL the highest. The average expected heterozygosity (He) ranged from 0.588 to 0.727, while the average observed heterozygosity (Ho) ranged from 0.614 to 0.667. The average Shannon's index (I) varied from 1.425 to 1.872, and the average polymorphic information content (PIC) ranged from 0.569 to 0.710. Among these parameters, WSLR consistently exhibited the lowest values, whereas HHL showed the highest values for He, I, and PIC, and DTHL had the highest value for Ho.
Table 3. Genetic polymorphic parameters of six yellow catfish populations.
Populations Na Ne Ho He PIC I WSLR (n = 20) 9.000 3.764 0.614 0.588 0.569 1.425 PYHL (n = 21) 10.700 6.715 0.622 0.714 0.696 1.818 GHL (n = 21) 10.100 6.052 0.662 0.684 0.665 1.717 HHL (n = 21) 11.200 6.997 0.661 0.727 0.710 1.872 HZHL (n = 20) 11.500 7.292 0.632 0.695 0.682 1.849 DTHL (n = 21) 10.300 6.619 0.667 0.705 0.685 1.765 Chi-square tests for Hardy-Weinberg equilibrium (HWE) indicated that six loci in the six populations showed significant deviations from HWE, with eight loci showing highly significant deviations (p < 0.001), three showing significant deviations (p < 0.01), and three showing deviations (p < 0.05) (Table 4). Specifically, locus AG128 deviated from HWE in the PYHL and GHL populations (p < 0.05), locus PF01 deviated significantly in the HZHL population (p < 0.01), and locus PF05 deviated highly significantly in the HHL and HZHL populations (p < 0.001). Locus PF448 deviated highly significantly in the WSLR, PYHL, GHL, and HHL populations (p < 0.001) and significantly in the HZHL and DTHL populations (p < 0.01). Locus PF532B showed deviation in the DTHL population (p < 0.05).
Table 4. Hardy-Weinberg equilibrium chi-square test in six yellow catfish populations.
Locus WSLR PYHL GHL HHL HZHL DTHL n = 20 n = 21 n = 21 n = 21 n = 20 n = 21 AG12 1.000 0.186 0.801 0.693 0.614 0.260 AG128 1.000 0.016* 0.032* 0.198 0.597 0.931 CT81 1.000 0.991 0.967 1.000 1.000 0.773 PF01 1.000 0.098 0.345 0.790 0.002** 0.774 PF03 0.305 0.780 0.685 0.605 0.581 0.514 PF05 0.988 0.995 0.381 0.000*** 0.000*** - PF08 0.995 0.805 0.085 0.101 0.372 0.707 PF130 0.772 0.919 0.761 0.062 0.968 0.988 PF448 0.000*** 0.000*** 0.000*** 0.000*** 0.001** 0.003** PF532B 0.987 0.058 1.000 0.411 0.070 0.024* * Indicates a deviation from Hardy-Weinberg equilibrium (p < 0.05); ** Indicates significant deviation from Hardy-Weinberg equilibrium (p < 0.01); *** Indicates very significant deviation from Hardy-Weinberg equilibrium (p < 0.001). Genetic differentiation among populations
-
An analysis of molecular variance (AMOVA) was conducted on the six yellow catfish populations. The results showed that 3% of the genetic variation came from differences between populations, 6% from differences between individuals, and 91% from variation within individuals, indicating very low genetic differentiation between populations (Table 5). The Nei's genetic distance (Ds) between the six populations ranged from 0.084 to 0.324, indicating interspecies-level genetic variation (0.01 < Ds < 2.0). The genetic differentiation index (Fst) ranged from 0.014 to 0.069, suggesting low (Fst < 0.05) to moderate (0.05 < Fst < 0.15) genetic differentiation (Table 6). Moderate genetic differentiation was observed between the WSLR population and four other populations except for HZHL, as well as between the HZHL and DTHL populations. Only low genetic differentiation was found between the other populations. Gene flow (Nm) between the populations ranged from 3.373 to 17.607 (Fig. 2a), indicating moderate to high levels of gene flow between populations. Overall, the PYHL population had the highest gene flow with other populations, while the WSLR population had the lowest. There was a significant correlation (R2 = 0.696, p = 0.00011) between gene flow and geographic distance (Fig. 2b).
Table 5. Molecular variance analysis (AMOVA) of six yellow catfish populations.
Source of variation df Sum of squares Variance components Percentage
of variationAmong populations 5 5.362 0.015 3% Among individuals 118 54.876 0.027 6% Within individuals 124 51.000 0.411 91% Total 247 111.238 0.453 100% Table 6. Matrix of pair-wise Nei's genetic distance (below diagonal) and Fst values (above diagonal) among six yellow catfish populations.
WSLR PYHL GHL HHL HZHL DTHL WSLR − 0.054 0.069 0.059 0.042 0.066 PYHL 0.324 − 0.027 0.014 0.028 0.019 GHL 0.261 0.135 − 0.033 0.025 0.043 HHL 0.281 0.084 0.181 − 0.029 0.020 HZHL 0.254 0.157 0.134 0.166 − 0.051 DTHL 0.305 0.098 0.190 0.109 0.231 − 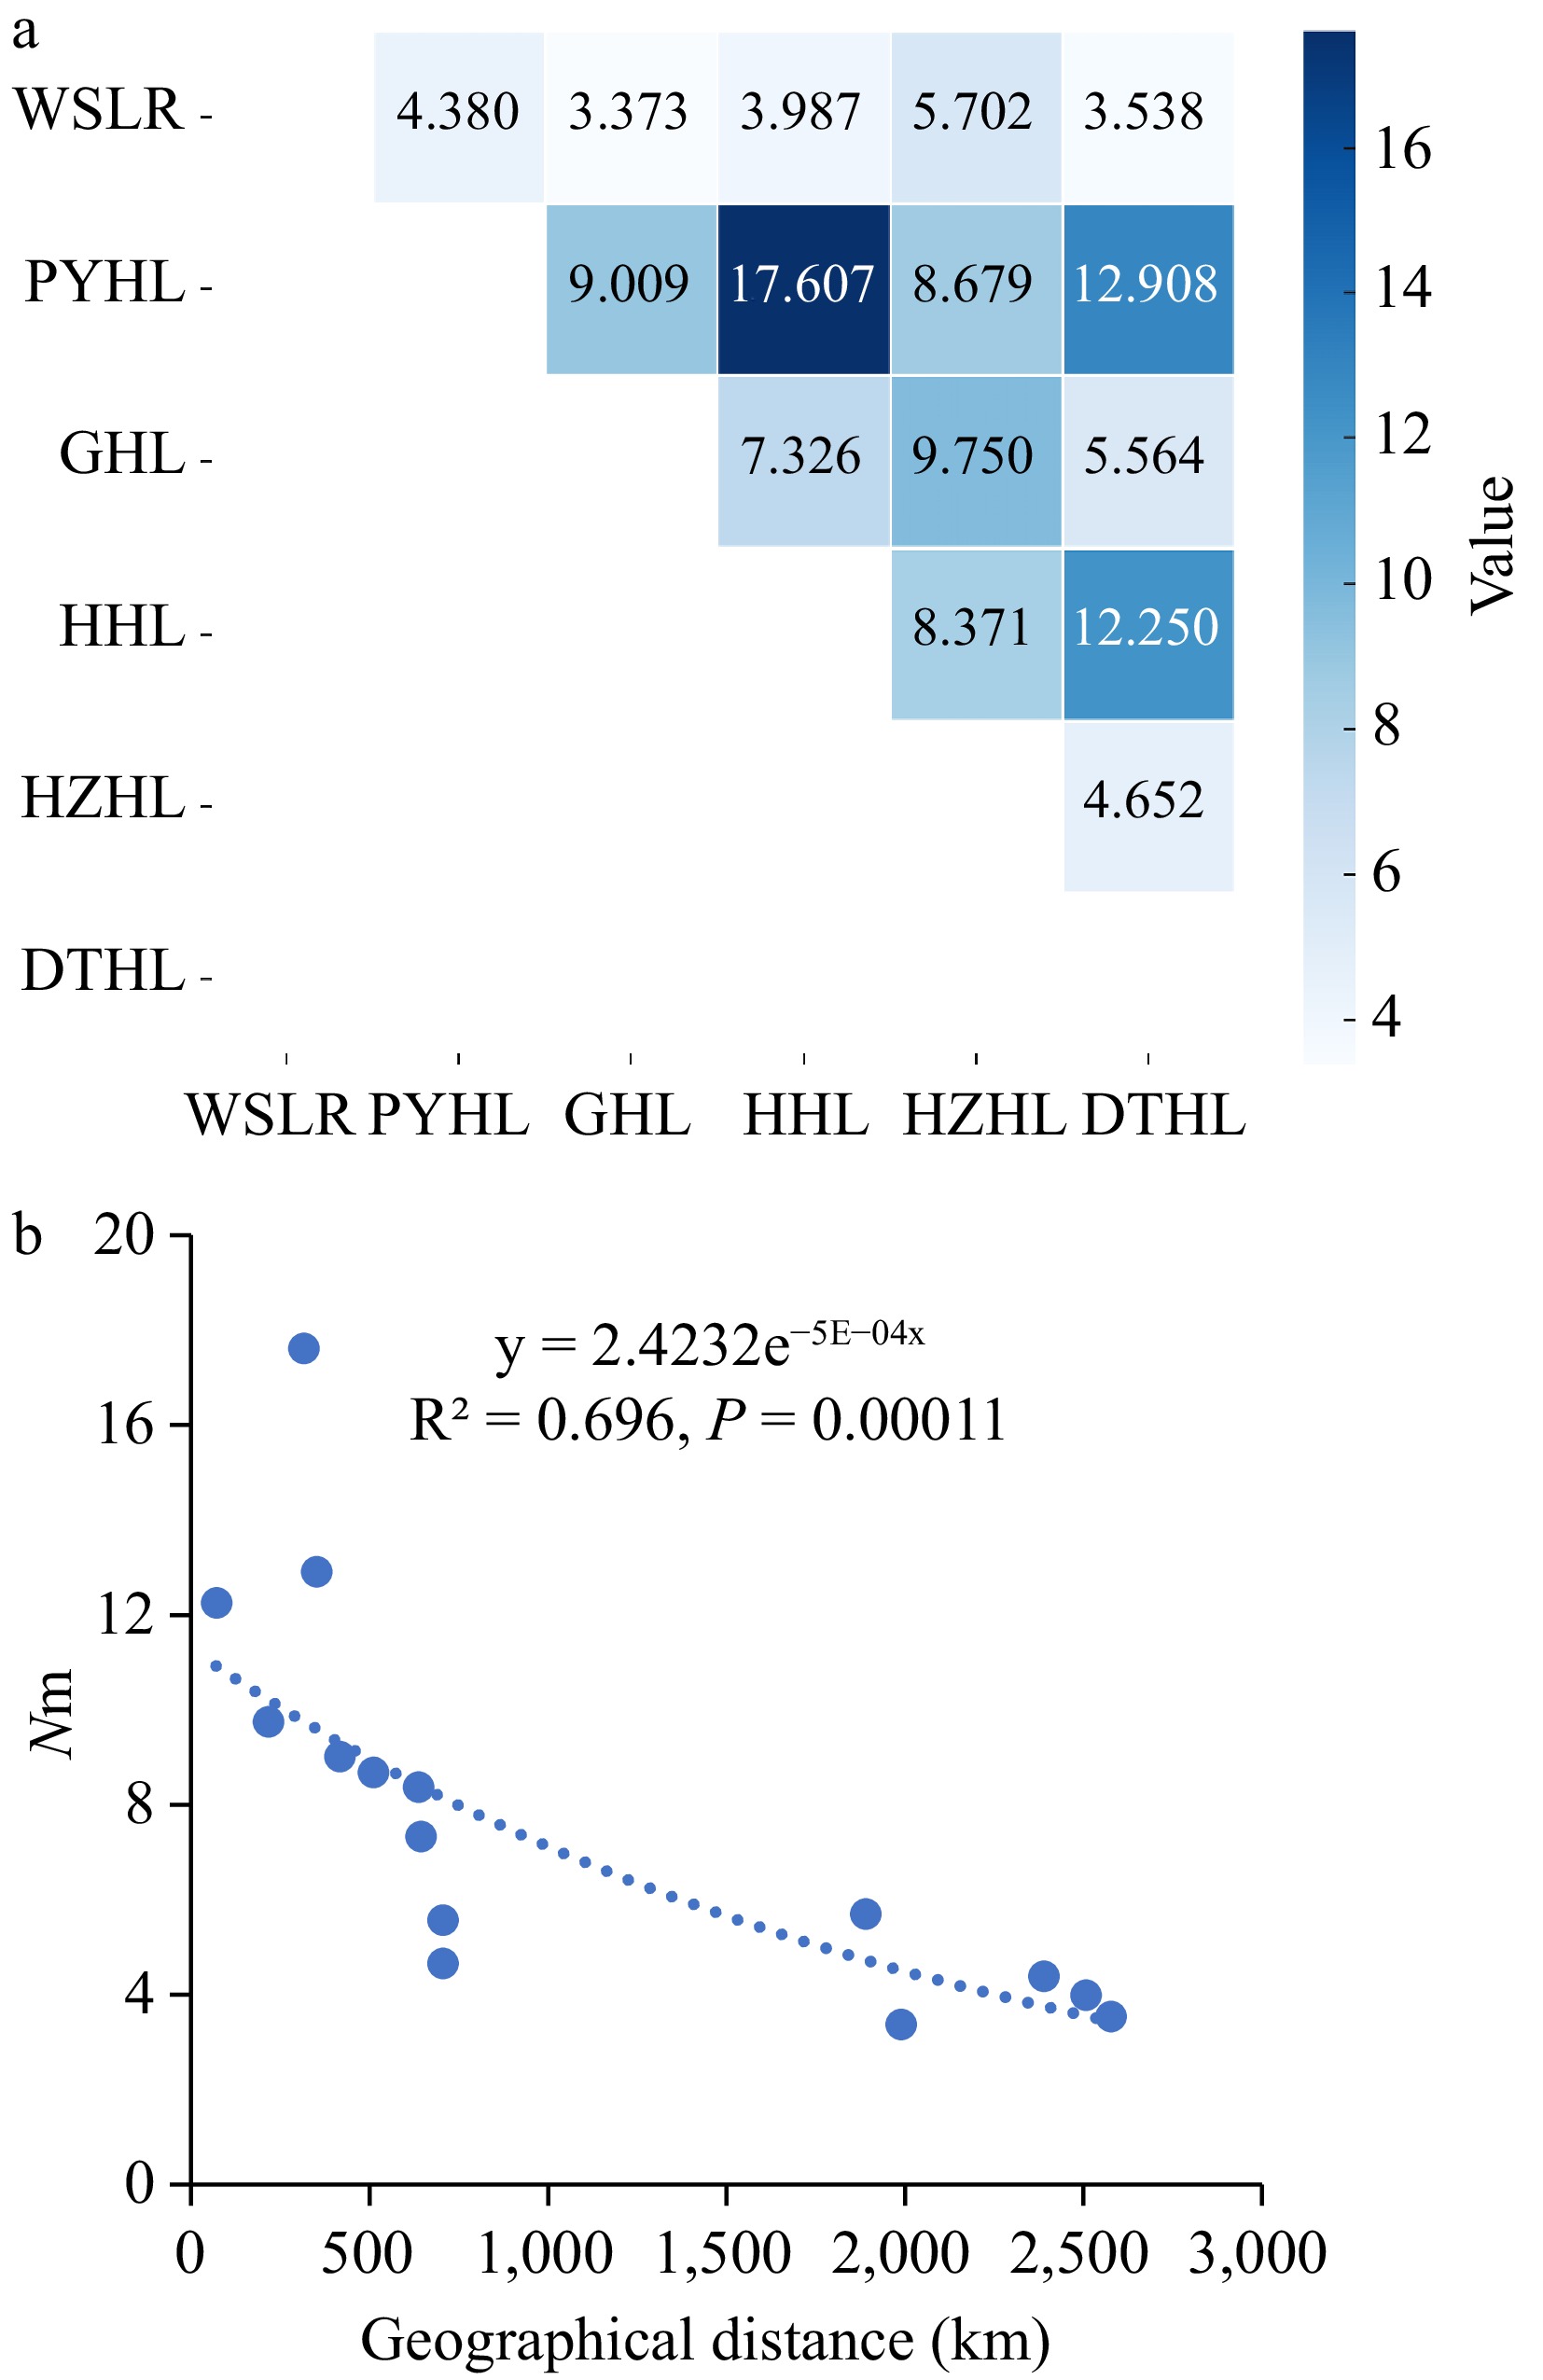
Figure 2.
Gene flow (Nm) analysis of six yellow catfish populations. (a) Matrix of pair-wise estimated gene flow (Nm) among six yellow catfish populations; (b) Linear regression analysis of gene flow (Nm) and geographic distance.
Population and individual clustering analysis
-
The phylogenetic tree of individuals detected that only the WSLR population clustered relatively well together, while several southern populations were intermixed with each other (Fig. 3a). To further reveal the genetic relationships and degrees of differentiation between populations, PCoA based on hierarchical clusters was performed, with the first three axis explaining 16.75% of the cumulative variation (Fig. 3b). A clear separation of the WSLR population from the five southern populations was observed. Among the southern populations, PYHL, HHL, and DTHL were interwoven without a clear geographic distribution pattern, while GHL and HZHL were separated from them. The UPGMA dendrogram constructed based on Nei's genetic distance (Fig. 3c) showed that the two lake populations from Jiangsu Province (GHL and HZHL) first clustered together, followed by clustering with the PYHL, HHL, and DTHL populations. The clustering order of the southern five populations closely corresponded to their geographic distances. After clustering, the southern populations were then grouped with the geographically distant WSLR population.
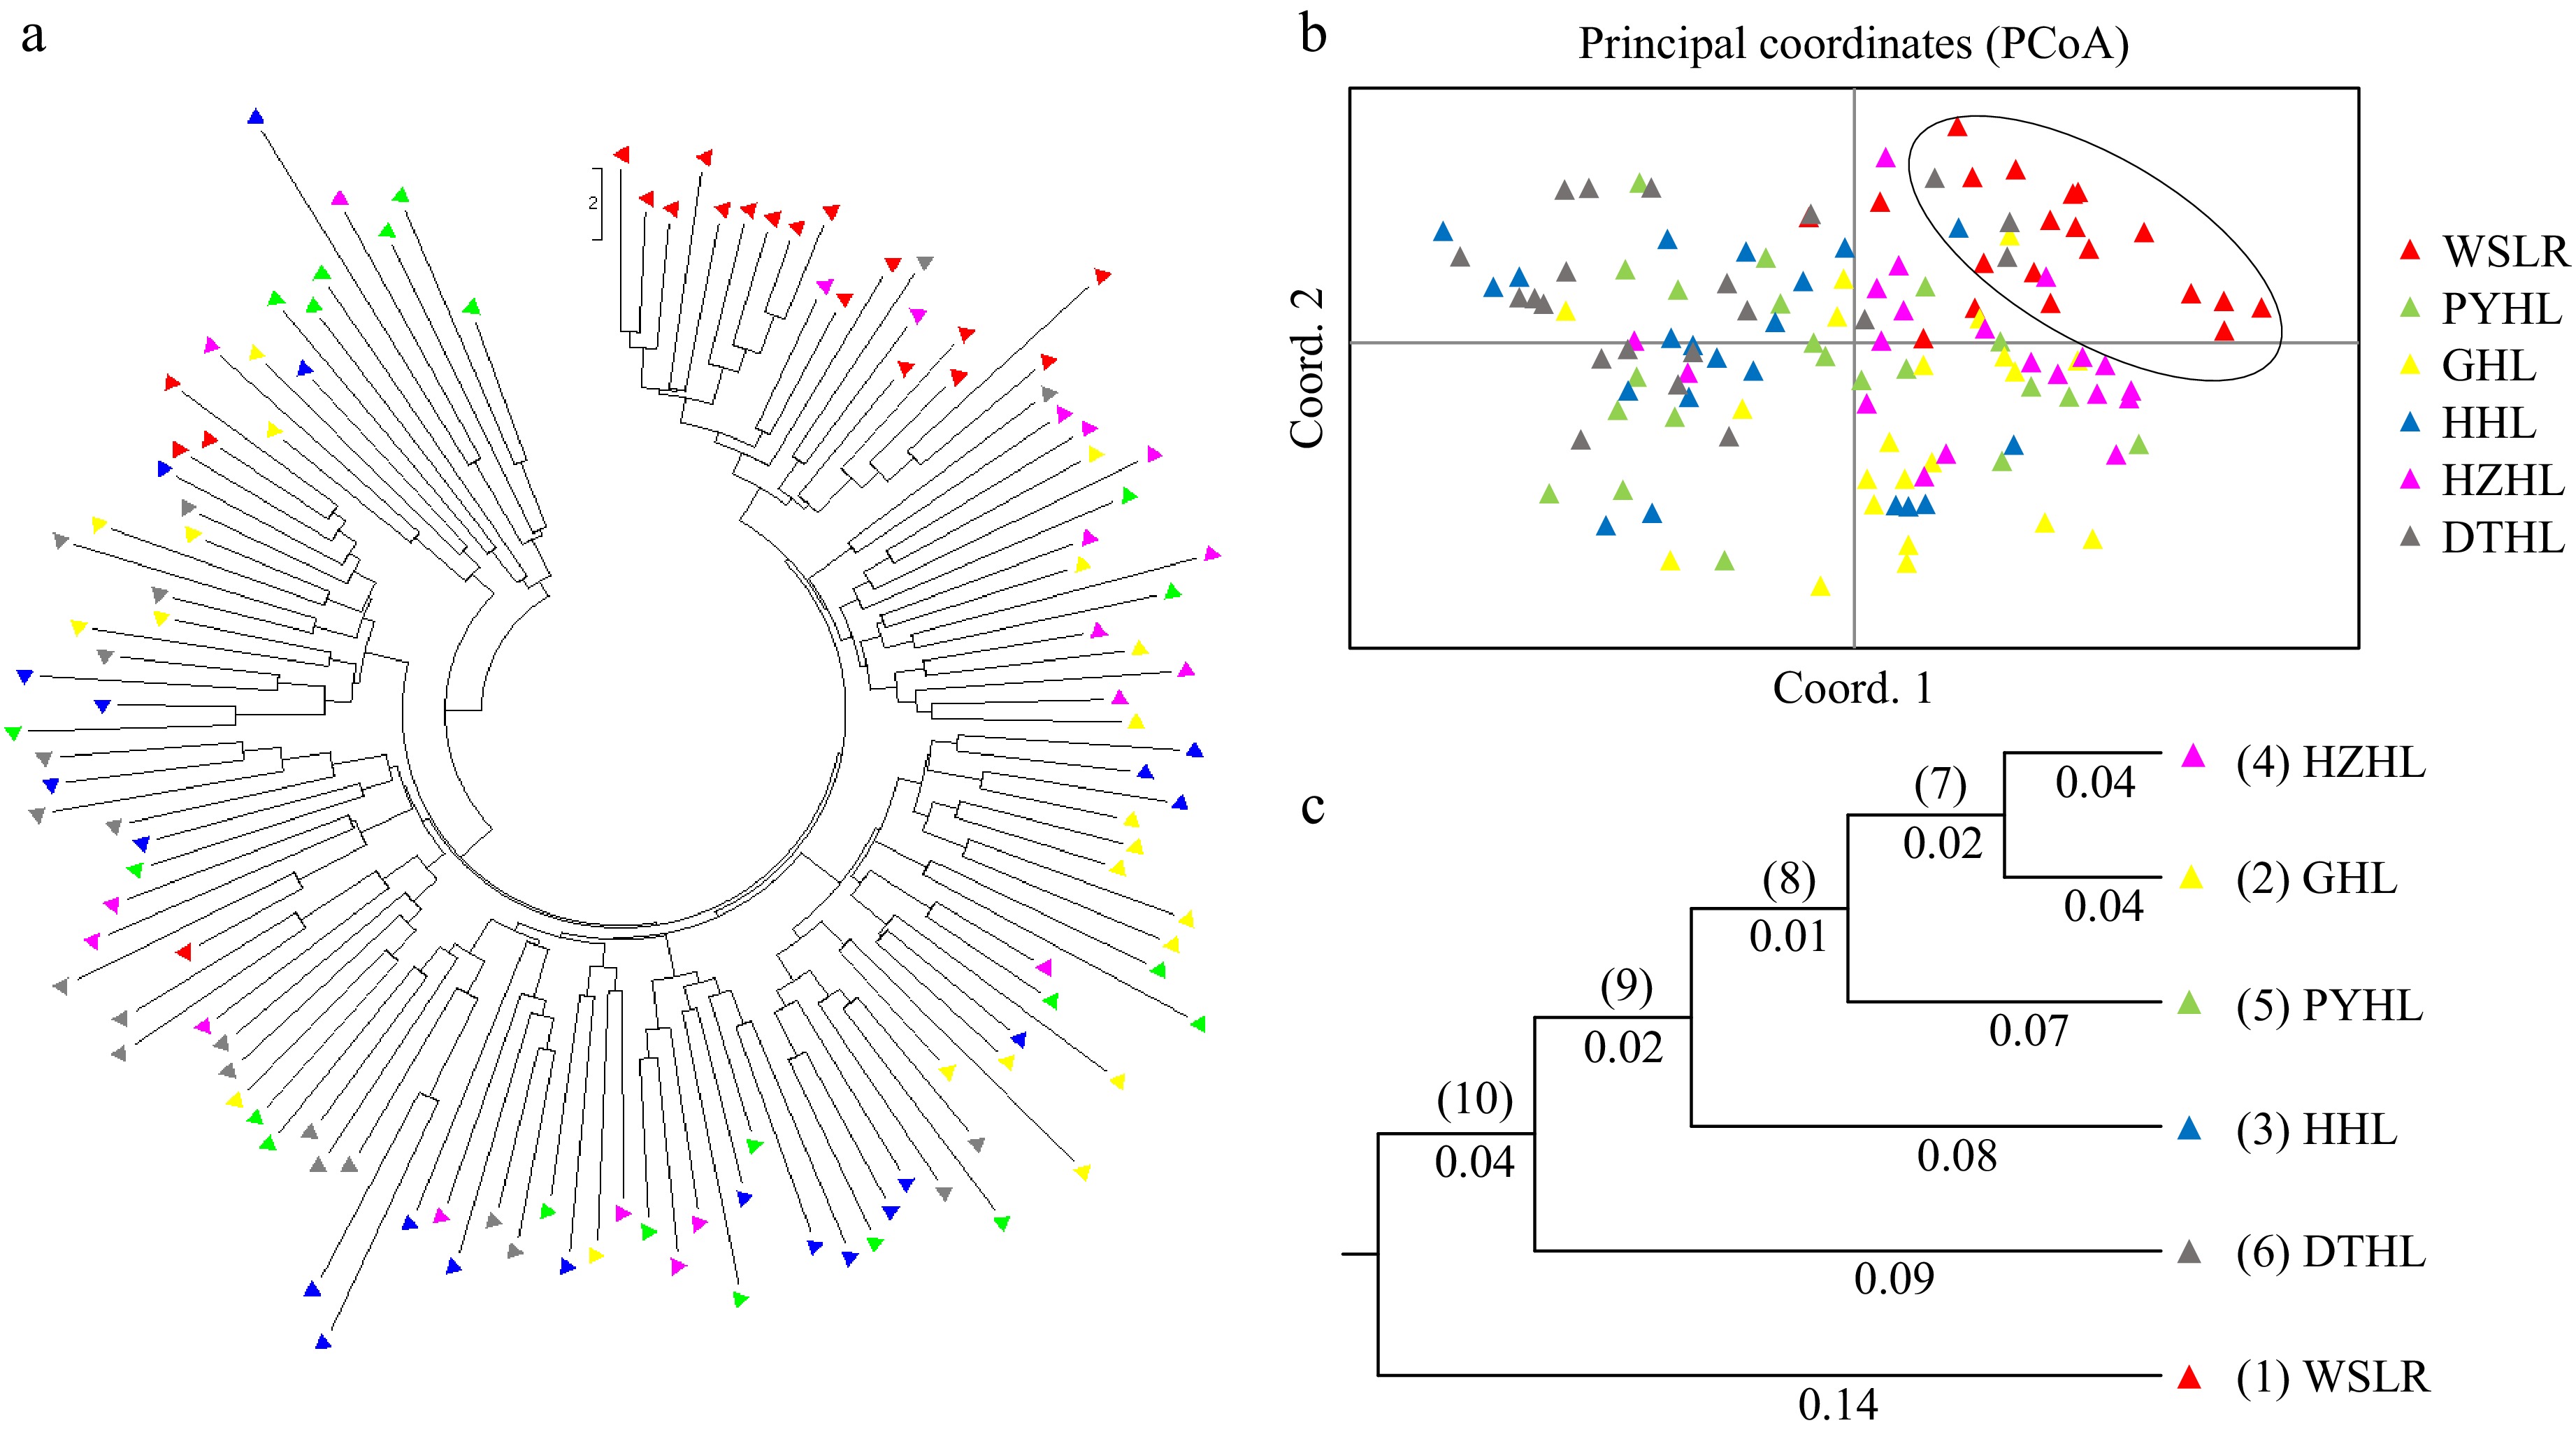
Figure 3.
Population and individual clustering analysis of six yellow catfish populations. (a) Genetic relatedness of 124 individuals depicted by a circular phylogenetic tree; (b) Principal coordinates analysis (PCoA) plot of 124 individuals in six yellow catfish populations; (c) UPGMA dendrogram based on Nei's genetic distance among six yellow catfish populations.
Population genetic structure
-
Delta K (Fig. 4a), MedMed K/MedMean K (Fig. 4b), and MaxMed K/ MaxMean K (Fig. 4c) plots suggested that the best number of clusters (K) was K = 3 for the STRUCTURE analysis of yellow catfish genotypes from six populations. Ancestral lineage analysis was performed by using the mixed ancestor model based on K = 3 (Fig. 4d). The genetic sources of 124 individuals were divided into two types, the genetic source of the WSLR population was mainly from cluster 1 (green), while DTHL, PYHL, HHL, GHL, and HZHL populations were mainly from cluster 2 (red), and cluster 3 (blue). The clustering results were consistent with the findings from Nei's genetic distance, Fst values, and PCoA analysis. This was related to the formation of a certain degree of geographical isolation between relatively distant geographic locations and the barriers to gene exchange that force genetic differentiation between populations.
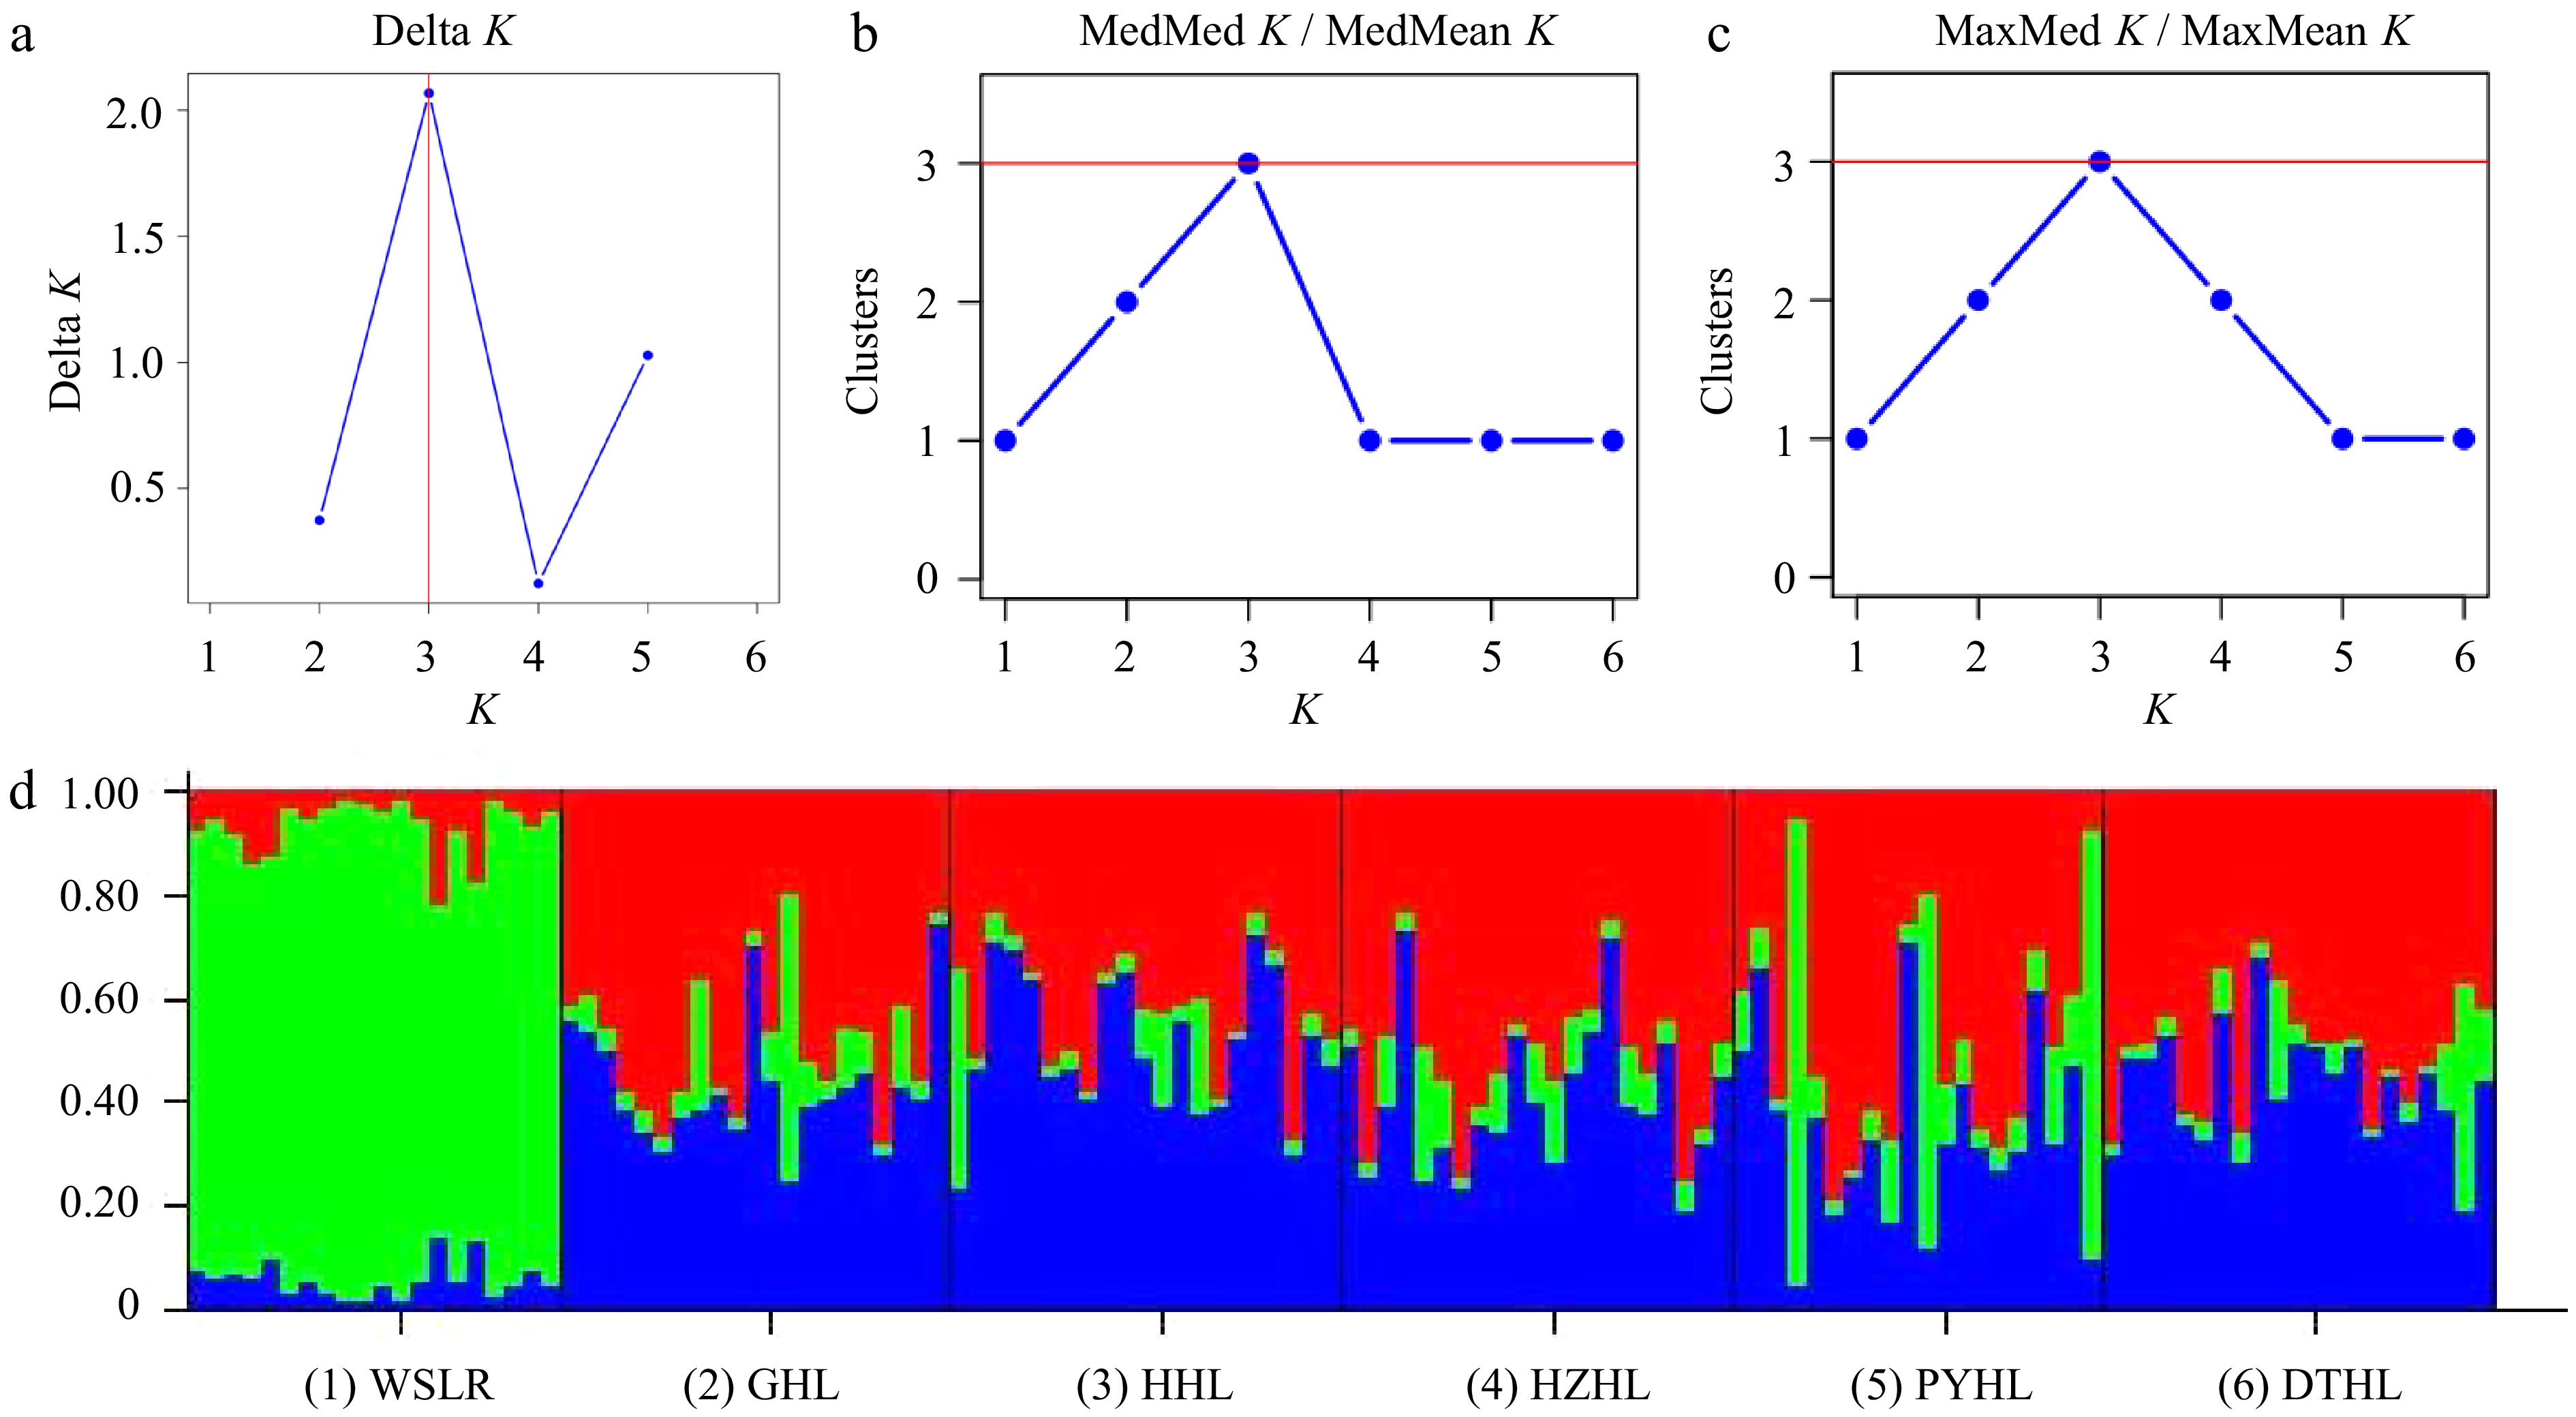
Figure 4.
Ancestral lineage analysis of six yellow catfish populations. (a) Delta K, (b) MedMed K / MedMean K, and (c) MaxMed K / MaxMean K plots indicating the best number of clusters (K) of the STRUCTURE analysis. (d) Cluster assignment from STRUCTURE averaged over six replicated runs for K = 3. Colors represent different clusters.
-
In this study, 10 highly polymorphic SSR loci from published literature were used to evaluate the genetic diversity and genetic differentiation among six geographically distinct yellow catfish populations. The SSR loci were located on different chromosomes, eliminating linkage disequilibrium. The results showed significant differences in genetic diversity among populations, with overall high genetic diversity maintained across the yellow catfish populations. This finding aligns with previous studies on yellow catfish[10,11,15], demonstrating that these microsatellite loci and primers are suitable for genetic studies of yellow catfish populations.
The number of alleles amplified by microsatellite loci reflects not only the polymorphism of the loci but also the variation within the population[16]. Generally, the more alleles observed, the higher the genetic diversity of the population. Heterozygosity is a key indicator of population polymorphism, and heterozygosity levels between 0.5 and 0.8 are considered indicative of high diversity[17]. Among the six populations, the WSLR population exhibited the lowest genetic diversity, with both the average number of alleles (Na) and the average observed heterozygosity (Ho) lower than those of other populations. This may be due to the strong geographic isolation of the WSLR population, which limits gene flow. Geographic isolation restricts genetic exchange between populations[18], thereby reducing genetic diversity[19]. In contrast, the HZHL population displayed the highest genetic diversity, likely due to the abundance of water resources and the relatively open geographic environment in that region, which facilitates frequent gene flow between populations. Other studies have similarly found that populations in close geographic proximity tend to have higher levels of gene flow, maintaining higher genetic diversity[20,21], and this conclusion is further supported by the gene flow analysis in this study.
Fst is an important indicator used to assess the degree of genetic differentiation between populations. In this study, the Fst values among the six yellow catfish populations ranged from 0.014 to 0.069, indicating low genetic differentiation between populations. According to Wright's classification[22], Fst values between 0 and 0.05 represent low genetic differentiation, while values between 0.05 and 0.15 indicate moderate differentiation. Therefore, most populations in this study exhibited low to moderate genetic differentiation. This is consistent with the AMOVA results, which showed that 91% of the genetic variation occurred within individuals, with only 3% of the genetic variation occurring between populations. Similar low levels of genetic differentiation have been reported in other freshwater fish species, such as Chinese perch, which showed a pattern of high diversity within populations and low differentiation between populations[23].
Based on the UPGMA tree, PCoA clustering, and ancestral lineage analysis, the WSLR population was distinct from the southern five populations. Geographic distance is one of the key factors affecting genetic differentiation between populations, especially for widely distributed species. The significant genetic distance between the northern WSLR population and southern populations such as DTHL, HHL, and GHL is likely due to their large geographic separation, a phenomenon that has been observed in other freshwater fish studies[24]. Studies have shown that as geographic distance increases, genetic differences between populations also increase, which is particularly common in widely distributed fish species[25]. Furthermore, although the southern five populations are geographically closer to one another, they still exhibit some degree of differentiation. The GHL and HZHL populations clustered together first, followed by clustering with the other populations. This clustering pattern closely corresponds to their geographic locations, indicating that geographic proximity plays a role in population clustering.
The high level of gene flow may contribute to the genetic similarity among the southern populations. Studies suggest that water connectivity and the interaction between river basins often promote gene flow among fish populations, thereby reducing genetic differences between them[26,27]. The high level of gene flow observed likely contributes to the genetic similarity among the southern populations, which may be facilitated by interconnected waterways and shared habitats across the Yangtze and Huaihe River basins. Additionally, seasonal flooding events and anthropogenic activities, such as fish stocking and aquaculture practices, may further enhance this genetic connectivity. The WSLR population, despite exhibiting the lowest genetic diversity and gene flow, played a unique role in breeding strategies due to its genetic distinctiveness. The significant genetic differentiation between the WSLR population and the southern populations suggested that the WSLR population could contribute novel genetic traits to enhance the overall genetic pool of yellow catfish. Incorporating the WSLR population in cross-breeding programs could potentially introduce adaptive traits beneficial for aquaculture, such as cold tolerance or resistance to specific environmental stressors.
-
This study assessed the genetic diversity and genetic structure of six yellow catfish populations. The results showed that the overall genetic diversity of yellow catfish is relatively high, with notable differences between populations. The WSLR population had the lowest genetic diversity, while the HZHL population had the highest. AMOVA and Fst analyses indicated low genetic differentiation between populations, with most variation occurring within populations. UPGMA, PCoA and ancestral lineage analyses demonstrated a clear genetic separation between the southern and northern populations, highlighting the role of geographic distance in driving differentiation. The distinct genetic characteristics of the northern population could make it a valuable contributor to the breeding base population, offering opportunities to enhance genetic diversity and introduce adaptive traits. The present study provides valuable insights into the conservation and breeding of yellow catfish germplasm resources.
The study was funded by the Important New Varieties Selection Project of Jiangsu Province (PZCZ201742) and the China Agriculture Research System of MOF and MARA (CARS-46).
-
All procedures were reviewed and preapproved by the ethical review committee of the Freshwater Fisheries Research Institute of Jiangsu Province, identification number: FT20182, approval date: 2018-03-03. The research followed the 'Replacement, Reduction, and Refinement' principles to minimize harm to animals. This article provides details on the housing conditions, care, and pain management for the animals, ensuring that the impact on the animals was minimized during the experiment.
-
The authors confirm their contribution to the paper as follows: study conception and design: Zhang S; data collection: Zhang S, Liu W, Wang M; analysis and interpretation of results: Zhang S, Liu H, Chen X; draft manuscript preparation: Zhang S, Liu W. All authors reviewed the results and approved the final version of the manuscript.
-
The datasets generated during and/or analyzed during the current study are available from the corresponding author on reasonable request.
-
The authors declare that they have no conflict of interest.
- Supplementary Table S1 Summary of genetic polymorphic parameters in the six yellow catfish populations using ten microsatellite markers.
- Copyright: © 2025 by the author(s). Published by Maximum Academic Press on behalf of Nanjing Agricultural University. This article is an open access article distributed under Creative Commons Attribution License (CC BY 4.0), visit https://creativecommons.org/licenses/by/4.0/.
-
About this article
Cite this article
Zhang S, Liu W, Wang M, Liu H, Chen X. 2025. Genetic diversity and population structure of Pelteobagrus fulvidraco in China based on microsatellite markers. Animal Advances 2: e002 doi: 10.48130/animadv-0024-0010 

Genetic diversity and population structure of Pelteobagrus fulvidraco in China based on microsatellite markers
- Received: 20 September 2024
- Revised: 12 November 2024
- Accepted: 17 December 2024
- Published online: 23 January 2025
Abstract: With the expansion of farming regions and changing environmental conditions, the genetic structure of yellow catfish populations in different geographic areas may have undergone new changes. This study assessed the genetic diversity and population genetic structure of six yellow catfish populations from the Yangtze River, Huaihe River, and Ussuri River basins in China using ten microsatellite markers. The results showed that the average number of alleles per population ranged from 9.0 to 11.5, with observed heterozygosity ranging from 0.614 to 0.667 and expected heterozygosity from 0.588 to 0.727. The Ussuri River population (WSLR) exhibited the lowest genetic diversity (PIC = 0.569), while the population from Hongze Lake had the highest (PIC = 0.710). Analysis of molecular variance (AMOVA) revealed that 91% of genetic variation was within individuals, and only 3% was between populations. Fst values ranged from 0.014 to 0.069, indicating low genetic differentiation between populations. Clustering analysis, including principal coordinate analysis (PCoA), unweighted pair-groups method using arithmetic averages (UPGMA) dendrogram, and ancestral lineage analysis showed genetic separation between the northern Ussuri River population and the five southern populations. The results highlight the influence of geographic isolation on genetic differentiation. These findings provide valuable insights into the conservation and breeding strategies of yellow catfish germplasm resources.
-
Key words:
- Yellow catfish /
- Microsatellite /
- Genetic diversity /
- Population structure /
- Genetic breeding