-
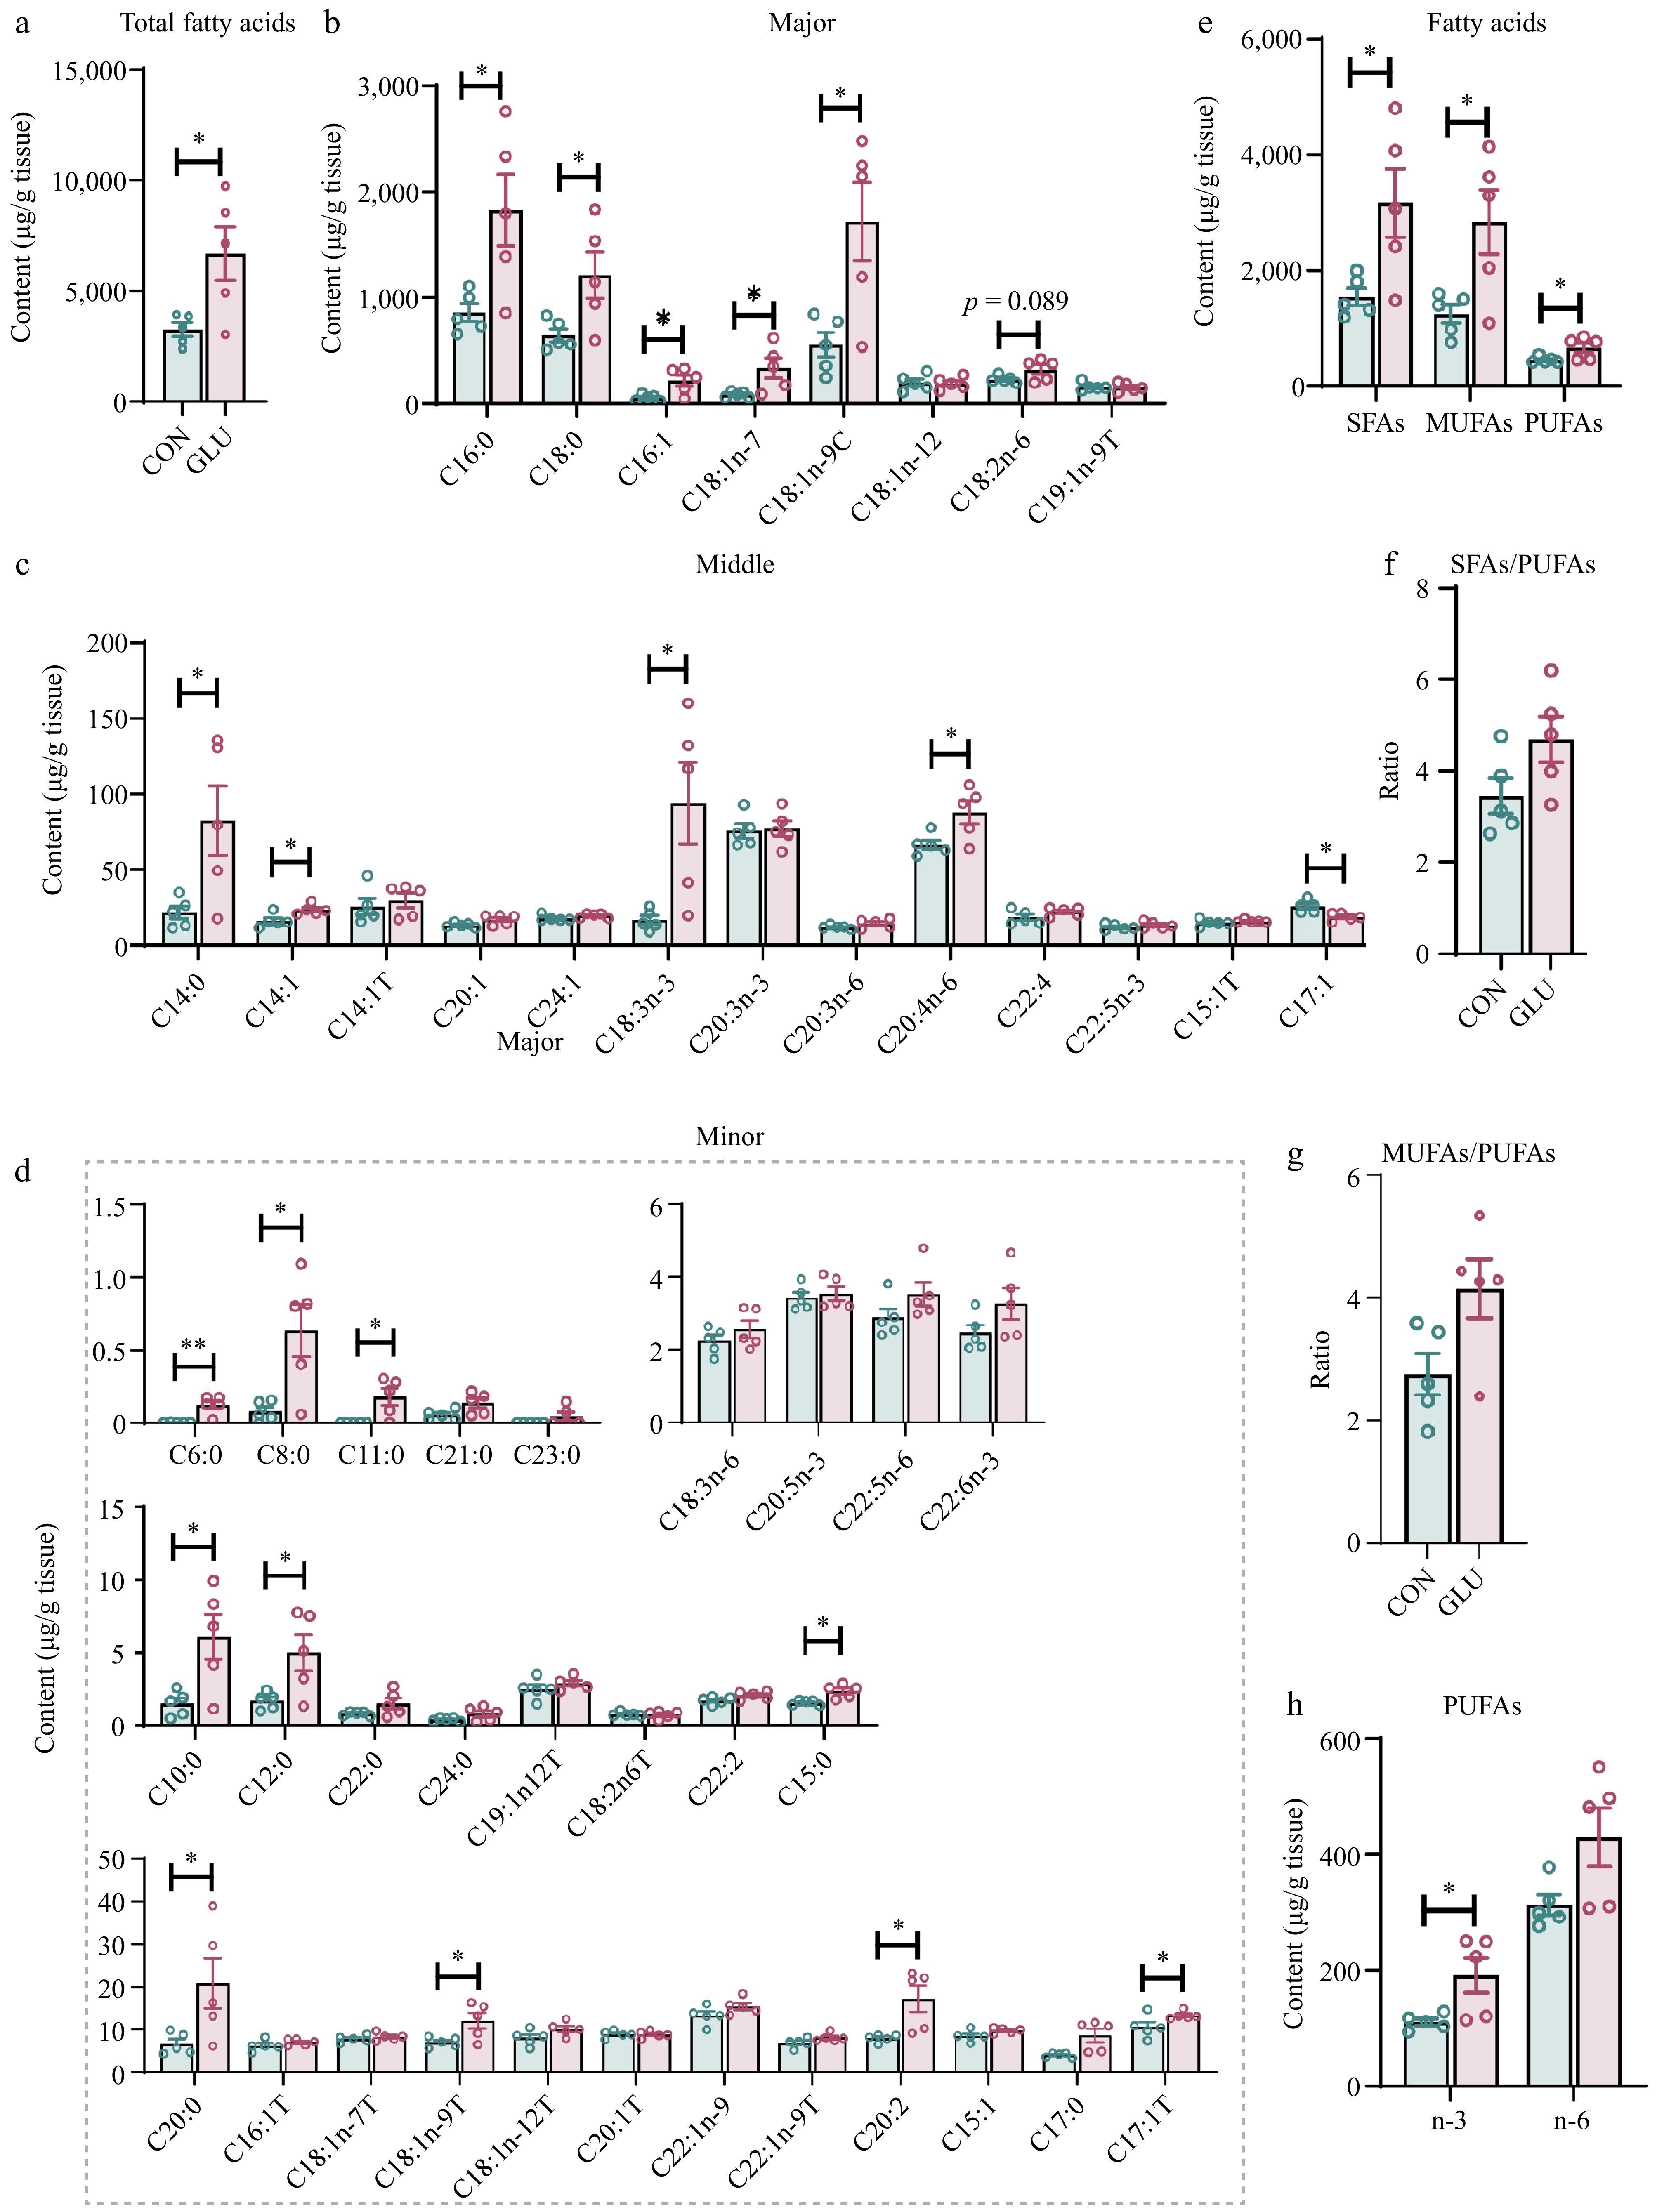
Figure 1.
Glu optimized the fatty acid profile in LD muscle of Shaziling pigs. (a) The total fatty acid content. The concentration of individual fatty acids in the LD muscle. Fatty acids are categorized into (b) major, (c) middle, and (d) minor classes based on their relative abundance, and classified by the degree of saturation. (e) Total SFAs, MUFAs, and PUFAs in muscle from Glu and Con pigs. SFAs, saturated fatty acids; MUFAs, monounsaturated fatty acids; PUFAs, polyunsaturated fatty acids containing two or three to six double bonds. (f) The ratio of SFA to PUFA. (g) The ratio of MUFA to PUFA. (h) The content of n-3 PUFA and n-6 PUFA. n = 5. The error bars represent the SEM. * p < 0.05, ** p < 0.01, two-tailed Student's t-test.
-
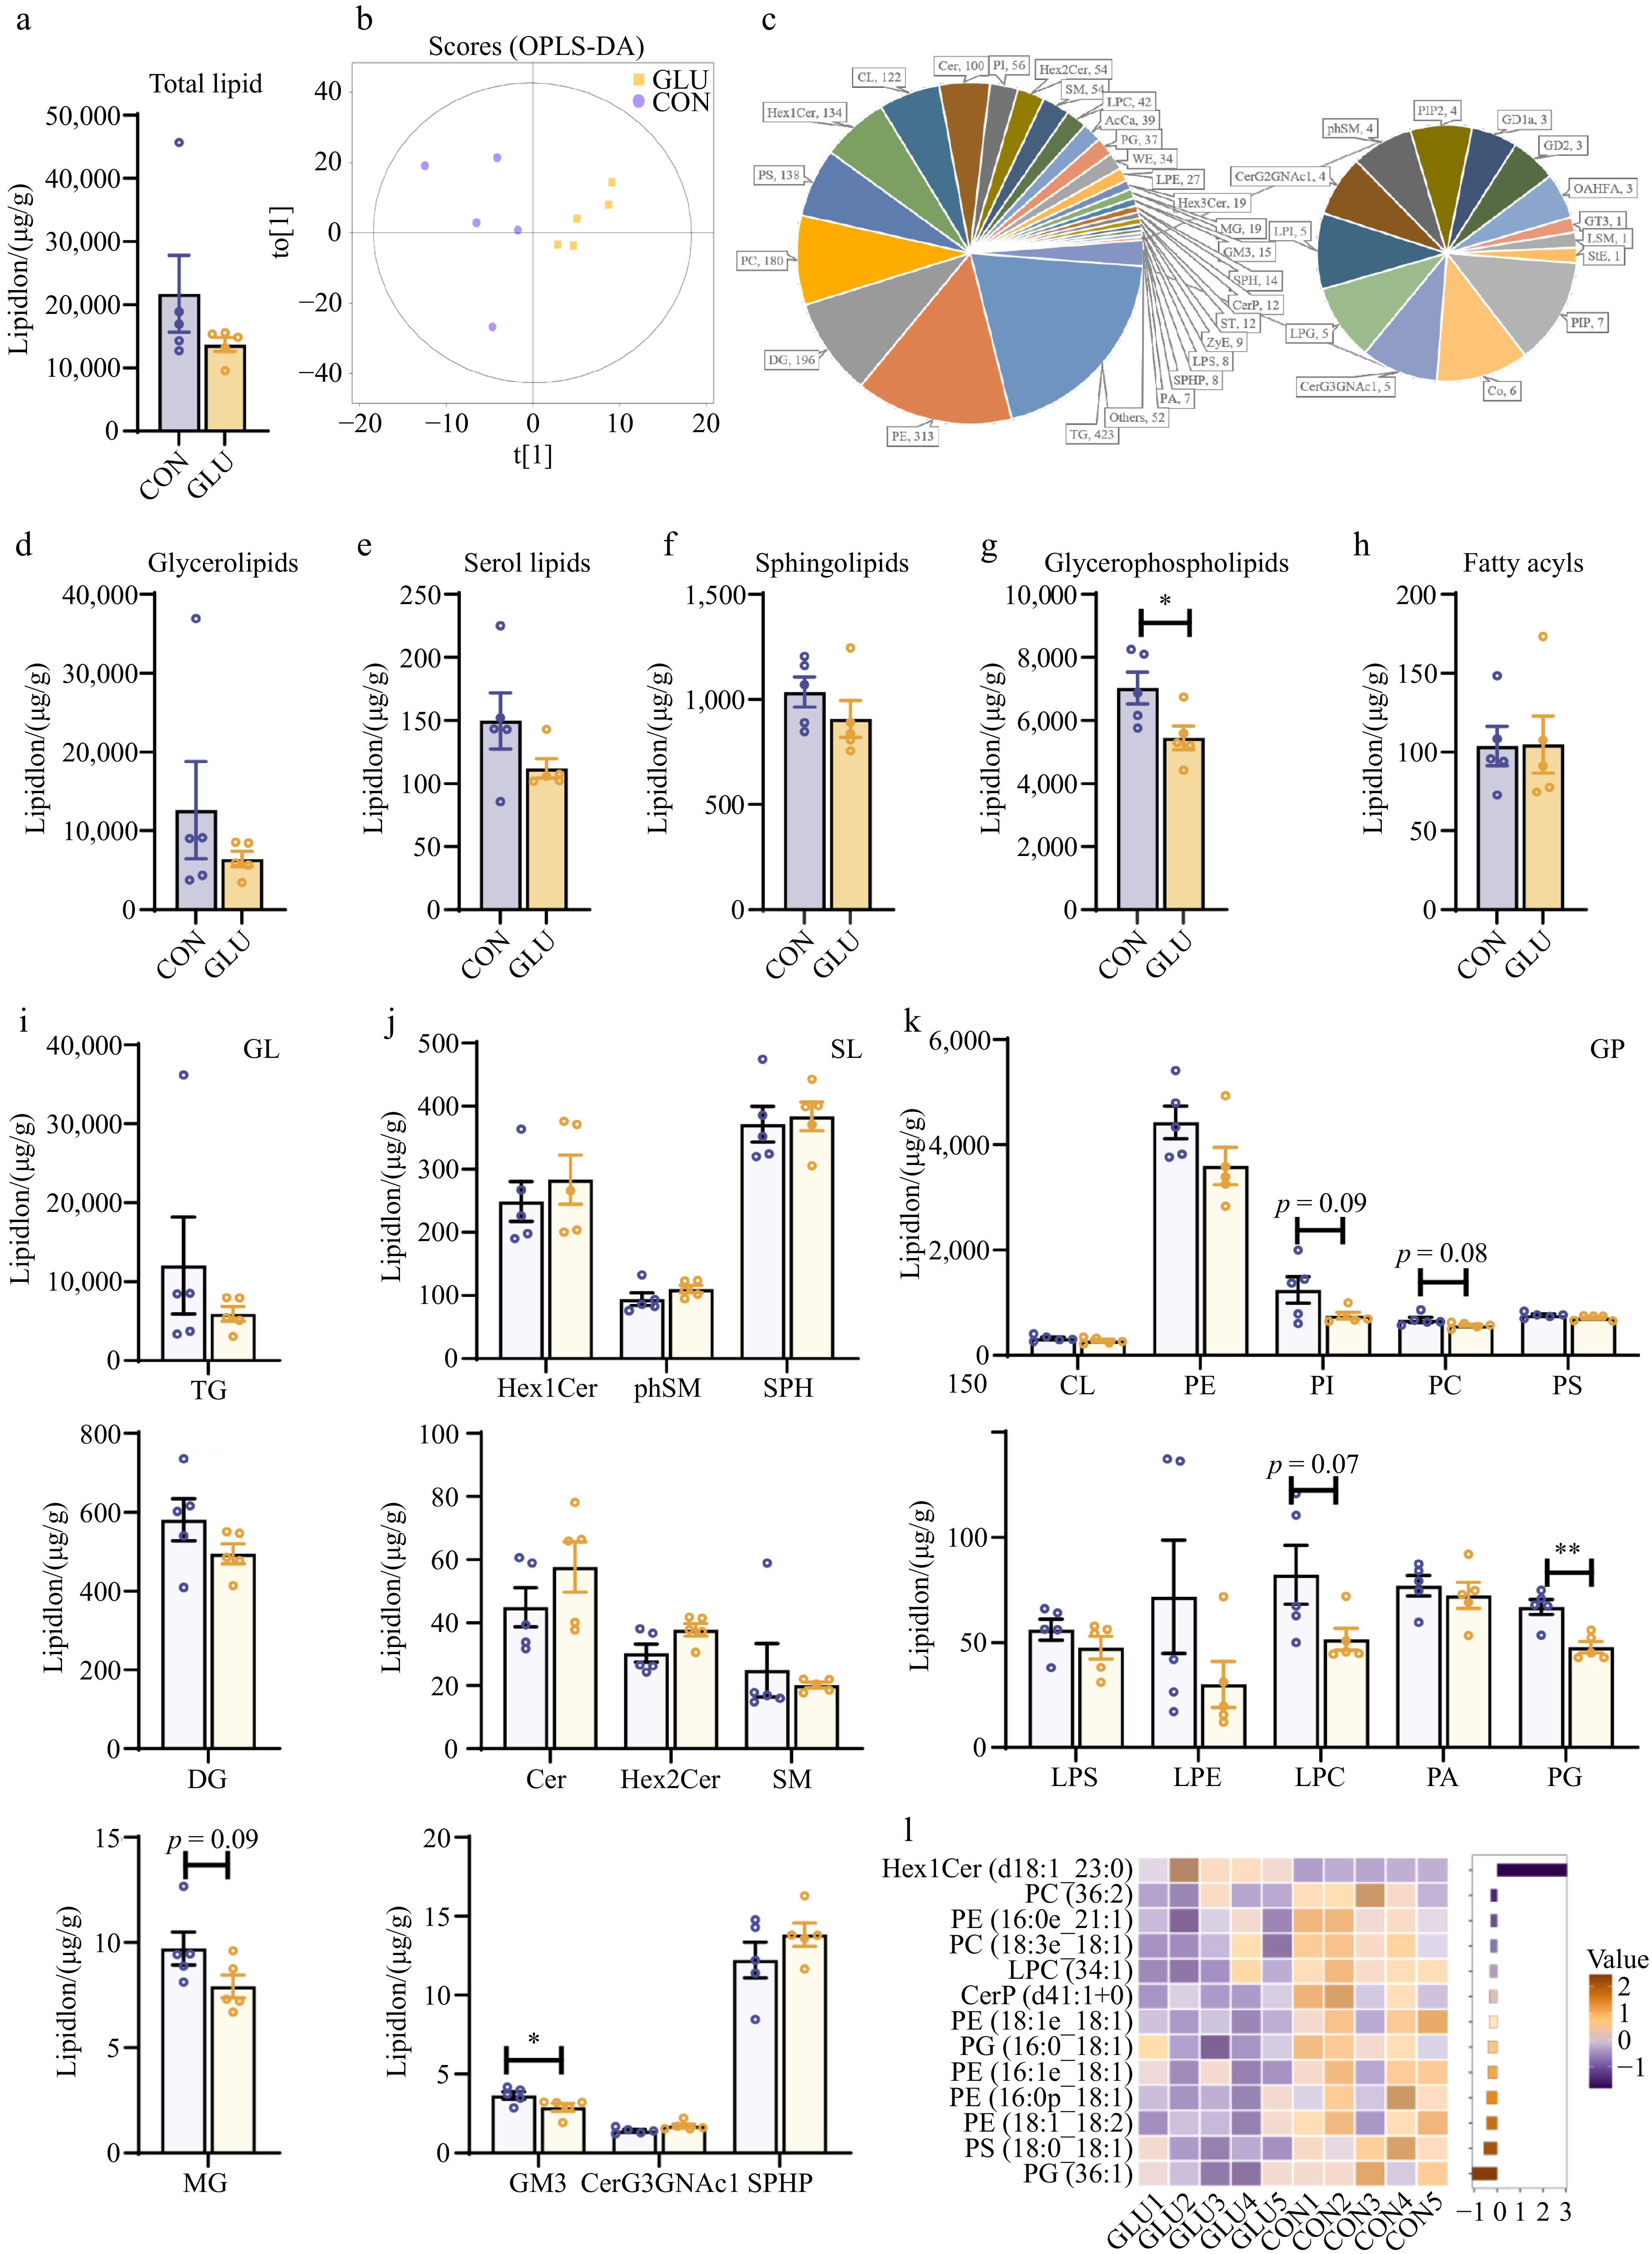
Figure 2.
Effects of Glu on the lipid composition of LD muscle of Shaziling pigs. (a) The content of total lipids. (b) The orthogonal projections to latent structures discriminant analysis (OPLS-DA) plot. (c) The types and amounts of lipids in LD muscle of Shaziling pigs. (d)−(h) Content of different lipid classes in LD muscle of Shaziling pigs. (i) The content of glycerolipids subclasses. (j) The content of sphingolipid subclasses. (k) The content of glycerophospholipids subclasses. (l) Heat map of differential lipid species in LD muscle of Shaziling pigs. n = 5. Error bars represent SEM. * p < 0.05, two-tailed Student's t-test.
-
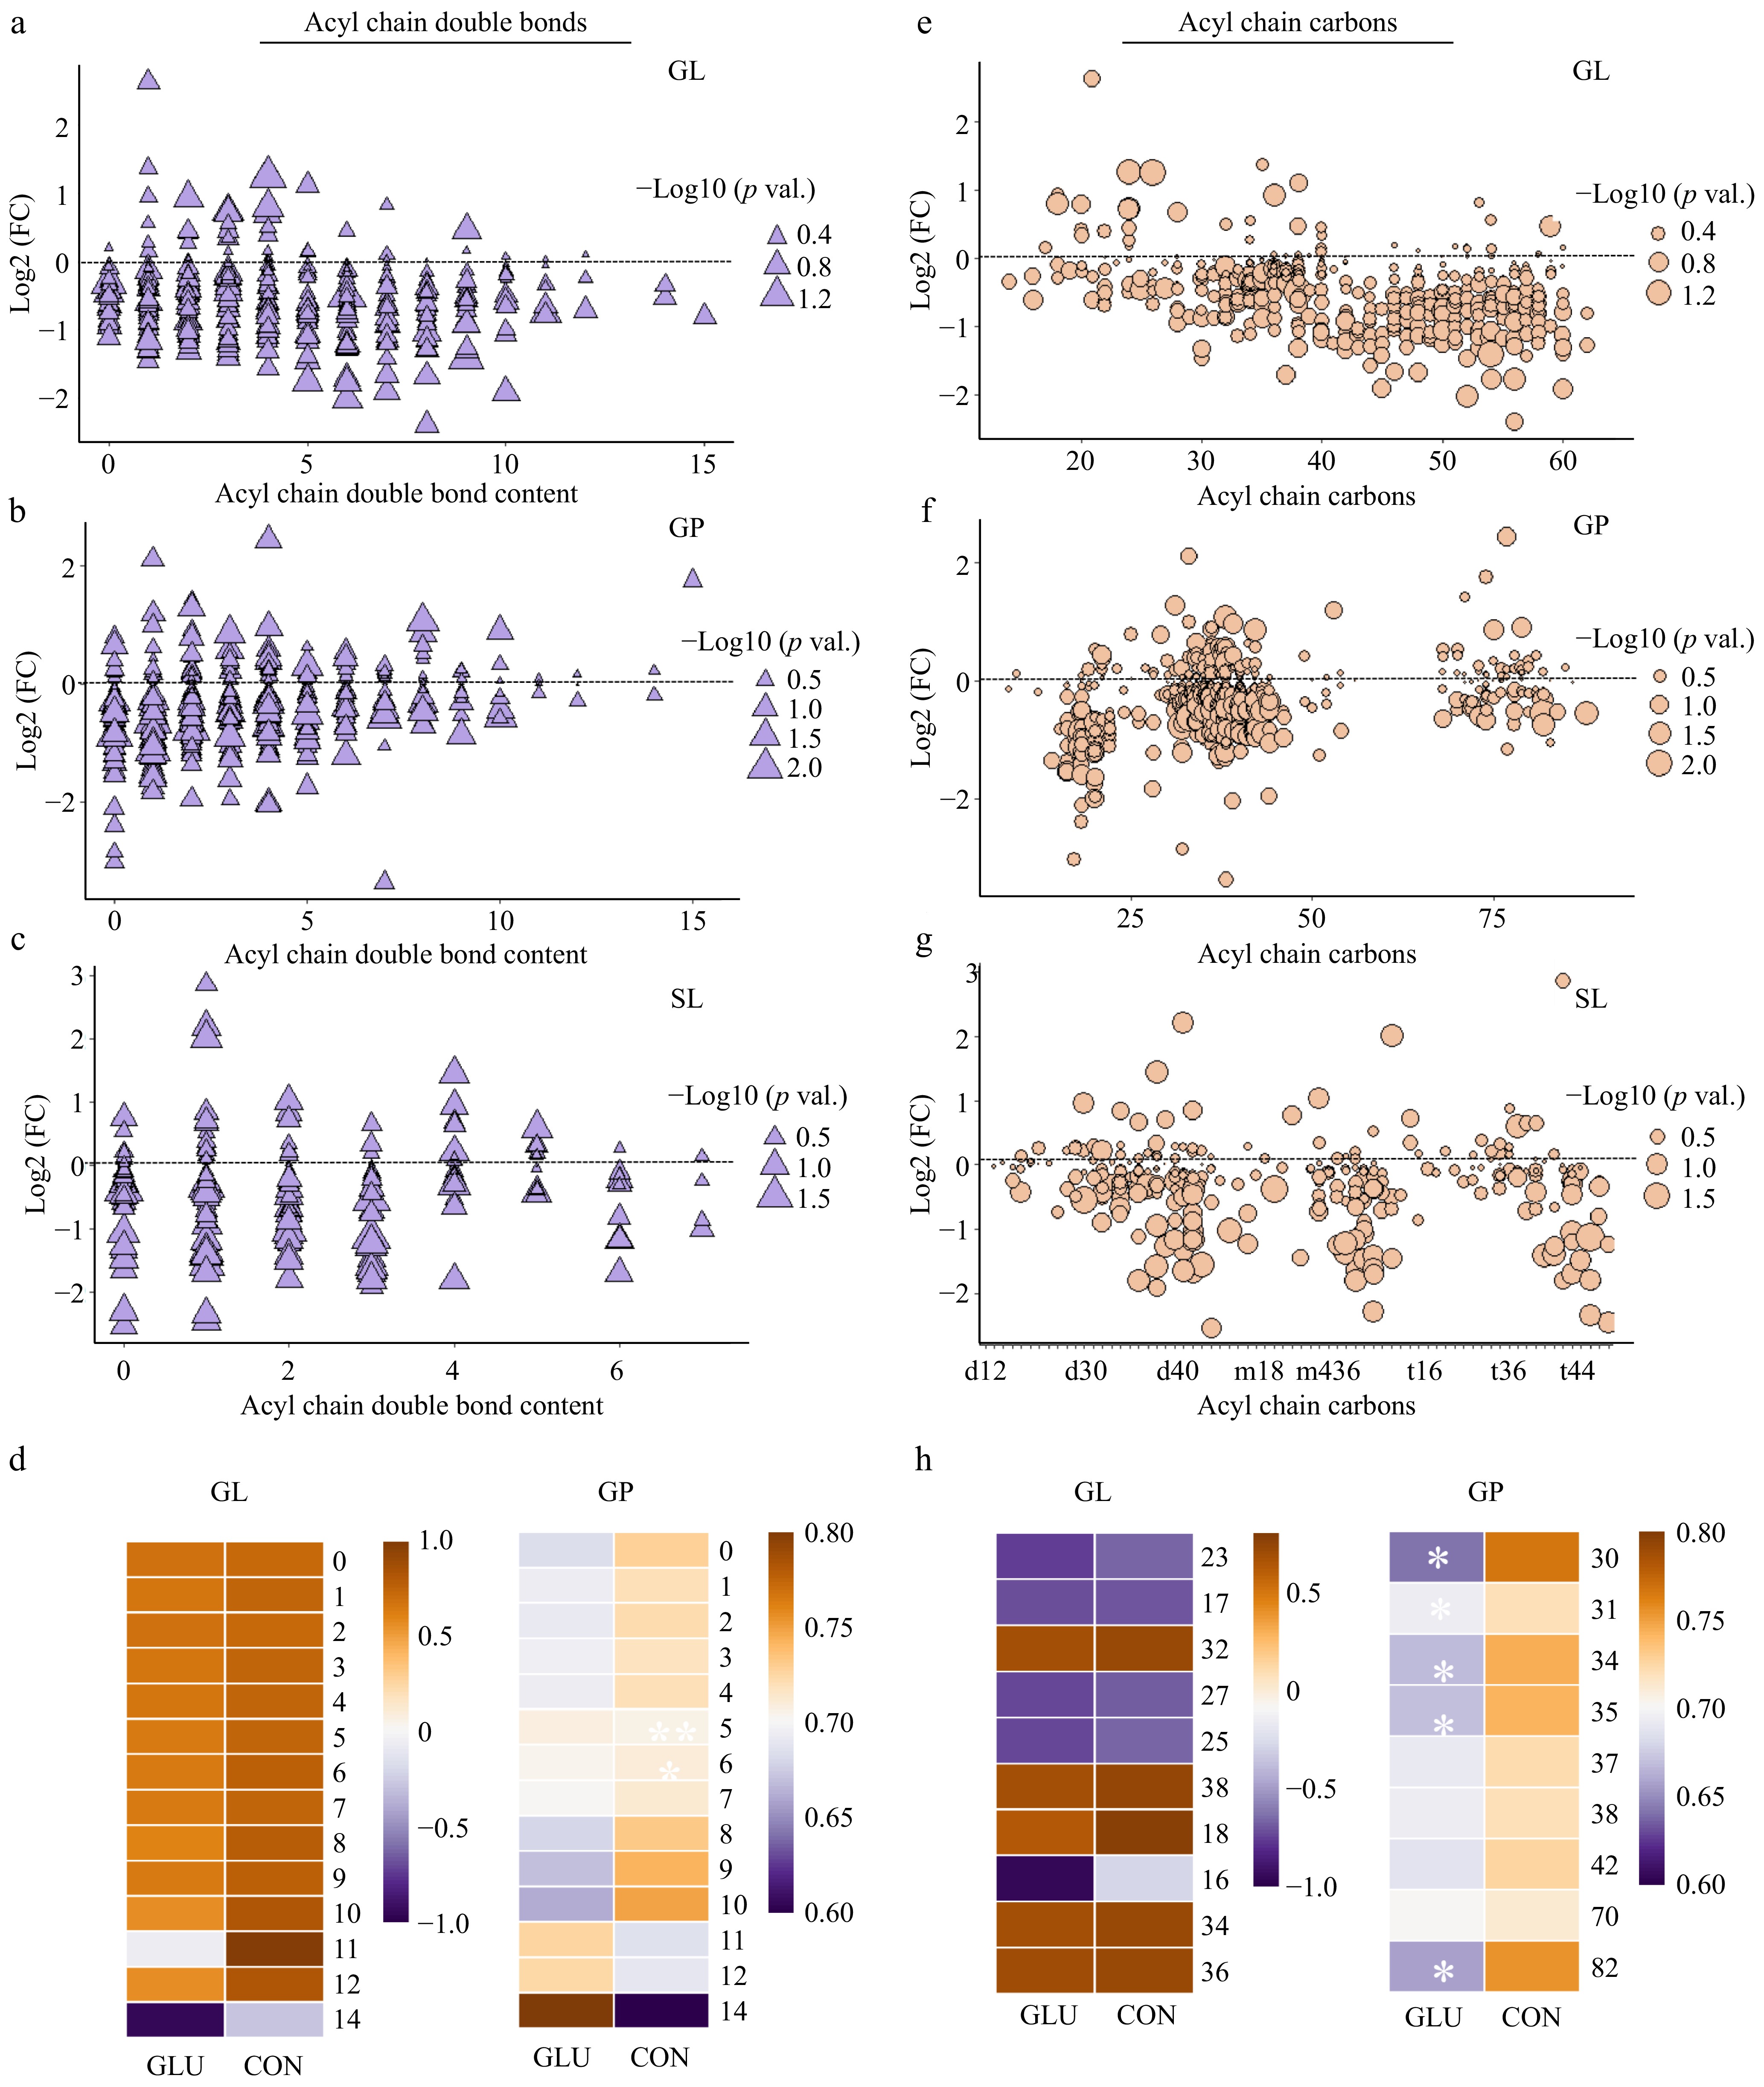
Figure 3.
Glu affected the lipid acyl chain compositions in the LD muscle of Shaziling pigs. (a) GLs with different double bond contents. (b) GPs with double bond contents. (c) SLs with different double bond contents. (d) Heatmap of acyl chain double bond contents in GL and GP pools from the control and Glu groups. (e) GLs with different numbers of carbon atoms. (f) GPs with different numbers of carbon atoms. (g) SLs with different numbers of carbon atoms. (h) Heatmap of acyl chain carbon atoms in GL and GP pools from the control and Glu groups. n = 5. Error bars represent SEM. * p < 0.05, two-tailed Student's t-test.
-
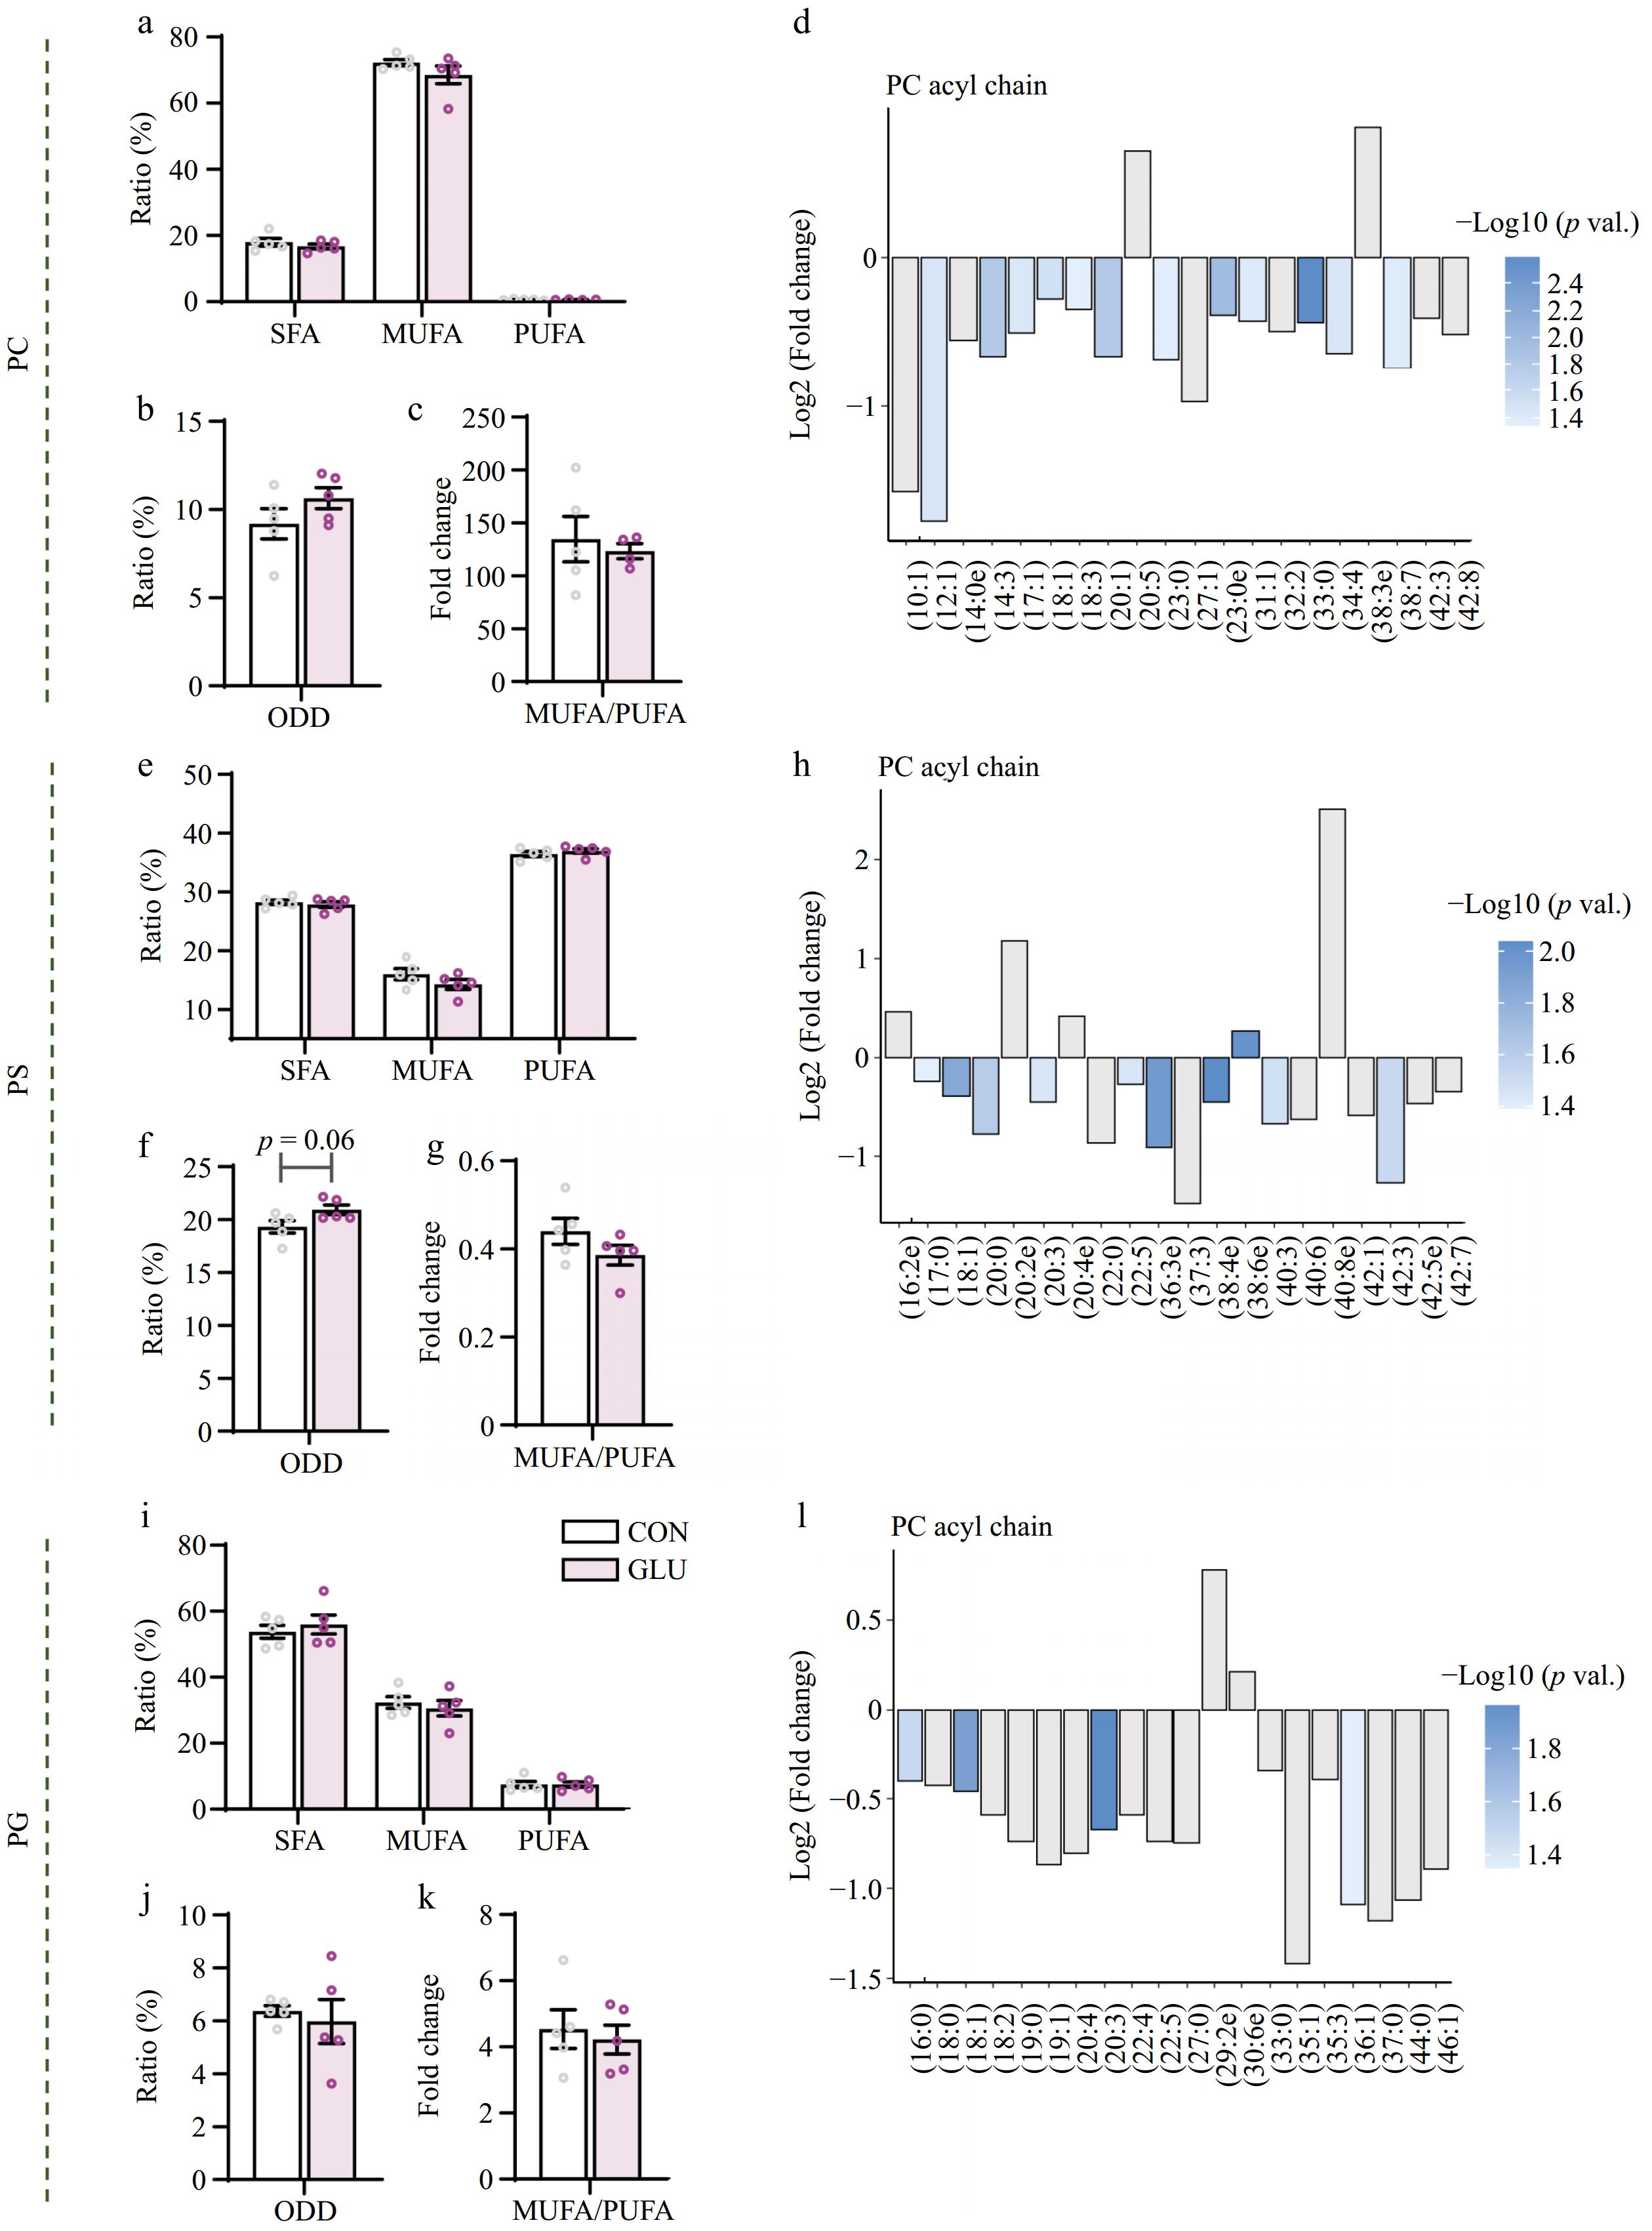
Figure 4.
Glu impacted acyl chain saturation levels of glycerophospholipid in LD muscle. (a) PC acyl chain contents at different saturation levels. (b) The content of fatty acyl chains with odd-numbered carbons in the PC pool. (c) The ratio of MUFA to PUFA in the PC pool. (d) Fold changes in the intensity of individual fatty acyl chains associated with PCs and sorted by saturation. (e) PS acyl chain contents at different saturation levels. (f) The content of fatty acyl chains with odd-numbered carbons in the PS pool. (g) The ratio of MUFA to PUFA in the PS pool. (h) Fold changes in the intensity of individual fatty acyl chains associated with PSs and sorted by saturation. (i) PG acyl chain contents at different saturation levels. (j) The content of fatty acyl chains with odd-numbered carbons in the PG pool. (k) The ratio of MUFA to PUFA in the PG pool. (l) Fold changes in the intensity of individual fatty acyl chains associated with PGs and sorted by saturation. n = 5. Error bars represent SEM. * p < 0.05, two-tailed Student's t-test.
-
Items CON GLU p value ALT (U/L) 53.00 ± 11.72 59.83 ± 3.80 0.243 AST (U/L) 68.00 ± 18.06 89.67 ± 15.15 0.067 ApoA (g/L) 0.23 ± 0.02 0.23 ± 0.02 0.457 ApoB (g/L) 0.02 ± 0.004 0.02 ± 0.005 0.092 HDL-C (mmol/L) 1.24 ± 0.29 1.09 ± 0.15 0.345 LDL-C (mmol/L) 1.79 ± 0.39 1.83 ± 0.14 0.827 TG (mmol/L) 0.61 ± 0.13 0.58 ± 0.09 0.705 TChol (mmol/L) 3.20 ± 0.67 3.13 ± 0.24 0.818 NEFA (mmol/L) 0.21 ± 0.04 0.21 ± 0.05 1.000 Glu (mmol/L) 4.62 ± 0.62 4.96 ± 0.57 0.379 * Results are presented as the mean ± SEM, n = 6, number of replicates. Table 1.
Effects of Glu on serum biochemical indices of Shaziling pigs*.
Figures
(4)
Tables
(1)