-
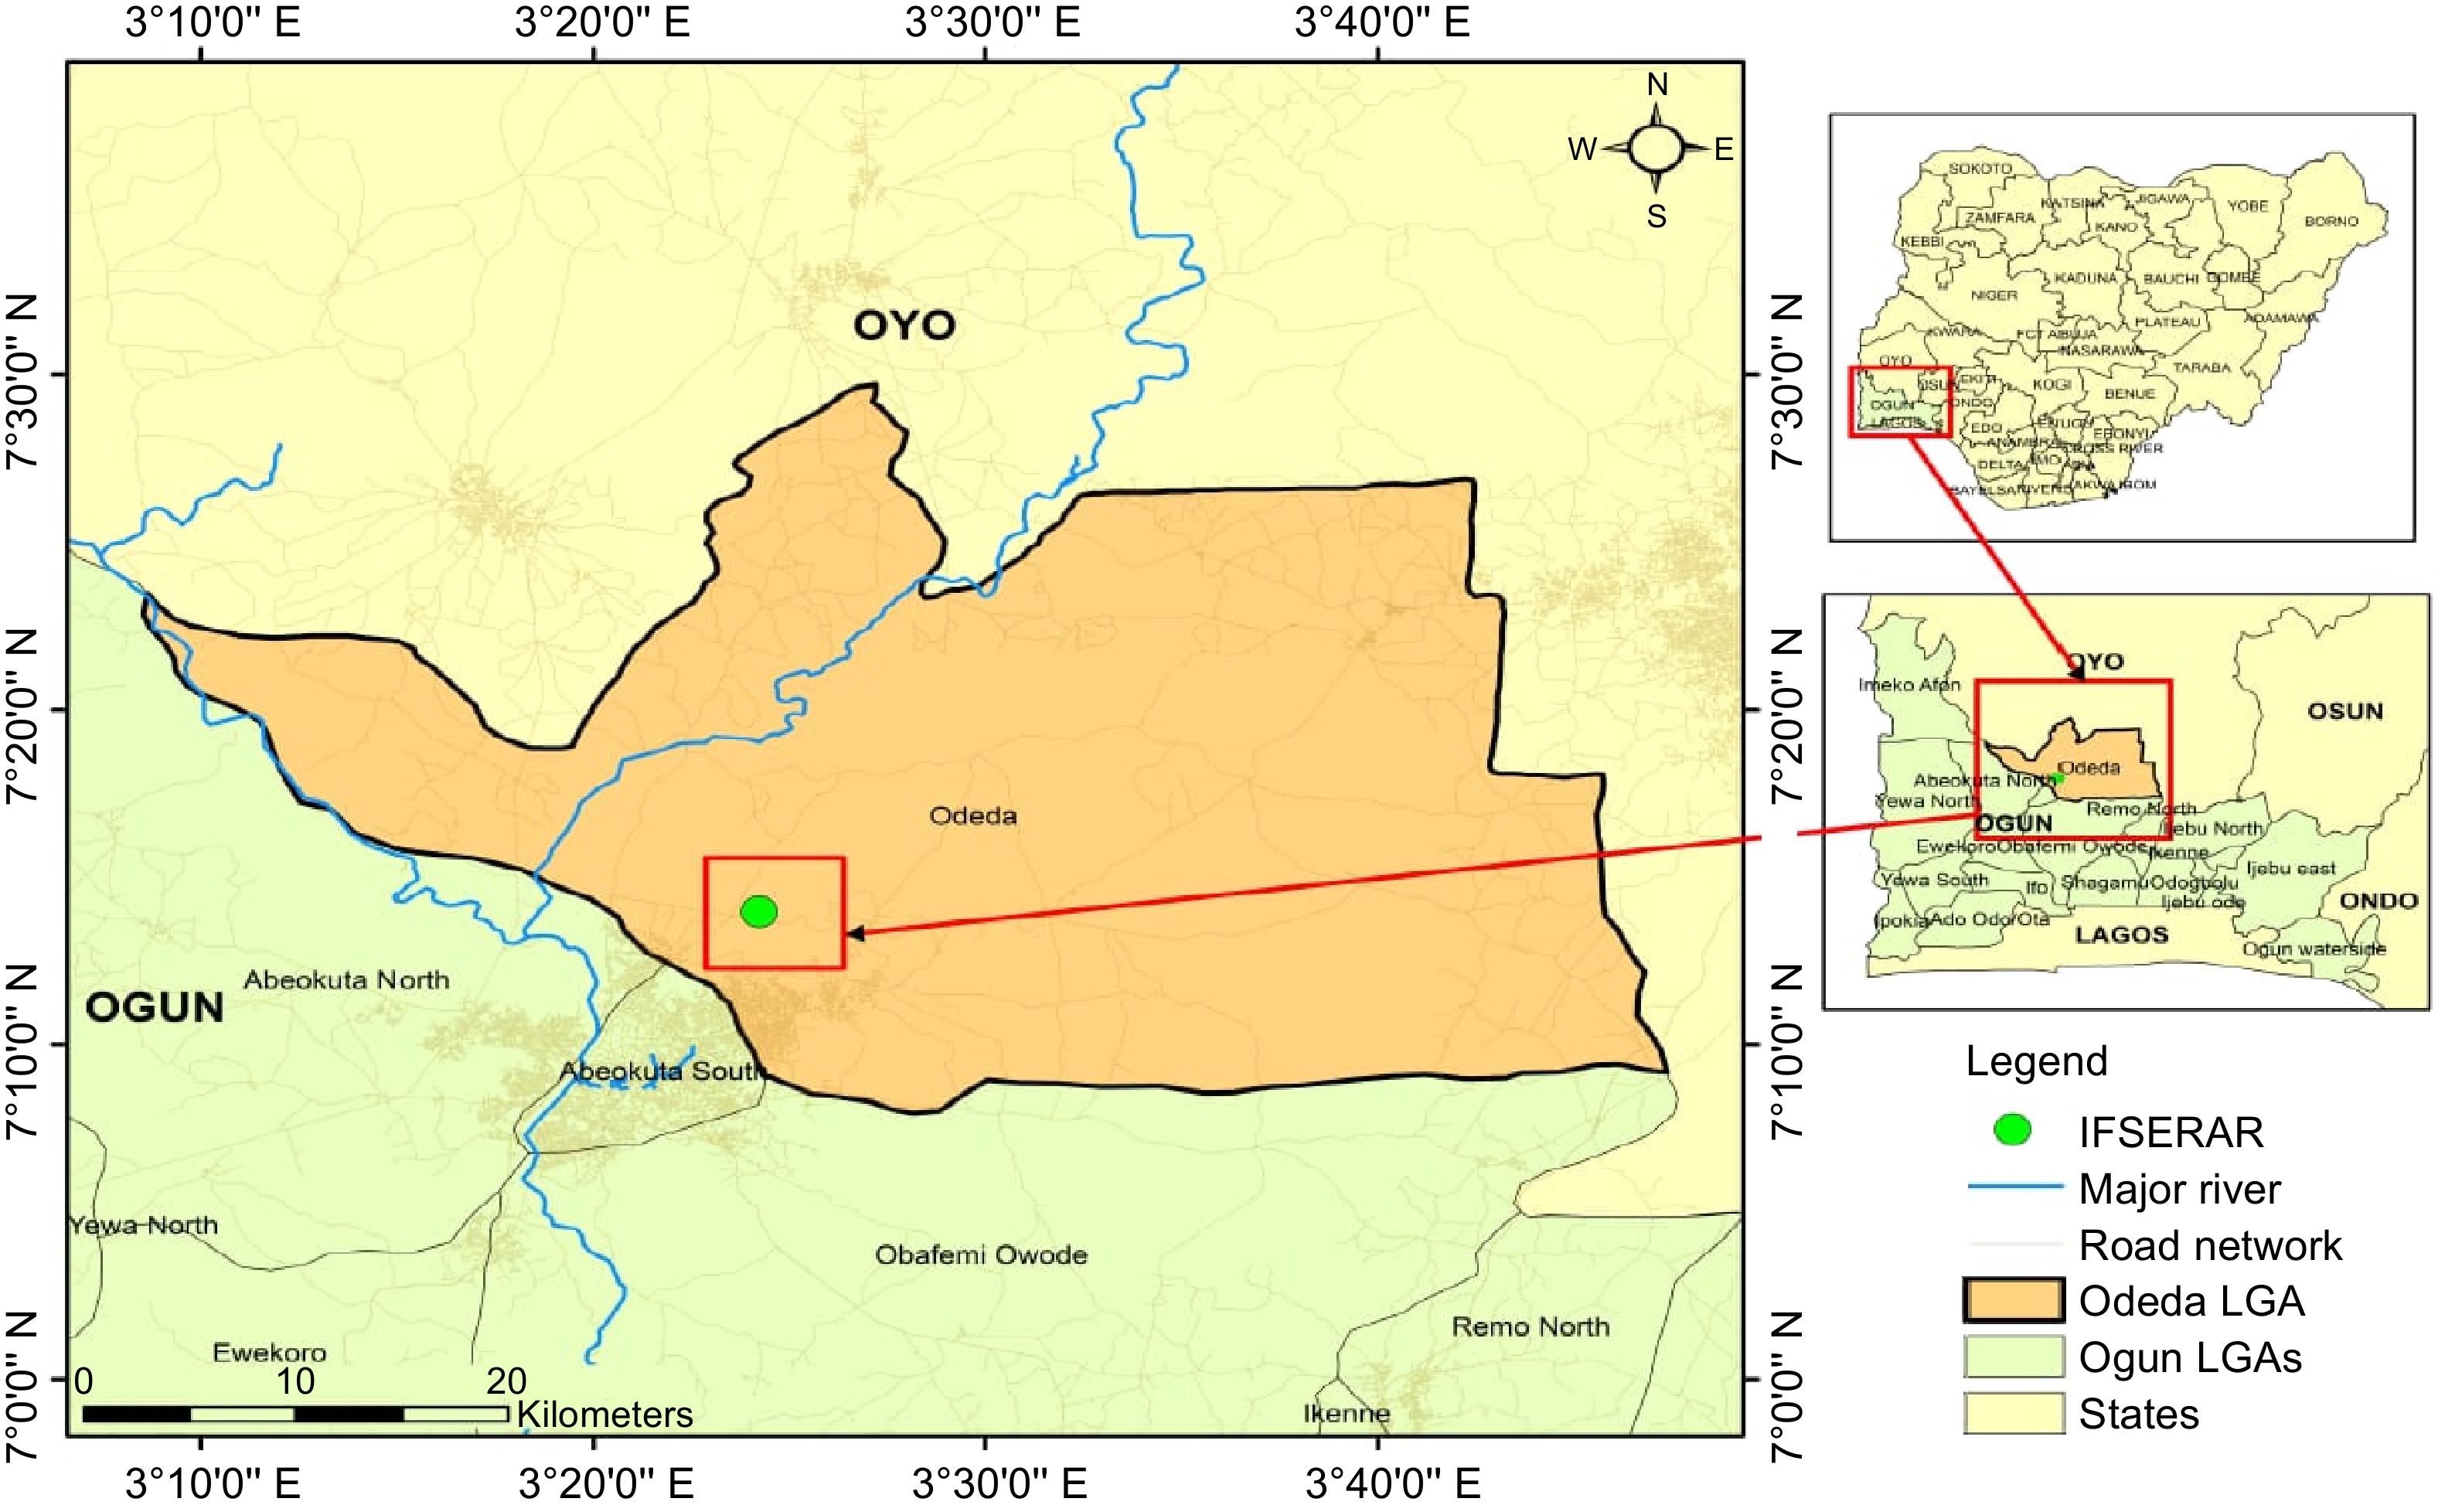
Figure 1.
Map of the experimental plots at the Federal University of Agriculture, Abeokuta, Nigeria.
-
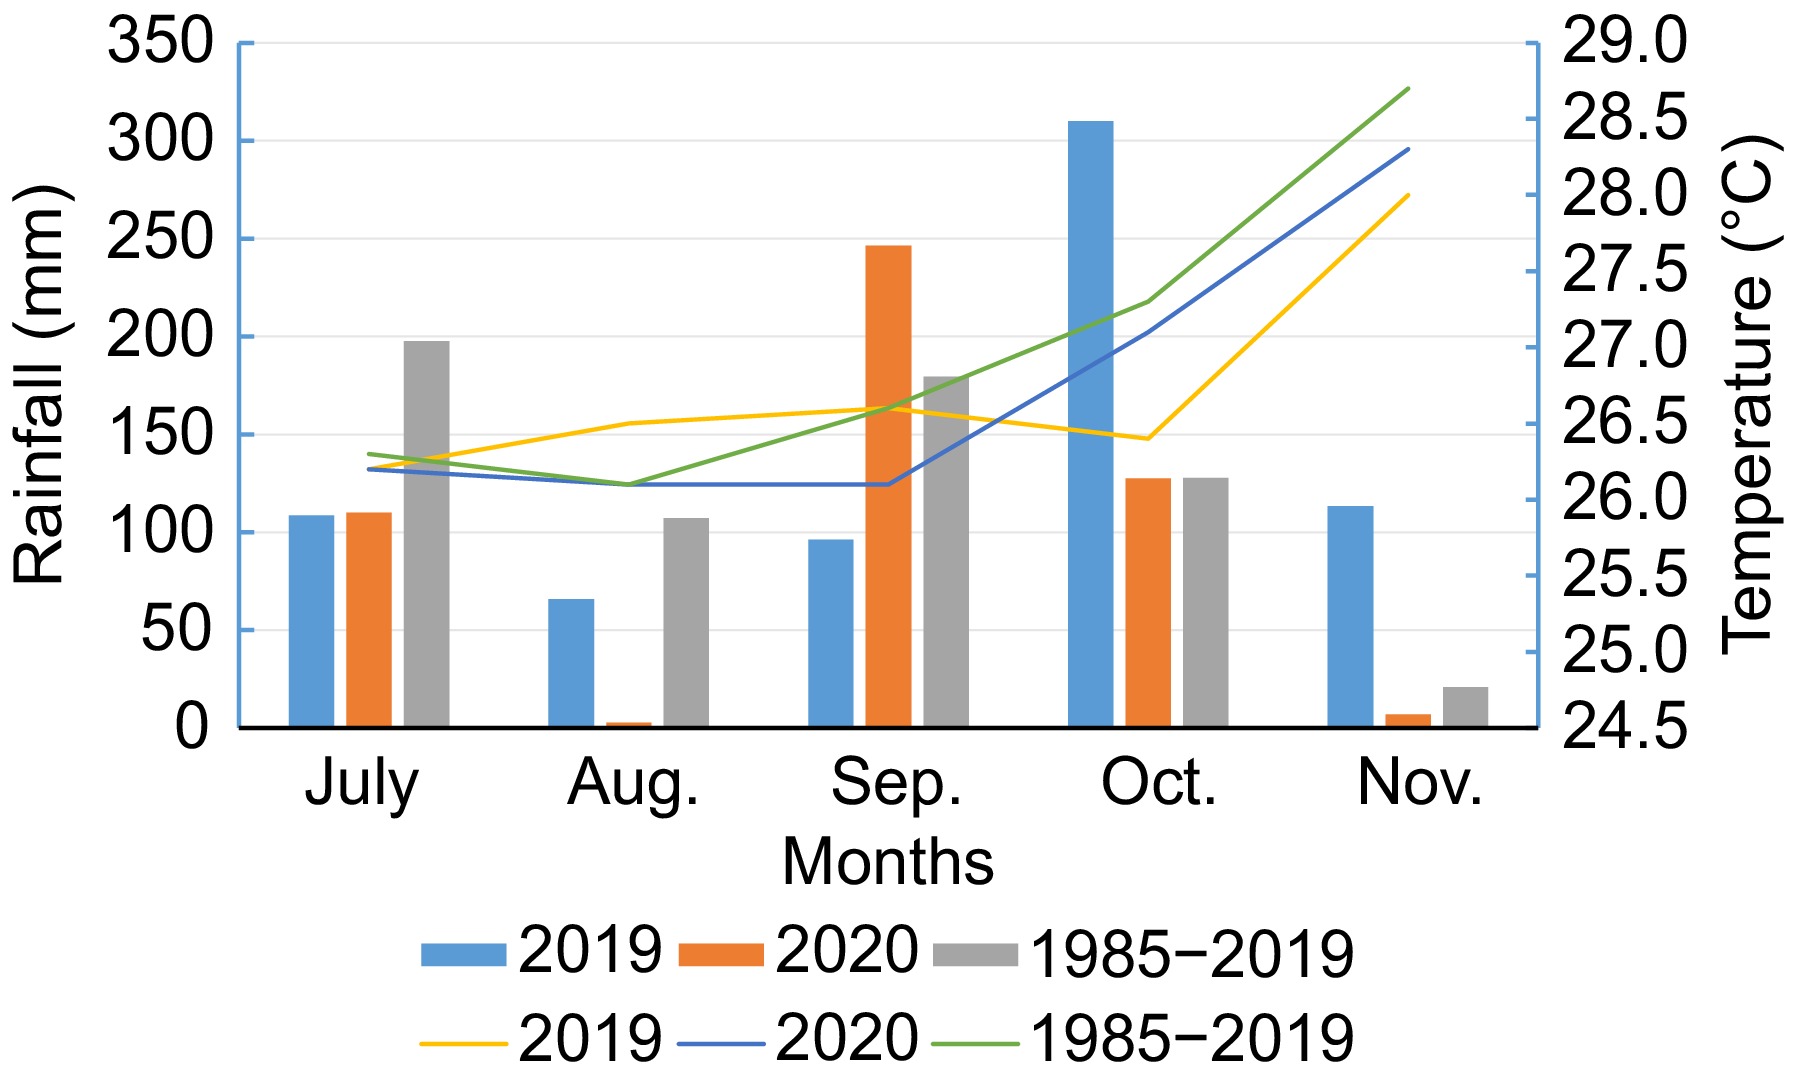
Figure 2.
Monthly rainfall distribution and mean temperature during the experimental periods (July−November 2019 and 2020) and the long-term (1985−2019) at the Federal University of Agriculture Abeokuta, Nigeria.
-
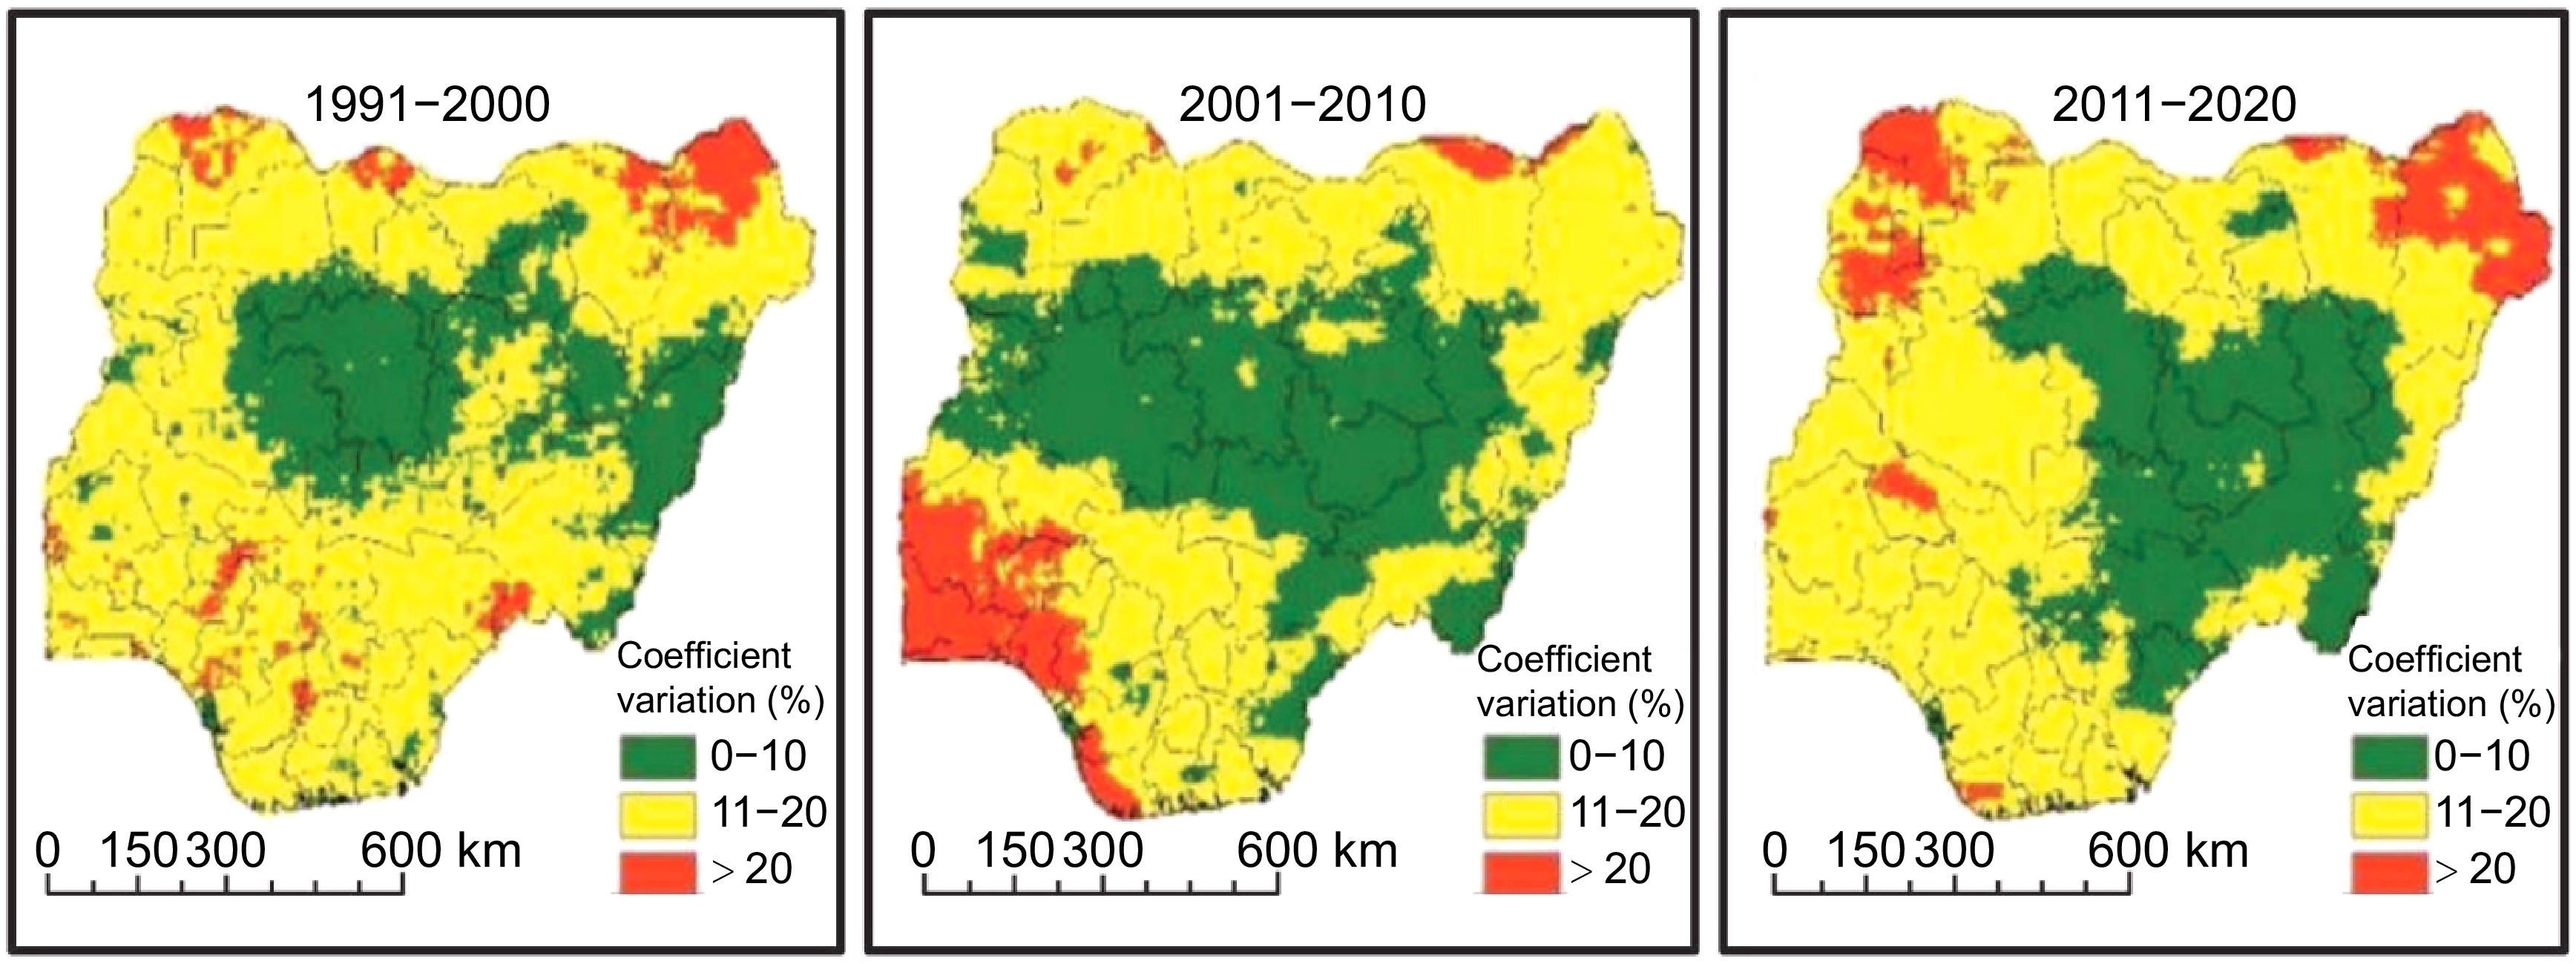
Figure 3.
The coefficient of variation of rainfall during the growing season in Nigeria for three decades.
-
Soil
compositionContinuous cropping
(−OF) (CS1)Continuous cropping (+OF) (CS2) Rotation (+OF) (CS3) Rotation
(−OF) (CS4)Conventional
(CS5)Mechanical composition (g/kg) Clay 65 85 85 85 65 Silt 35 45 45 25 65 Sand 900 870 870 890 870 Textural classification Sand Loamy
sandLoamy sand Loamy sand Loamy
sandpH 6.6 6.9 6.5 6.9 6.8 Total N (g/kg) 0.97 0.94 0.77 0.84 0.59 OC (g/kg) 9.5 5.4 10.4 8.4 13.4 P (mg/kg) 2.56 4.87 23.59 3.01 3.64 Exchangeable cation (cmol/kg) K 0.12 0.06 0.08 0.09 0.12 Ca 3.89 2.89 2.99 3.39 4.59 Mg 1.74 1.48 1.63 1.96 1.81 Na 0.49 0.34 0.39 0.30 0.59 Micronutrient (mg/kg) Mn 264 280 356 288 299 Fe 12 12 12 10 14 Zn 51 54 51 52 51 OC: organic carbon. Table 1.
Pre-cropping physical and chemical properties of the soil in 2019.
-
Soil
compositionContinuous cropping
(−OF) (CS1)Continuous cropping (+OF) (CS2) Rotation (+OF) (CS3) Rotation
(−OF) (CS4)Conventional
(CS5)Mechanical composition (g/kg) Clay 37.8 1.00 16.1 19.0 18.0 Silt 40.5 149.8 100 151.1 163.5 Sand 958.5 833.7 879.3 834.3 798.7 Textural classification Sand Loamy
sandLoamy
sandLoamy
sandLoamy
sandpH 7.3 7.4 7.3 7.4 7.2 Total N (g/kg) 0.82 0.53 0.87 0.81 0.92 OC (g/kg) 9.6 6.2 10.2 9.4 10.6 P (mg/kg) 35.68 45.42 37.51 61.86 40.55 Exchangeable cation (cmol/kg) K 0.34 0.36 0.69 0.41 0.36 Ca 0.98 1.52 2.29 1.68 1.51 Mg 1.04 1.08 1.79 1.21 1.13 Na 0.17 0.18 0.29 0.18 0.18 Micronutrient (mg/kg) Mn 4.29 4.68 7.35 4.52 4.20 Fe 9.10 10.22 10.70 7.35 8.00 Zn 5.61 7.23 9.69 7.28 6.81 OC: organic carbon. Table 2.
Pre-cropping physical and chemical properties of the experimental site in 2020.
-
Parameters July Aug Sept Oct Nov Total Long term rainfall 2019 2020 2019 2020 2019 2020 2019 2020 2019 2020 2019 2020 35 years Mean temperature (°C) 26.2 25.7 26.5 26.2 26.6 26.1 26.4 27.1 27.9 28.3 141.2 133.4 − Total rainfall (mm) 108.7 109.5 65.8 2.9 96.3 246.31 310 127.6 112.3 7.0 693.1 493.3 632.8 Number of rainy days 11 8 8 1 10 11 19 11 5 1 53 32 − Relative humidity (%) 87.4 82.5 83.4 80.0 85.7 79.0 84.0 71.8 86.9 69.1 427.4 382.4 − Sunshine (h) 2.2 2.3 2.5 3.2 2.0 2.9 1.7 3.8 5.2 5.5 13.6 17.7 − Source: Department of Agro Meteorology and Water Management, Federal University of Agriculture, Abeokuta, Nigeria. Table 3.
Some weather parameters during the late cropping season (July–November) in 2019 and 2020.
-
AEZs 1991−2000 2001−2010 2011−2020 MAnRD MAnDD MAnRD MAnDD MAnRD MAnDD AS 56.2 309.1 56.9 308.3 58.6 306.7 SA 83.1 282.2 84.3 280.9 84.9 280.4 NGS 107.1 258.2 106.9 258.3 107.8 257.5 SGS 115.1 250.2 114.1 251.1 115.2 250.1 HA 184 181.3 177.7 187.5 181.6 183.7 MA 138.4 226.9 135.8 229.4 139.5 225.8 DS 127.5 237.8 127.8 237.4 129.1 236.2 HF 161 204.3 162.3 202.9 167.4 197.9 AS: Arid/Sahel; SA: Semi-Arid; NGS: Northern Guinea Savanna; SGS: Southern Guinea Savanna; HA: High Altitude; MA: Mid Altitude; DS: Derived Savanna; HF: Humid Forest; MAnDD: Mean Annual Dry Days; MAnRD: Mean Annual Rainy Days. Table 4.
Mean annual rainy days (MAnRD) and Mean annual dry days (MAnDD) in the agroecological zones (AEZs) from 1991 to 2020.
-
Cropping system 2019 2020 PHTMAT (cm) NSYPB per plant NMONB NTBR NBOLLS PHTMAT (cm) NSYPB per plant NMONB NTBR NBOLLS CS1 86.1a 11.4c 1.1a 12.5c 13.6c 54.8c 12.6c 0.4a 13.0a 9.1c CS2 109.6a 14.7ab 1.0a 15.8b 24.3a 79.6ab 15.7ab 0.7a 16.4a 11.7bc CS3 109.1a 14.3b 1.5a 15.8b 24.2a 85.9a 15.6ab 1.3a 16.9a 17.6a CS4 105.3a 14.0b 1.5a 15.5b 22.3ab 67.0bc 14.7b 0.6a 15.3a 9.8c CS5 113.1a 16.9a 2.3a 19.2a 21.2b 87.0a 17.0a 1.5a 18.6a 13.5b LSD 5% ns 2.28 ns 2.26 2.26 16.90 1.98 ns ns 2.90 CS1 - Continuous cropping (without organic fertilizer), CS2 - Continuous cropping (with organic fertilizer), CS3 - Rotation (with organic fertilizer), CS4 - Rotation (without organic fertilizer) and CS5 - Conventional system (60 kg N, 56 kg P2O5 and 60 kg K2O, and herbicide), ns: not significant, LSD: least significant difference, PHTMAT: Plant height at maturity, NSYPB: Number of synpodia branches, NMONB: number of monopodia branches, NTBR: number of total branches, NBOLLS: Number of bolls. Means followed by the same alphabeths are not significantly different from each other based on the leaset significance difference test at 5% probability level. Table 5.
Effects of cropping system on plant height (cm) at maturity, number of synpodia, monopodia, and total branches of plant, and bolls per plant in 2019 and 2020.
-
Cropping system 2019 2020 SCWT WTSEEDS WTLINT SCYD SCWT WTSEEDS WTLINT SCYD CS1 7.3a 5.3b 2.0a 204.96b 8.6b 6.3c 2.5c 230.44c CS2 22.5a 16.0a 6.4a 631.95a 19.3a 12.1b 6.4b 541.80b CS3 24.1a 18.9a 5.1a 675.08a 25.7a 18.1a 8.2ab 692.16ab CS4 24.2a 19.3a 4.8a 677.88a 28.0a 20.1a 9.3a 784.56a CS5 11.3a 5.8b 5.5a 318.40b 9.7b 5.8c 3.2c 272.72c LSD 5% 4.35 3.75 ns 122.048 7.90 4.06 2.55 207.380 CS1 - Continuous cropping (without organic fertilizer), CS2 - Continuous cropping (with Organic fertilizer), CS3 - Rotation (with Organic fertilizer), CS4 - Rotation (without organic fertilizer) and CS5 - Conventional system (60 kg N, 56 kg P2O5 and 60 kg K2O, and herbicide), ns: not significant, LSD: least significant difference, SCWT: Seed cotton weight, WTSEEDS: Weight of seeds, WTLINT: Weight of lint, SCYD: Seed cotton yield. Means followed by the same alphabeths are not significantly different from each other based on the leaset significance difference test at 5% probability level. Table 6.
Effects of cropping system on seed cotton weight (g), weight of seeds (g), weight of lint (g), and seed cotton yield (kg/ha) in 2019 and 2020.
Figures
(3)
Tables
(6)