-
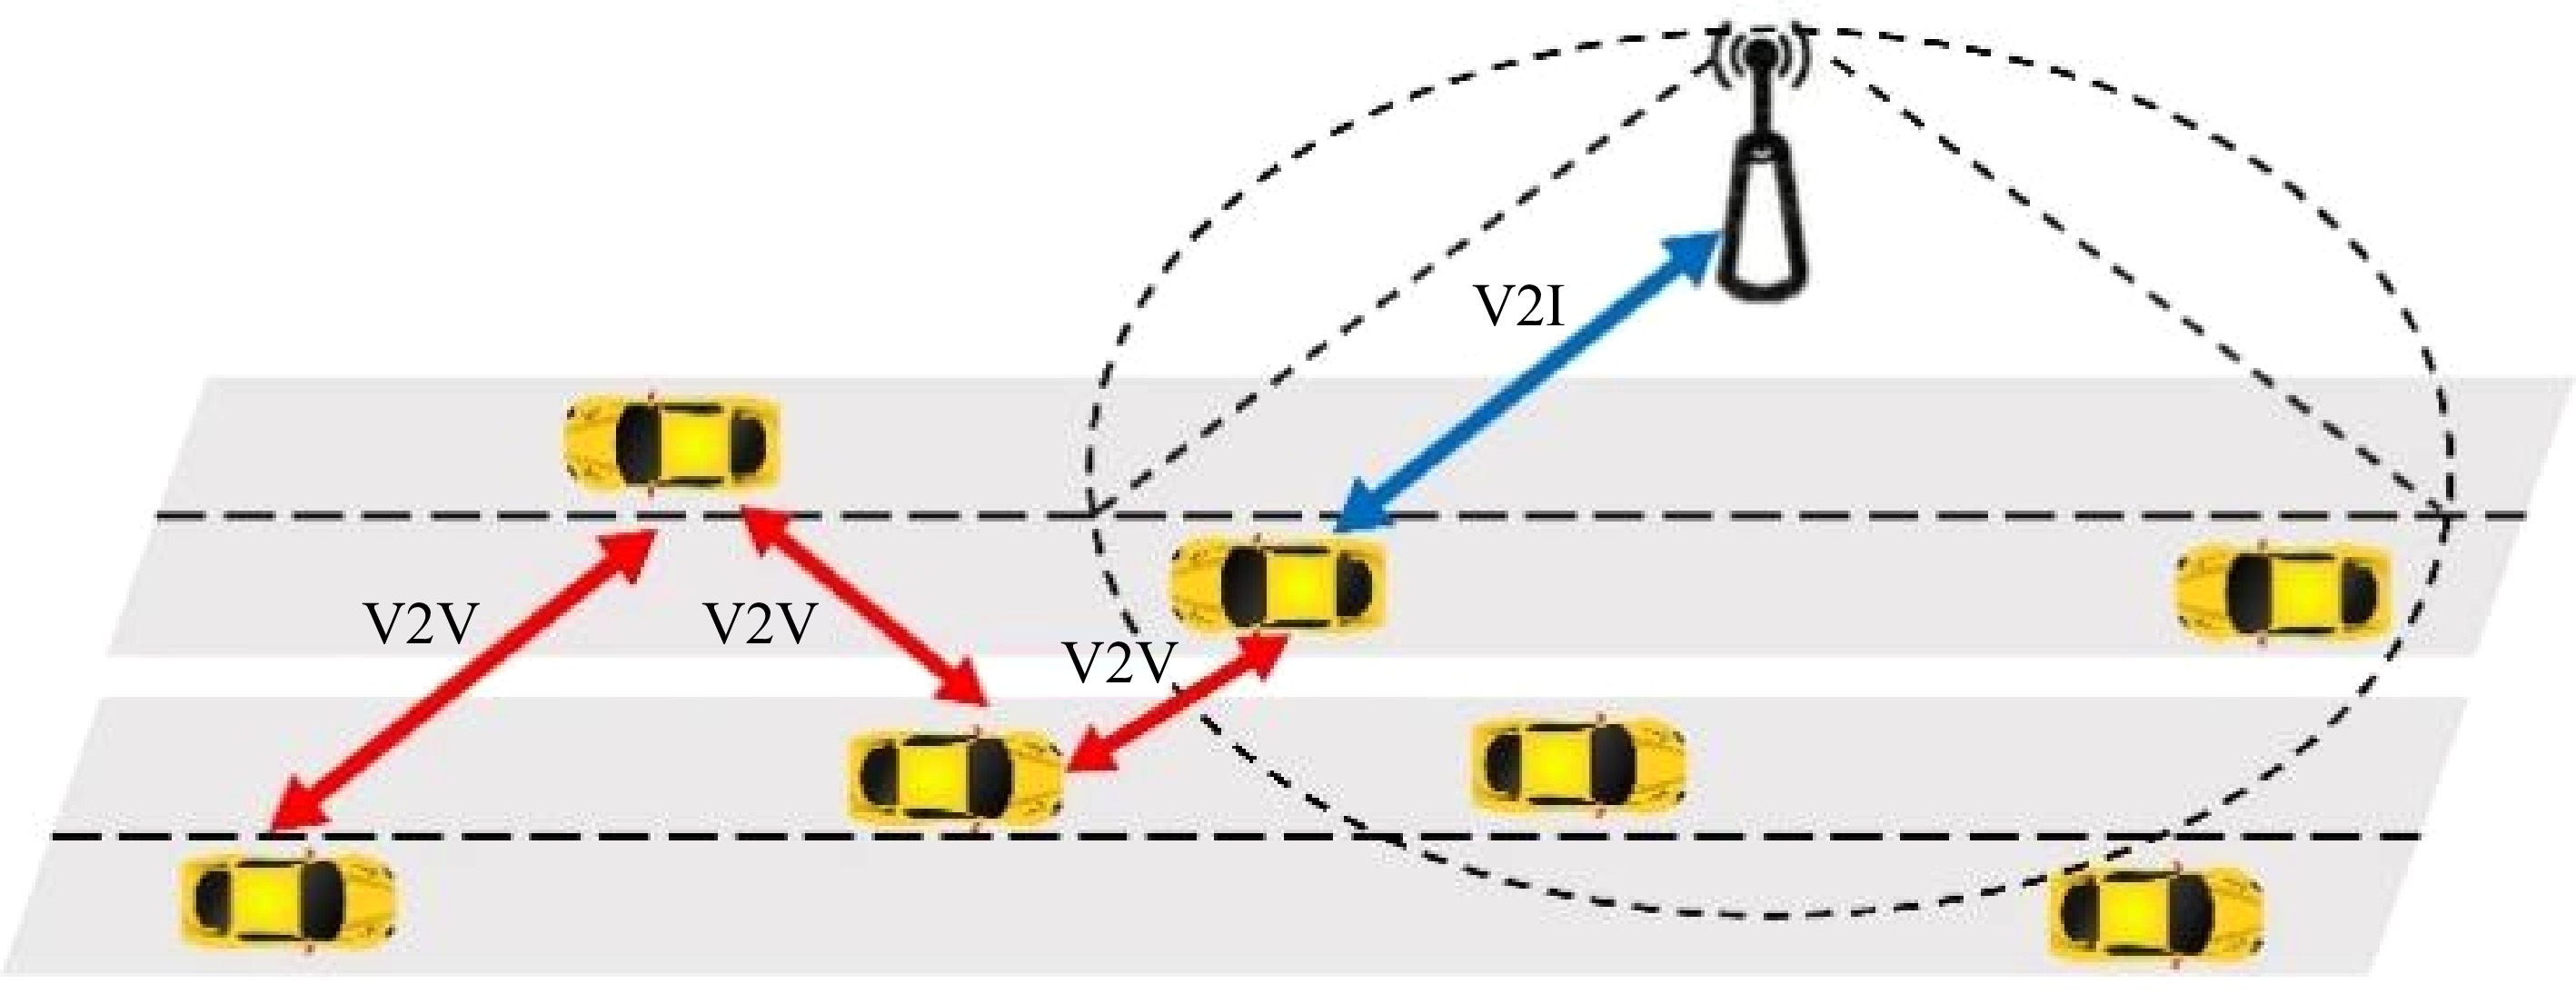
Figure 1.
Diagram of information transmission in vehicle-to-infrastructure cooperative systems.
-
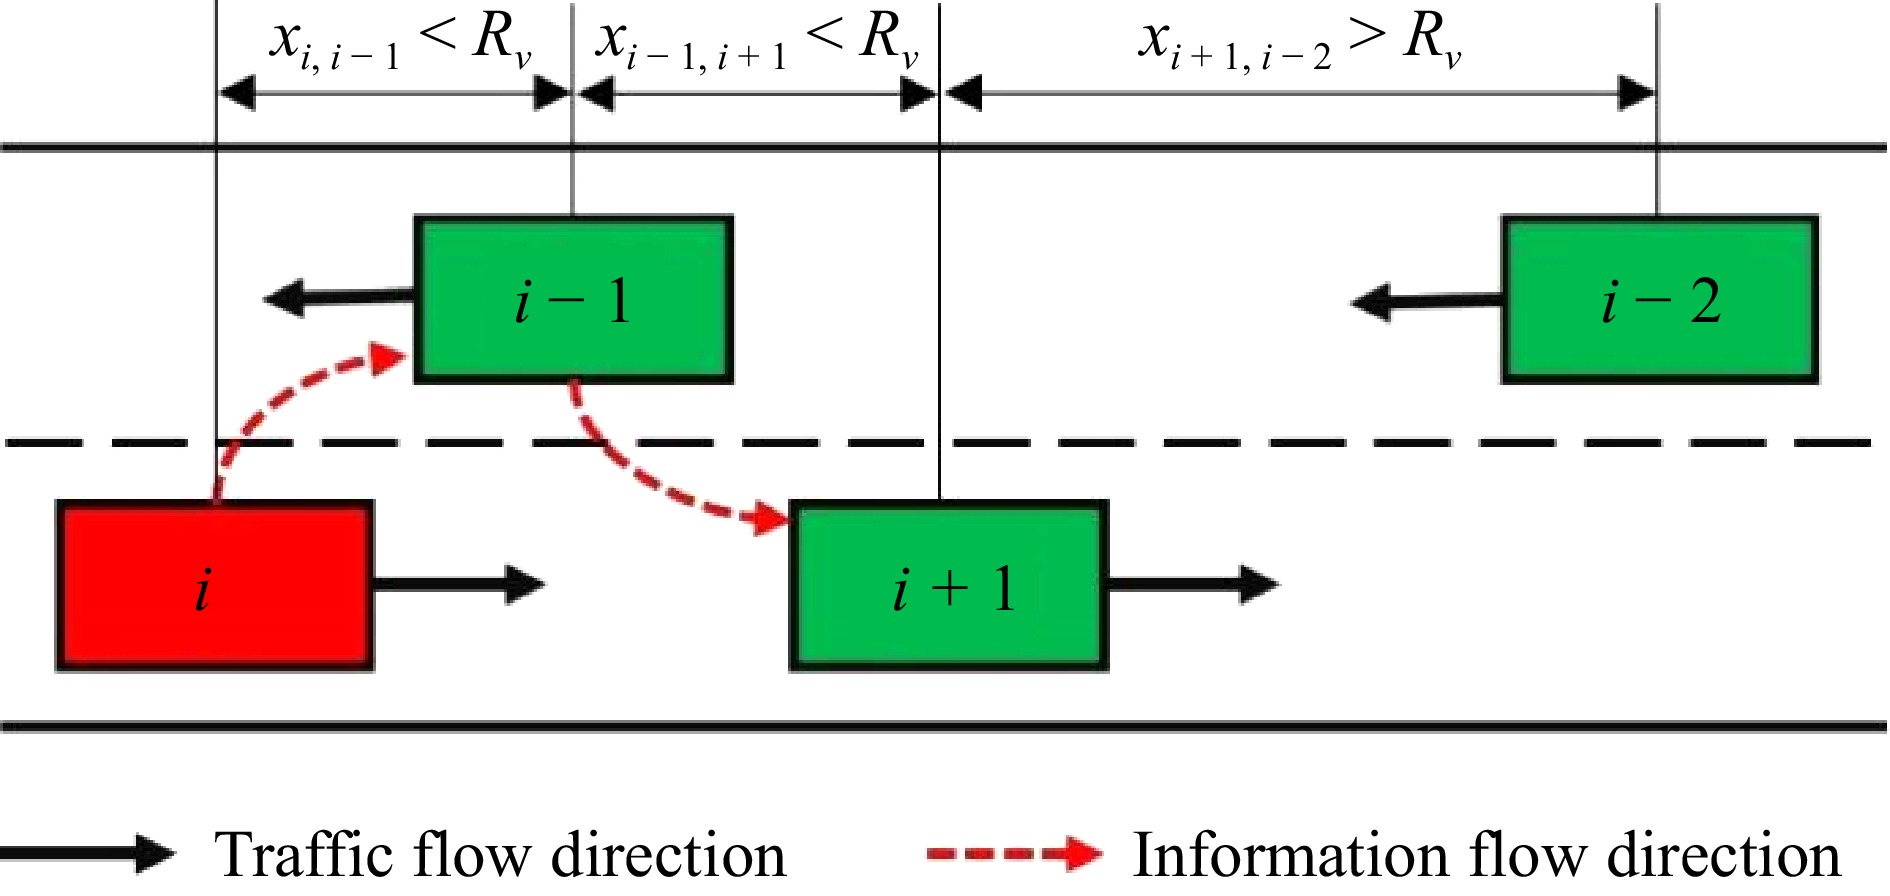
Figure 2.
Instantaneous transmission.
-
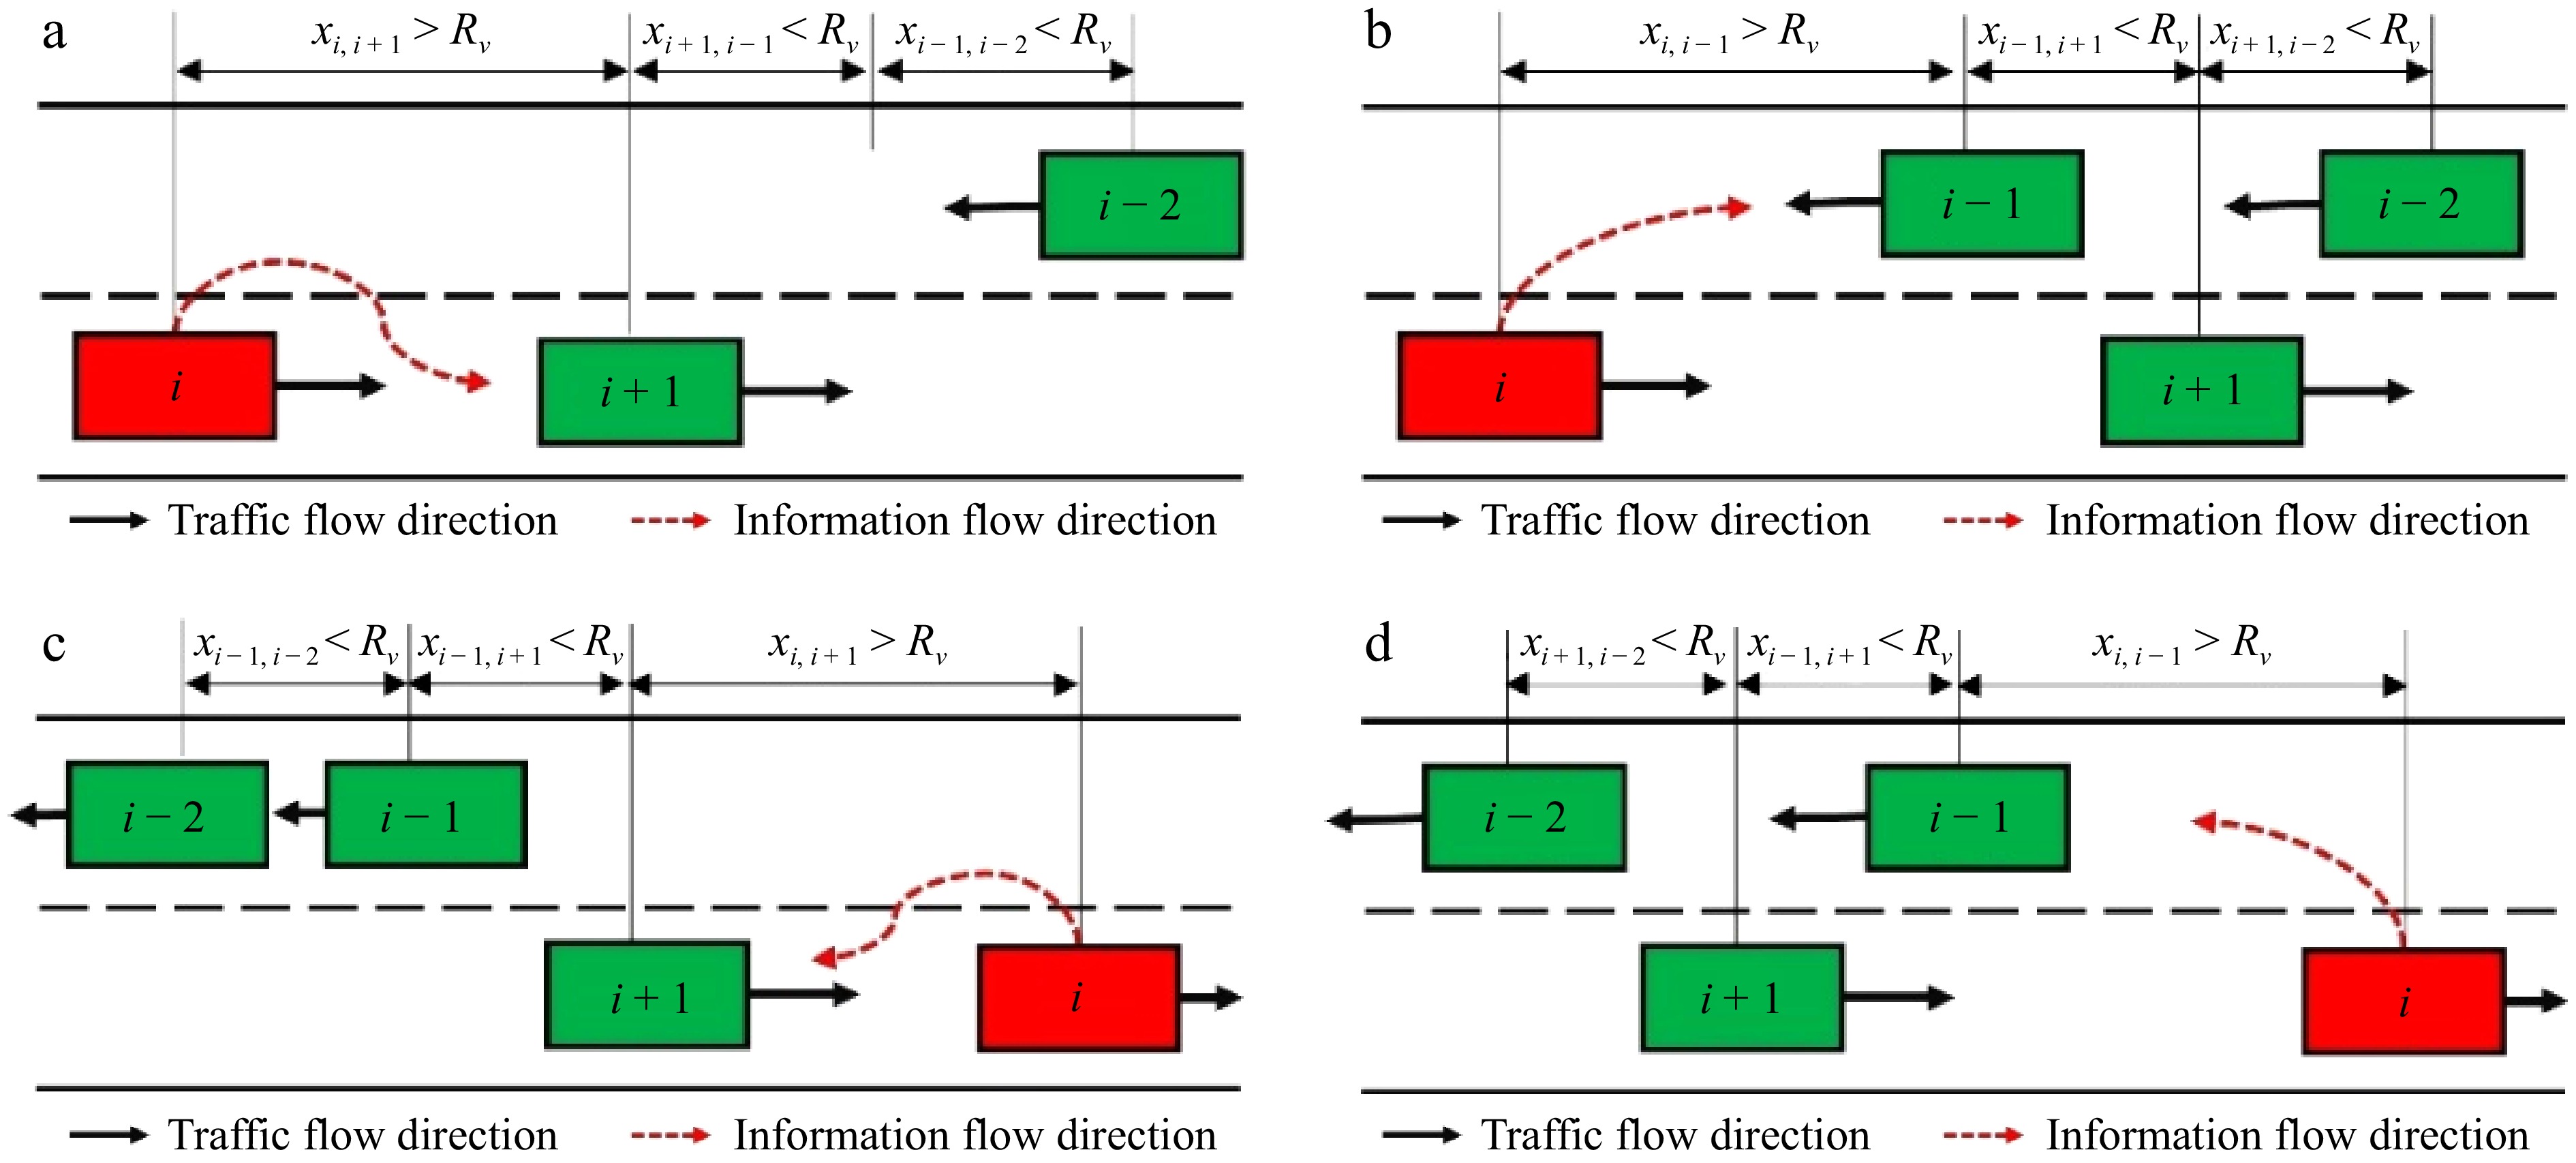
Figure 3.
Four modes of relay transmission. (a) The first type, (b) the second type, (c) the third type, and (d) the fourth type of ferry transportation.
-
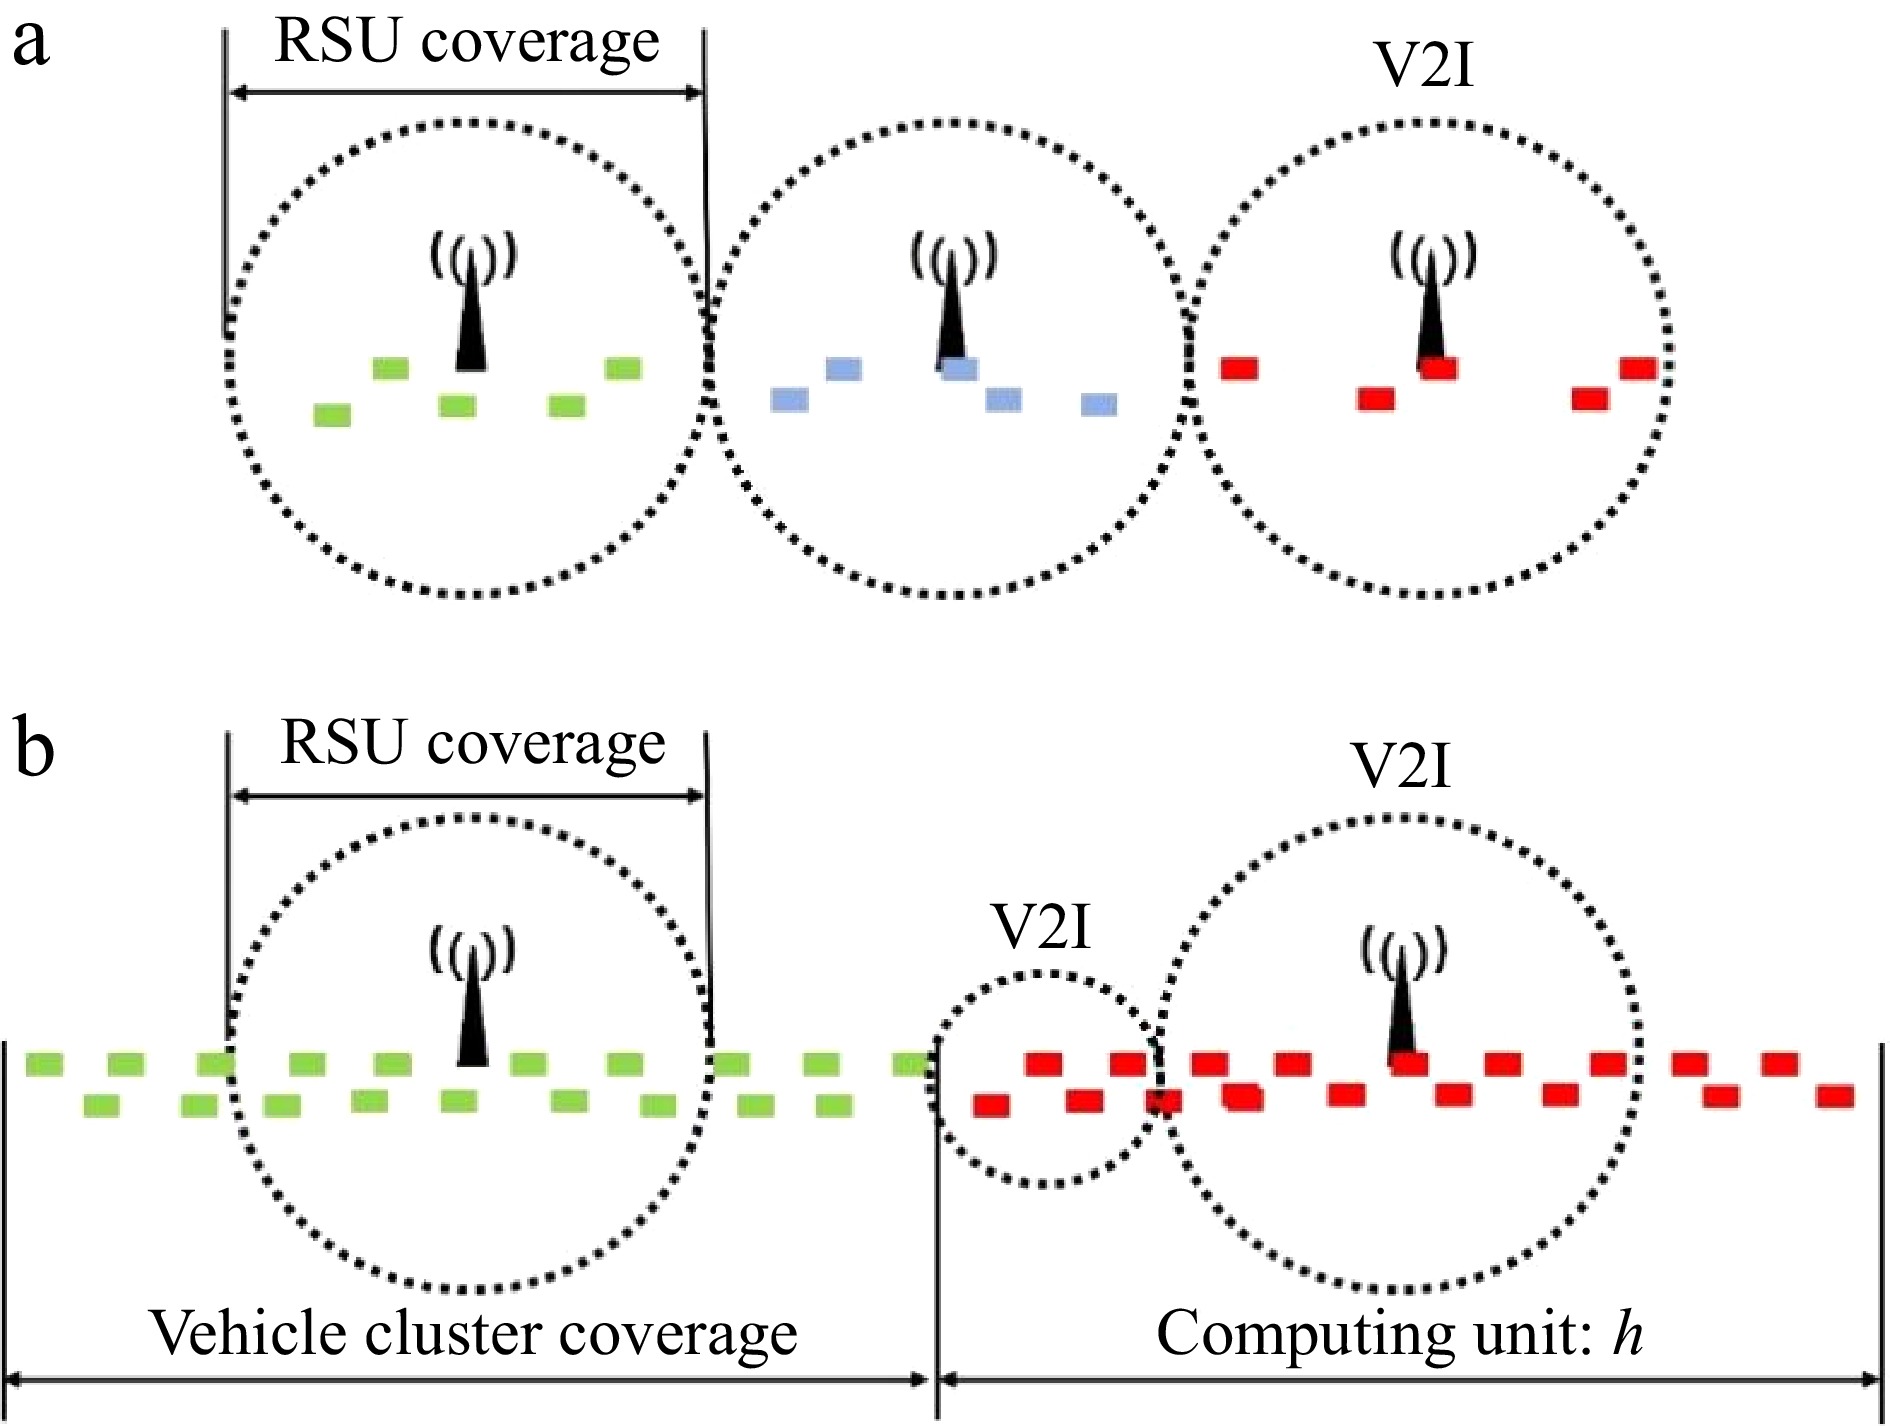
Figure 4.
RSU calculation unit. (a) E(C) < 2R, (b) E(C) > 2R.
-
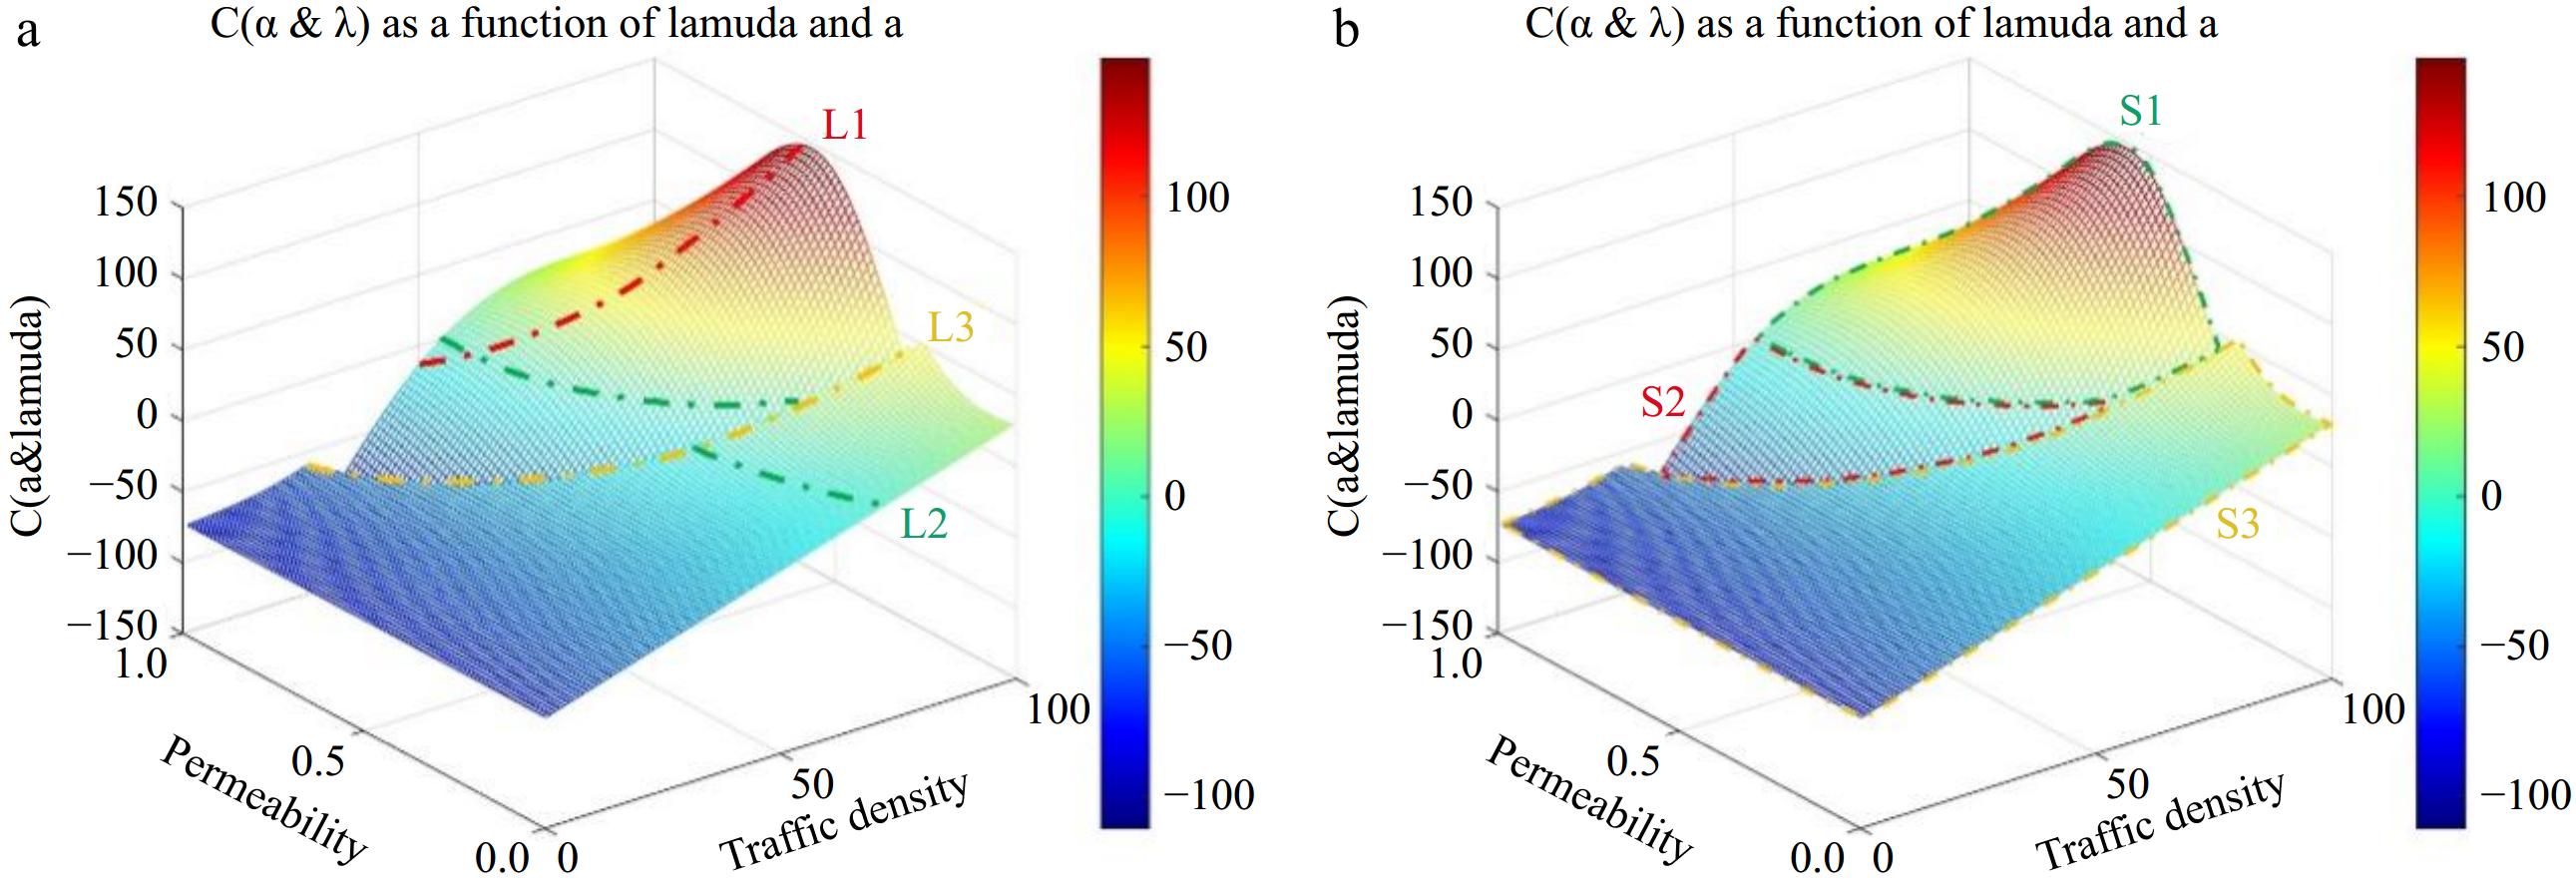
Figure 5.
3D surface diagram of the Max-Perm model.
-
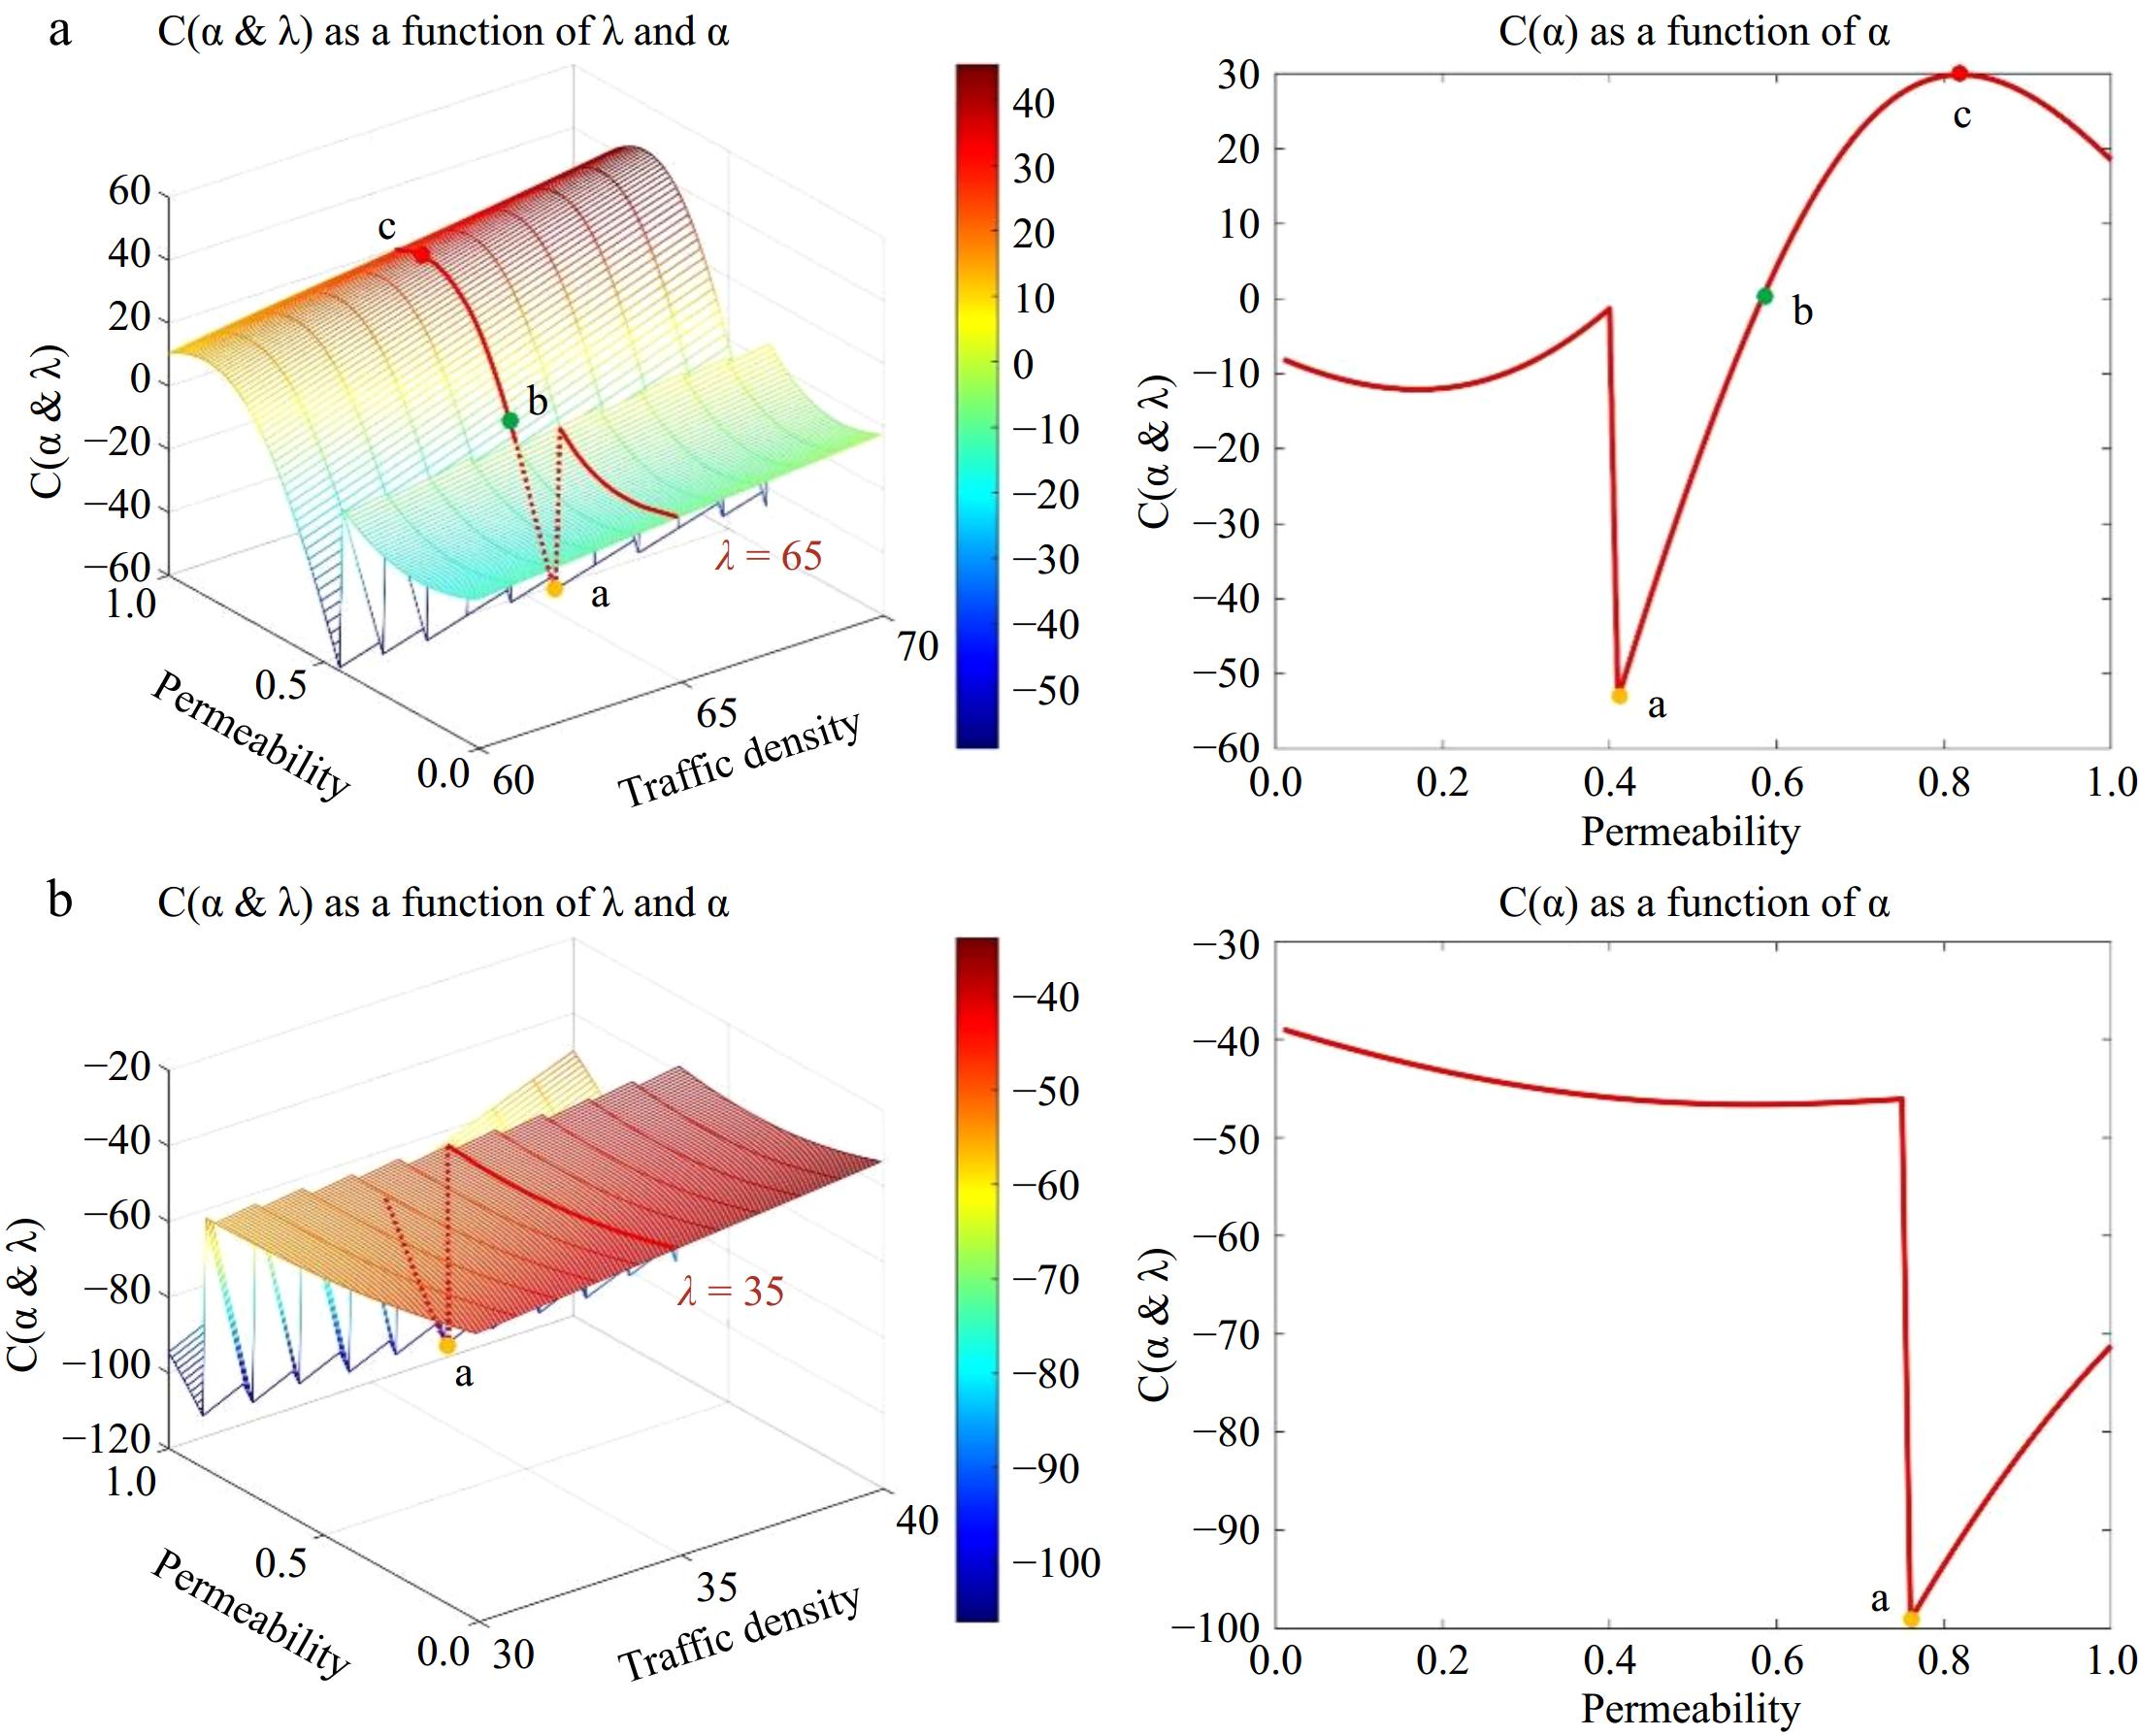
Figure 6.
Variation of slices for high and low density models.
-
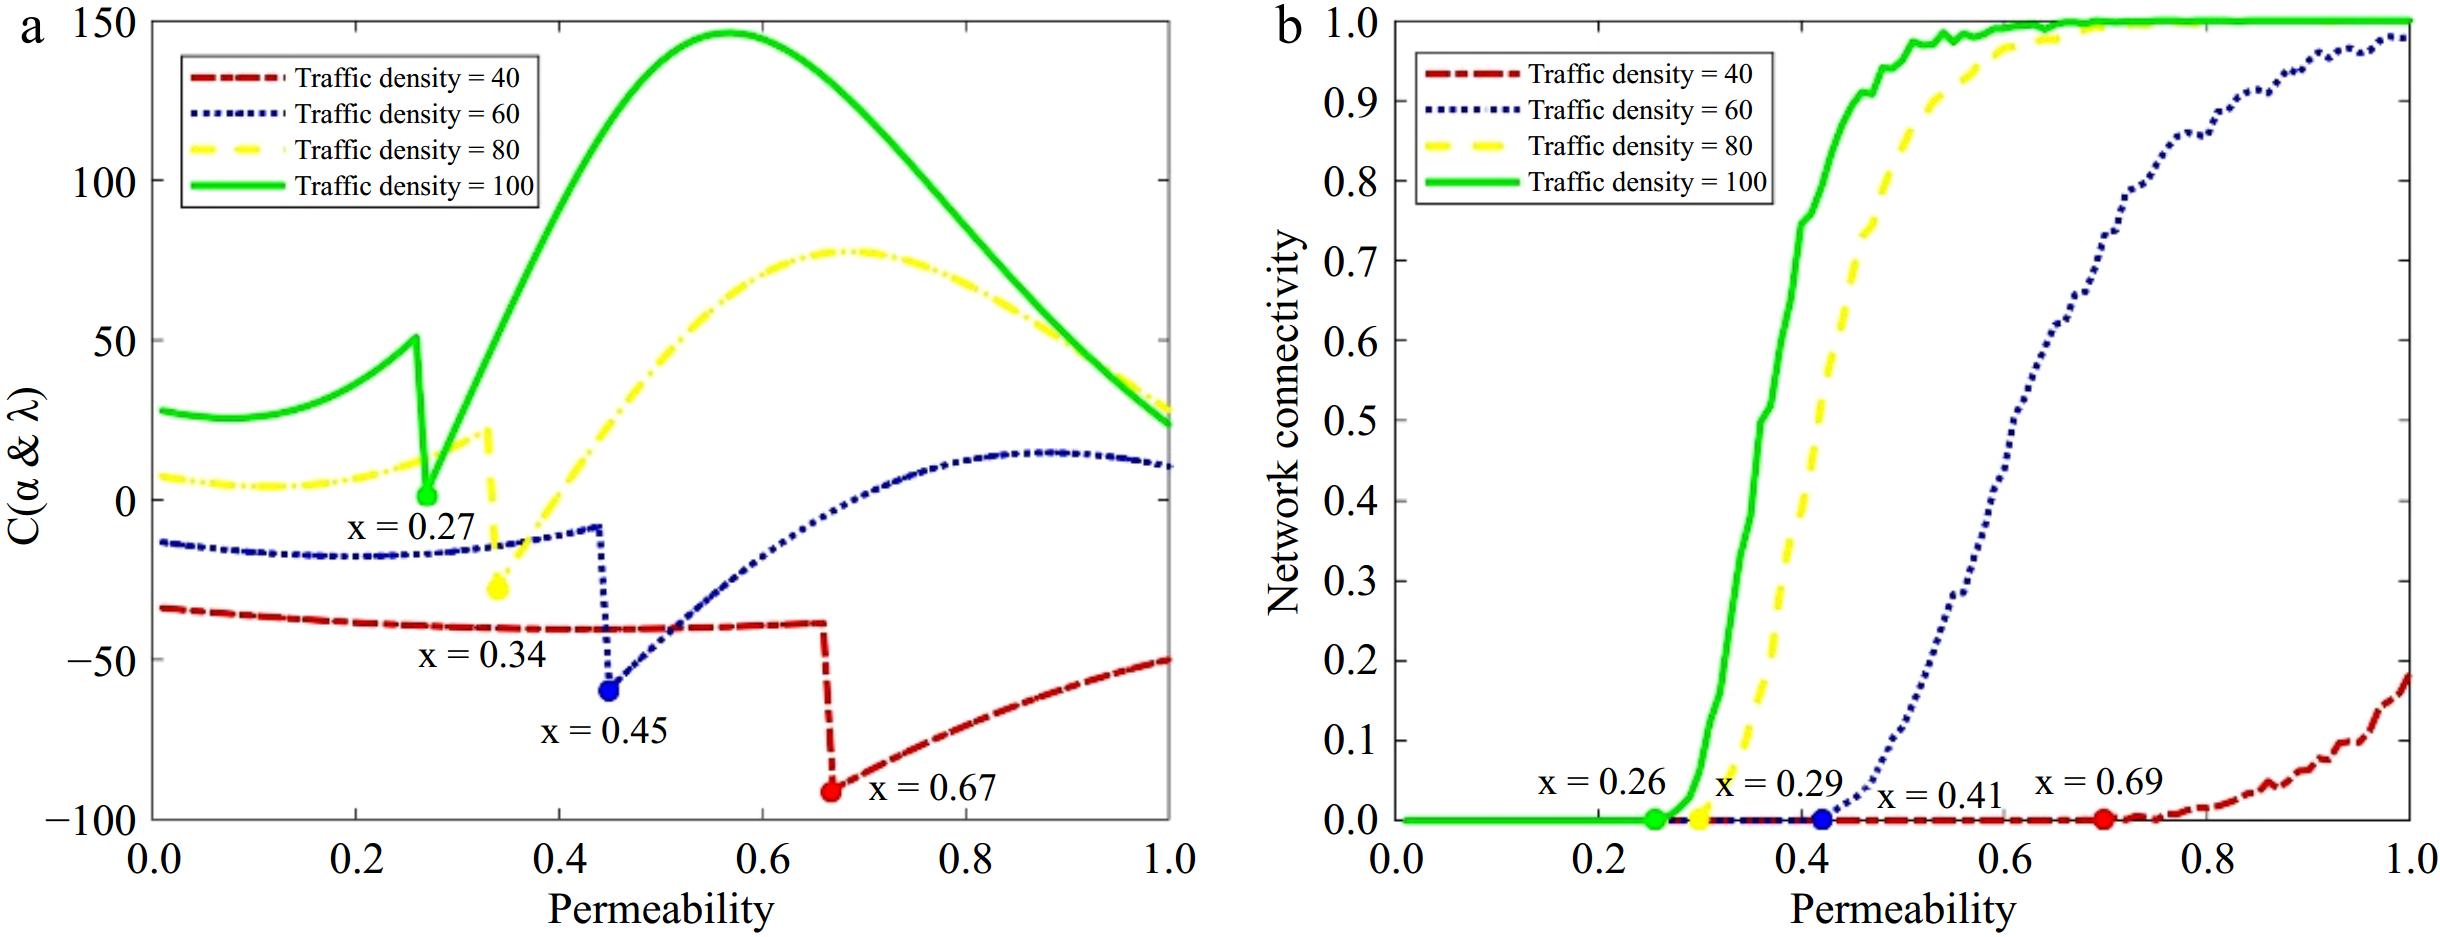
Figure 7.
Positive benefit simulation verification.
-
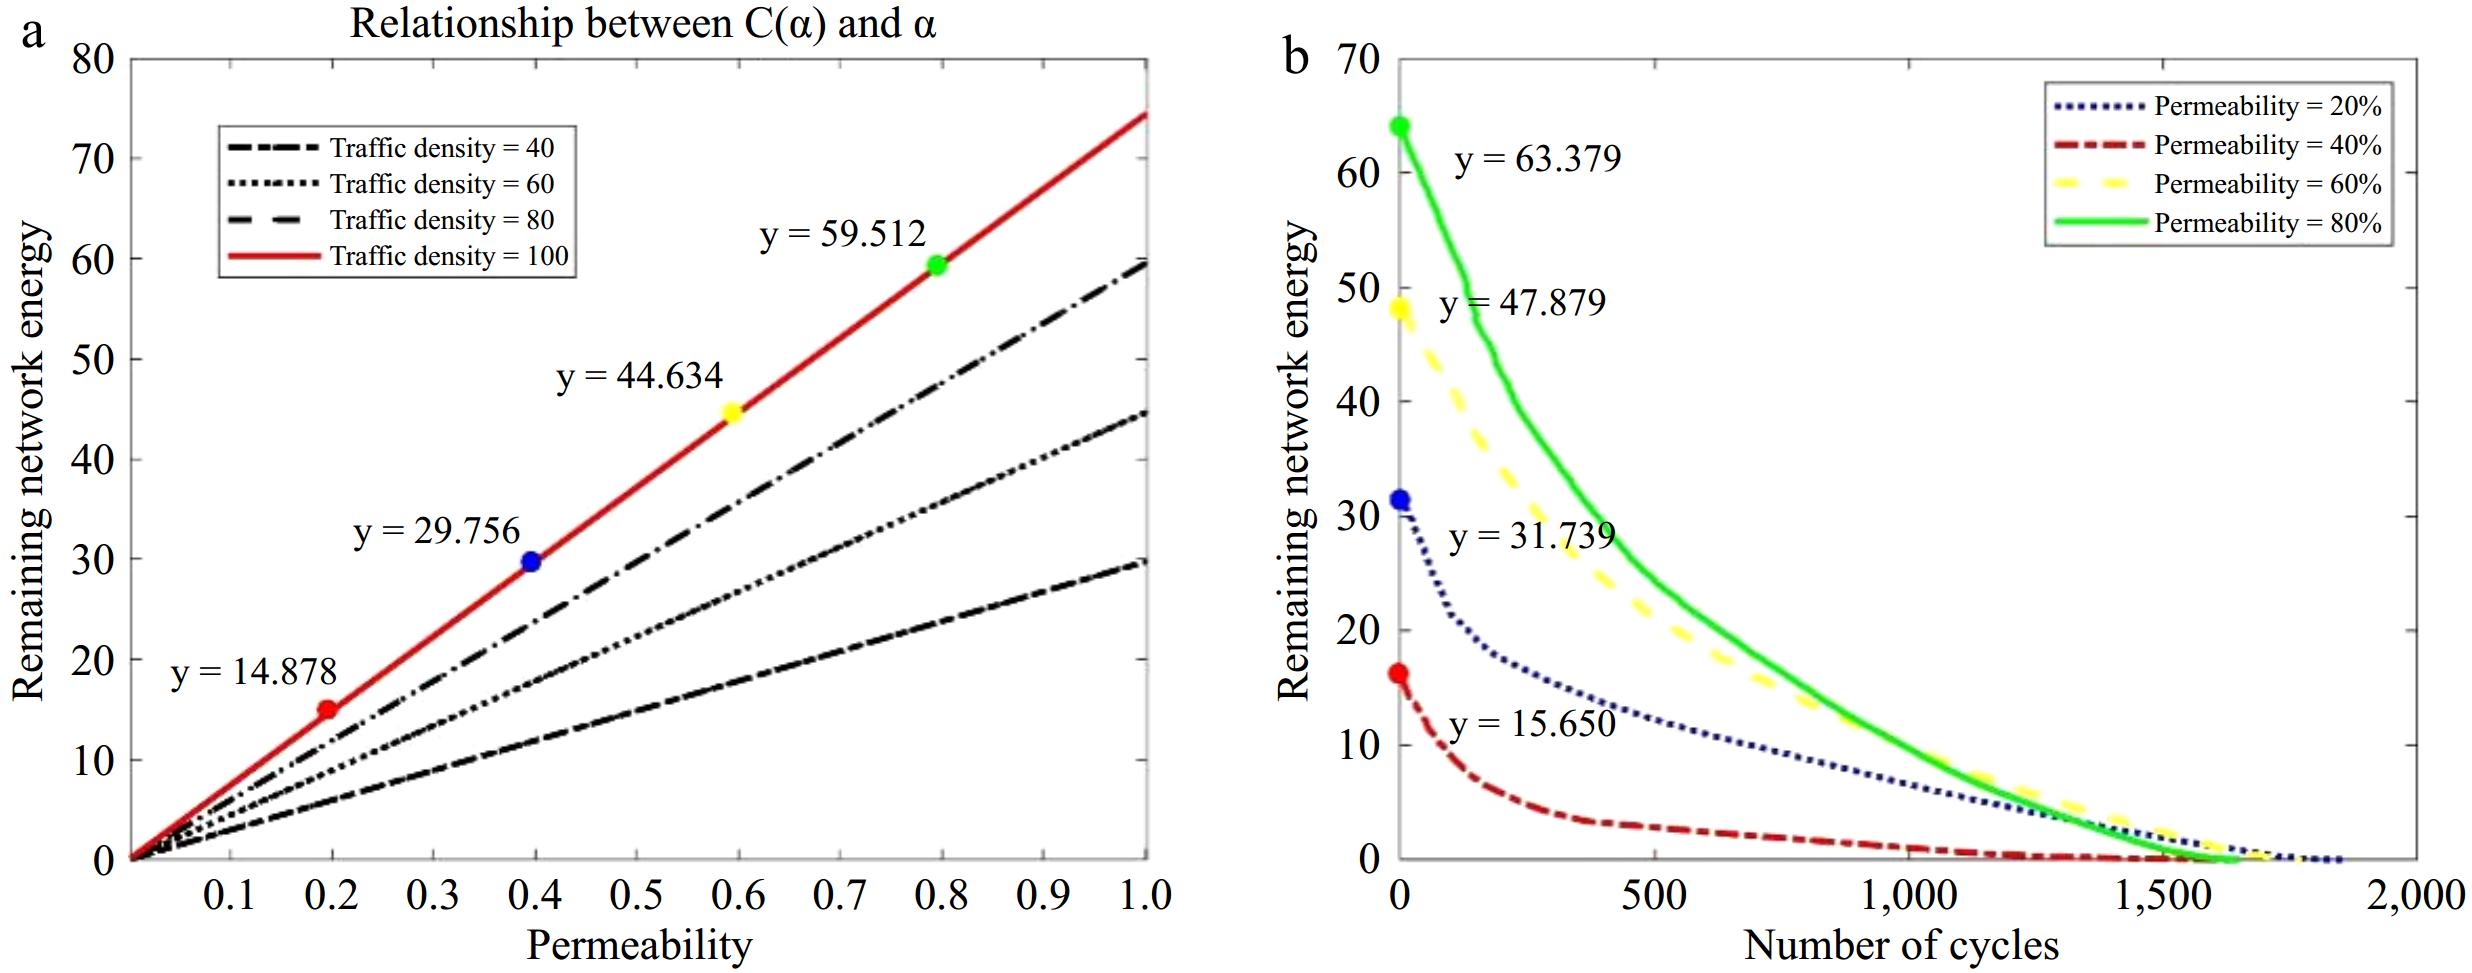
Figure 8.
Information transmission loss simulation verification.
-
Parameter symbol Value Illustrate R 200 m Communication range of RSUs n 80 Number of vehicles on the road ${\tau _a}$ 0.36 s Instantaneous transmission time $\tau $ 60 s Information lifecycle $\,{\beta _n}$ 0.33 The proportion of three transmission classes k1[17] 1.2 × 10⁻⁵ Receiving time influencing factor k2[17] 0.031 Competitive channel time impact factor Eele[28] 3.36 μj/bit Non transmitting equipment consumes energy Erx[28] 11.13 μj/bit Energy required to receive information ${\eta _{amp}}$ 0.2 Emitter magnification r[29] 2 Path attenuation factor ${\alpha _p}$ 16 bit Header length $\rho $ 16 bit Effective load length $\beta $ 10−1.882 Hardware constant ${n_{bit}}$ 640 bit Transmission data length $\gamma $ 5 RSU cost $\eta $ 25 Network cost Table 1.
Parameter settings.
-
Initialization R0 = 50 R0 = 100 R0 = 150 R0 = 200 Iteration 1 r1 = 50; l1 = 5000 r1 = 100; l1 = 5000 r1 = 150; l1 = 5000 r1 = 200; l1 = 5000 Iteration 2 − − r1 = 205.5; l1 = 5.7206e-05 r1 = 205.5; l1 = 5.7206e-05 Iteration 3 − − r1 = 63.8478; l1 = 5.7206e-05 r1 = 63.8478; l1 = 5.7206e-05 Iteration 4 − − r1 = 63.8478; l1 = 5.7206e-05 r1 = 63.8478; l1 = 5.7206e-05 Table 2.
Iterative output values of the two-level planning model.
-
Traffic density Model value Simulation value Accuracy 20 0.27 0.26 92.451% 40 0.34 0.29 60 0.45 0.41 80 0.67 0.69 Table 3.
Validation of positive coverage gains.
-
Permeability Model value Simulation value Accuracy 20% 14.878 15.650 93.985% 40% 29.756 31.739 60% 44.634 47.879 80% 59.512 63.379 Table 4.
Information loss verification.
Figures
(8)
Tables
(4)