-
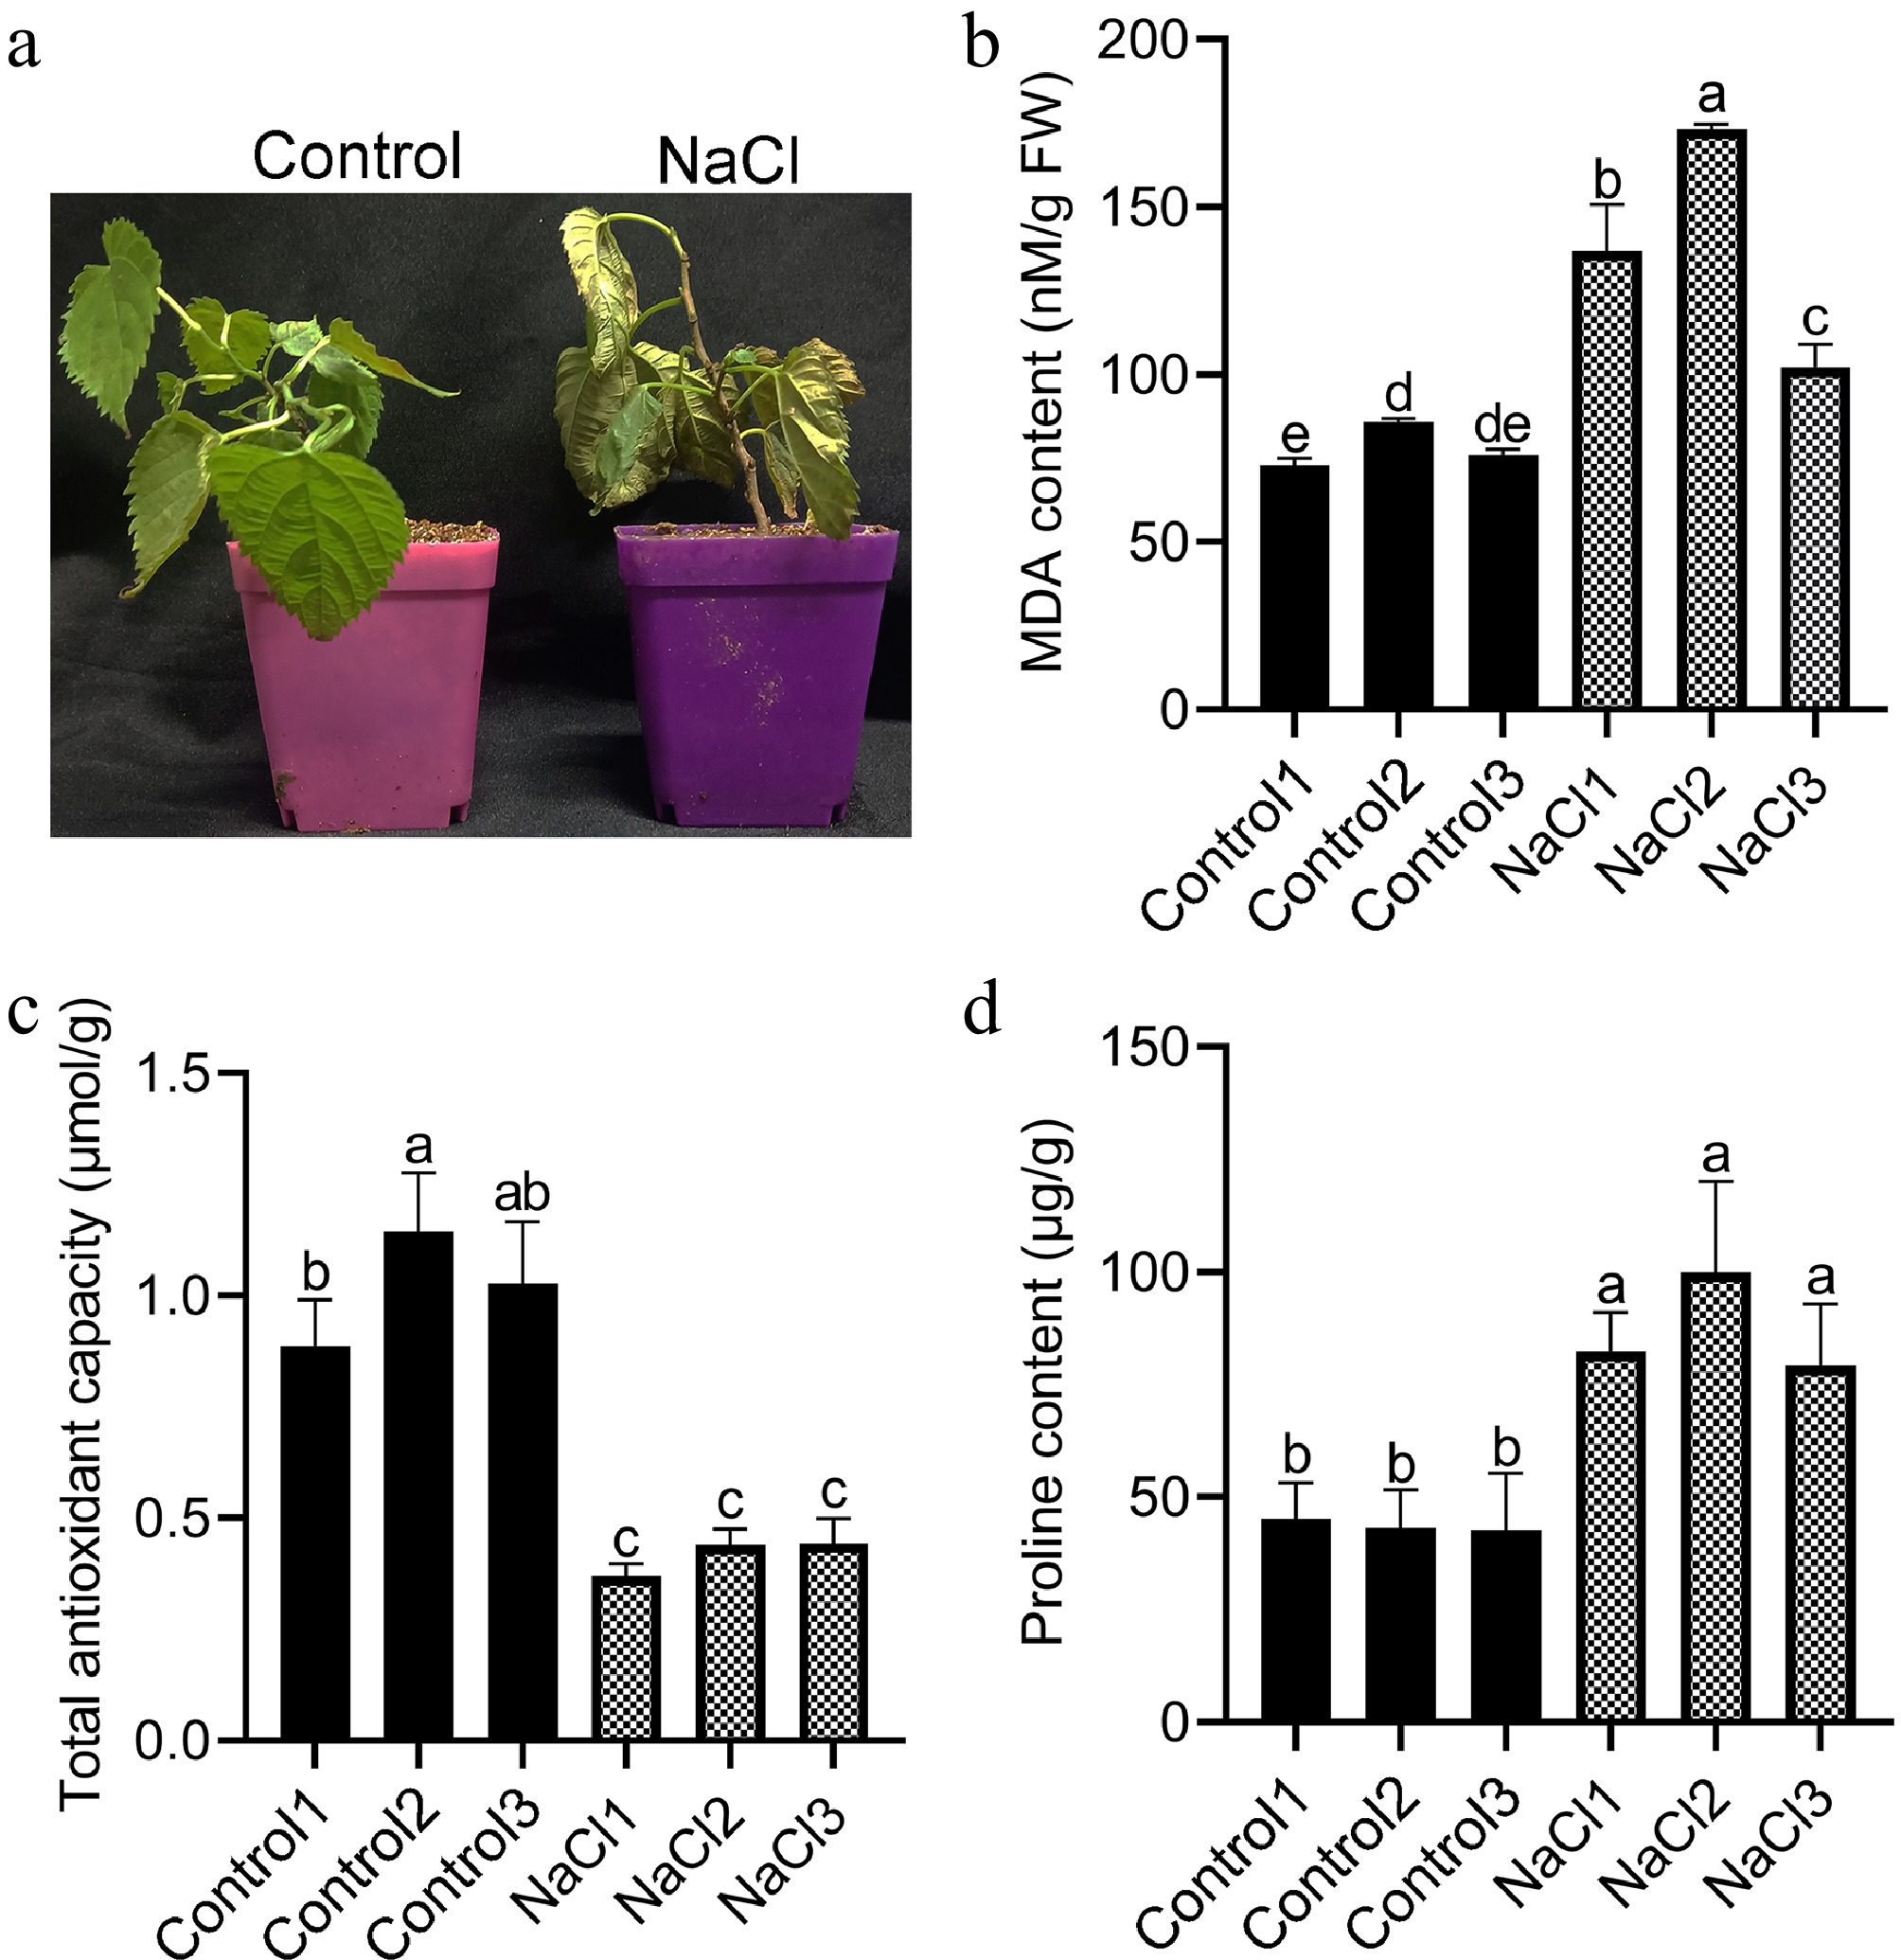
Figure 1.
Phenotype and physiological characteristics of mulberry under control and salt treatment. (a) Phenotypes of mulberry plants under control and salt treatment. (b) MDA content of mulberry roots. (c) Total antioxidant capacity of mulberry roots. (d) Proline content of mulberry roots. Different letters indicated significant differences (p < 0.05).
-
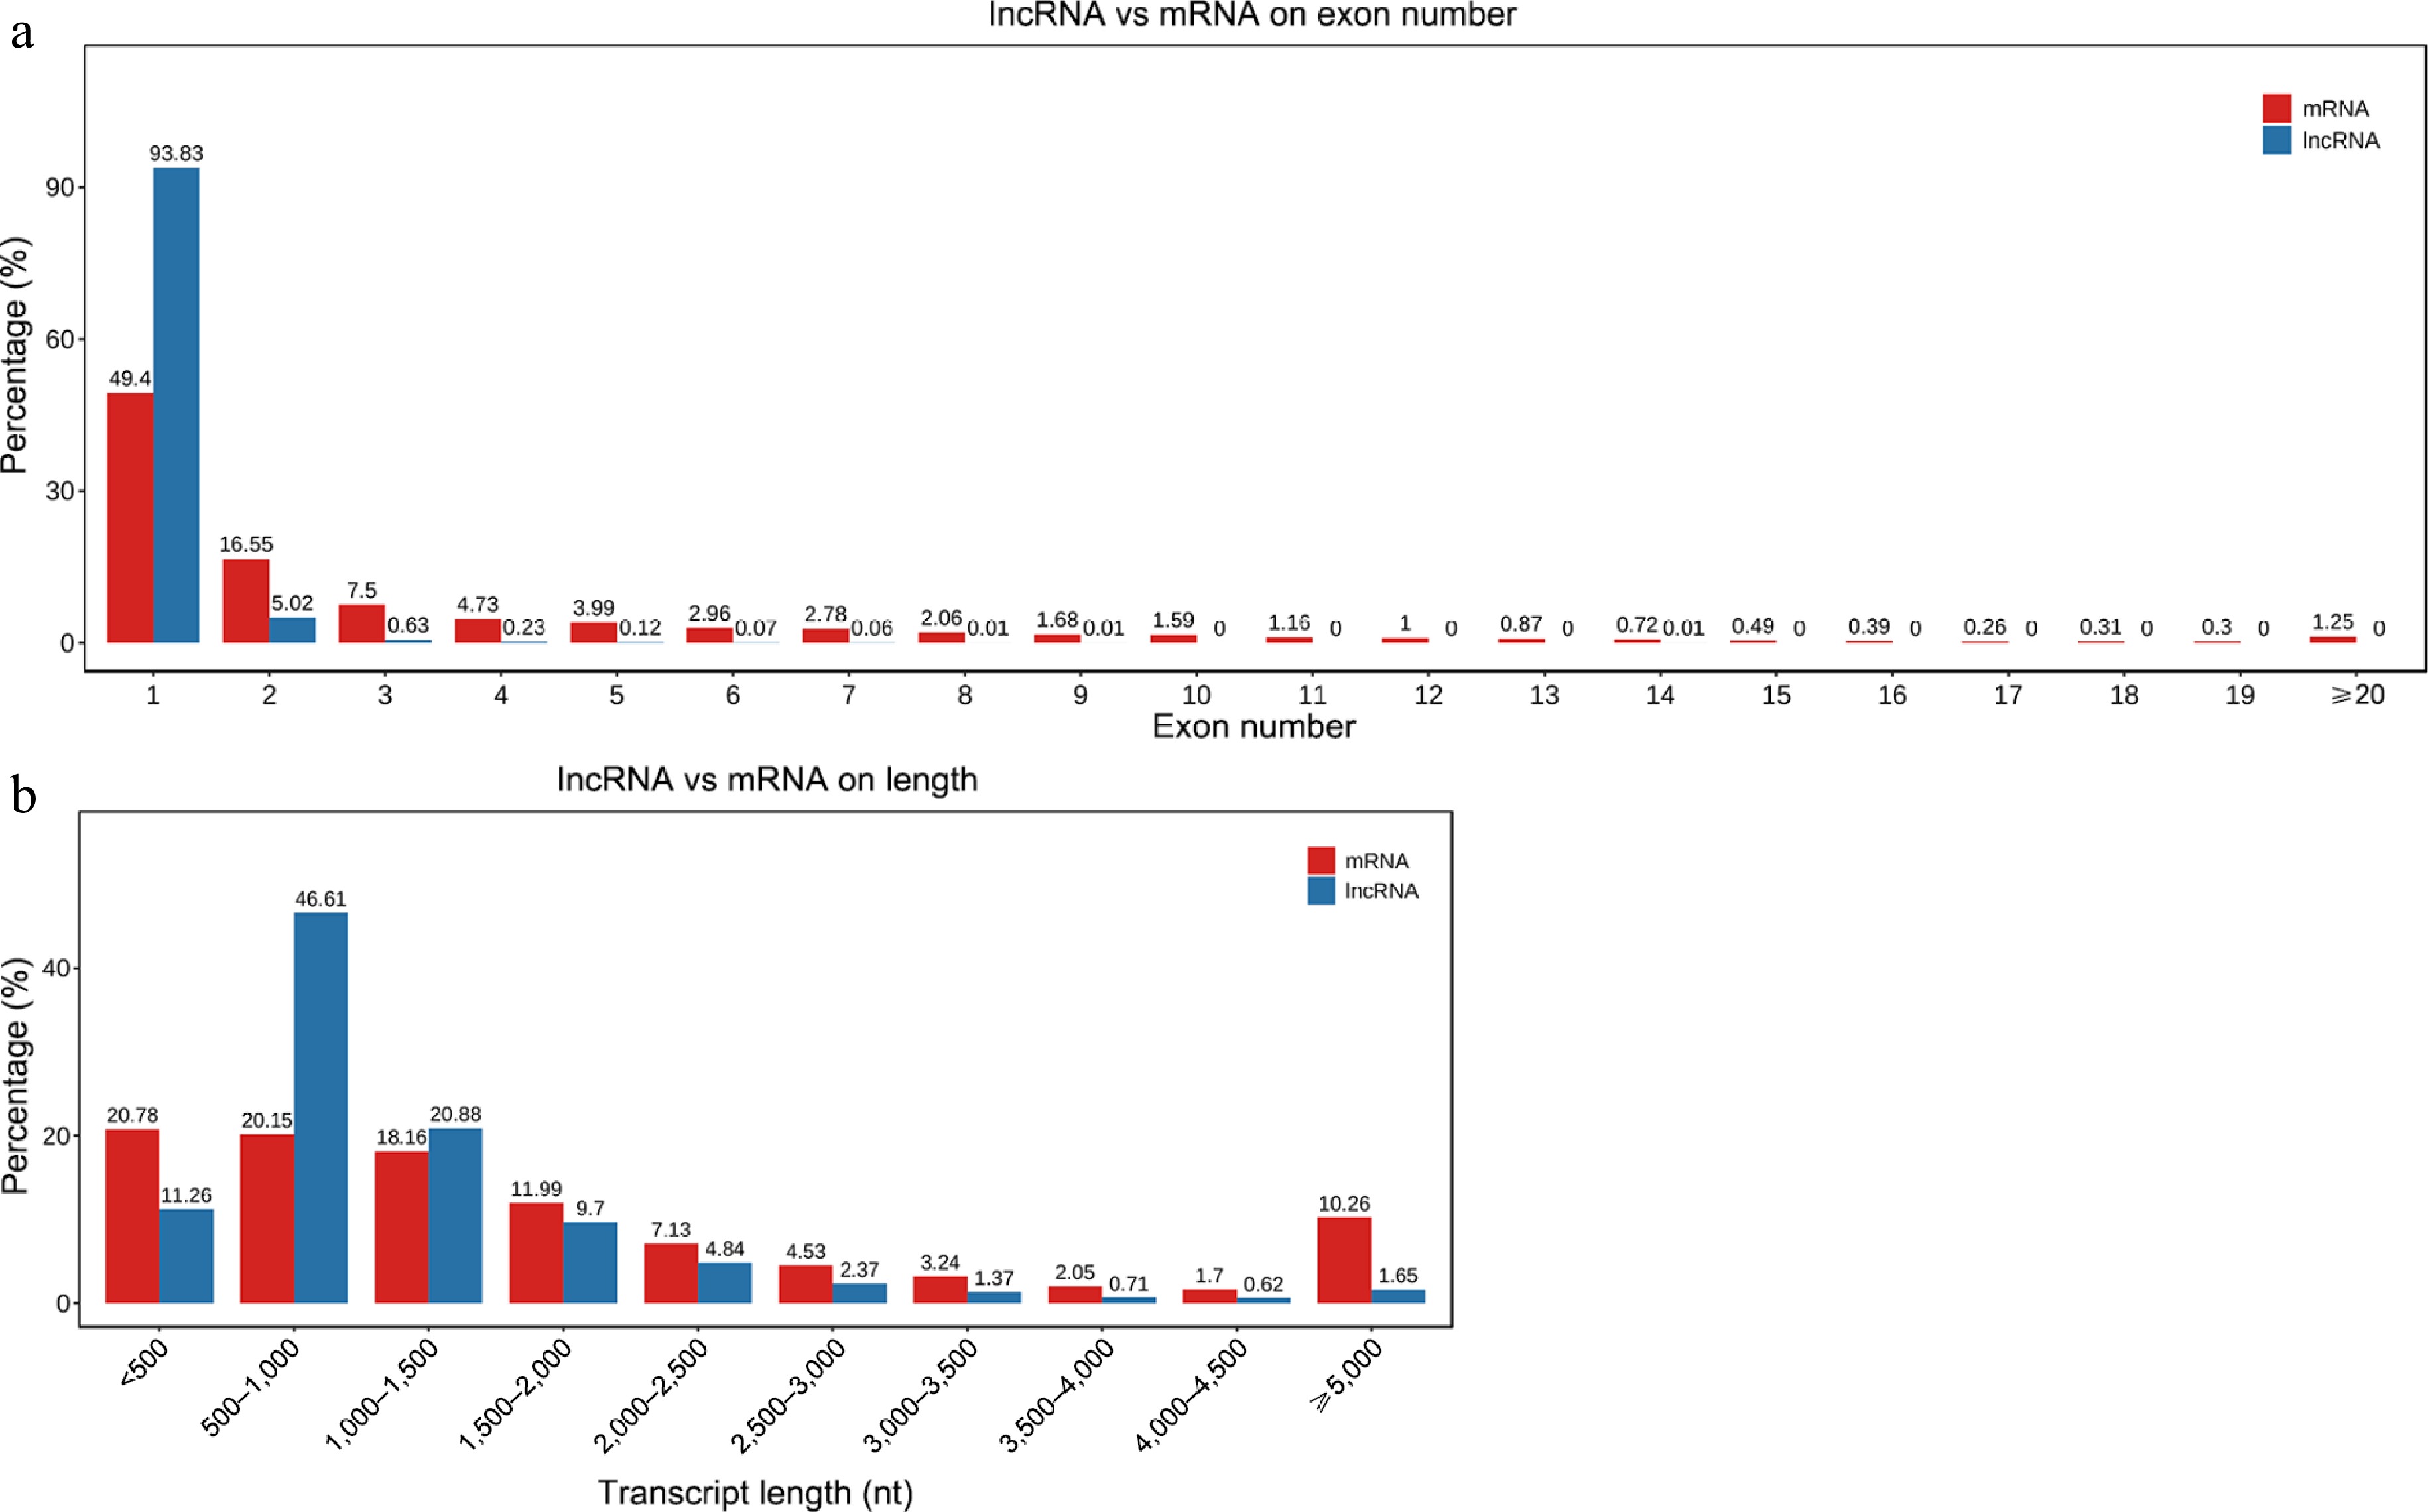
Figure 2.
Comparison of structural characteristics of lncRNAs and mRNAs. (a) Exon distribution in lncRNAs and mRNAs. (b) Length distribution of lncRNAs and mRNAs.
-
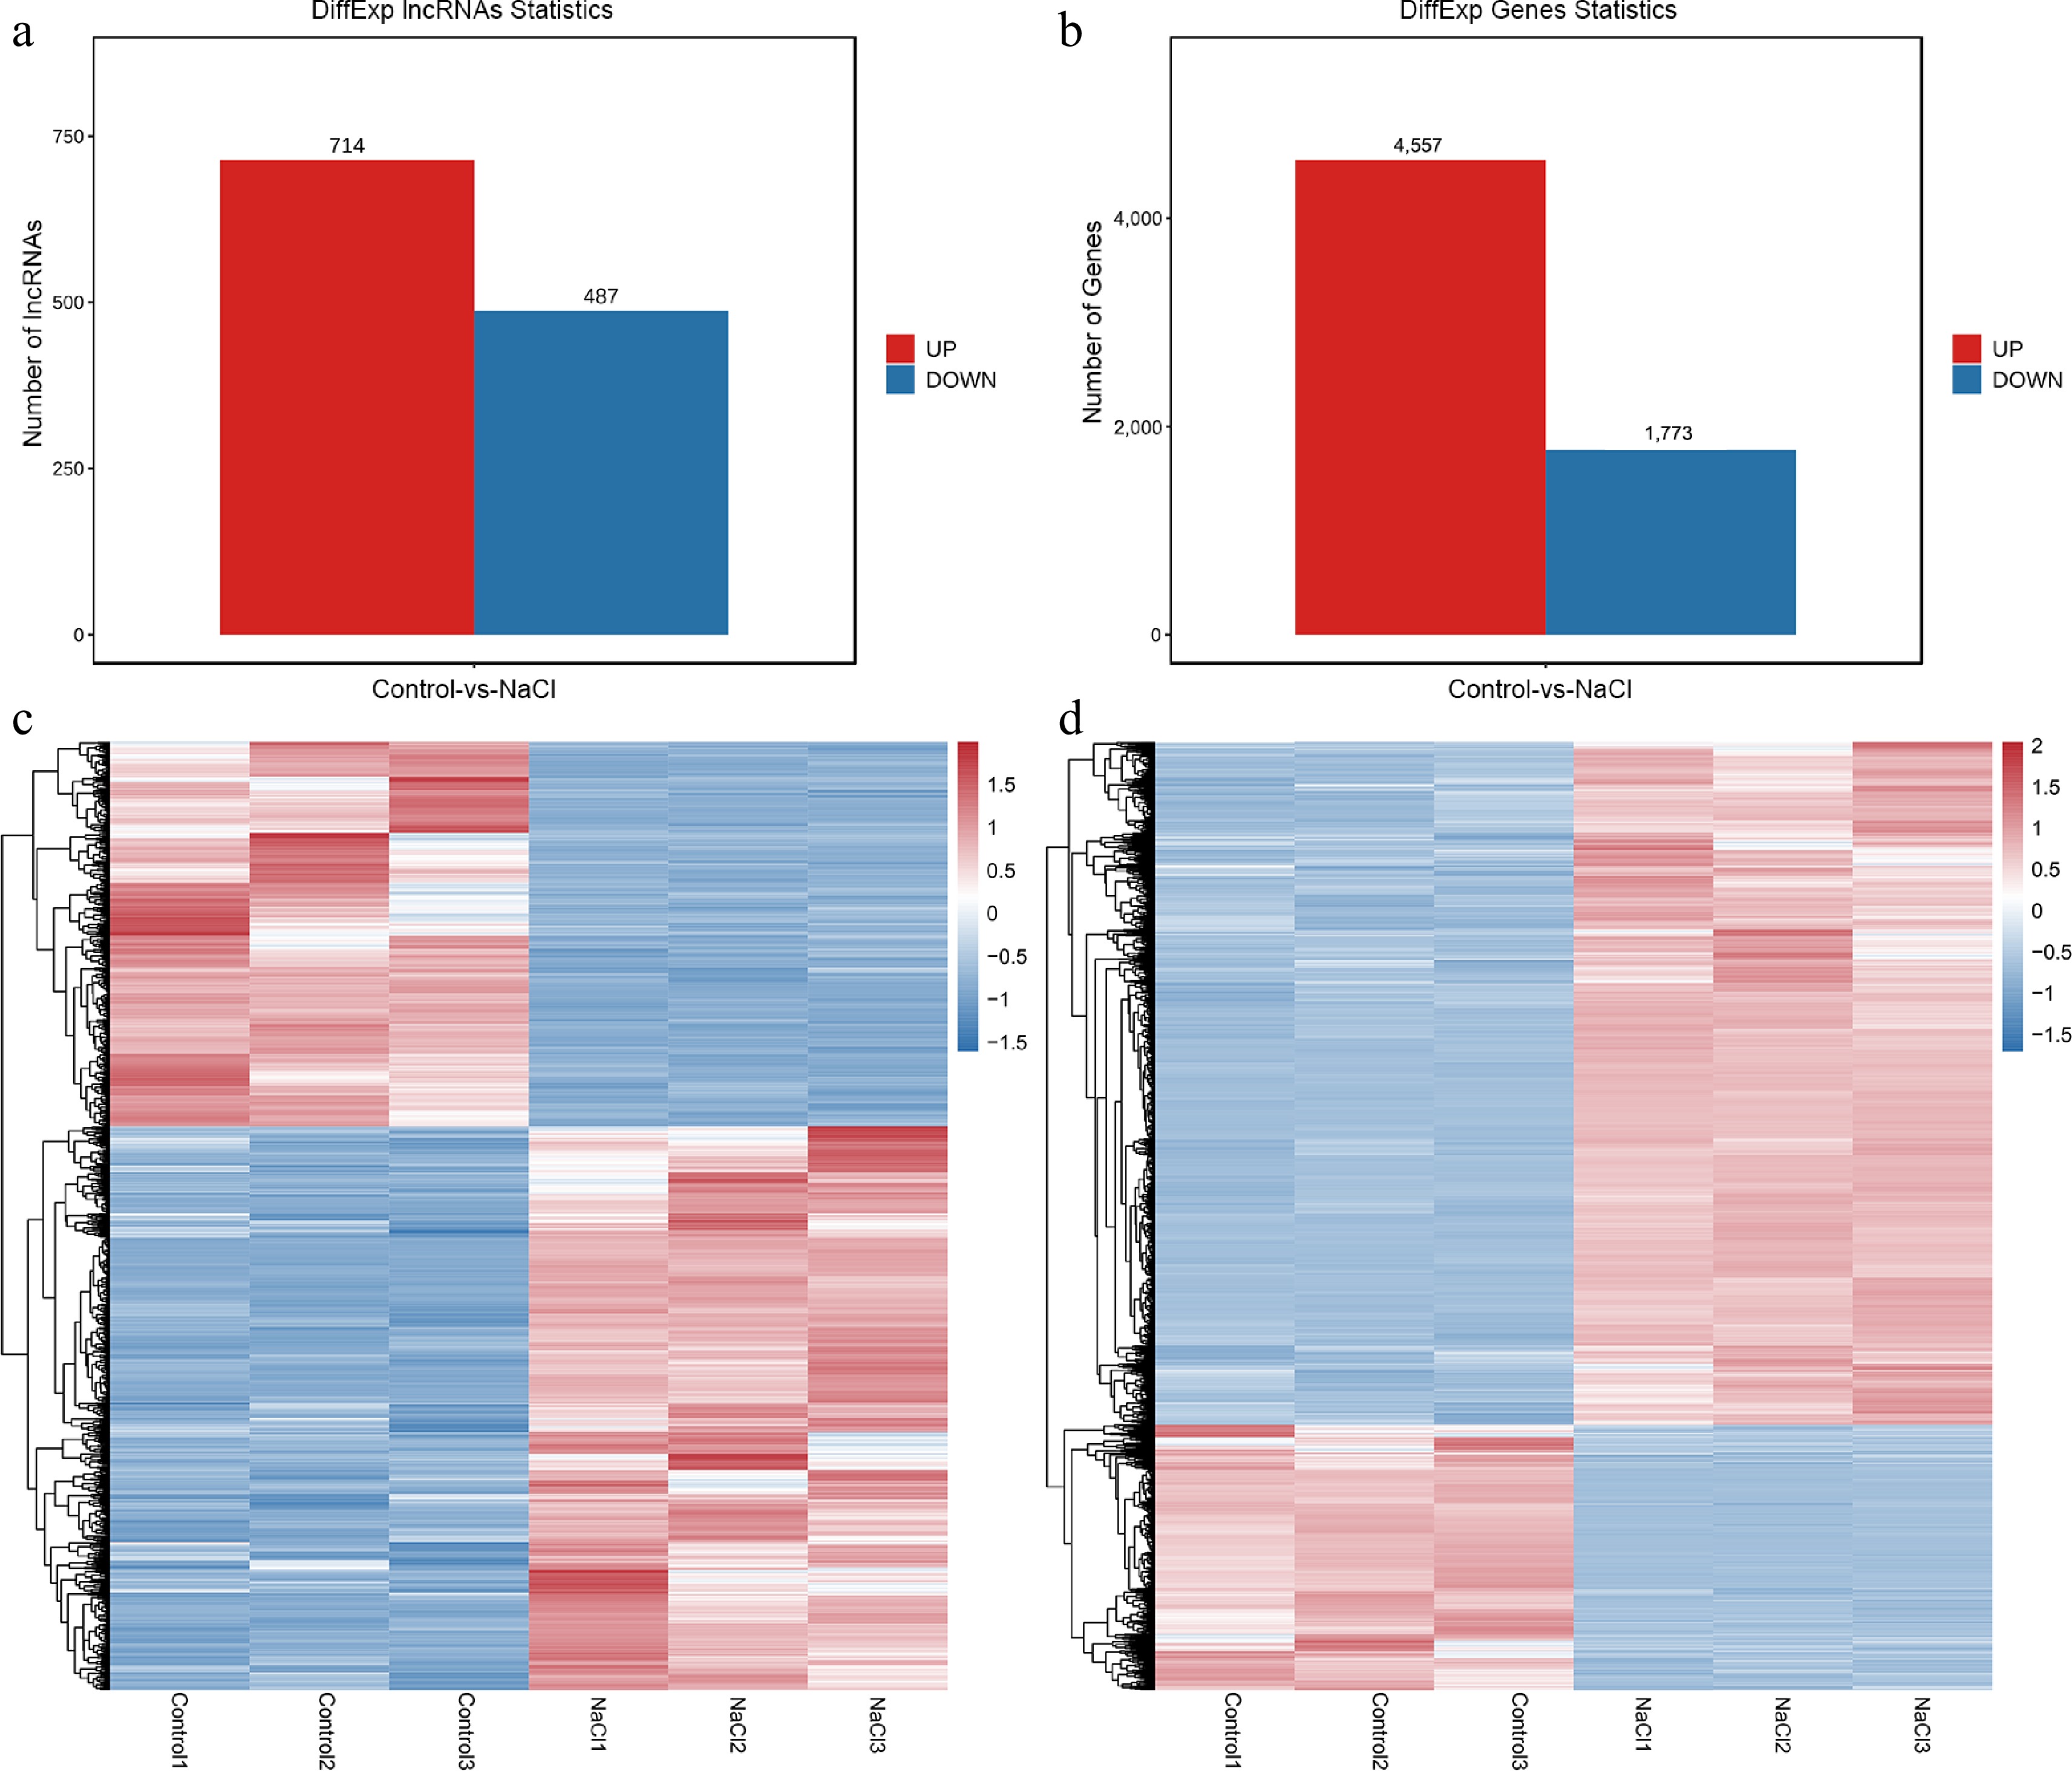
Figure 3.
Overview of DE-lncRNAs and DEGs in mulberry under control and salt treatment. Number of (a) DE-lncRNAs and (b) DEGs. Hierarchical clustering heat maps of all (c) DE-lncRNAs and (d) DEGs.
-
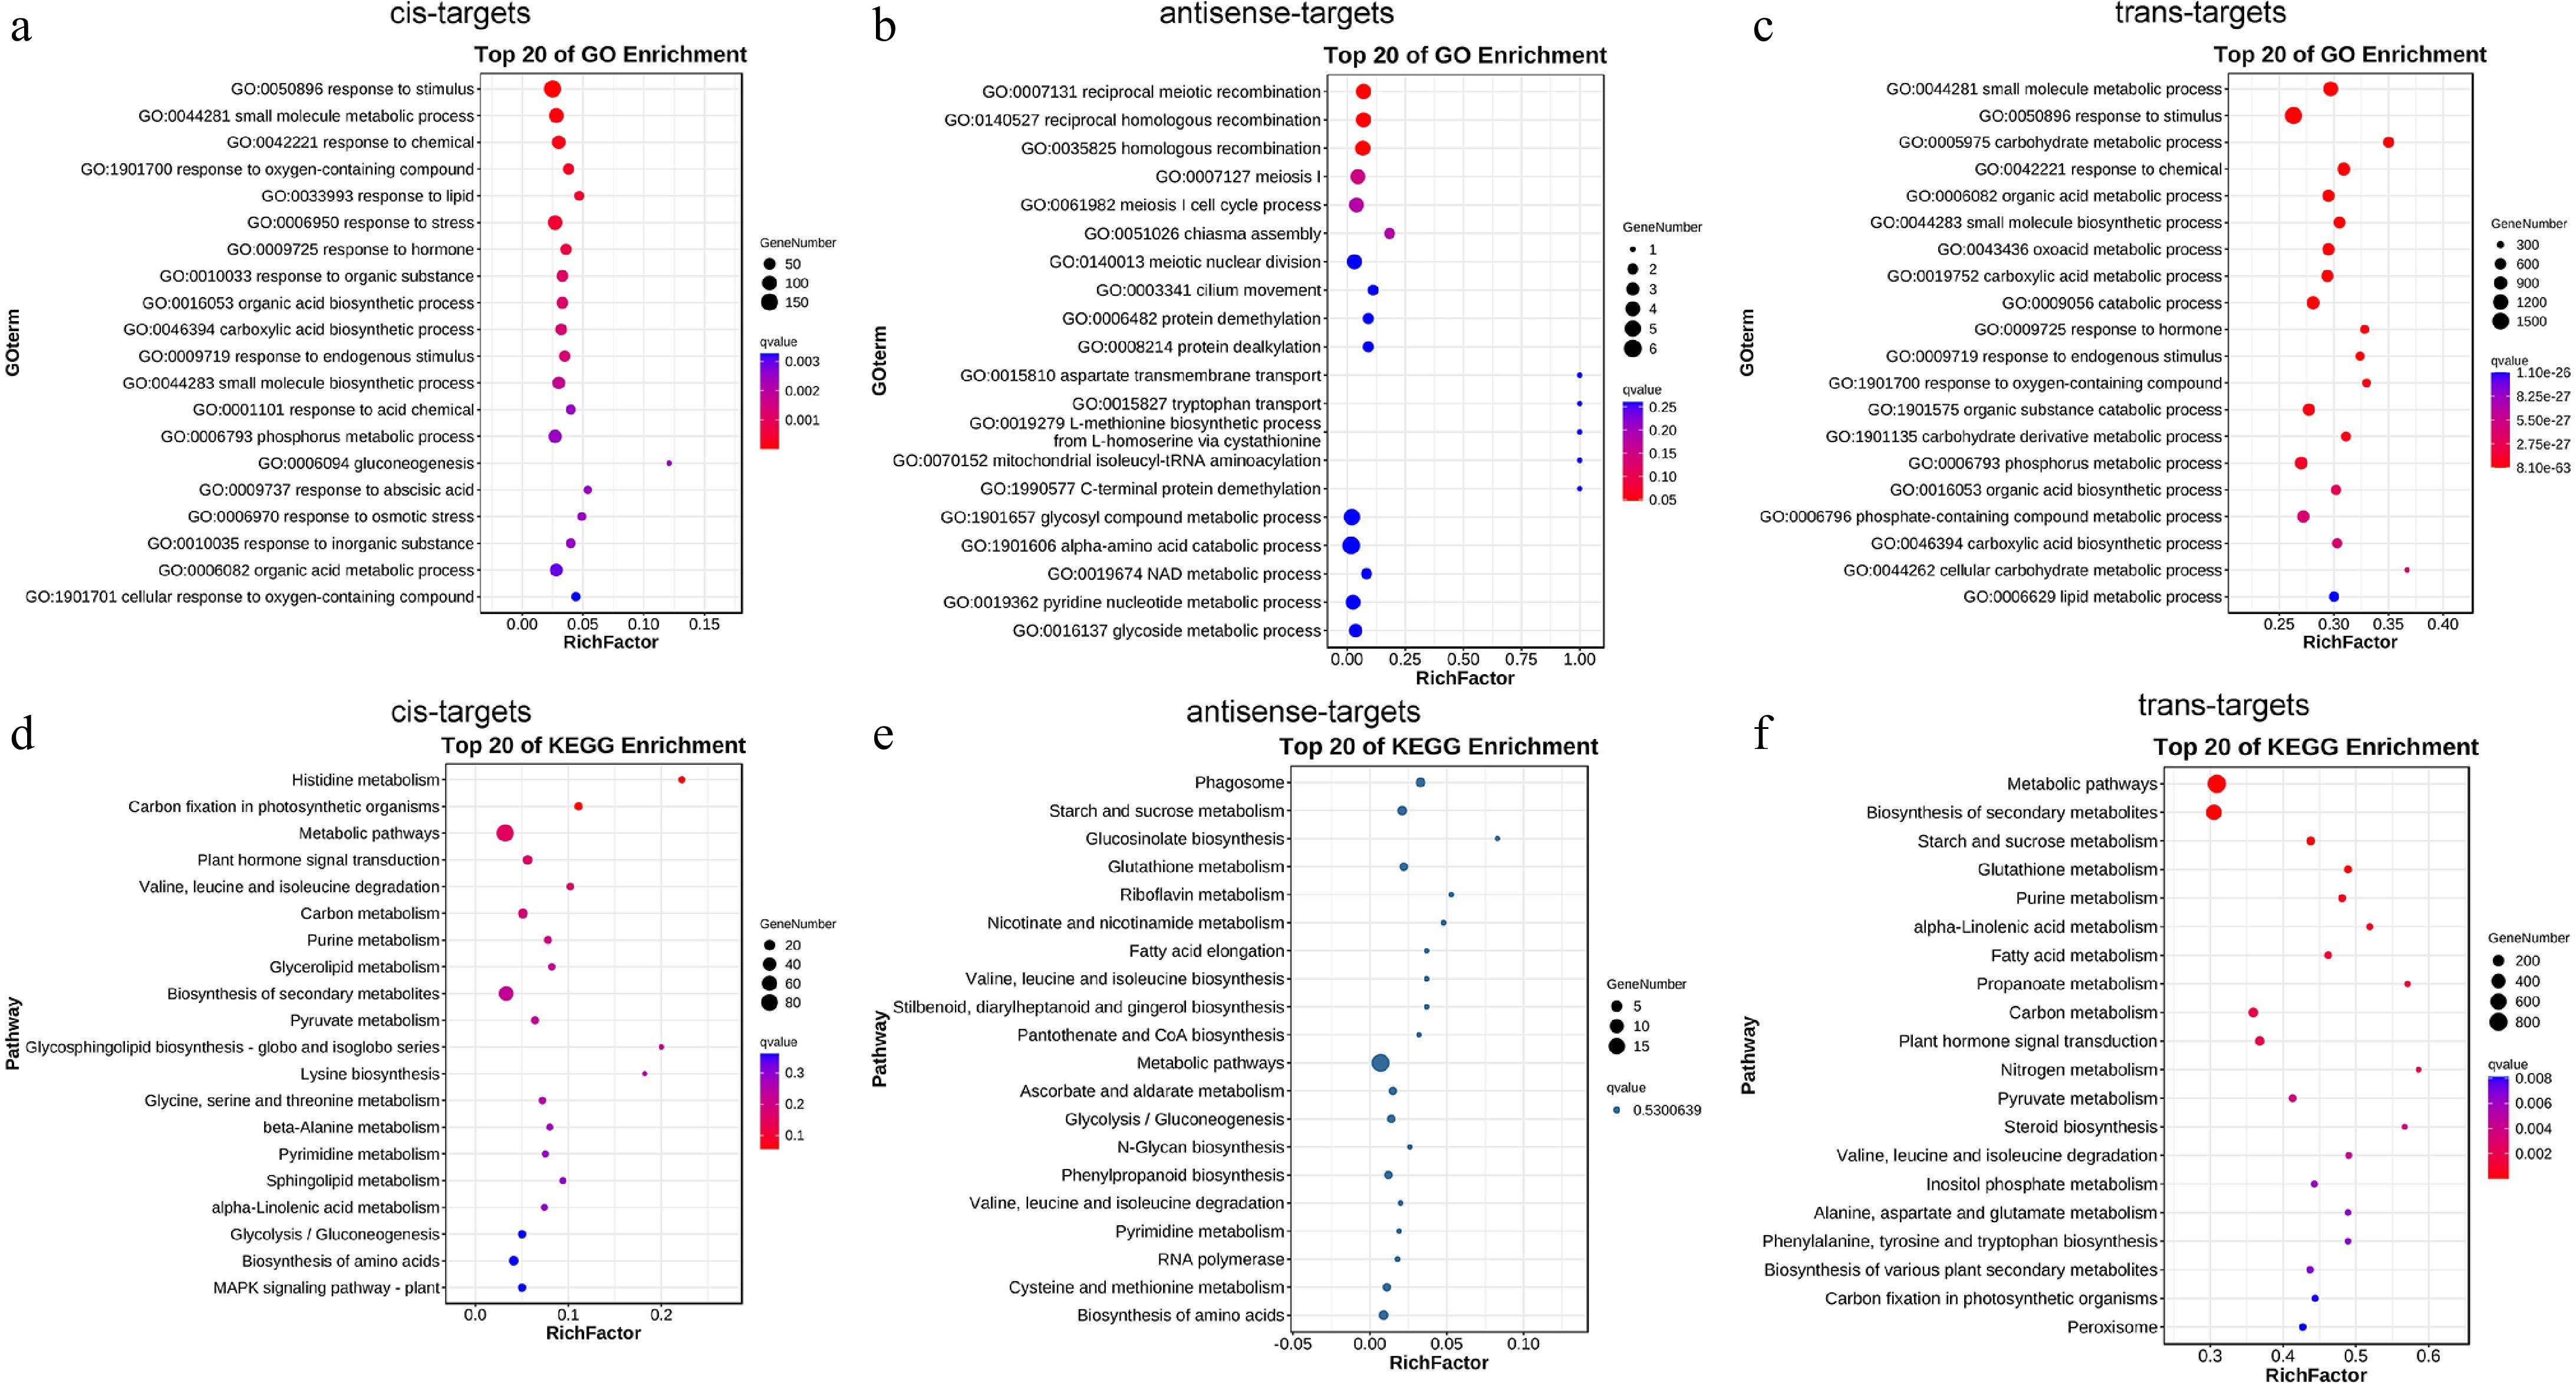
Figure 4.
Functional annotation of DE-lncRNAs target genes in roots by GO classification and KEGG enrichment. The top 20 enriched the GO classification of DE-lncRNAs (a) cis-, (b) antisense-, and (c) trans-target genes. Top 20 enriched KEGG pathways of DE-lncRNAs (d) cis-, (e) antisense-, and (f) trans-target genes.
-
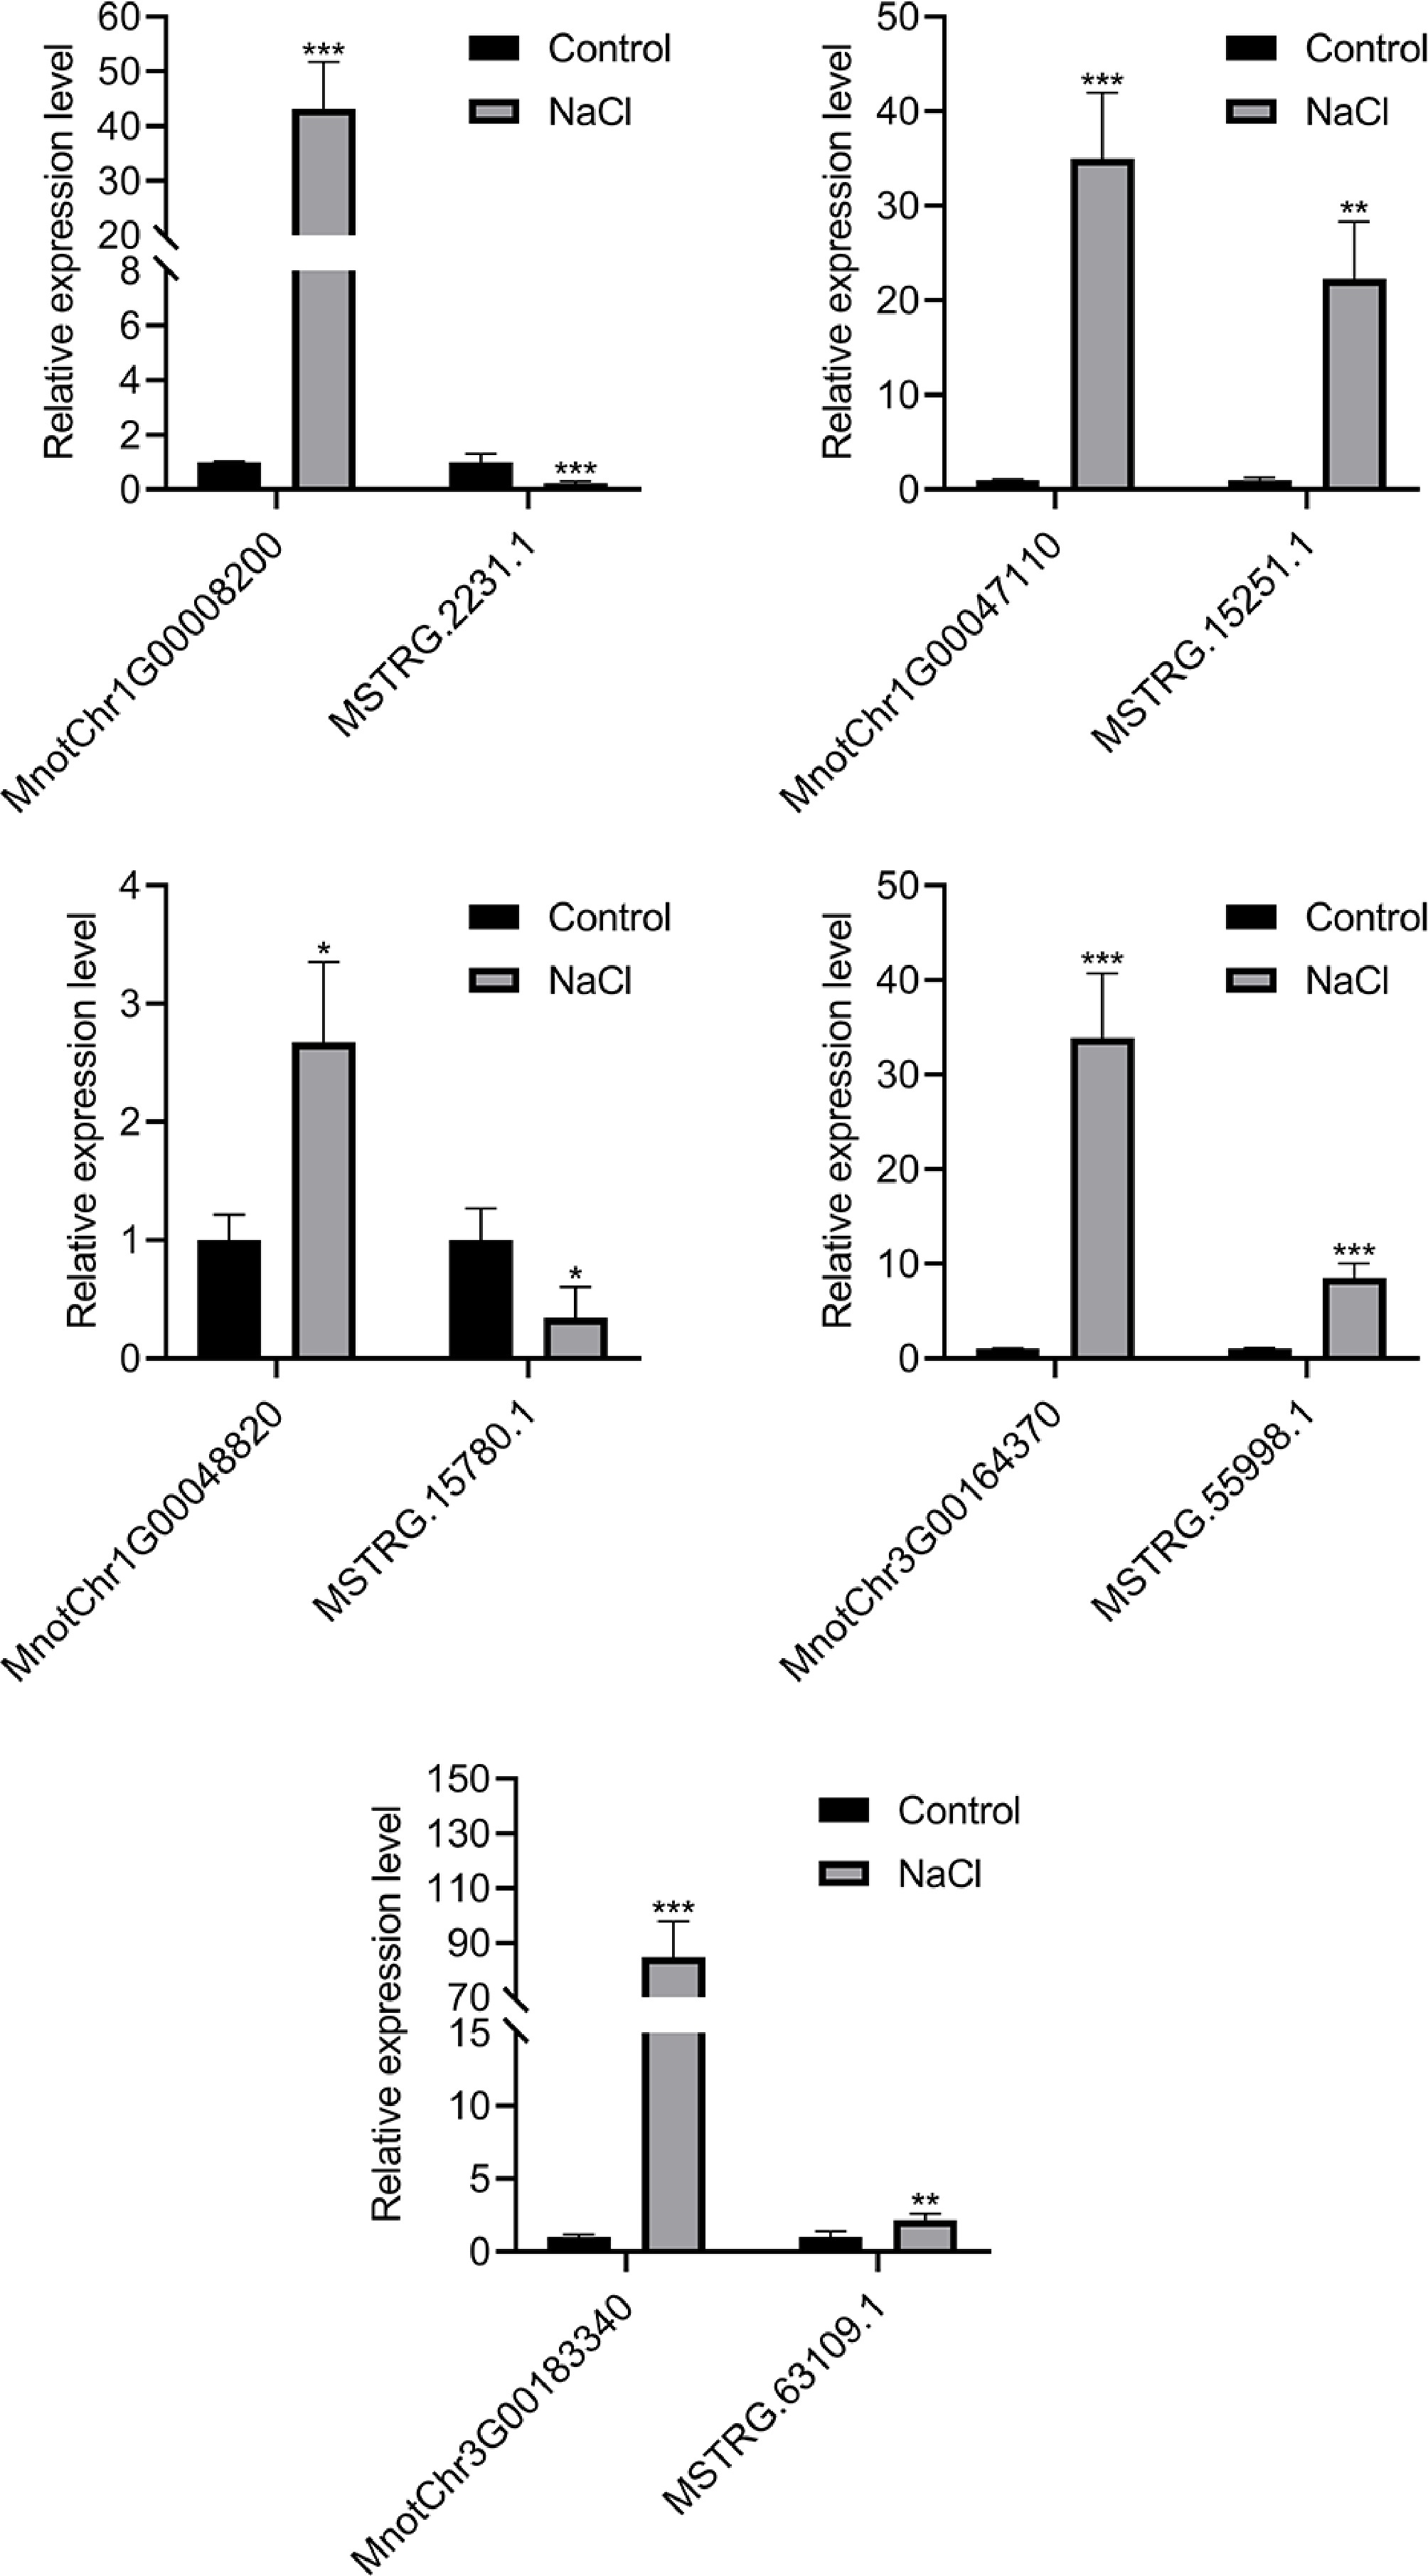
Figure 5.
The relative expression of five pairs of differentially expressed lncRNAs and potential target genes in mulberry roots of control group and salt treatment group. Error bars represent standard deviation, n = 3. The asterisks indicate a statistically significant difference (* p < 0.05; ** p < 0.01; *** p < 0.001; two-tailed t-test).
-
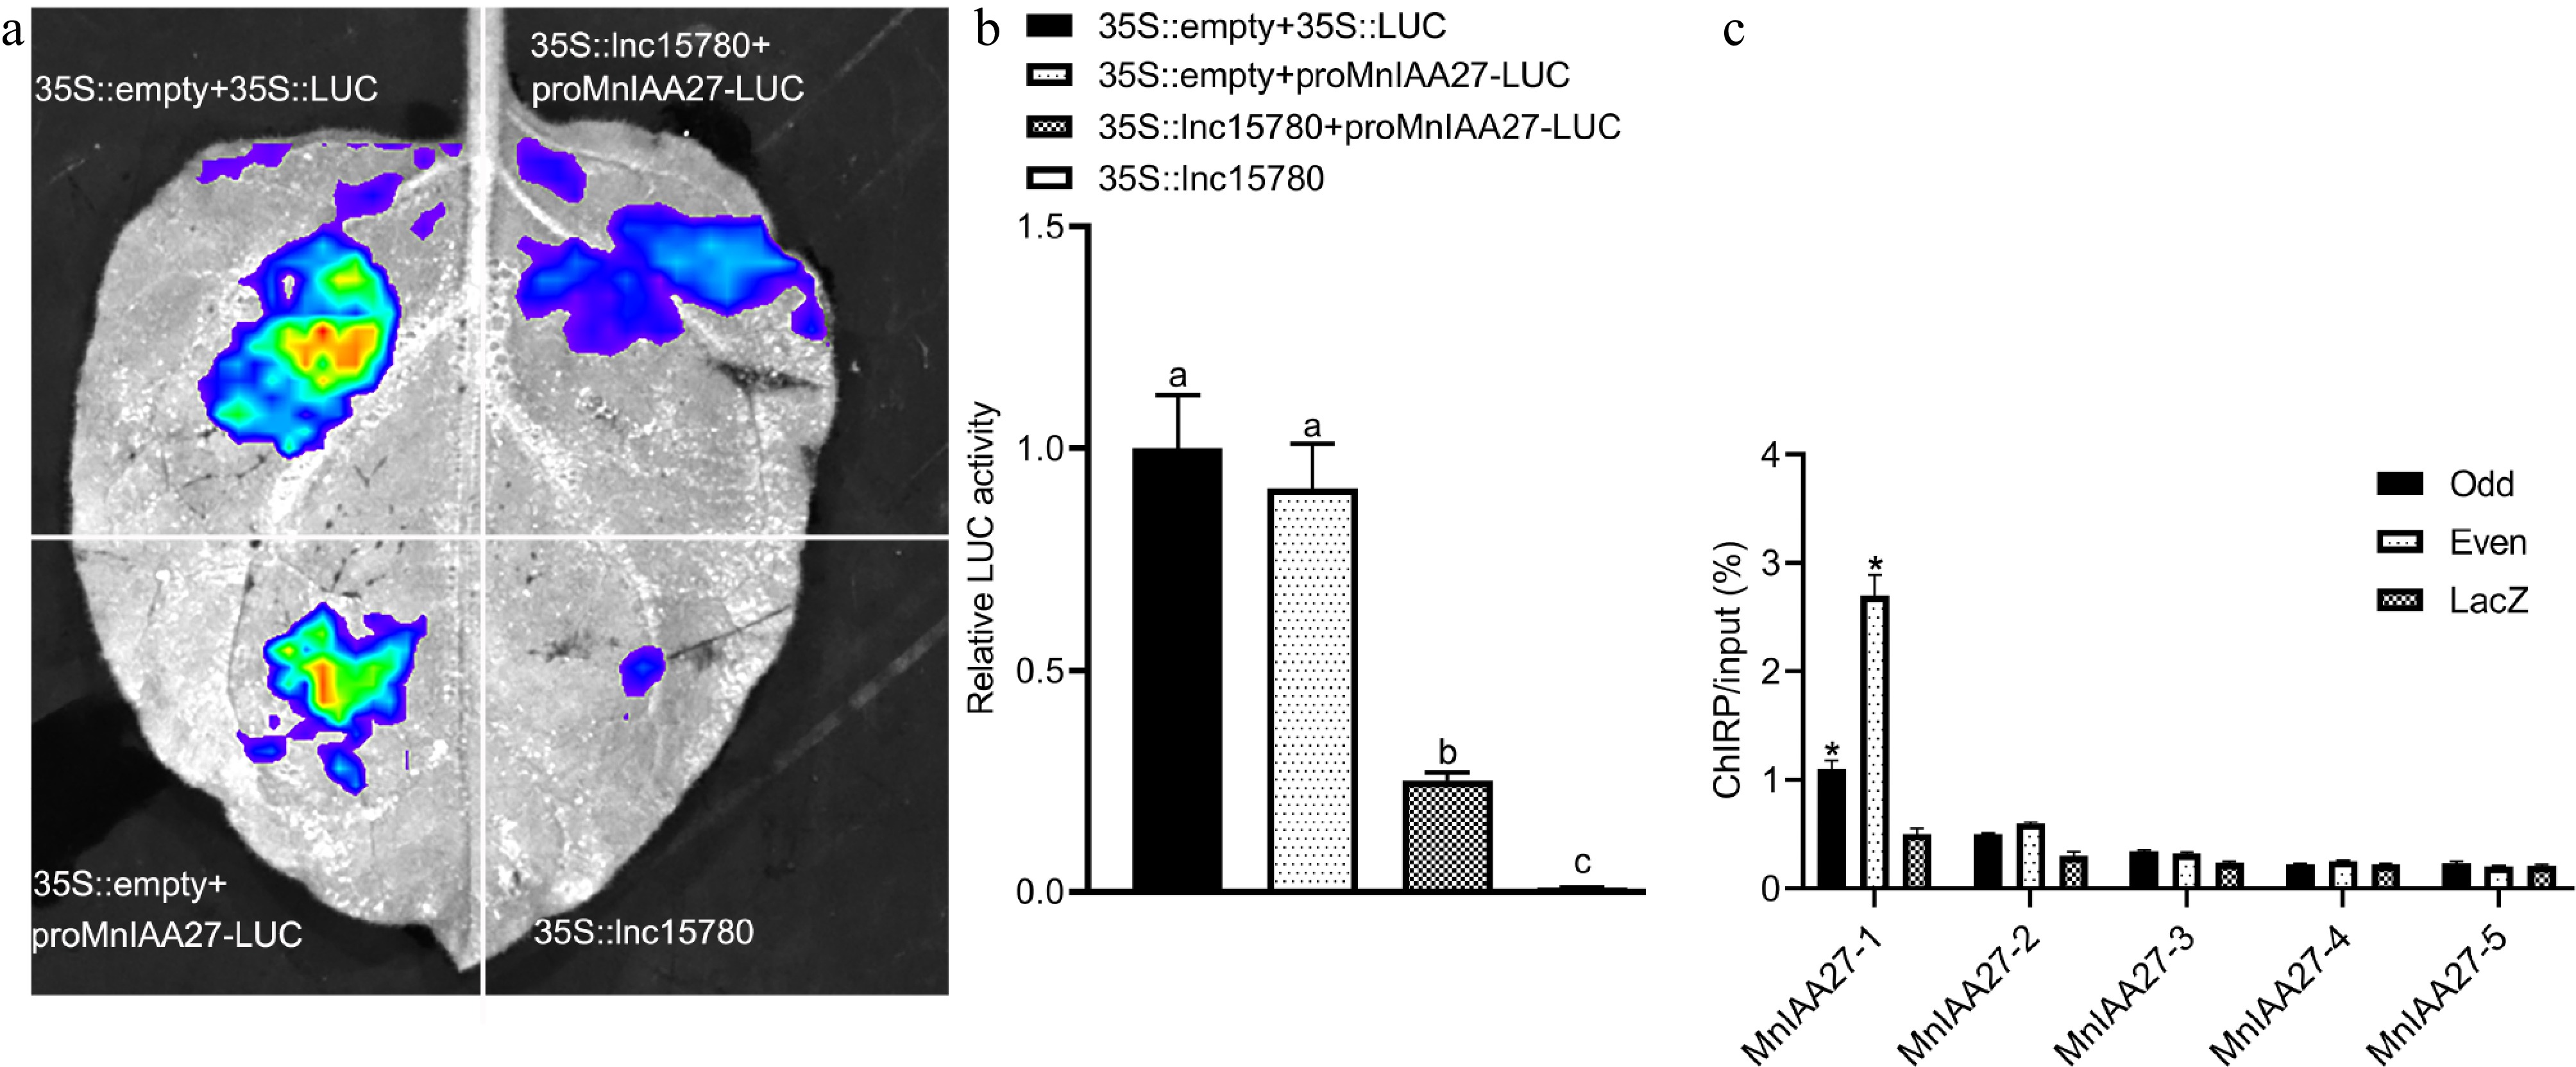
Figure 6.
The mulberry lnc15780 regulates MnIAA27 expression. (a) Transient expression determination of LUC in tobacco leaves. The vector was transformed into tobacco leaves and the fluorescence intensity was observed using the PlantView imaging system. When the transcription factor inhibited promoter activity, the fluorescence value decreased. (b) Quantitative analysis of LUC activity. The error bar represents the standard deviation. According to Tukey's HSD test, different letters indicated significant differences (p < 0.05). (c) ChIRP analysis of lnc15780 binding to MnIAA27 promoter. Odd, samples hybridized with odd probes; Even, samples hybridized with even probes; Lac, LacZ-DNA probes were used as negative controls. The asterisks indicate a statistically significant difference (* p < 0.05).
-
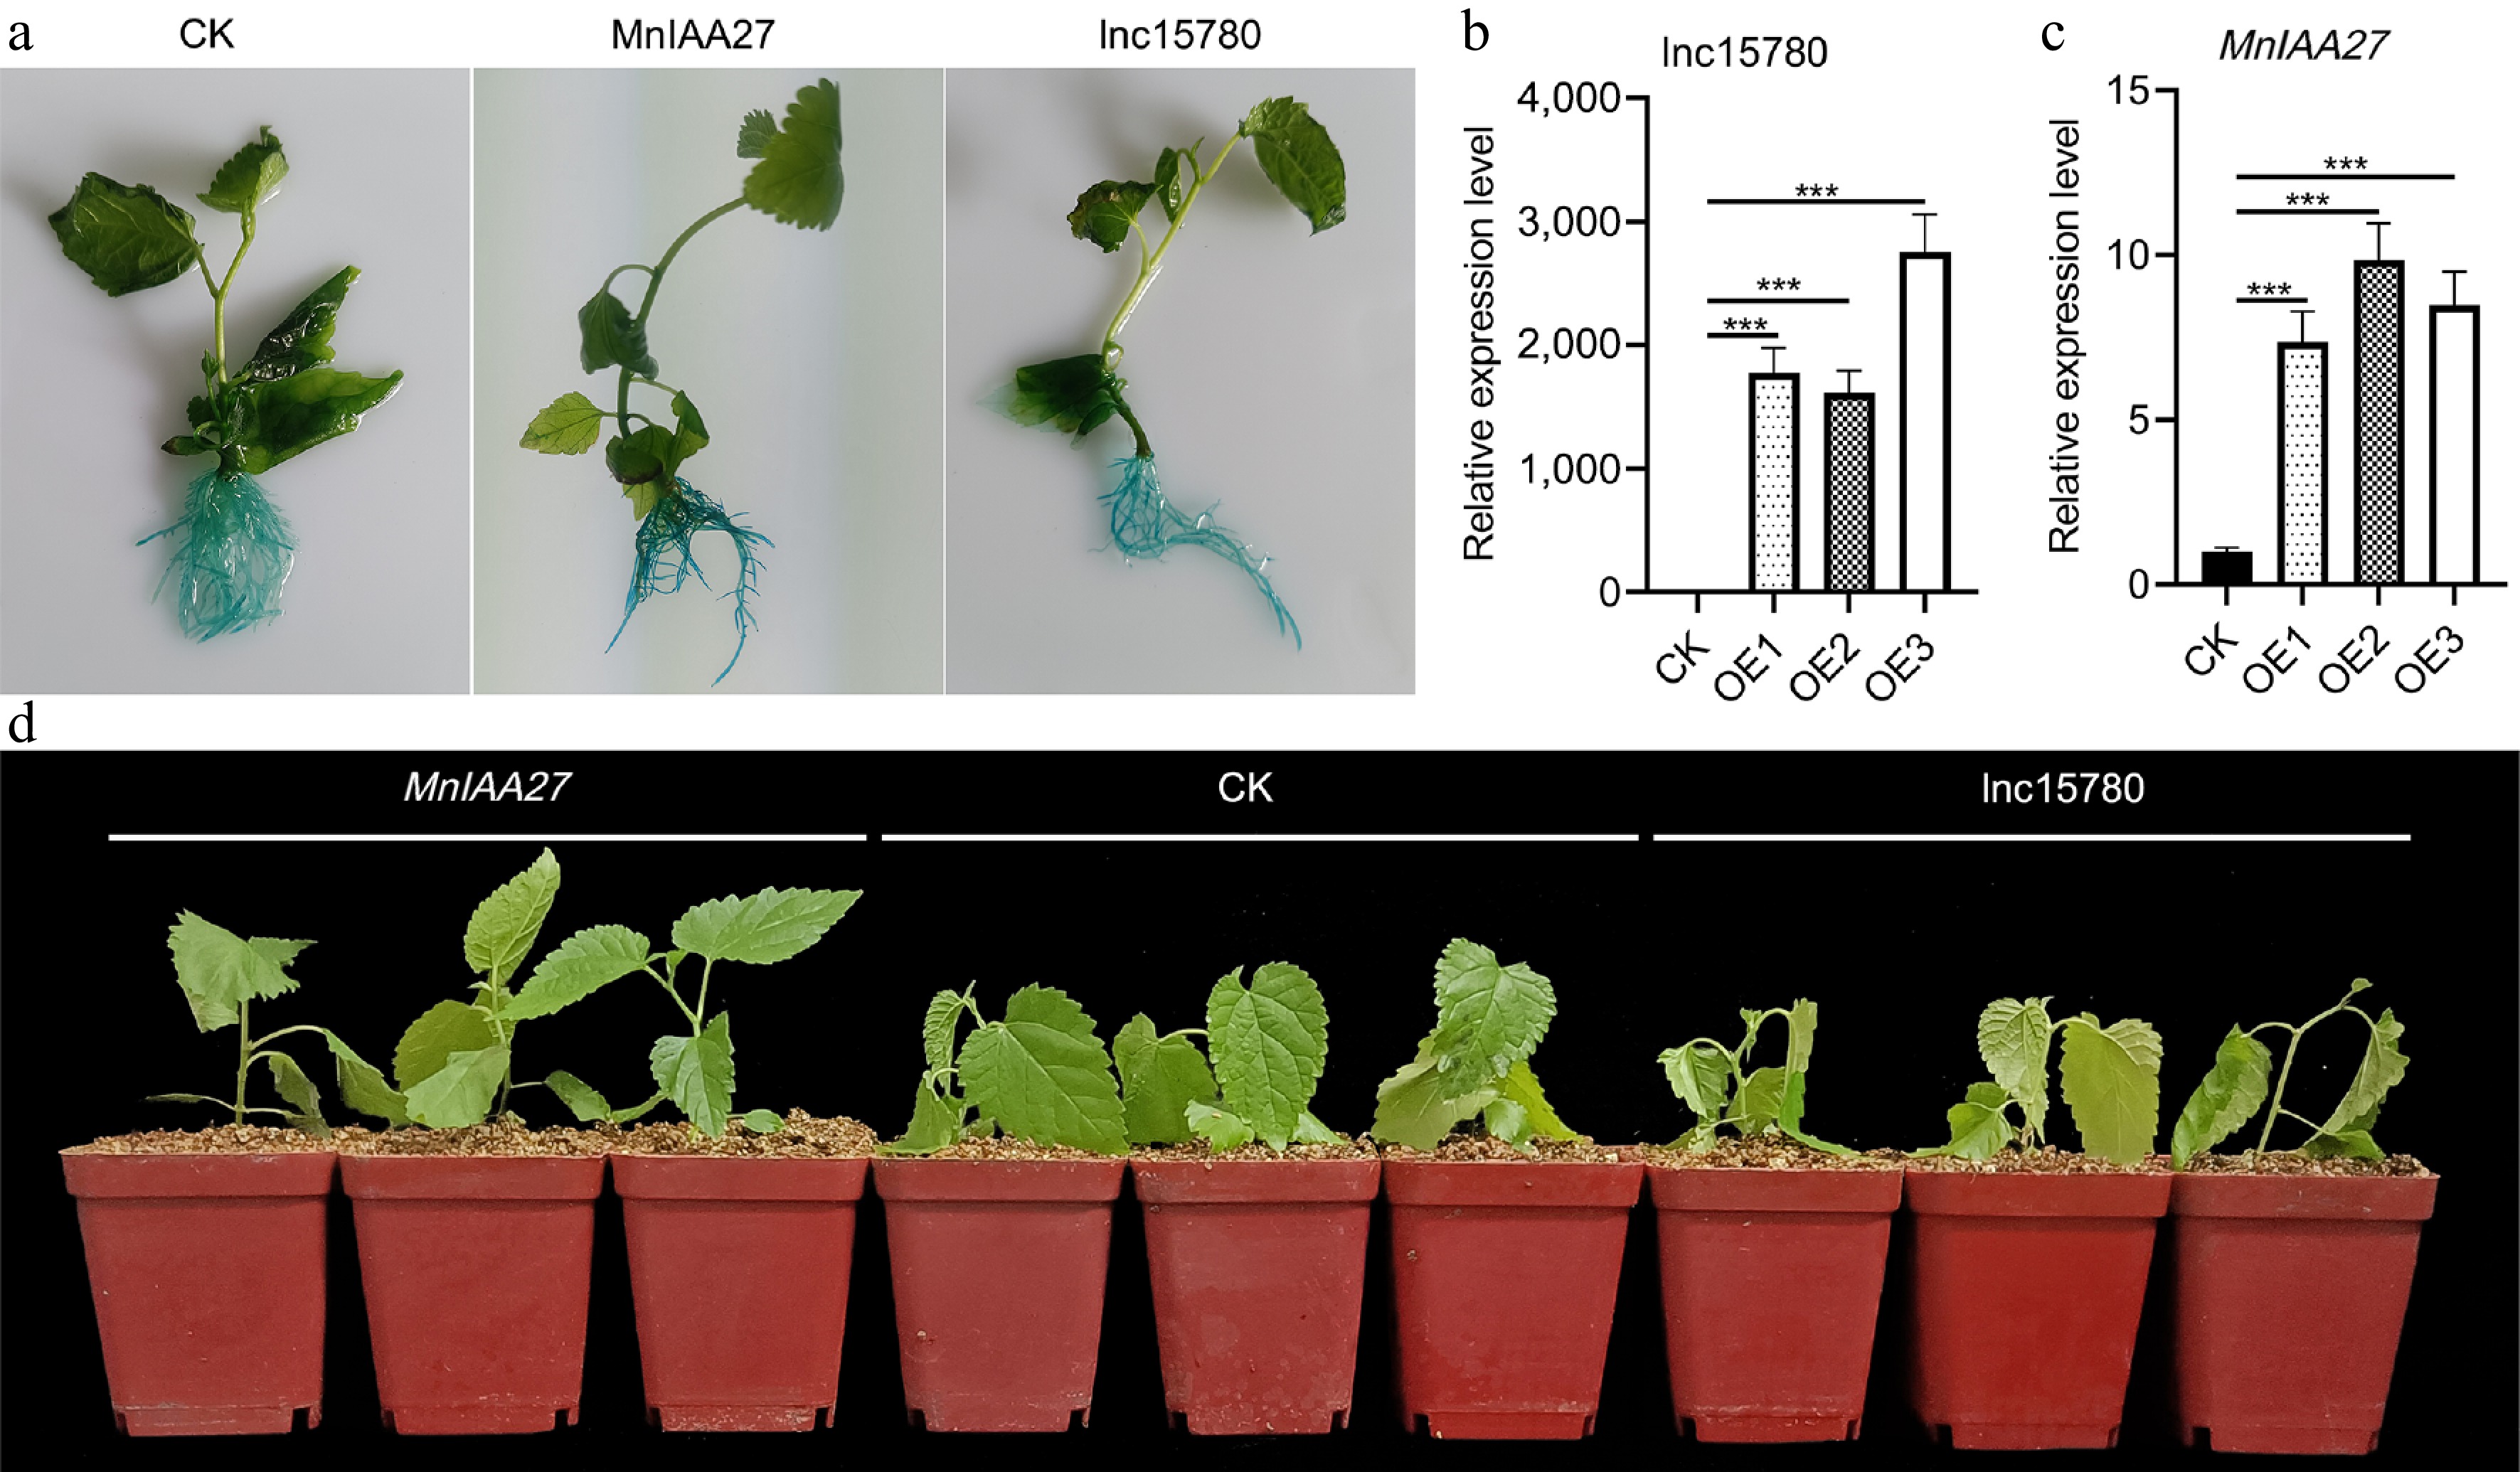
Figure 7.
Analysis of lnc15780 and MnIAA27 salt tolerance of using transgenic hairy roots mulberry. (a) GUS staining was performed on transgenic hairy roots mulberry. The relative expression levels of (b) lnc15780 and (c) MnIAA27 in transgenic hairy roots were determined by RT-qPCR. (d) After salt treatment for 12 h, the transgenic hairy roots mulberry trees were photographed. Error bars represent the SD of three biological replicates (each replicate was a pool of three infected plants) (*** p < 0.001; two-tail t-test). CK, empty vectors.
-
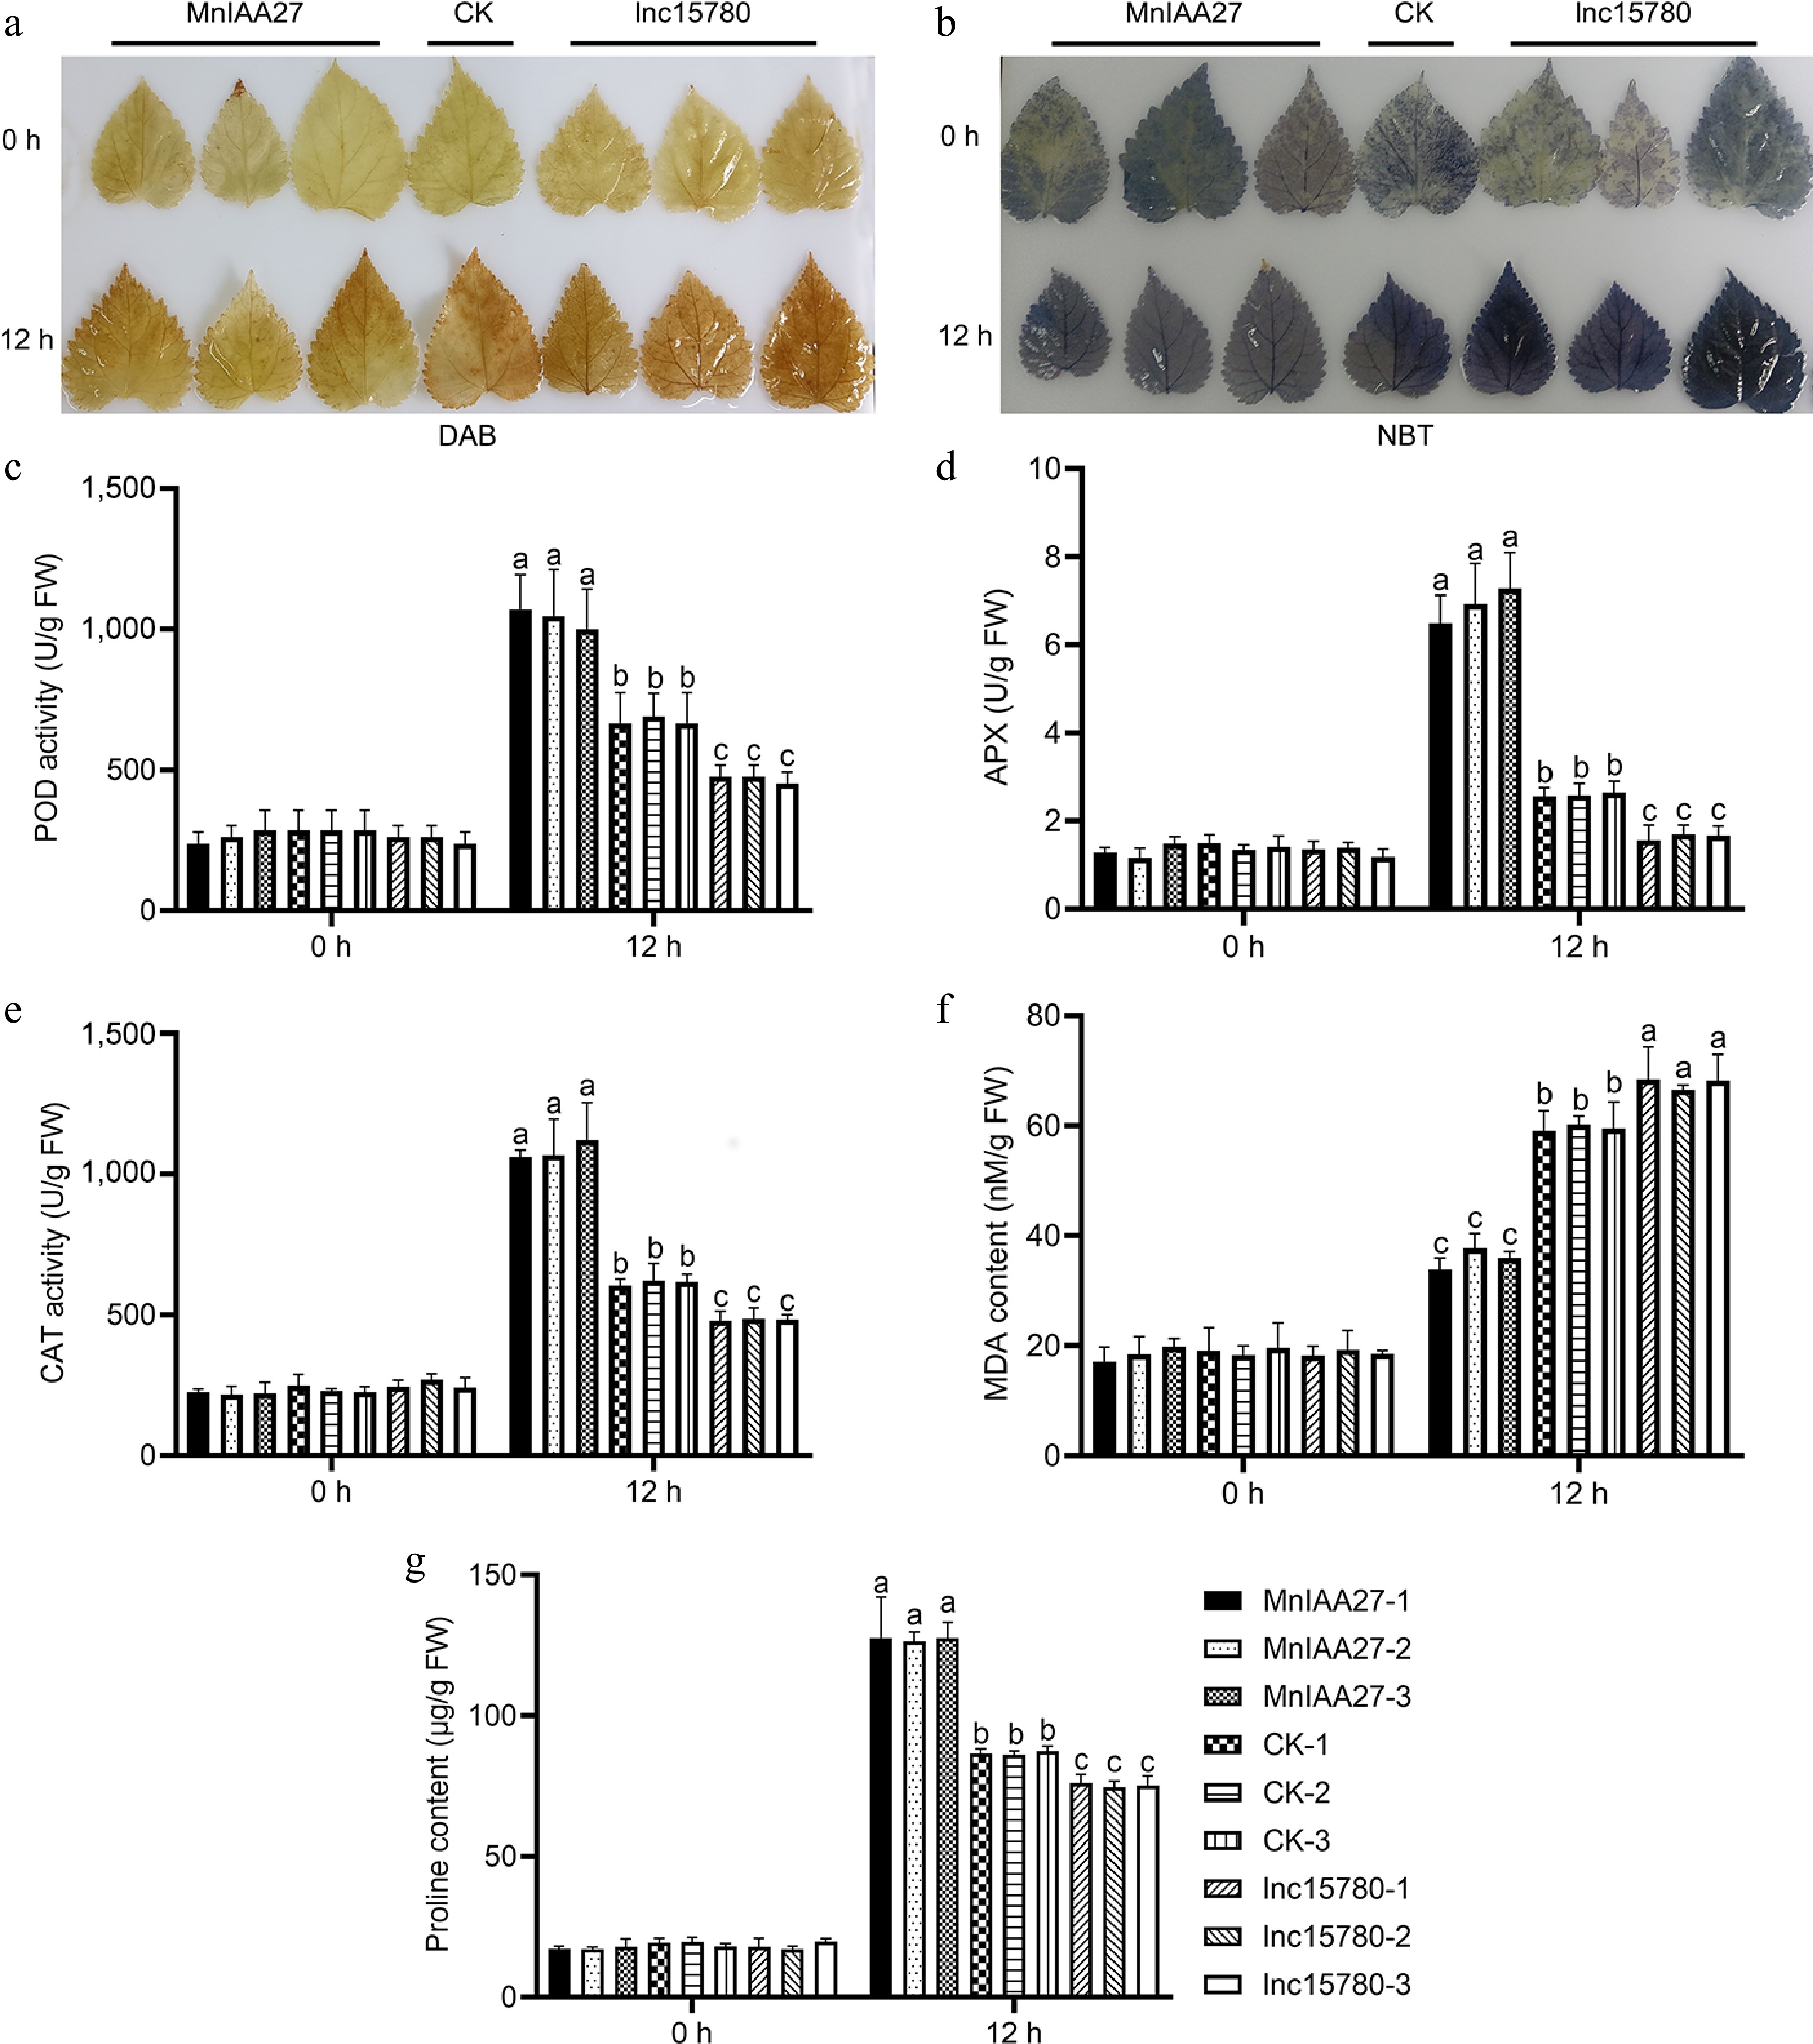
Figure 8.
Determination of salt tolerance by histochemical and physiological analysis. (a) DAB staining showed H2O2 level. (b) NBT staining showed O2− level. (c) POD activity analysis. (d) APX activity analysis. (e) CAT activity analysis. (f) MDA content analysis. (g) Proline content analysis. The value is the average of the three replicates. The error bar represents the standard deviation. According to Tukey's HSD test, different letters indicated significant differences (p < 0.05).
Figures
(8)
Tables
(0)