-
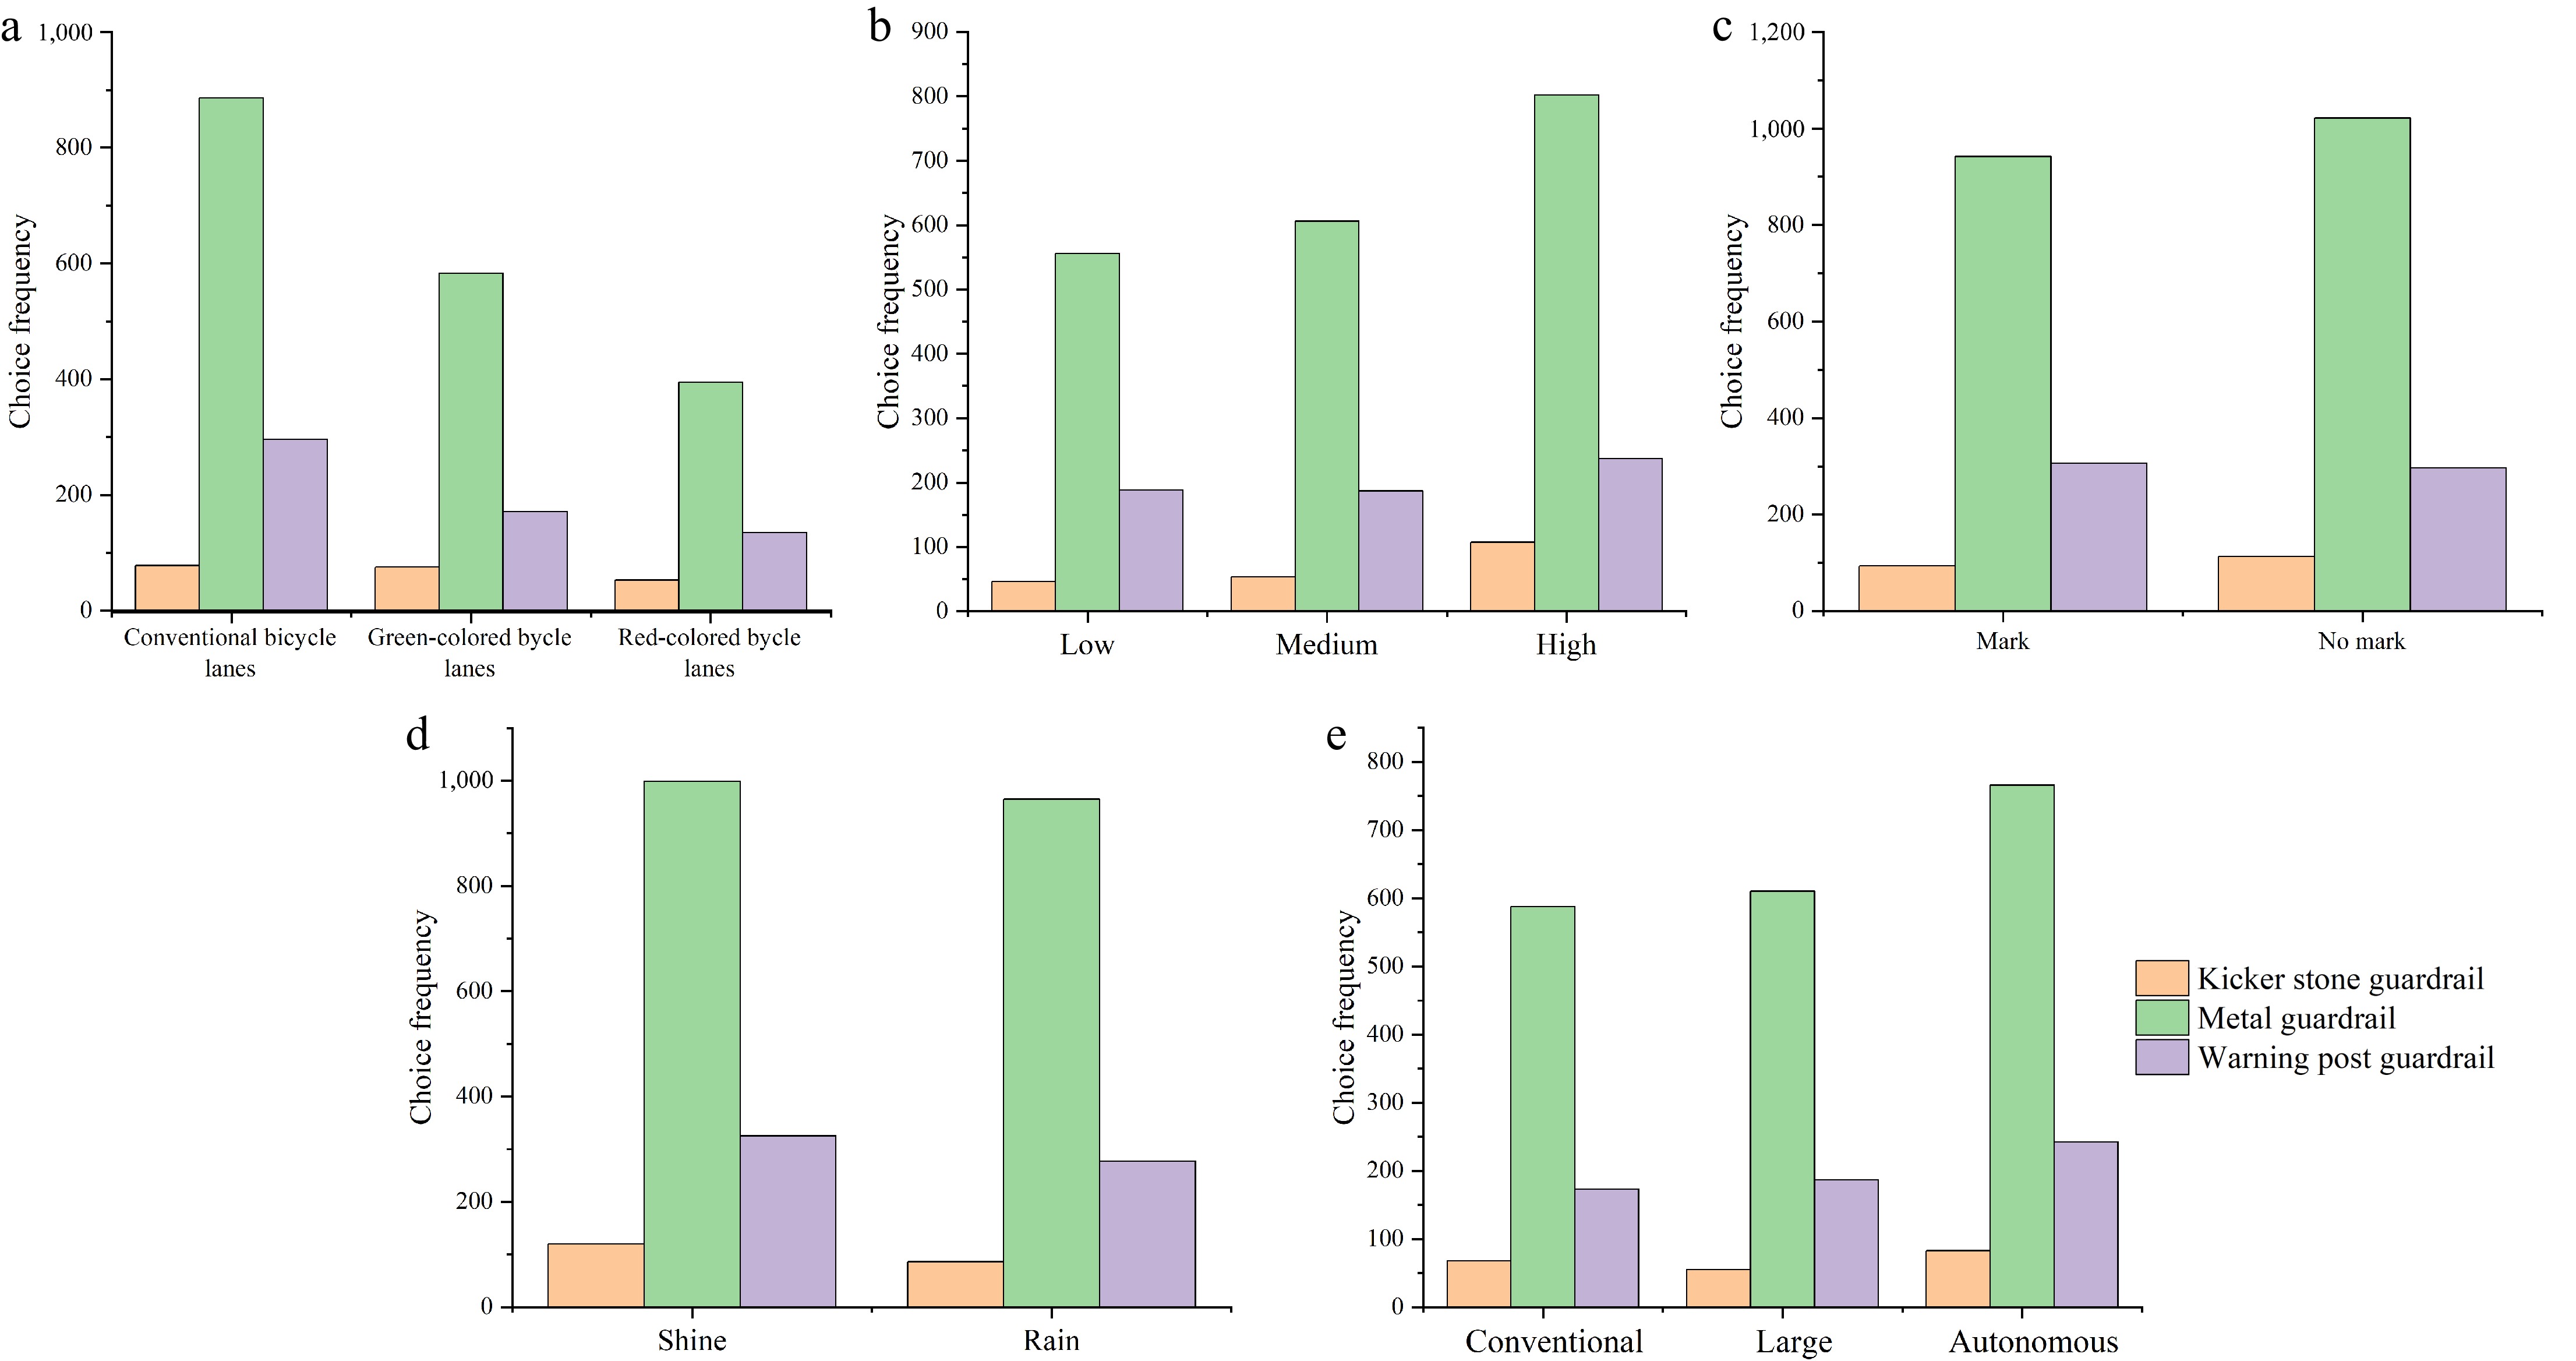
Figure 1.
Descriptive statistics. (a) Colored pavement, (b) traffic volume, (c) lane sign, (d) weather, and (e) vehicle type of adjacent.
-
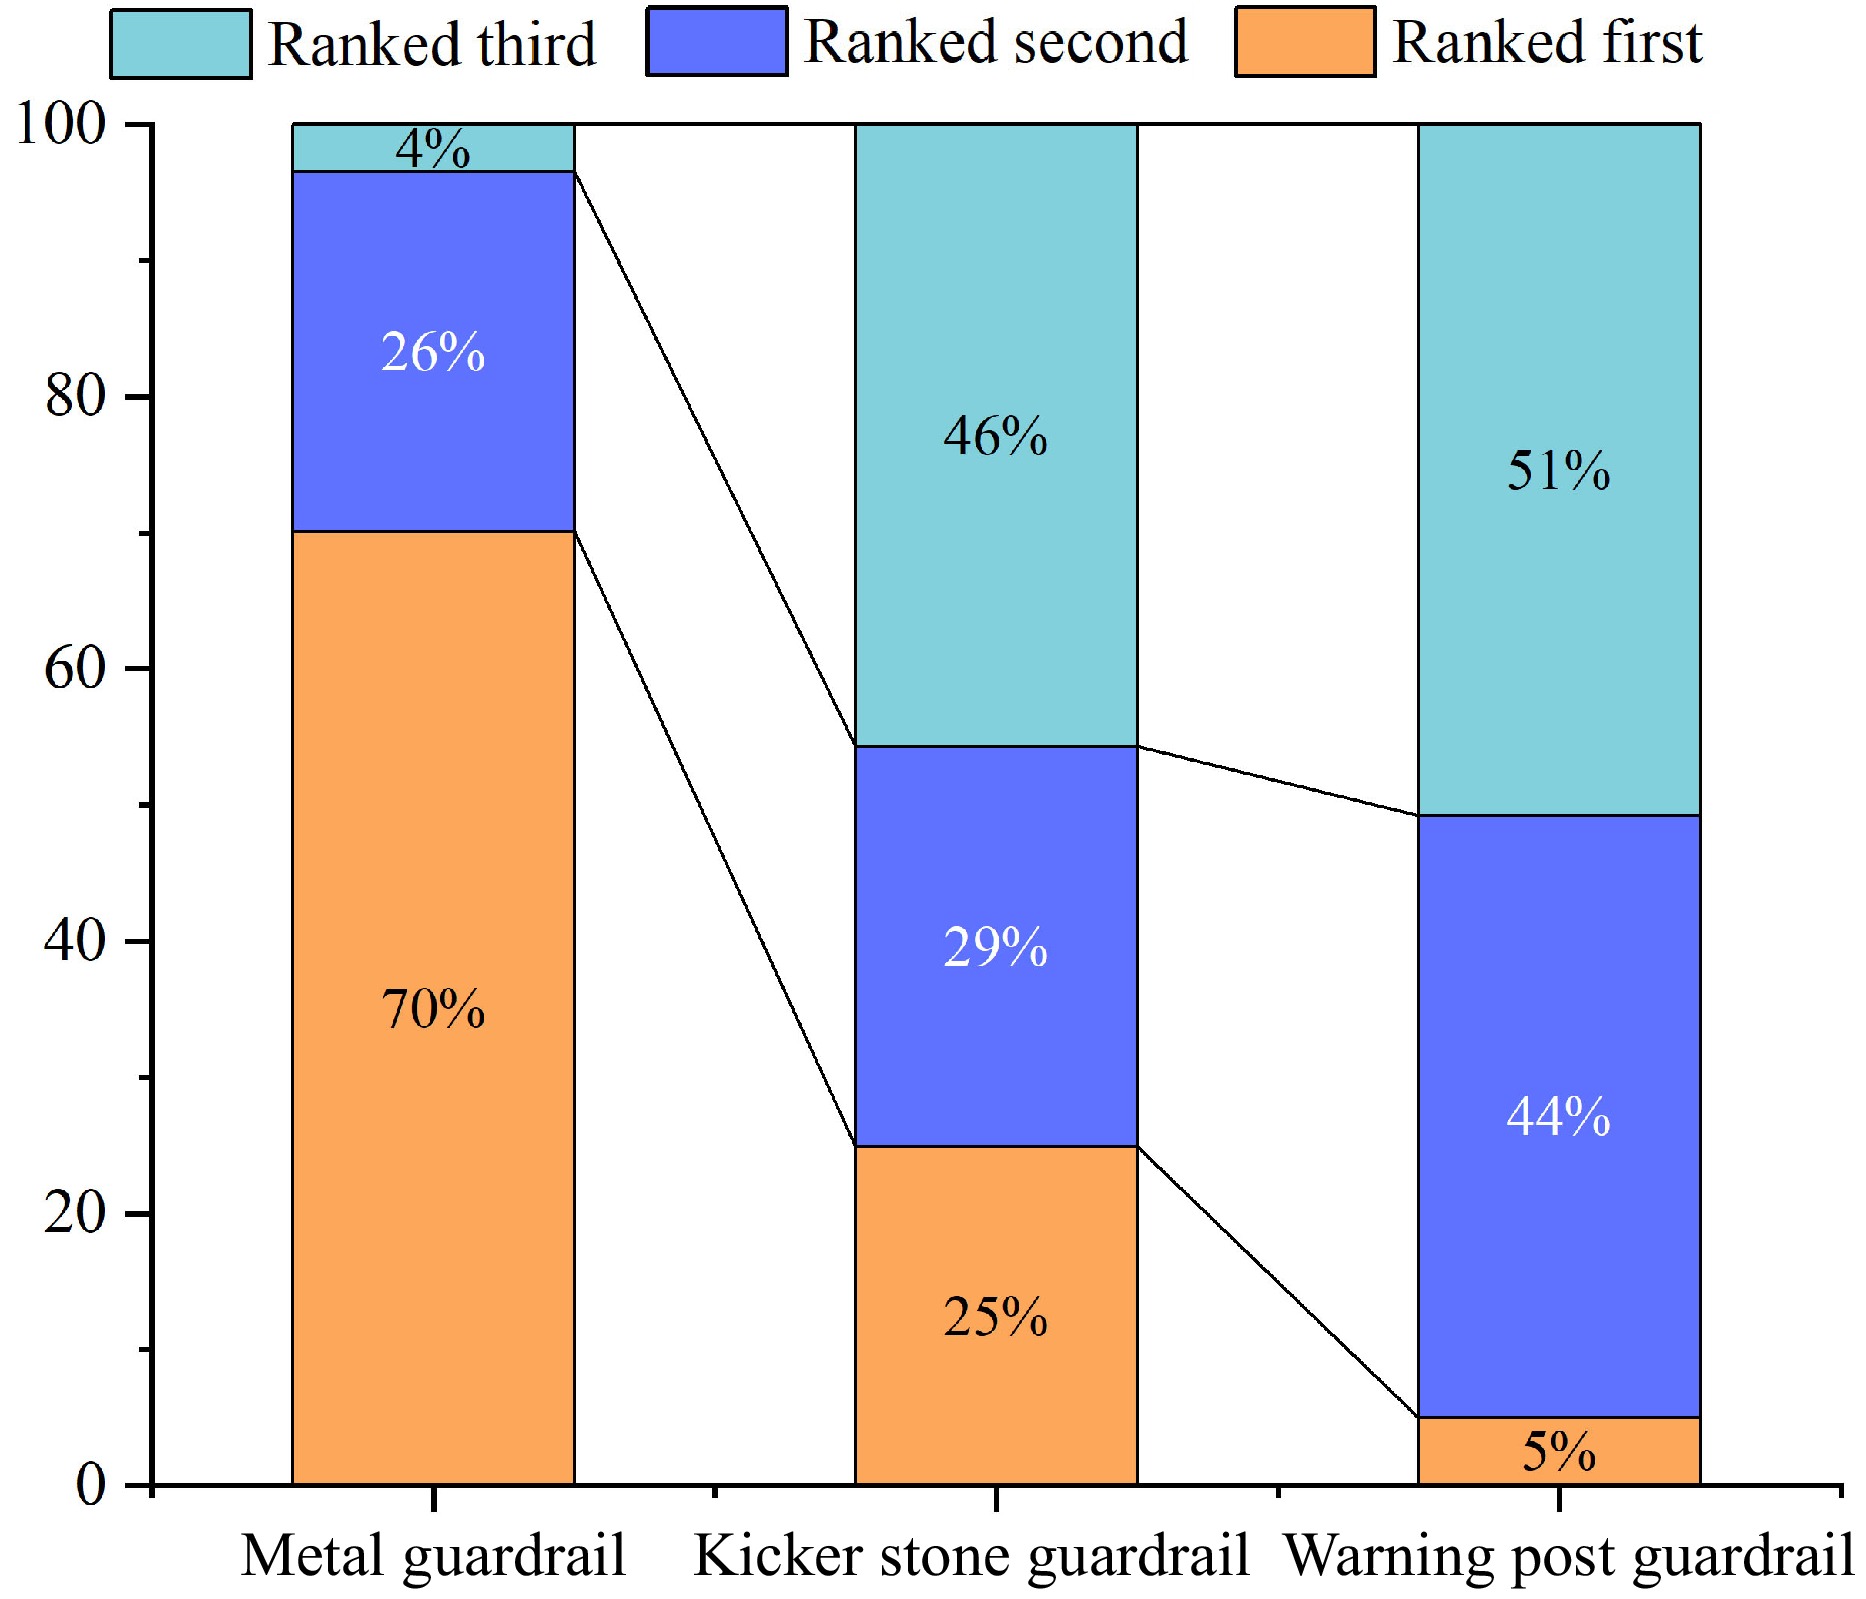
Figure 2.
Guardrail safety ranking chart.
-
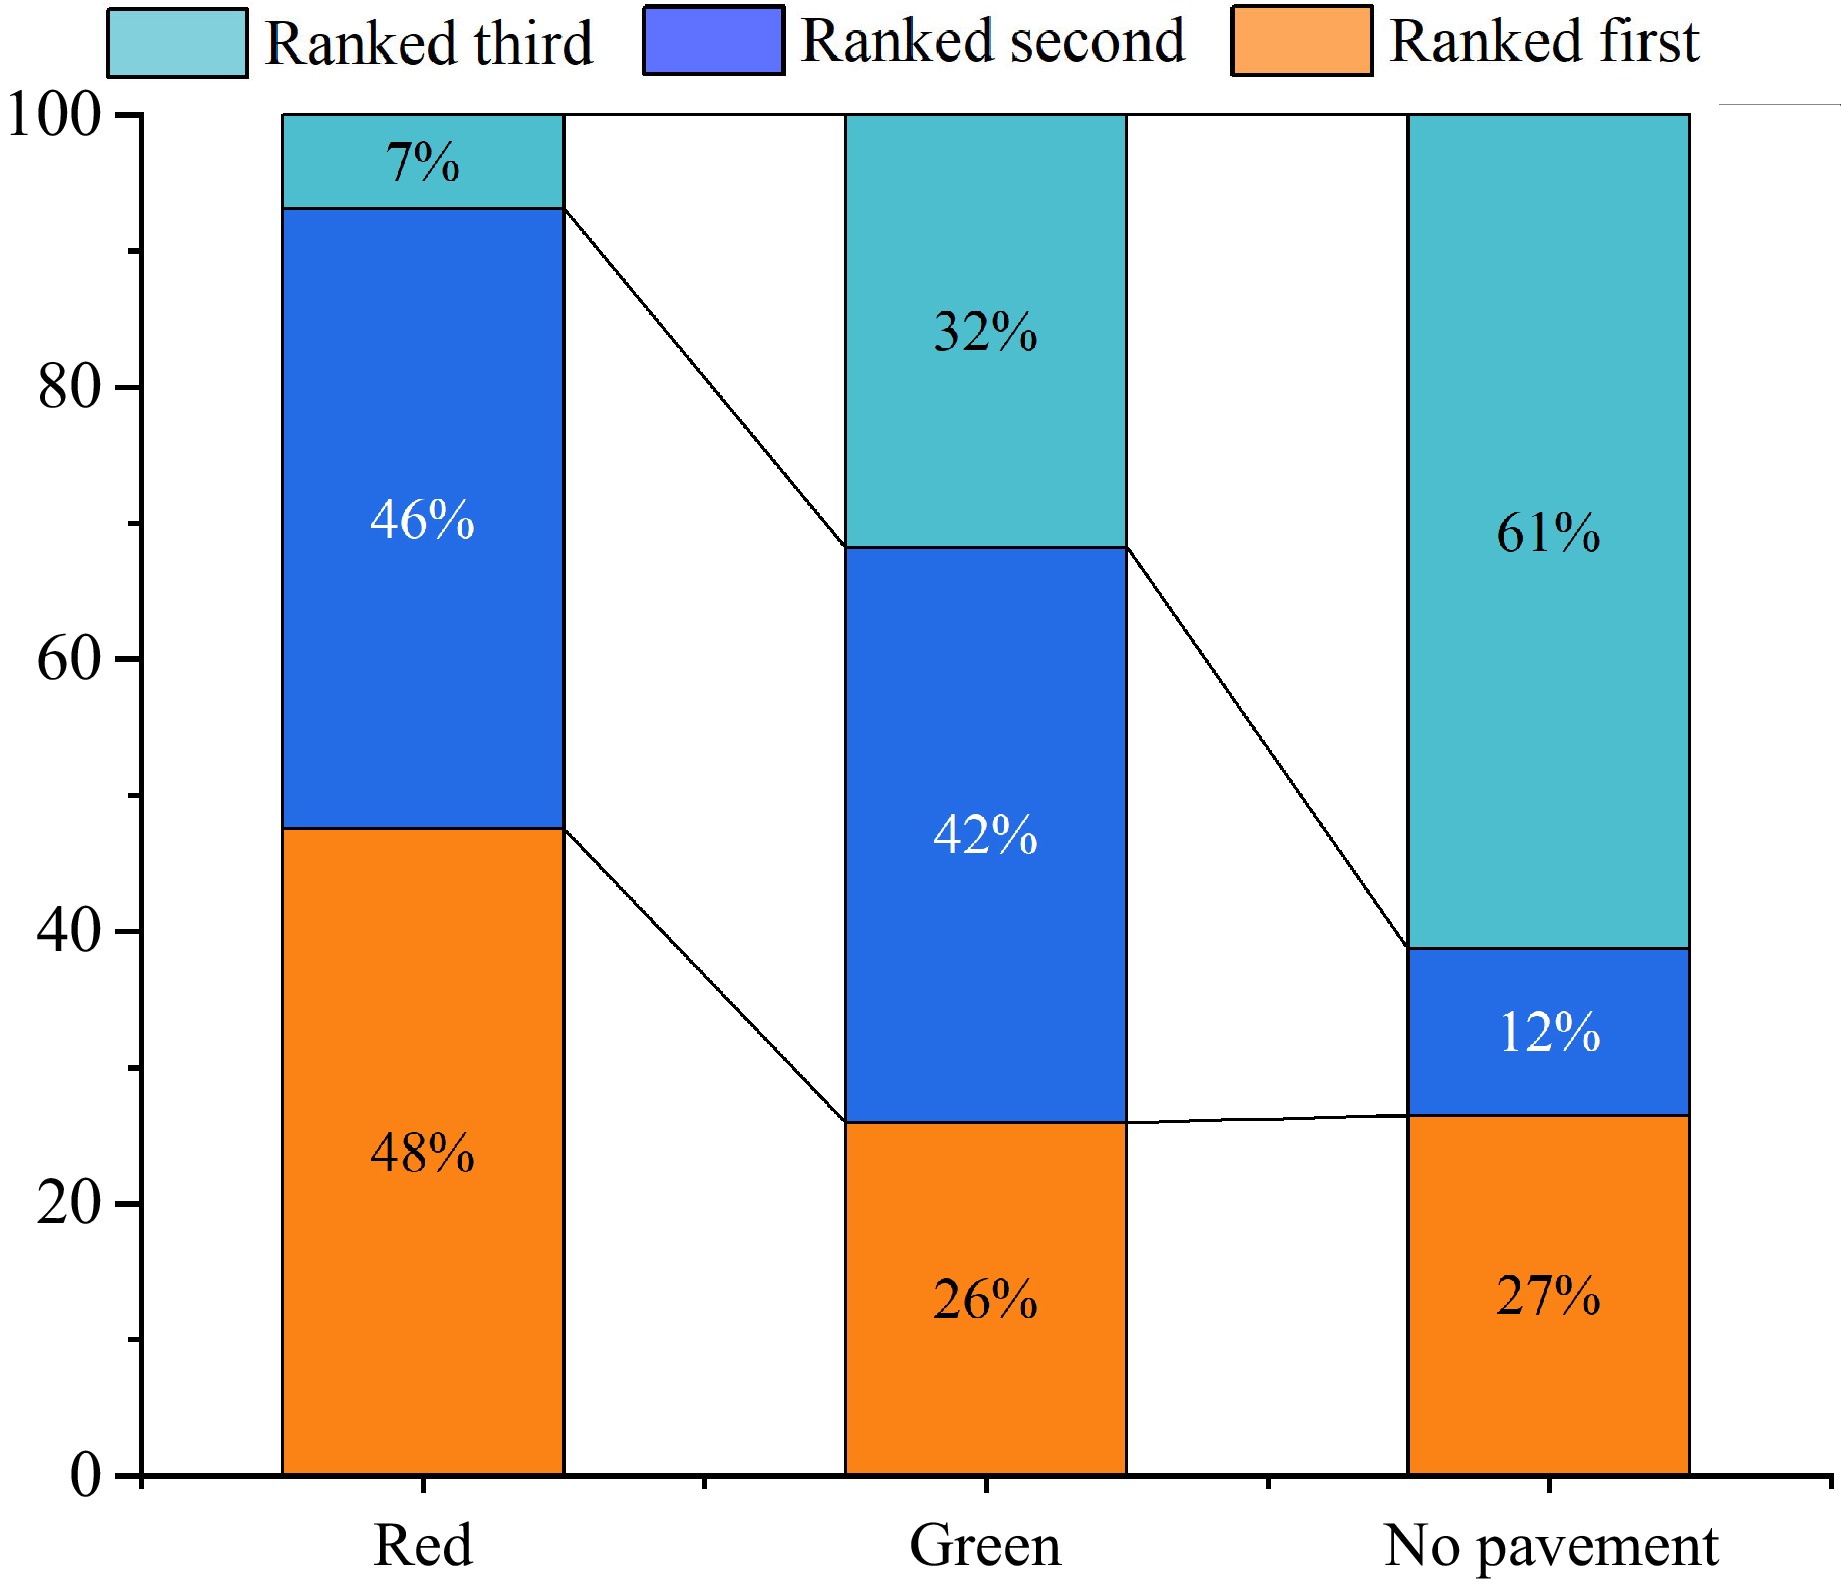
Figure 3.
Colored pavement safety ranking.
-
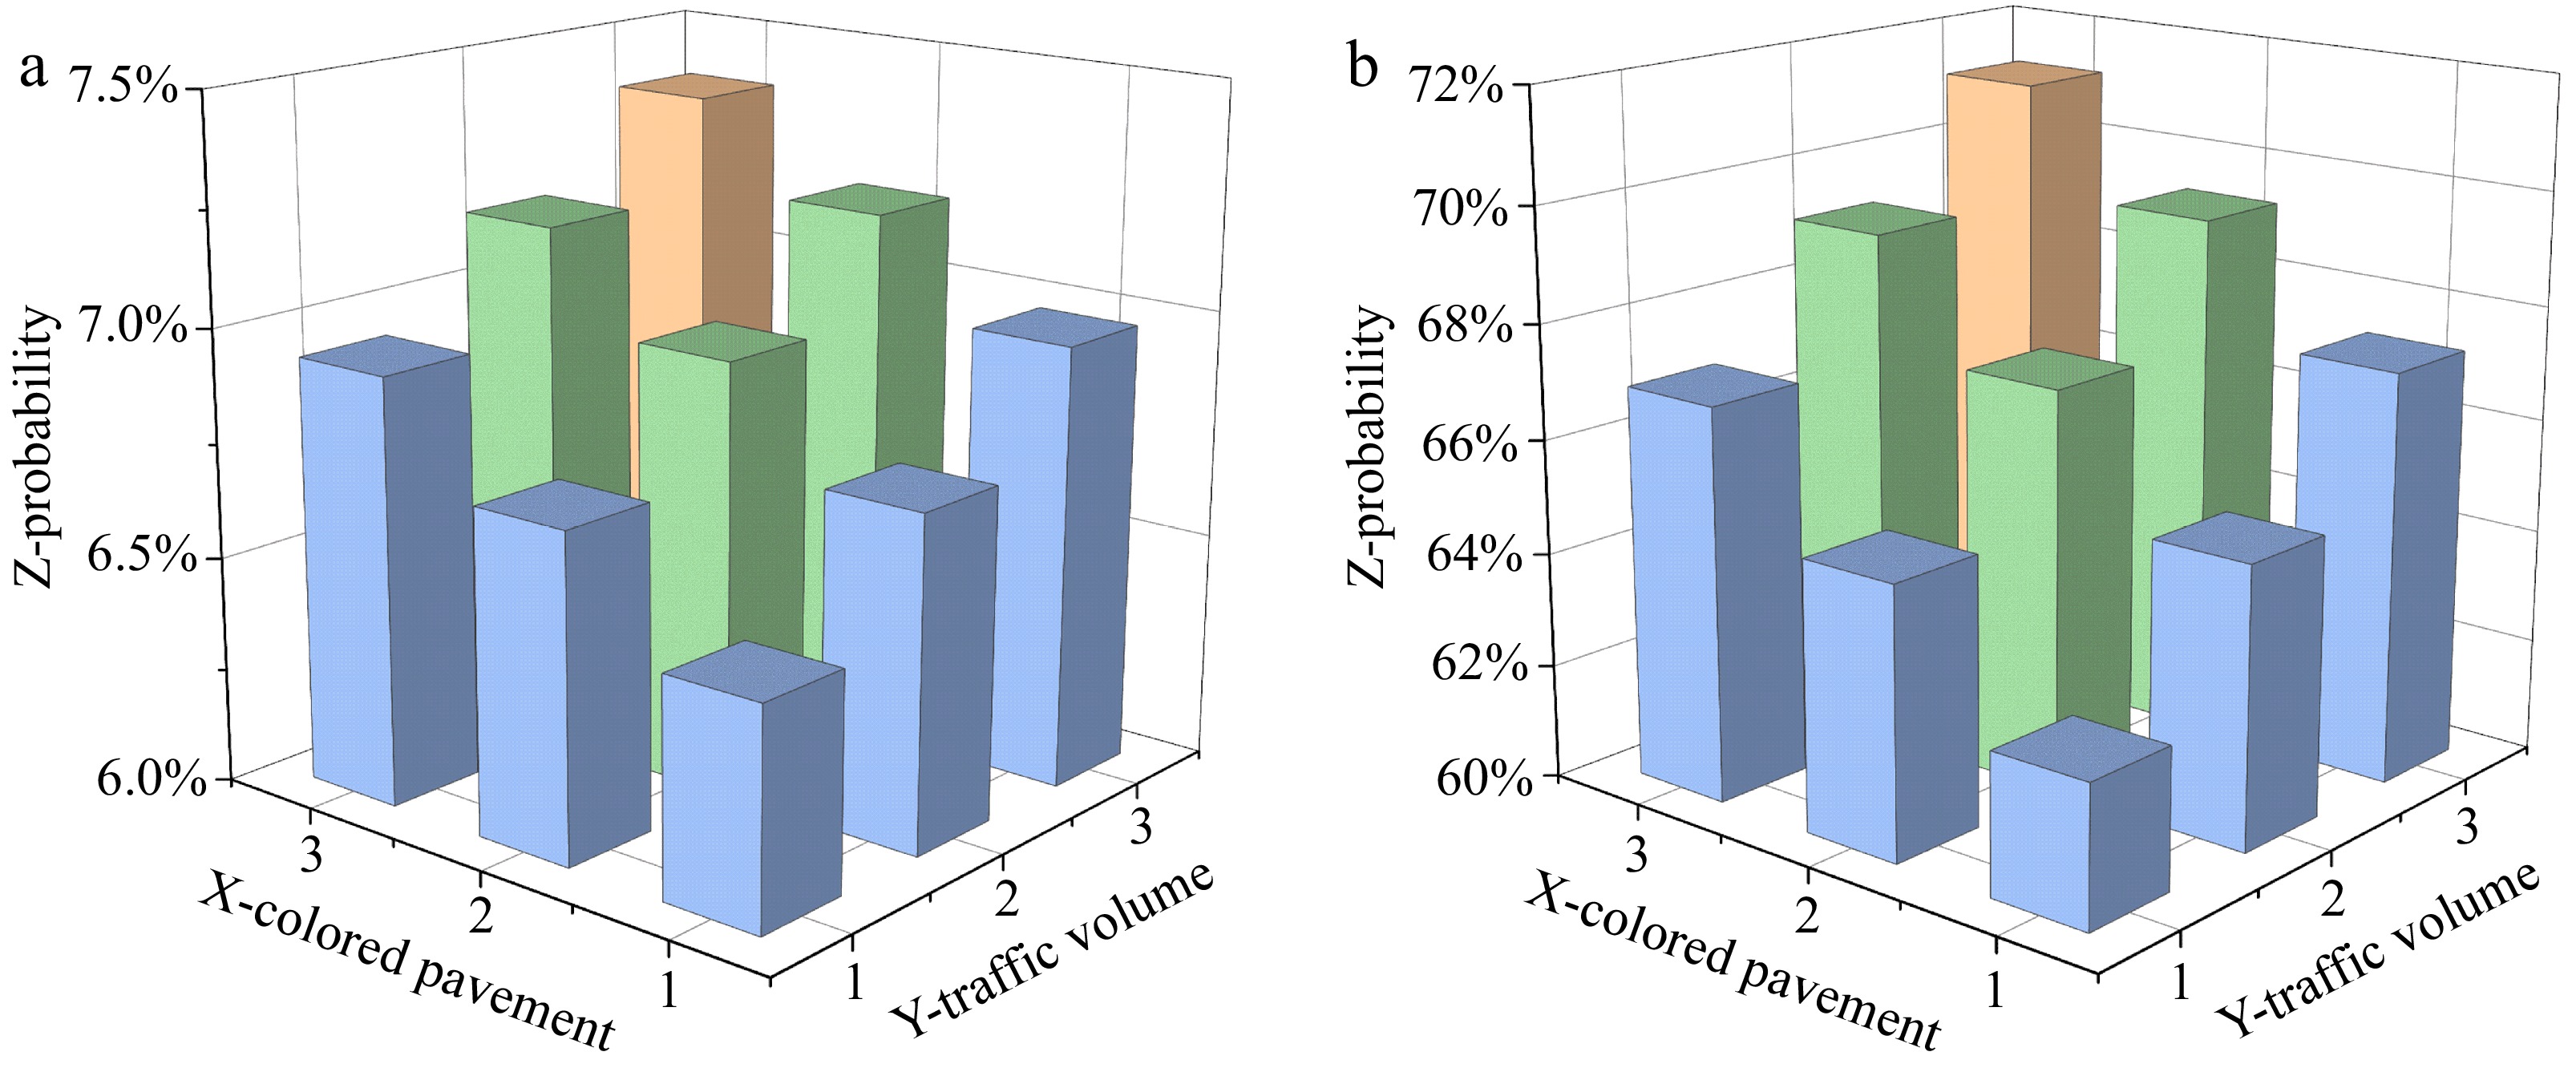
Figure 4.
The impact of traffic volume and colored pavement on guardrail selection. (a) Option 2: metal guardrail. (b) Option 3: warning post guardrail.
-
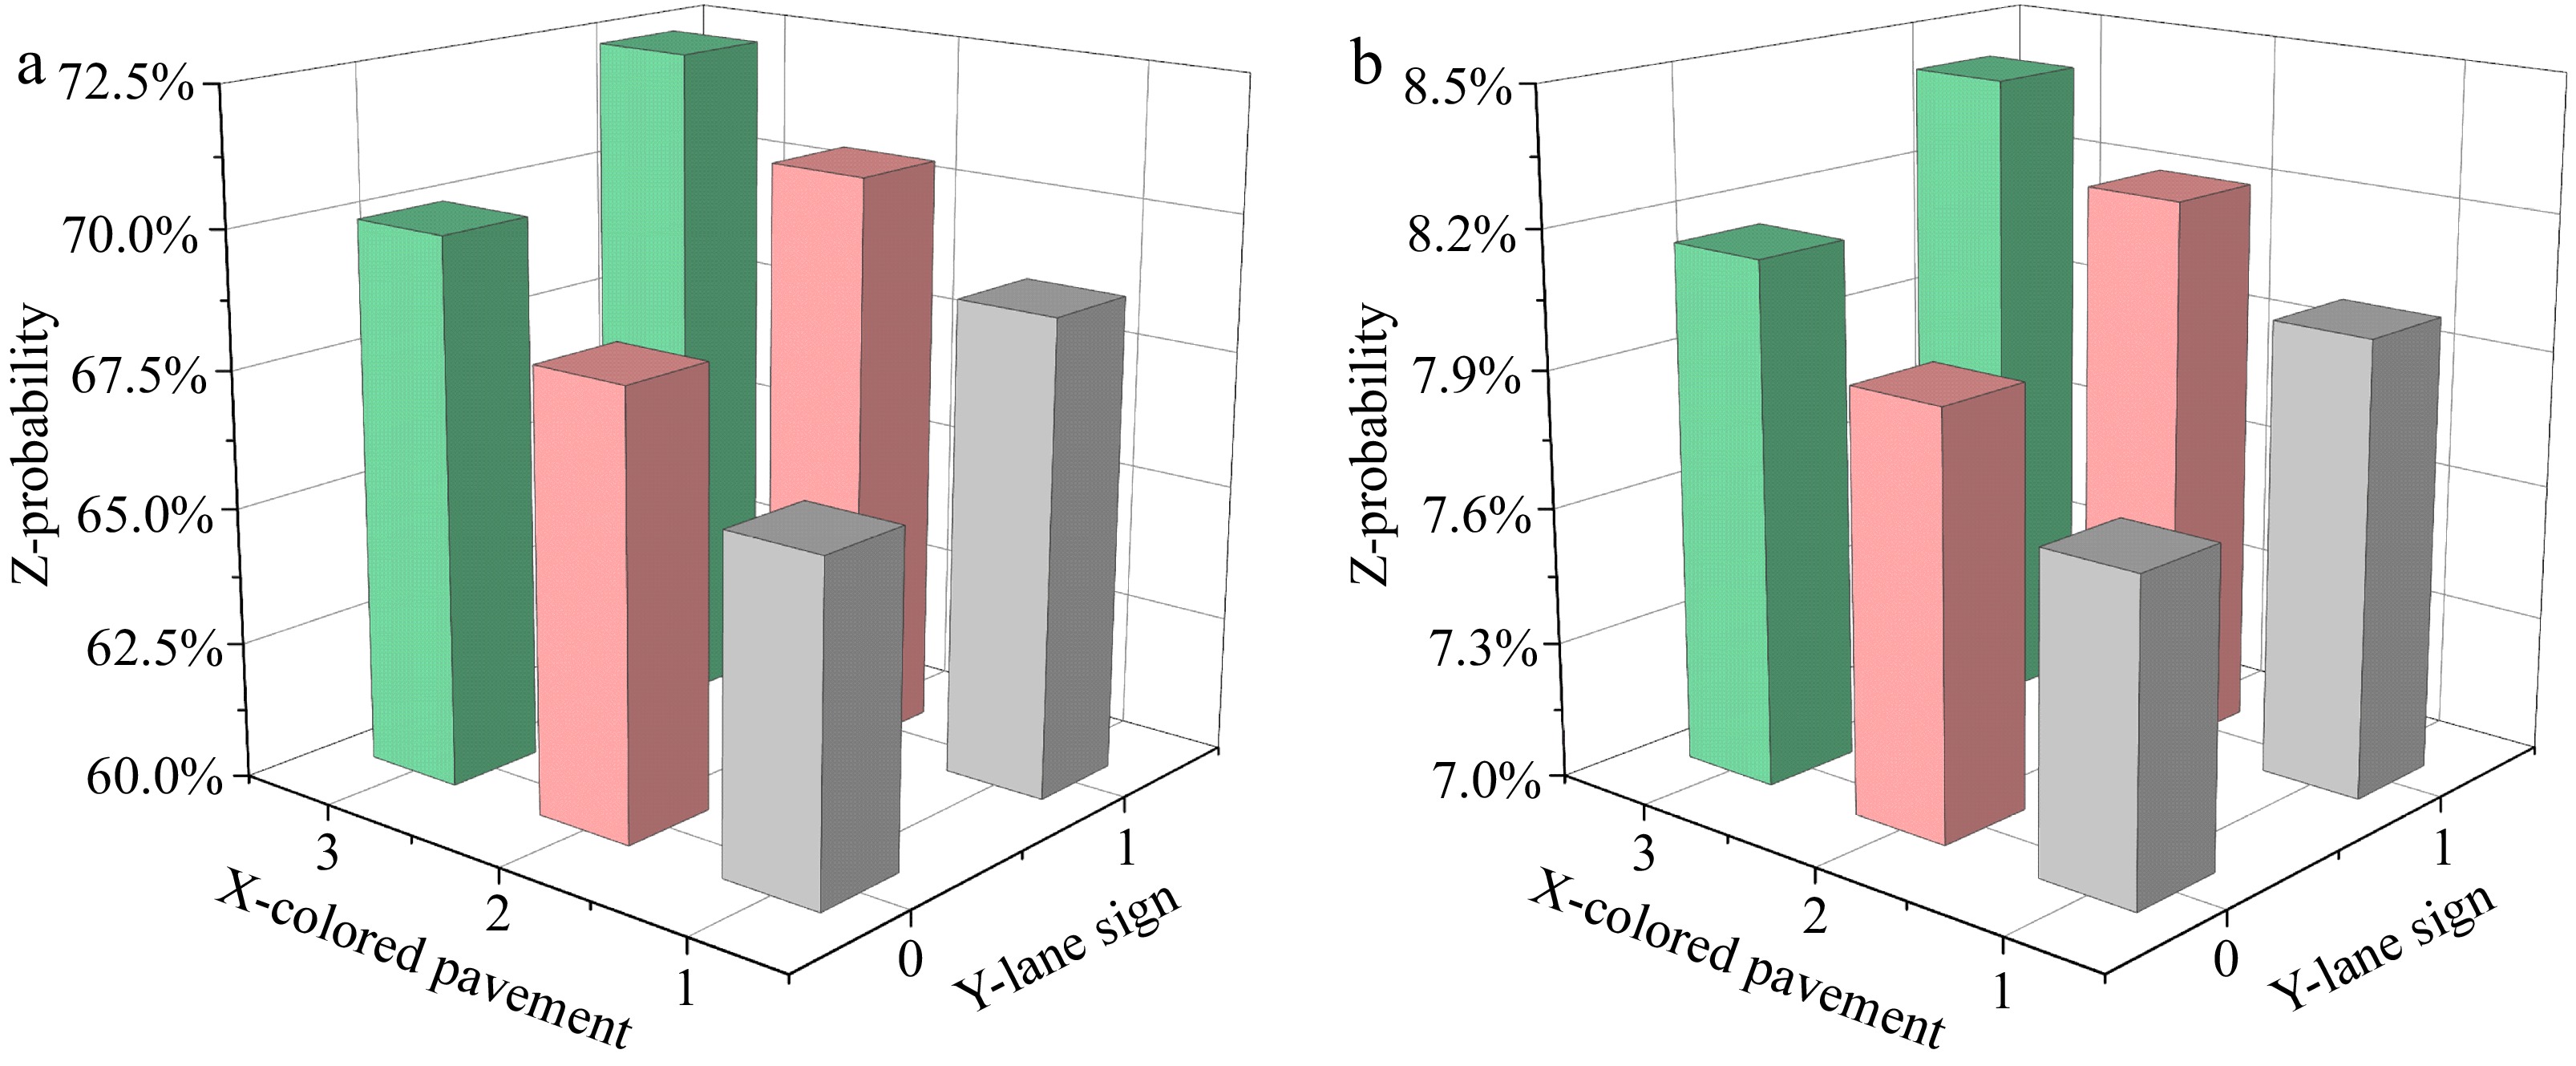
Figure 5.
Influence of lane signs and colored pavements on guardrail selection. (a) Option 2: metal guardrail. (b) Option 3: warning post guardrail.
-
Kicker stone guardrail Metal guardrail Warning post guardrail No pavement 


Green 


Red 


Table 1.
Attributes and levels considered in the choice experiments.
-
Attributes Level Kicker stone guardrail Metal
guardrailWarning post guardrail Colored pavement Level 1 No color Level 2 Red Level 3 Green Traffic volume Level 1 Low Level 2 Moderate Level 3 High Presence of lane signs Level 1 No Level 2 Yes Weather condition Level 1 Shine Level 2 Rain Vehicle type of adjacent Level 1 Conventional vehicle Level 2 Autonomous vehicle Level 3 Large vehicle Table 2.
Attributes and levels considered in the choice experiments.
-
Colored pavement Red Traffic volume High Presence of lane sign No Weather condition Rain Vehicle type of adjacent Large vehicles Selection A. Kicker stone guardrail 
B. Metal guardrail 
C. Warning post guardrail 
Table 3.
Display of a selected scenario.
-
Variable Attribute Count Percentage Proportion in
China populationSex Male 329 47.5% 51.2% Female 364 52.5% 48.8% Age (year) ≤ 19 23 3.3% NA 20−24 247 35.6% 5.2% 25−29 203 29.3% 6.1% 30−39 135 19.5% 15.9% 40−49 61 8.8% 14.3% 50−59 19 2.7% 16.9% ≥ 60 5 0.7% 28.9% Education level Junior high school and below 15 2.2% 34.7%* Senior high school 77 11.1% 16.7% Tertiary education 433 62.5% 17.9% Postgraduate and above 168 24.2% 0.9% Marital status Unmarried 496 71.6% 19.4% Married 197 28.4% 72.6% Occupation Full-time 369 53.2% 85.5% Student 217 31.3% 14.5% Not working
full-time/retired107 15.4% NA Monthly revenue (CNY) ≤ 4,000 253 36.5% NA 4,000−5,999 137 19.8% 6,000−7,999 129 18.6% 8,000−9,999 116 16.7% ≥ 10,000 58 8.4% Riding speed (km/h) ≤ 5 158 22.8% NA 6−9 291 42.0% 7−15 177 25.5% ≥ 16 67 9.7% Number of bike rides (per week) No cycling 64 9.2% NA 1−3 245 35.4% 3−6 181 26.1% ≥ 7 203 29.3% Cycling time (h/week) ≤ 1 191 27.6% NA 1−3 234 33.8% 3−6 164 23.7% ≥ 7 104 15.0% Mobile phone usage while riding (h/week) 0 351 50.6% NA 1−2 199 28.7% 3−4 75 10.8% ≥ 5 68 9.8% Red light running while riding (h) 0 493 71.1% NA 1−2 132 19.0% 3−4 57 8.2% ≥ 5 11 1.6% Involved in traffic accidents Yes 79 11.4% NA No 619 89.3% Proficiency Beginner level 39 5.6% NA Normal level 280 40.4% Proficiency level 374 54.0% NA means Not available. This shows that there is no data published in the official. Table 4.
Summary of participant characteristics.
-
Mean St. d Kicker stone guardrail Importance (1-unimportant, 7-very important) Proficiency in cycling skills 5.56 1.72 Bicycle lane width 5.89 1.43 Bicycle vehicle sign 5.83 1.54 Metal guardrail Guardrail width 5.34 1.81 Guardrail height 5.51 1.62 Bicycle lane width 5.87 1.37 Bicycle vehicle sign 5.86 1.44 Warning post guardrail Warning post height 5.55 1.62 Bicycle lane width 5.87 1.34 Bicycle vehicle sign 5.88 1.44 Table 5.
Importance and preference of design and environmental factors.
-
Scope of work Factor Attribute RPRU model (omitted choice: kicker stone guardrail) RPRR model (omitted choice: kicker stone guardrail) Metal guardrail Warning post guardrail Metal guardrail Warning post guardrail Coefficient S.E. Coefficient S.E. Coefficient S.E. Coefficient S.E. Constant 2.67*** 0.9 IS 2.07** 0.98 IS SP attributes Colored pavement (omitted category: No color and red) Green IS Mean 0.27 IS Mean 0.13 SD 0.22*** SD 0.15*** Lane sign (omitted category: Yes) No −0.25* 0.13 −0.43** 0.21 −0.16* 0.08 −0.27* 0.14 Traffic volume (omitted category: less and medium) More IS 0.65** 0.26 IS 0.45** 0.22 Demographic
factorsAge (omitted category: middle-aged) Youth 0.62*** 0.14 0.44** 0.21 0.42*** 0.08 0.30* 0.16 Educational level (omitted category: postgraduate and above) Junior high
school and below−0.38** 0.17 0.71*** 0.23 −0.24** 0.11 0.49*** 0.17 Riding
habitRiding time (omitted category: moderate) Seldom 0.48** 0.21 IS 0.33*** 0.12 IS Number of riding trips (omitted category: frequently) Seldom −0.72*** 0.25 IS −0.46*** 0.13 IS Moderate Mean 0.05 IS Mean 0.13 IS SD 0.20*** SD 0.15*** Have there been any non-motor vehicle accidents (omitted category: yes) No IS −1.64*** 0.25 IS −1.01*** 0.16 Frequency of running red light (omitted category: frequently) Seldom −1.80** 0.76 IS −1.10* 0.57 IS Moderate −1.64** 0.79 IS −1.02* 0.58 IS Risk
Perception
factorsPossibility of accidents (omitted category: moderate) Minor 0.30* 0.18 IS 0.21** 0.11 IS Serious IS 0.76*** 0.22 IS 0.53*** 0.18 Severity of the accident (omitted category: serious) Minor 0.33* 0.19 0.60* 0.33 0.23* 0.12 0.41* 0.23 Moderate IS 0.40* 0.23 IS 0.27* 0.16 Log-likelihood at zero (LL (0)) −3045.35326 −3045.35326 Log-likelihood at convergence (LL(β)) −2112.6678 −2112.6678 McFadden Pseudo R-square 0.38 0.38 AIC 3881.9 3885.2 *** is statistically significant at the 1% level; ** is statistically significant at the 5% level; * is statistically significant at the 10% level; IS indicates not significant. Table 6.
Parameter estimation results for multinomial logit model.
-
Variable description Marginal effects Metal guardrail Warning
post guardrailColored pavement Green (1 if yes, 0 otherwise) [WPG] −0.011 0.016 Lane sign Lane sign (1 if no, 0 otherwise) [MG] −0.061 0.014 Lane sign (1 if no, 0 otherwise) [WPG] 0.025 −0.036 Traffic volume More (1 if yes, 0 otherwise) [WPG] −0.013 0.019 Age Youth (1 if yes, 0 otherwise) [MG] 0.032 −0.008 Youth (1 if yes, 0 otherwise) [WPG] −0.006 0.008 Educational level Senior high school (1 if yes, 0 otherwise) [MG] −0.010 0.004 Senior high school (1 if yes, 0 otherwise) [WPG] −0.007 0.010 Riding time Seldom (1 if yes, 0 otherwise) [MG] 0.018 −0.004 Number of riding trips Seldom (1 if yes, 0 otherwise) [MG] −0.0129 0.002 Moderate (1 if yes, 0 otherwise) [MG] −0.030 0.006 Have there been any non-motor vehicle accidents No accidents (1 if yes, 0 otherwise) [WPG] 0.046 −0.068 Frequency of running red light Seldom (1 if yes, 0 otherwise) [MG] −0.025 0.010 Moderate (1 if yes, 0 otherwise) [MG] −0.025 0.010 Possibility of accidents Minor (1 if yes, 0 otherwise) [MG] 0.007 −0.001 Serious (1 if yes, 0 otherwise) [WPG] −0.014 0.021 Severity of the accident Minor (1 if yes, 0 otherwise) [MG] 0.011 −0.002 Minor (1 if yes, 0 otherwise) [WPG] −0.004 0.005 Moderate (1 if yes, 0 otherwise) [WPG] −0.006 0.008 Parameters defined for: MG, metal guardrail; WPG, warning post guardrail. Table 7.
Marginal effects of parameter estimation of the panel mixed multinomial logit model.
Figures
(5)
Tables
(7)