


-
Cycling plays a vital role in urban transportation systems, due to its environmentally-friendliness and sustainability[1−3]. However, compared with other travel modes, the proportion of cycling is still limited[4]. One important issue is that travelers might suffer an inadequate sense of security when cycling, which could partially explain why people do not choose to travel by bike[5].
Therefore, it is meaningful to improve the security and preference of cycling, which in return improves the safety and sustainability of overall urban transport. One of the potential ways to ensure cyclists' safety perception is that bicycle-related road infrastructure should be properly designed[6,7].
Guardrails, being the predominant safety measure for cyclists, are extensively employed in urban areas. Previous studies and practical experience demonstrate that installing guardrails can effectively decrease the occurrence of bicycle-vehicle collision[8−12]. However, cyclists' perceptions towards different types of guardrails as well as the safety consequences is crucial while rarely attempted.
Currently, the Chinese government has introduced protected cycling lanes (PCL) to enhance cycling safety and travel efficiency in developed cities[13,14]. Indeed, as an important facility for the establishment of protected bicycle lanes, guardrails are adopted to separate motor vehicles from bicycles[13,15]. On one hand, guardrails are expected to prevent severe incidents between cyclists and drivers owing to the physical separation[16]. On the other hand, different forms of physical separation might influence cyclists' perceptions of safety and comfort, thereby affecting their subjective sense of security while cycling[17].
Numerous studies have investigated how colored pavements and sign designs affect the usage and perception of cyclists[18−20]. For instance, a study conducted in Norway investigated the impact of different colored bicycle pavements on cyclists' sense of security, the results show significant differences exist among lanes with different colors[21]. A survey collected from 21,500 respondents in Berlin (Germany) indicated that physical separation, wider lanes, and brighter colored pavements can enhance cyclists' perceived safety[22]. Additionally, other factors like traffic volume, weather conditions, and vehicle type in adjacent lanes are also important[23−26]. More specifically, increase in traffic on the adjacent lanes is correlated to a decrease in cyclists' comfort and sense of security[4,24]. Furthermore, Chen et al.[26] revealed that rainy days can substantially influence cyclists' willingness to travel.
Nevertheless, most previous studies neglected detailed comparisons of bicycle infrastructure across different groups of cyclists[7]. In addition, current research falls short of comprehensively understanding cyclists' preferences for guardrails, when latent factors such as personality traits and personal habits are involved. Hence, this study employed a stated preference survey to evaluate the preferences for road guardrails among different groups of cyclists. The objective is to discern differences in guardrail preferences across cyclist subgroups and inform the development of urban roadways and slow mobility infrastructure.
The current paper
-
This study employs a stated choice experiment to assess how bicycle infrastructure design, travel behaviors, and personal attributes impact the safety perceptions and preferences of cyclists when facing three types of guardrails: kicker stone, metal, and warning post guardrails. Different hypothetical scenarios combining five SP attributes including colored pavements, signage, traffic volume, weather conditions, and vehicle type in adjacent lanes are visualized[23]. The influence of personal characteristics including social demographics, past cycling behavior, and self-assessed priorities regarding guardrail facility design attributes are also examined. A random parameter regret-based model is developed to quantify the mentioned factors including colored pavements, traffic volume, and additional variables. The findings offer insights that can inspire the development and planning of bicycle lane guardrail facilities, aimed at boosting cycling participation and enhancing cyclist safety.
-
The microenvironment design of bicycle lanes significantly influence cyclists' willingness to travel, encompassing colored pavements, signage, and physical barriers separating bicycle lanes from motor traffic[22,25,27−29]. For instance, research indicates that implementing colored bicycle lanes not only enhances cyclist safety but also promotes a greater community uptake of cycling[18,21,30].
Moreover, the findings of Olsson & Elldér[23] suggest that the presence of bicycle lane signs enhances cyclists' perception of priority, thereby increasing their inclination to use designated lanes. A study by Knight & Charlton[18] demonstrates that protected lanes with physical barriers significantly enhance cyclist safety and promote greater willingness to use these lanes.
Other factors like traffic volume, weather conditions, and the type of vehicles on the motorway also exerts a significant influence on cycling preferences[23,24,26]. Traffic volume has been shown to be the pivotal factor influencing safety perceptions of cyclists[4,23,25]. Furthermore, weather conditions can impact both the safety and inclination of cyclists to travel. For instance, Chen et al.[26] elucidated how rainfall affects bicycle traffic, leading to decreased flow and reduced willingness among cyclists to travel during such conditions. Regarding the presence of larger vehicles on adjacent lanes, a study by Abadi & Hurwitz[24] revealed that passing large vehicles such as trucks or buses significantly diminish cyclists' sense of security.
The majority of prior studies have concentrated on examining the safety implications of individual micro-environments within bicycle lanes[4,18,23]. Nevertheless, these studies have seldom explored the effects of various combinations of micro-environments on the safety of cycling, it remains unclear how different combinations of micro-environments affect the selection of guardrail types in bicycle lanes.
Social demographics and cycling habits
-
Research indicates that personal characteristics like age, gender, and cycling experience[22,25,31−35] significantly influence both guardrail preference and the perception of riding safety. For instance, younger cyclists are at higher risk of injury during travel compared to their middle-aged counterparts[22,36]. Moreover, research indicates significant differences in riding styles between genders; specifically, female cyclists tend to adopt more conservative riding behaviors compared to their male counterparts[33,34]. Regarding cycling experience, there exist significant differences in vehicle control between novice and experienced cyclists; experienced cyclists demonstrate superior vehicle control and lane-keeping abilities[35].
Previous research has demonstrated the influence of variables such as age, gender, and cycling behavior on cycling safety[35,37]. For instance, Lawson et al.[38] studied the influence of age on cycling safety; Useche et al.[34] investigated the effects of gender on cycling and cycling safety, while Fonda et al.[35] examined the relationship between cyclists' experience and safety during cycling. However, the correlation between variables such as educational attainment and prior history of bicycle accidents have not yet been examined.
-
This experiment adopted the statement preference (SP) survey experiment. The SP survey method can be used to examine individual preferences in a hypothetical environment to allow researchers to investigate a specific experimental environment and to assess the effectiveness of policy strategies that have not yet been set or implemented. In this experiment, it is assumed that participants will encounter three different types of guardrails for their choice when riding in the bicycle lane. Furthermore, these scenarios were organized using a randomized block design, with each of the four blocks containing four distinct choice sets. In addition, a pre-experiment was conducted before the experiment, and a total of 28 questionnaires were collected to check the accessibility of the questionnaire.
In terms of investigation, during the period from September 19, 2023, to October 19, 2023, the Tencent questionnaire platform (
https://wj.qq.com/index.html ) was used to conduct an online questionnaire survey and it was randomly distributed through the platform[39]. The platform recorded the time participants completed the questionnaire and their IP address and user name. Through the background statistics, it took an average of 5 min for participants to complete the answers, the IP address and user name recorded by the platform will be used to prevent repeated answers. In addition, before filling out the questionnaire, participants were informed that the survey is an anonymous survey and will not involve private information, and the survey results are only used for academic research.In this experiment, a total of 849 questionnaires were collected, of which 693 were valid, yielding an effective rate of 82%. Furthermore, upon screening, 156 questionnaires were excluded due to obvious problems in their data, such as a large number of repeated options and failure to correctly answer the robot identification questions.
Stated preference experiment design
-
This study conducted a stated preference experiment to investigate cyclists' preferences among three types of guardrails[19], to evaluate how colored pavements, signs, traffic volume, weather conditions, and adjacent vehicle types affect their choices regarding bicycle lane guardrail facilities. The choice sets for stated preference (SP) was generated based on scenarios encountered in everyday cycling. It is assumed that participants are faced with three different types of guardrails for their choice when riding in the bicycle lane (i.e., kicker stone guardrail, metal guardrail, and warning post guardrail), Table 1 shows the guardrail settings under different pavement options.
Table 1. Attributes and levels considered in the choice experiments.
Kicker stone guardrail Metal guardrail Warning post guardrail No pavement 


Green 


Red 


Participants were required to select one of three options in various design scenarios depicted in visualized scenes. Table 2 illustrates the attributes and corresponding levels investigated in the experiment. The following five attributes: colored pavements, presence of lane signs, traffic volume, weather conditions, and vehicle types of the adjacent lanes. To heighten participant immersion, authentic road images were captured and software utilized to tailor them to experimental specifications. After the SP scenarios, participants were tasked with answering two questions on risk perception for gauging the likelihood and severity of potential accidents. The specific questions were as follows: (1) How serious do you think the consequences of the accident will be in this scenario? (from '1 = not serious' to '7 = very serious' to assess the severity after the accident); (2) To what degree do you think you will be involved in a bicycle-vehicle incident? (from '1 = completely impossible' to '7 = completely possible').
Table 2. Attributes and levels considered in the choice experiments.
Attributes Level Kicker stone guardrail Metal
guardrailWarning post guardrail Colored pavement Level 1 No color Level 2 Red Level 3 Green Traffic volume Level 1 Low Level 2 Moderate Level 3 High Presence of lane signs Level 1 No Level 2 Yes Weather condition Level 1 Shine Level 2 Rain Vehicle type of adjacent Level 1 Conventional vehicle Level 2 Autonomous vehicle Level 3 Large vehicle The experiment has a total of five factors (each factor has two to three attribute levels). Employing a full factorial design would yield 108 combinations, which could potentially overwhelm participants with the sheer number of scenarios and lead to fatigue[40]. Thus, to streamline choices for participants, we used an orthogonal fractional factorial design to reduce scenario choices to 16. Additionally, these scenarios were categorized using a randomized block design into four blocks with each containing four choice sets. Each choice set offers three options corresponding to the varied levels of the five attributes. Table 3 illustrates one selected scenario from the questionnaire.
Table 3. Display of a selected scenario.
Colored pavement Red Traffic volume High Presence of lane sign No Weather condition Rain Vehicle type of adjacent Large vehicles Selection A. Kicker stone guardrail 
B. Metal guardrail 
C. Warning post guardrail 
Perceptional and personal information
-
Besides the aforementioned selection experiment, this questionnaire encompasses: (a) riding behavior (including self-protective measures and frequency of disregarding traffic signals); (b) cycling experience (duration and number of trips); (c) personal details (socio-demographic information). An online questionnaire survey was conducted using the Tencent questionnaire platform from September 19, 2023, to October 19, 2023. The platform will record participants' IP addresses, and users with identical devices and IP addresses cannot submit the questionnaire multiple times. The survey employs an anonymous methodology that excludes personal privacy information, with all collected data strictly earmarked for academic research purposes. Upon completion of the questionnaire, each participant will receive a reward with 5 CNY.
Analytic method
-
The study employs a multinomial logit regression model due to the categorical nature of the dependent variable, which entails more than two unordered outcomes. Furthermore, we employ a panel mixed-method approach to address unobserved heterogeneity and the effects of panel data (i.e., correlation among choice scenarios from the same individual)[41−45].
In the conventional multinomial logit model, the utility function of alternative c in the choice scenario b of individual a is defined as:
$ U_{abc}=(\alpha'+\gamma'_a)z_{abc}+\varepsilon_{abc} $ (1) where, zabc is a vector of variables, α' is a vector of coefficients that represent the mean effects,
${\gamma '_a}$ ${\gamma '_a}$ the probability of k being chosen given
${\gamma '_a}$ $ {P_{abc}}|{\gamma '_a} = \frac{{{e^{\left[ {\left( {\alpha ' + {{\gamma '_a}}} \right){z_{abc}}} \right]}}}}{{\sum\nolimits_{k = 1}^K {{e^{^{\left[ {\left( {\alpha ' + {{\gamma '_a}}} \right){z_{abc}}} \right]}}}} }} $ (2) The unconditional probability is thus:
$ {P_{RUM}} = \int\limits_{{{\gamma '_a}}} {\left( {{P_{abc}}|{{\gamma '_a}}} \right)dF\left( {{{\gamma '_a}}|\tau } \right)} $ (3) where, F is the multivariate cumulative normal distribution.
In the RPRR model, the random regret RRabc of individual a's choice of alternative c in scenario b is given by the following formula (4)[46,47].
$ R{R_{{\text{abc}}}} = \sum\limits_{s \ne c} {\sum\limits_{\forall m} {ln\{ 1 + \exp [(\beta ' + {\rho' _a})({z_{asmb}} - {z_{acmb}})]\} {\varepsilon _{abc}}} } $ (4) where, zacmb is the vector of variables for the chosen alternative c, zasmb is the vector of variables for the unchosen alternative s, β' is the corresponding vector of coefficients (representing the average effect),
${\rho '_a}$ ${\rho '_a}$ Based on regret theory, people tend to prefer expected scenarios and avoid unchosen scenarios that have the potential for less regret than choice scenarios. Avoiding anticipated regret is of particular relevance in participants' behavior rather than pursuing maximum utility[48]. In addition, the probability of c being selected can be regarded as the following formula (5)
$ {P_{abc}} = \frac{{{e^{ - R{R_{abc}}}}}}{{\sum\nolimits_{k = 1}^K {{e^{ - R{R_{abc}}}}} }} $ (5) The unconditional probability can be expressed as formula (6).
$ {P_{{\text{ac}}}} = \int_{\rho' _a} {({P_{abc}}|\rho' _a)dF(\rho' _a|\sigma )} $ (6) where, F is the multivariate cumulative normal distribution. For the choice of individual a, the likelihood function conditional on
$ {\rho }_{a} $ $ {L_{\text{a}}}(\alpha |{\rho _a}) = \prod\nolimits_{b = 1}^B {\left[\prod\nolimits_{c = 1}^C {{{\{ {P_{abc}}|{\rho _a}\} }^{{\delta _{abc}}}}} \right]} $ (7) where
$ {\delta }_{abc} $ Finally, the form of the unconditional likelihood function is as follows:
$ {L_{\text{a}}}(\alpha ,\sigma ) = \int_{{\rho _a}} {{L_a}(\alpha |{\rho _a})dF({\rho _a}|\sigma )} $ (8) This study conducted parameter estimation for the proposed stochastic parameter model. A parameter is classified as random if its standard error is statistically significant at the 10% significance level. The model was estimated using a simulated maximum likelihood with 300 Halton plots. Additionally, a stepwise iterative approach was employed to assess the random parameters[49].
-
A total of 693 valid questionnaires were collected from participants. The participants' characteristics are summarized in Table 4. Overall, the ratio of males to females was 904 to 1,000. This aligns with China's population male-to-female ratio of 1050:1000[50]. Regarding age distribution, participants aged between 20 and 24 years old constituted over one-third (35.6%), surpassing the proportion of the Chinese population within the same age range (5.2%). Furthermore, participants aged over 50 accounted for only 3.4%, much lower than that of the Chinese population (21.6%). This disparity may be attributed to the large proportion of students in our sample. Additionally, cycling, especially competitive cycling, might appeal more to the younger population, thereby skewing the results. Moreover, since the survey was conducted electronically, it may have biased the sample towards younger individuals.
Table 4. Summary of participant characteristics.
Variable Attribute Count Percentage Proportion in
China populationSex Male 329 47.5% 51.2% Female 364 52.5% 48.8% Age (year) ≤ 19 23 3.3% NA 20−24 247 35.6% 5.2% 25−29 203 29.3% 6.1% 30−39 135 19.5% 15.9% 40−49 61 8.8% 14.3% 50−59 19 2.7% 16.9% ≥ 60 5 0.7% 28.9% Education level Junior high school and below 15 2.2% 34.7%* Senior high school 77 11.1% 16.7% Tertiary education 433 62.5% 17.9% Postgraduate and above 168 24.2% 0.9% Marital status Unmarried 496 71.6% 19.4% Married 197 28.4% 72.6% Occupation Full-time 369 53.2% 85.5% Student 217 31.3% 14.5% Not working
full-time/retired107 15.4% NA Monthly revenue (CNY) ≤ 4,000 253 36.5% NA 4,000−5,999 137 19.8% 6,000−7,999 129 18.6% 8,000−9,999 116 16.7% ≥ 10,000 58 8.4% Riding speed (km/h) ≤ 5 158 22.8% NA 6−9 291 42.0% 7−15 177 25.5% ≥ 16 67 9.7% Number of bike rides (per week) No cycling 64 9.2% NA 1−3 245 35.4% 3−6 181 26.1% ≥ 7 203 29.3% Cycling time (h/week) ≤ 1 191 27.6% NA 1−3 234 33.8% 3−6 164 23.7% ≥ 7 104 15.0% Mobile phone usage while riding (h/week) 0 351 50.6% NA 1−2 199 28.7% 3−4 75 10.8% ≥ 5 68 9.8% Red light running while riding (h) 0 493 71.1% NA 1−2 132 19.0% 3−4 57 8.2% ≥ 5 11 1.6% Involved in traffic accidents Yes 79 11.4% NA No 619 89.3% Proficiency Beginner level 39 5.6% NA Normal level 280 40.4% Proficiency level 374 54.0% NA means Not available. This shows that there is no data published in the official. Regarding educational attainment, the majority of participants (86.7%) have attended or completed college or higher education, significantly exceeding the corresponding proportion in the Chinese population (18.8%)[50]. This disparity may be attributed to the large number of participants with postgraduate qualifications. Additionally, the cause of this phenomenon may also stem from the fact that the research was conducted by a university, where the student population naturally serves as a convenient sample. Regarding marital status, 71.6% of participants were unmarried, and 28.4% were married. Again, it does not align with the Chinese population. Regarding occupation, 53.2% of participants were full-time workers, 31.3% were students, and 14.7% were engaged in other jobs or retired, which is not consistent with the proportions in the Chinese population[50]. Among participants, 35.4% rode 1−3 times weekly, and 33.8% rode 1−3 h weekly.
The above difference indicates the sample is skewed from the total population, which might affect the implication and generalization of the results.
-
Given that each questionnaire contains four selection scenarios, the total number of observations amounts to 693 × 4 = 2,772. As shown in Fig. 1, across these 2,772 scenarios, participants chose kicker stone guardrails, metal guardrails, and warning posts in quantities of 206 (7.4%), 1,964 (70.9%), and 602 (21.7%), respectively. The following figure illustrates the distribution of selected guardrail types among participants. Firstly, all participants in this experiment are from China. In China, the majority of non-separable guardrails are metal guardrails, making them more common and acceptable to the public. Additionally, metal guardrails offer better closure, whereas the closure of warning posts and kicker stone guardrails is less effective[51]. Finally, the height of the guardrail is also related to the safety of road users. Among the three types of guardrails, the kicker stone guardrails have the lowest height and is the least likely to attract attention.[12].
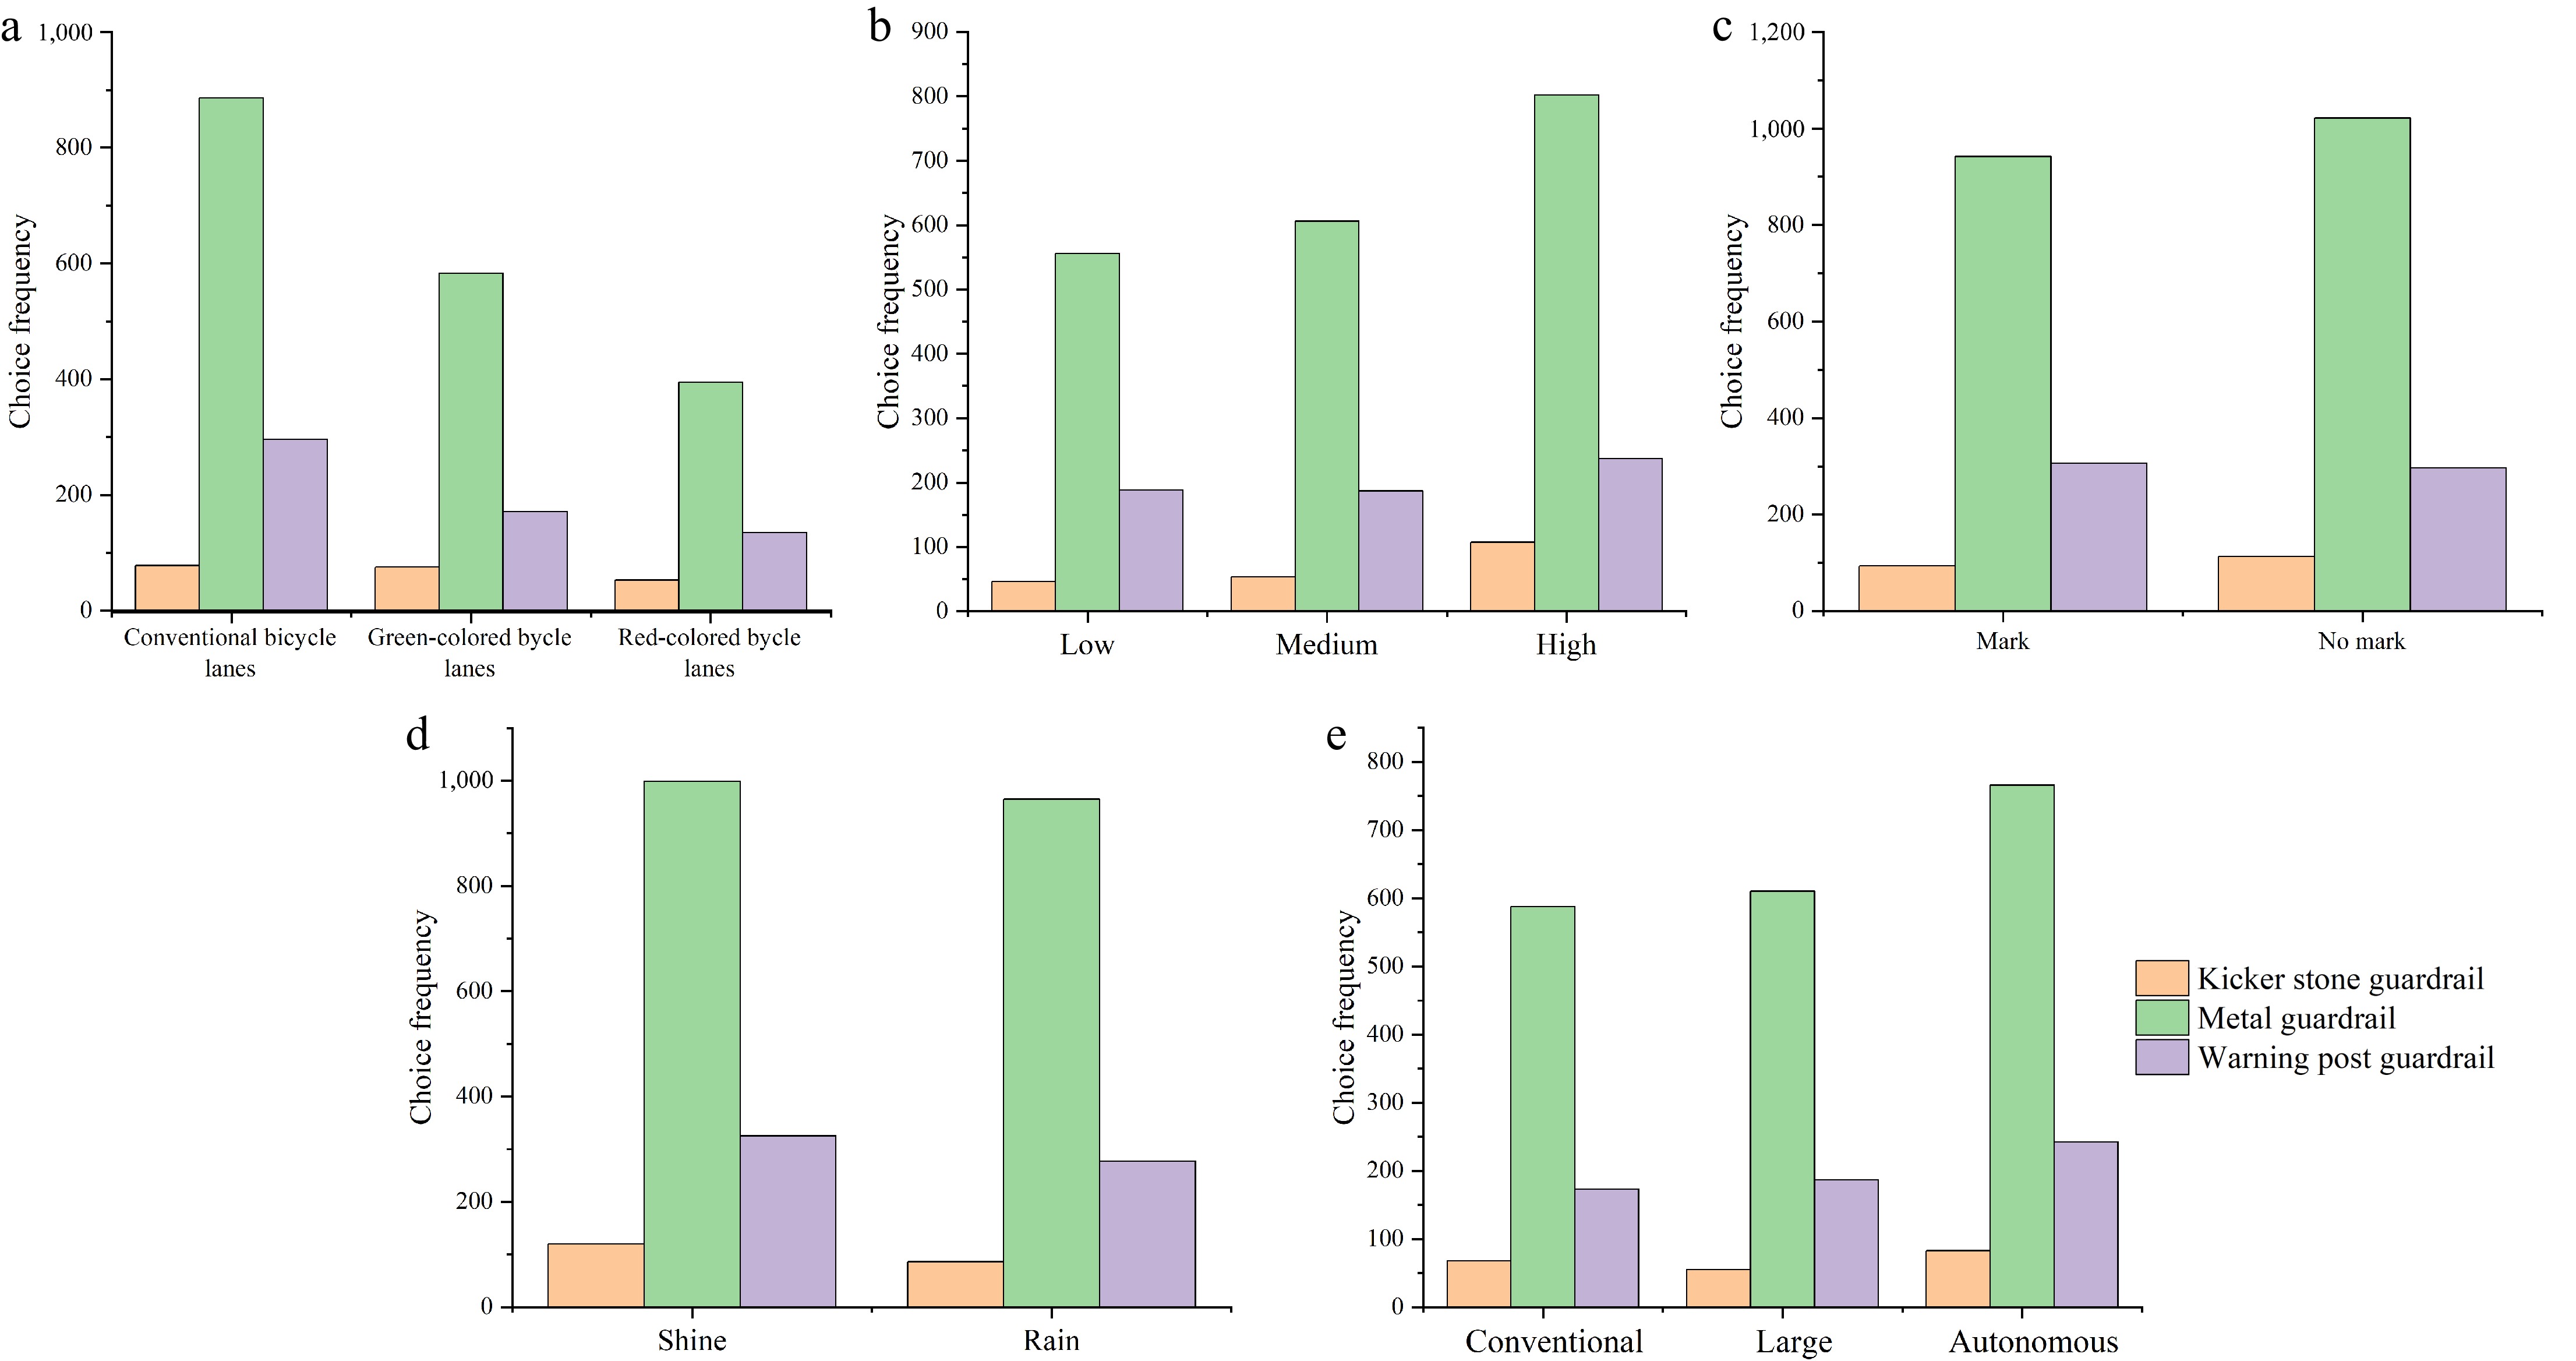
Figure 1.
Descriptive statistics. (a) Colored pavement, (b) traffic volume, (c) lane sign, (d) weather, and (e) vehicle type of adjacent.
Figure 2 shows the likelihood of selecting metal guardrails is 70.1%, adjacent vehicle type lane by kicker stone guardrails with 24.9%, and warning post guardrails with only 5%. From the perspective of comprehensive ranking, most participants believe that metal guardrails are the most preferred among the three kinds of guardrails, followed by kicker stone guardrails, and warning pillar guardrails.
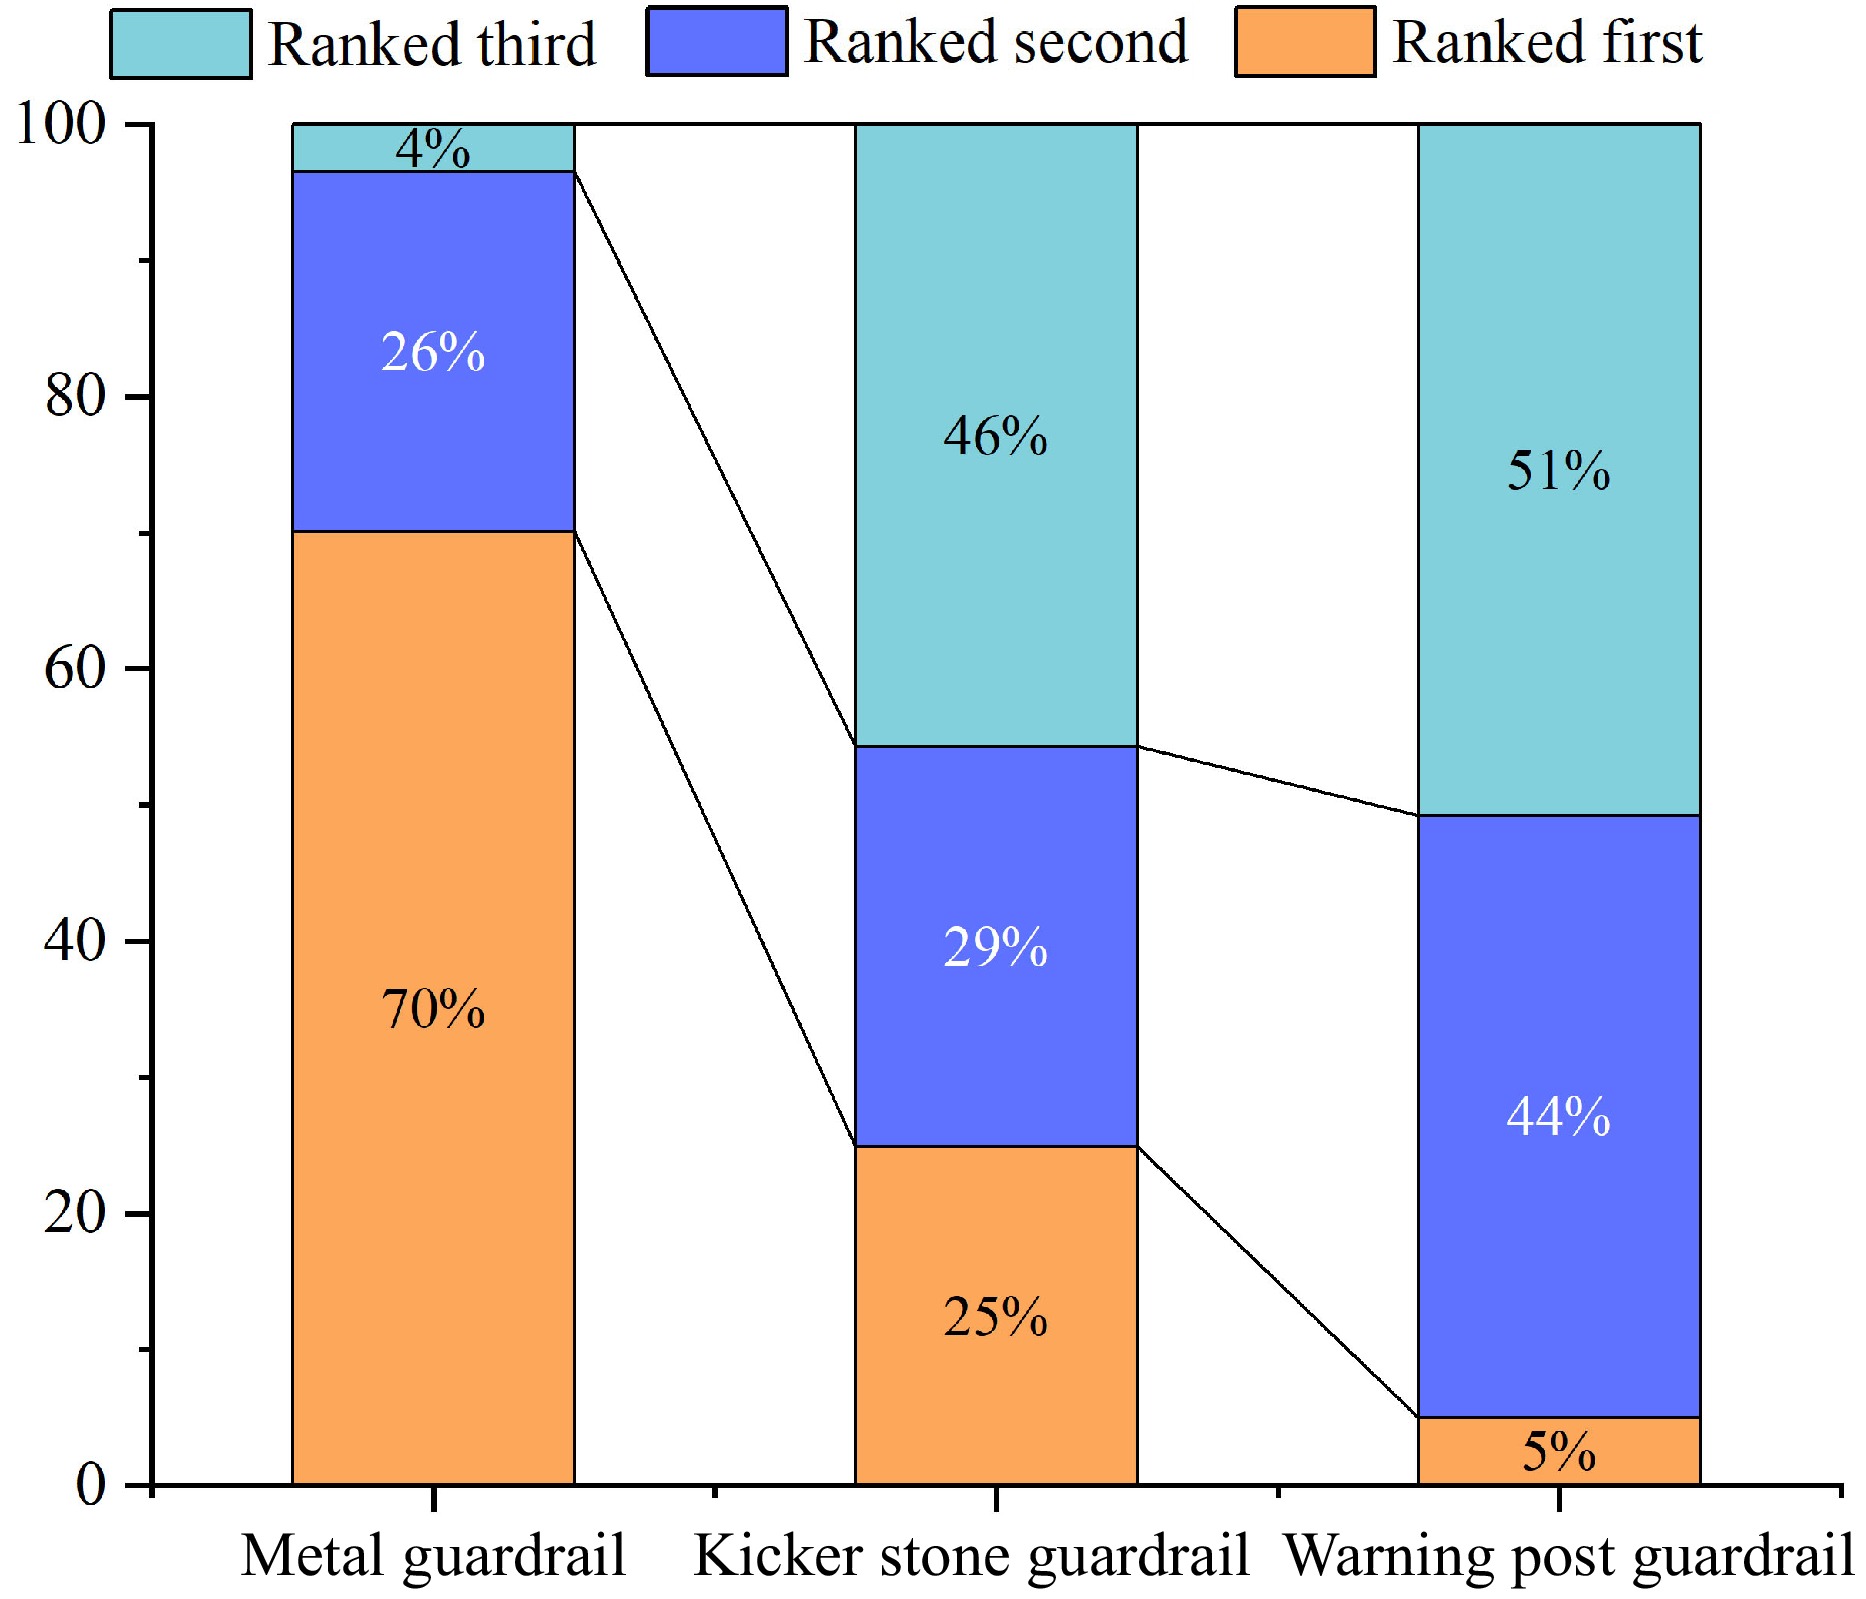
Figure 2.
Guardrail safety ranking chart.
As shown in Fig. 3, in terms of the color design of bicycle lanes, participants generally believe that cycling on red bicycle lanes is safer, followed by green bicycle lanes, and unpainted bicycle lanes.
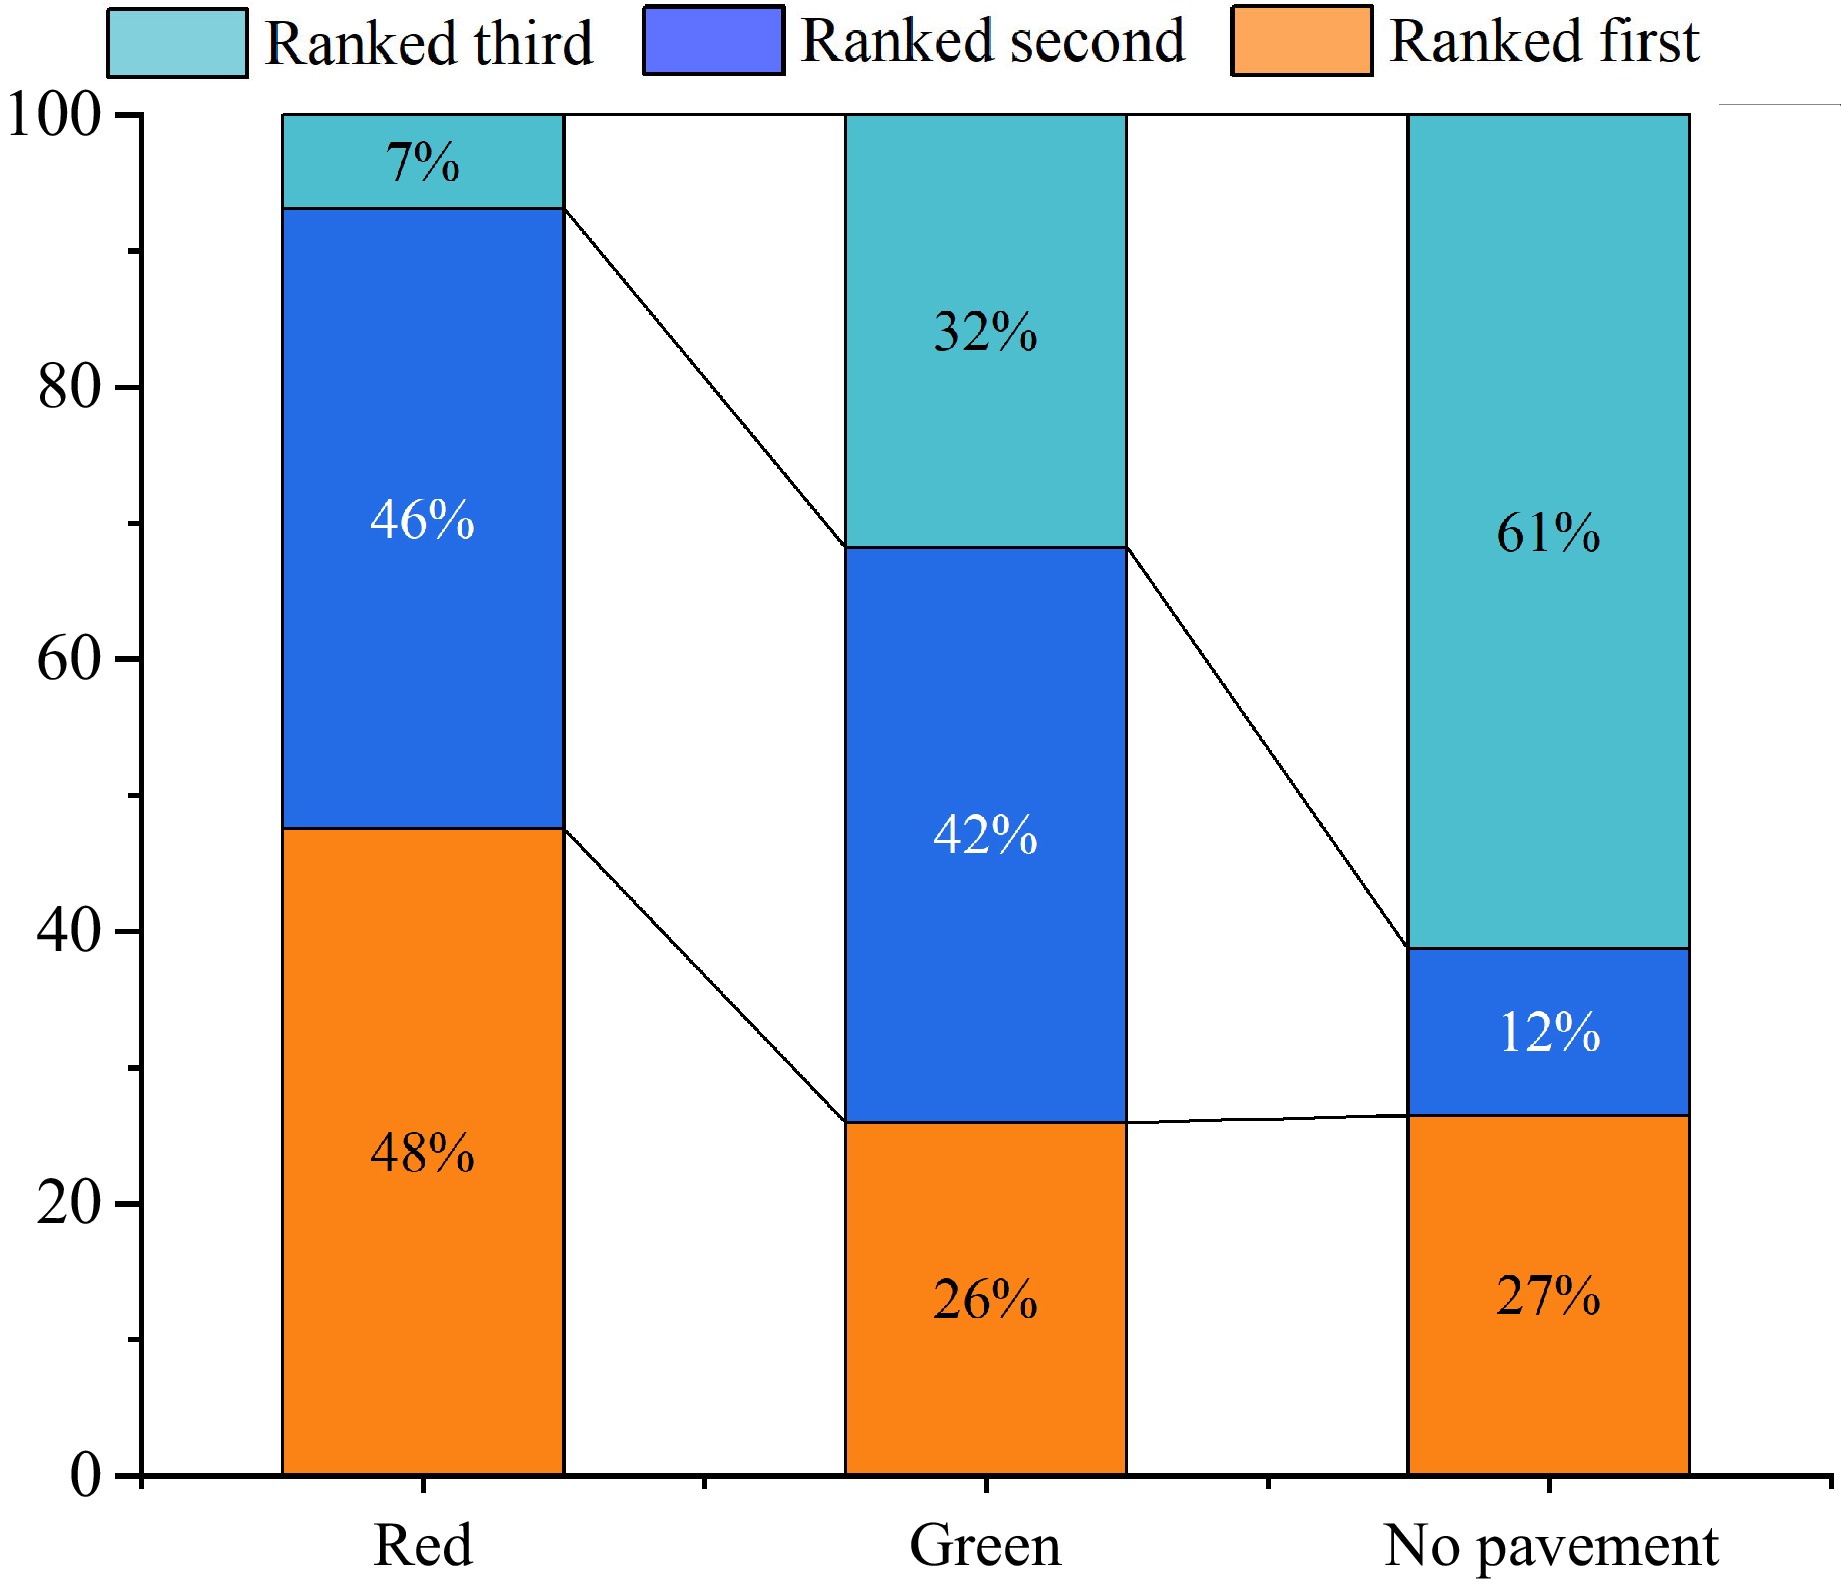
Figure 3.
Colored pavement safety ranking.
Moreover, 95.1% of respondents expressed a heightened sense of safety when cycling in lanes equipped with standardized non-motorized vehicle lane signs. Table 5 provides a comprehensive overview of pedestrians' perspectives regarding various types of guardrails and the factors influencing them. Concerning the installation of kicker stone guardrails, cyclists emphasize the critical importance of riding skill proficiency, non-motorized vehicle lane width, and the presence of lane signs. Participants emphasize that riding proficiency is pivotal for safety on non-motorized vehicle lanes equipped with kicker stone guardrails. Regarding roads featuring metal guardrails, participants underscore the significance of guardrail height and width. Furthermore, participants stressed that the height of warning post guardrails is paramount for ensuring riding safety.
Table 5. Importance and preference of design and environmental factors.
Mean St. d Kicker stone guardrail Importance (1-unimportant, 7-very important) Proficiency in cycling skills 5.56 1.72 Bicycle lane width 5.89 1.43 Bicycle vehicle sign 5.83 1.54 Metal guardrail Guardrail width 5.34 1.81 Guardrail height 5.51 1.62 Bicycle lane width 5.87 1.37 Bicycle vehicle sign 5.86 1.44 Warning post guardrail Warning post height 5.55 1.62 Bicycle lane width 5.87 1.34 Bicycle vehicle sign 5.88 1.44 This study involved participants providing their views on the impact of guardrails on cycling safety, assessed using a 7-point Likert scale. Specifically, a rating of 7 indicated that participants perceived guardrails as significantly impacting cycling safety, whereas a rating of 1 indicated minimal impact. Based on survey findings, the average score for this item was 5.7, suggesting that participants perceive guardrails to have a substantial impact on cycling safety.
Model estimation results
-
This study employs a regret-based panel mixed multinomial logit model to investigate the relationships between various factors and different bike lane guardrail configurations. For random parameters of the coefficients, typical probability distributions were examined, encompassing the normal distribution, Gumbel distribution, and lognormal distribution. The ensuing table encapsulates the outcomes of the parameter estimation: (1) Option 2: metal guardrail; (2) Option 3: warning post guardrail. During the model development phase, 300 Halton draws were employed in the simulated maximum likelihood estimation process[41]. Table 6 shows the results of the panel mixed multinomial logit model for the rider's choice of guardrail facilities. Table 7 illustrates the marginal effects of parameter estimation of the panel mixed multinomial logit model.
Table 6. Parameter estimation results for multinomial logit model.
Scope of work Factor Attribute RPRU model (omitted choice: kicker stone guardrail) RPRR model (omitted choice: kicker stone guardrail) Metal guardrail Warning post guardrail Metal guardrail Warning post guardrail Coefficient S.E. Coefficient S.E. Coefficient S.E. Coefficient S.E. Constant 2.67*** 0.9 IS 2.07** 0.98 IS SP attributes Colored pavement (omitted category: No color and red) Green IS Mean 0.27 IS Mean 0.13 SD 0.22*** SD 0.15*** Lane sign (omitted category: Yes) No −0.25* 0.13 −0.43** 0.21 −0.16* 0.08 −0.27* 0.14 Traffic volume (omitted category: less and medium) More IS 0.65** 0.26 IS 0.45** 0.22 Demographic
factorsAge (omitted category: middle-aged) Youth 0.62*** 0.14 0.44** 0.21 0.42*** 0.08 0.30* 0.16 Educational level (omitted category: postgraduate and above) Junior high
school and below−0.38** 0.17 0.71*** 0.23 −0.24** 0.11 0.49*** 0.17 Riding
habitRiding time (omitted category: moderate) Seldom 0.48** 0.21 IS 0.33*** 0.12 IS Number of riding trips (omitted category: frequently) Seldom −0.72*** 0.25 IS −0.46*** 0.13 IS Moderate Mean 0.05 IS Mean 0.13 IS SD 0.20*** SD 0.15*** Have there been any non-motor vehicle accidents (omitted category: yes) No IS −1.64*** 0.25 IS −1.01*** 0.16 Frequency of running red light (omitted category: frequently) Seldom −1.80** 0.76 IS −1.10* 0.57 IS Moderate −1.64** 0.79 IS −1.02* 0.58 IS Risk
Perception
factorsPossibility of accidents (omitted category: moderate) Minor 0.30* 0.18 IS 0.21** 0.11 IS Serious IS 0.76*** 0.22 IS 0.53*** 0.18 Severity of the accident (omitted category: serious) Minor 0.33* 0.19 0.60* 0.33 0.23* 0.12 0.41* 0.23 Moderate IS 0.40* 0.23 IS 0.27* 0.16 Log-likelihood at zero (LL (0)) −3045.35326 −3045.35326 Log-likelihood at convergence (LL(β)) −2112.6678 −2112.6678 McFadden Pseudo R-square 0.38 0.38 AIC 3881.9 3885.2 *** is statistically significant at the 1% level; ** is statistically significant at the 5% level; * is statistically significant at the 10% level; IS indicates not significant. Table 7. Marginal effects of parameter estimation of the panel mixed multinomial logit model.
Variable description Marginal effects Metal guardrail Warning
post guardrailColored pavement Green (1 if yes, 0 otherwise) [WPG] −0.011 0.016 Lane sign Lane sign (1 if no, 0 otherwise) [MG] −0.061 0.014 Lane sign (1 if no, 0 otherwise) [WPG] 0.025 −0.036 Traffic volume More (1 if yes, 0 otherwise) [WPG] −0.013 0.019 Age Youth (1 if yes, 0 otherwise) [MG] 0.032 −0.008 Youth (1 if yes, 0 otherwise) [WPG] −0.006 0.008 Educational level Senior high school (1 if yes, 0 otherwise) [MG] −0.010 0.004 Senior high school (1 if yes, 0 otherwise) [WPG] −0.007 0.010 Riding time Seldom (1 if yes, 0 otherwise) [MG] 0.018 −0.004 Number of riding trips Seldom (1 if yes, 0 otherwise) [MG] −0.0129 0.002 Moderate (1 if yes, 0 otherwise) [MG] −0.030 0.006 Have there been any non-motor vehicle accidents No accidents (1 if yes, 0 otherwise) [WPG] 0.046 −0.068 Frequency of running red light Seldom (1 if yes, 0 otherwise) [MG] −0.025 0.010 Moderate (1 if yes, 0 otherwise) [MG] −0.025 0.010 Possibility of accidents Minor (1 if yes, 0 otherwise) [MG] 0.007 −0.001 Serious (1 if yes, 0 otherwise) [WPG] −0.014 0.021 Severity of the accident Minor (1 if yes, 0 otherwise) [MG] 0.011 −0.002 Minor (1 if yes, 0 otherwise) [WPG] −0.004 0.005 Moderate (1 if yes, 0 otherwise) [WPG] −0.006 0.008 Parameters defined for: MG, metal guardrail; WPG, warning post guardrail. Statement preference attributes
-
Regarding the colored pavement of bicycle lanes, green lanes are positively correlated with the choice of warning post guardrails (β = 0.57) at the 1% level of significance. When the colored pavement of bicycle lanes is green, the probability of selecting the warning column guardrail will increase by about 1.6%. Lastly, the heterogeneity in both the mean and variance were taken into account. For colored pavements, green demonstrates a significantly higher variance in random parameters compared to other colors, with a significance level of 1%. The present findings corroborate previous research indicating that microenvironmental factors, such as colored pavements and traffic volume, are critical determinants of cyclist safety[4,23,25,29,52].
Colored lanes positively impact cycling safety, possibly due to their enhanced visibility. On the other hand, the absence of bicycle lane signs on the lane significantly reduces the likelihood of choosing metal guardrails and warning post guardrails (metal guardrails: −0.16; warning post guardrails: −0.27) by a margin at the 10% level compared to lanes with signs. This implies that cyclists would prefer to ride in lanes that have signs for bicycles, consistent with the findings of Olsson & Elldér[23]. This phenomenon is attributed to the presence of clear lane markings, which reinforces cyclists' sense of right of way and enhances their subjective safety[2].
In terms of traffic conditions, cyclists are more likely to choose warning post guardrails when traffic volume is high (0.53), at the 5% level. According to the marginal effects, when the traffic flow is large, the probability of participants choosing the warning column guardrail will increase by about 2%. According to Branion-Calles et al., increased traffic volume leads to a diminished sense of security among cyclists and subsequently reduces the frequency of their trips[31]. This suggests that reducing the number of cars in urban areas can effectively enhance the perceived safety of cyclists[31]. A reduction in vehicle volume enhances cyclists' perceived safety, which, in turn, encourages more cycling and further improves overall cycling safety[28].
Demographic factors
-
In terms of individual characteristics, younger cyclists exhibit a significantly higher propensity to choose metal guardrails (0.42) compared to older adults, at the 1% level of significance. According to the marginal effects, when the participants are younger (18−24 years), the probability of choosing a metal guardrail increases by about 3.2%. Additionally, there is a positive relationship between younger cyclists and the choice of warning post guardrails (0.30), at the 10% level. In contrast, respondents with high school education level show a lower tendency to choose metal guardrails (−0.24), at the 5% level of significance. However, their tendency to choose warning post guardrails (0.49) is significantly higher than that of those who have a masters degree, at the 1% level of significance. According to the marginal effects, when the participants' educational background is senior high school, the probability of them choosing the warning post guardrail increases by about 1%.
The study reveals that both age and educational background significantly influence the choice of guardrail types. Results indicate that participants aged 18-24 exhibit a stronger inclination towards selecting metal or warning post guardrails compared to middle-aged and older groups. This observation aligns with previous findings that participants tend to opt for safer, segregated facilities while cycling[22,53,54]. Regarding educational background, high school students are more likely to prefer warning post guardrails. This preference may stem from high school students' tendency to cross streets while riding, with metal guardrails offering more restrictive barriers compared to warning post guardrails[32].
Riding habits
-
In terms of travel habits, cyclists with shorter riding durations are more inclined to choose metal guardrails (0.33), at the 1% level. Regarding the frequency of cycling trips, there is a negative correlation between cyclists who ride less frequently (fewer than once per week) and the choice of metal guardrails (−0.46) at the 1% level of significance. Conversely, cyclists with a moderate frequency of trips (more than once but fewer than three times per week) are significantly more likely to choose metal guardrails (1.17) compared to those who ride more frequently, at the 1% level. Additionally, the heterogeneity of variance and mean were also considered. Regarding the frequency of cycling trips, the variance of random parameters is notably higher for moderate frequencies compared to other frequencies, also at a significance level of 1%.
In contrast, cyclists who have not experienced a traffic accident while riding are less likely to choose metal guardrails (−1.01) compared to those who have been involved in accidents, also at the 1% level of significance. Additionally, there is a negative correlation between cyclists who rarely run red lights (fewer than two times) and the choice of metal guardrails (−1.10) at the 10% level. Similarly, cyclists who moderately violate red lights have a lower tendency to choose metal guardrails (−1.02) at the 10% level of significance. According to the marginal effect, when participants have less weekly riding time, their probability of choosing metal guardrails increases by approximately 1.8%. When participants cycle a moderate number of times per week, their probability of choosing metal guardrails decreases by approximately 3.0%.
The present results confirm previous research by Branion-Calles et al.[31], which demonstrated that infrequent cyclists tend to prefer bike lanes with metal guardrails, likely due to the enhanced rigidity and protective qualities of these guardrails. In the present study, this preference may be linked to perceptions of safety associated with bicycle infrastructure and traffic volume. Additionally, participants who have not experienced a non-motor vehicle accident exhibits a 1.3% reduction in the probability of choosing a metal guardrail. Furthermore, participants who encounter fewer red lights have an increased probability of choosing a warning post guardrail by approximately 5.9%. The results indicated that cyclists who had committed a red-light violation were more likely to choose a metal guardrail[55]. This maybe because these participants perceive that metal guardrails offer stricter road closures.
Risk perception factors
-
In terms of cyclists' self-assessment of safety perception. Cyclists who perceive a higher likelihood of an accident occurring in the current scenario are positively correlated with the choice of warning post guardrails (0.53) at the 1% level of significance. Conversely, when cyclists perceive a lower likelihood of an accident occurring, they are more inclined to choose metal guardrails (0.21) at the 5% level. On the other hand, when cyclists perceive that the severity of an accident in the current scenario would be low, they are more likely to choose both metal and warning post guardrails (metal guardrails: 0.23; warning post guardrails: 0.41), with this tendency being significantly higher at the 10% level compared to situations where the perceived severity is greater. When the perceived severity of an accident is moderate, there is a positive correlation with the choice of warning post guardrails (0.27) at the 10% level of significance.
According to the marginal effect, when participants believe that the possibility of an accident is serious, the probability that they choose the warning post guardrail will increase by about 2.1%. When the participants think that the severity of the accident is minor, the probability that they choose the metal guardrail will increase by about 1.1%.
Impact of traffic volume and colored pavements on guardrail selection
-
Figure 4 illustrates the predicted probabilities of cyclists selecting different guardrail types based on various combinations of colored pavements and traffic volumes according to the regret-based model. As depicted in the figure, the probability of selecting 'warning column guardrails' is significantly affected by variations in traffic volume and colored pavements. Specifically, when the colored pavement is green and traffic volume rises, cyclists demonstrate a higher propensity to choose 'warning column guardrails'.
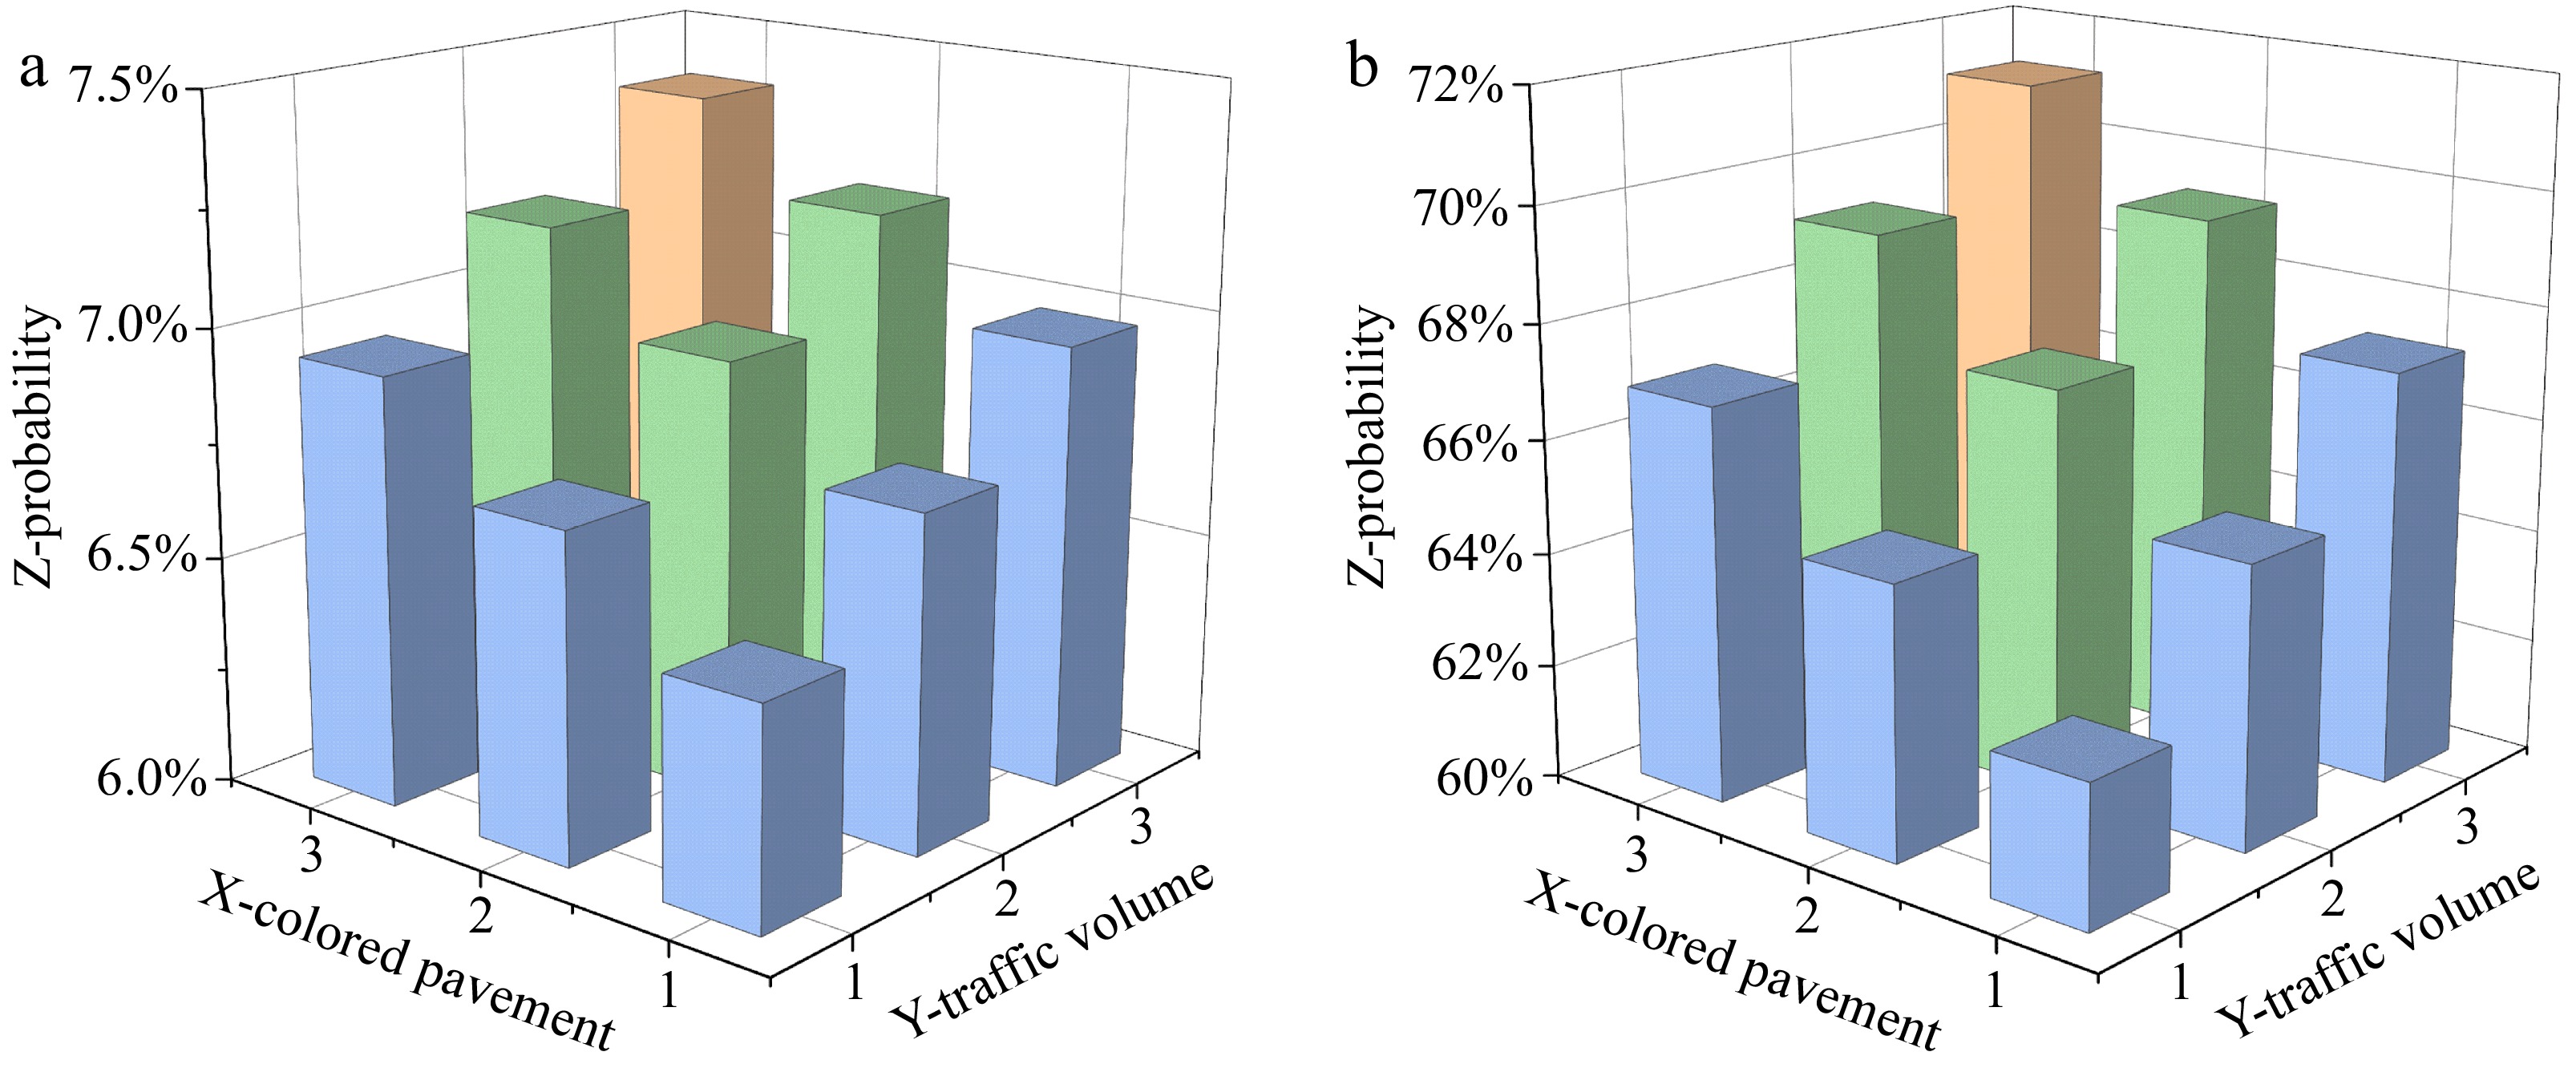
Figure 4.
The impact of traffic volume and colored pavement on guardrail selection. (a) Option 2: metal guardrail. (b) Option 3: warning post guardrail.
Colored pavements exhibit a positive correlation with the selection of metal and warning post guardrails, suggesting that these guardrails are favored over kicker stone guardrails on colored lanes. The findings are consistent with that of Garber et al.[56], which asserts that cyclists experience increased safety when riding in protected lanes. Consequently, as traffic volume increases and road congestion intensifies, cyclists encounter increased cycling risks[19]. According to the marginal effects, when the colored pavement is green, participants will increase the probability of selecting the warning post guardrail. In addition, when the traffic flow is high, the probability of selecting the warning column guardrail will increase by about 1.9%. This is probably the use of 'warning post guardrails' as isolation barriers on bicycle lanes, due to their strong color contrast with the colored road, which enhances motor vehicle drivers' ability to discern cyclists' paths, thus reducing the likelihood of accidents between cyclists and vehicles. This may also be a key reason for the preference for 'warning post guardrails' among cyclists.
As illustrated in Fig. 4a, the probability of cyclists selecting 'metal guardrails' (Option 2) is lower compared to 'warning post guardrails' (Option 3). An eye-catching guardrail color provides motor vehicle drivers with a clearer sense of boundary. The vivid color of 'warning post guardrails' aids motor vehicle drivers in identifying cyclists' riding areas, thereby reducing the incidence of conflicts between cyclists and vehicles[2]. These findings provide a novel perspective for future research on cyclist safety and serve as a new reference for the planning and management of urban traffic calming systems.
Influence of colored pavements and lane signs on guardrail selection
-
Figure 5 illustrates the probability of selecting a warning post guardrail in relation to colored pavements and lane signs. Given various combinations of colored pavements and lane signs, cyclists exhibit a higher preference for the 'warning post guardrail'. The probability of selecting the 'warning post guardrail' is maximized when the lane is green and features lane signs. This suggests that cyclists experience a heightened sense of security when riding on a green lane with lane signs, consistent with the findings of Olsson & Elldér[23]. This phenomenon is attributed to the presence of clear lane signs, which reinforces cyclists' sense of right of way and enhances their subjective safety[2]. Furthermore, colored lanes enhance cyclists' psychological awareness, reduce the objective risk associated with drivers' inattention, and improve cyclists' safety perception by modifying color saturation[28,30].
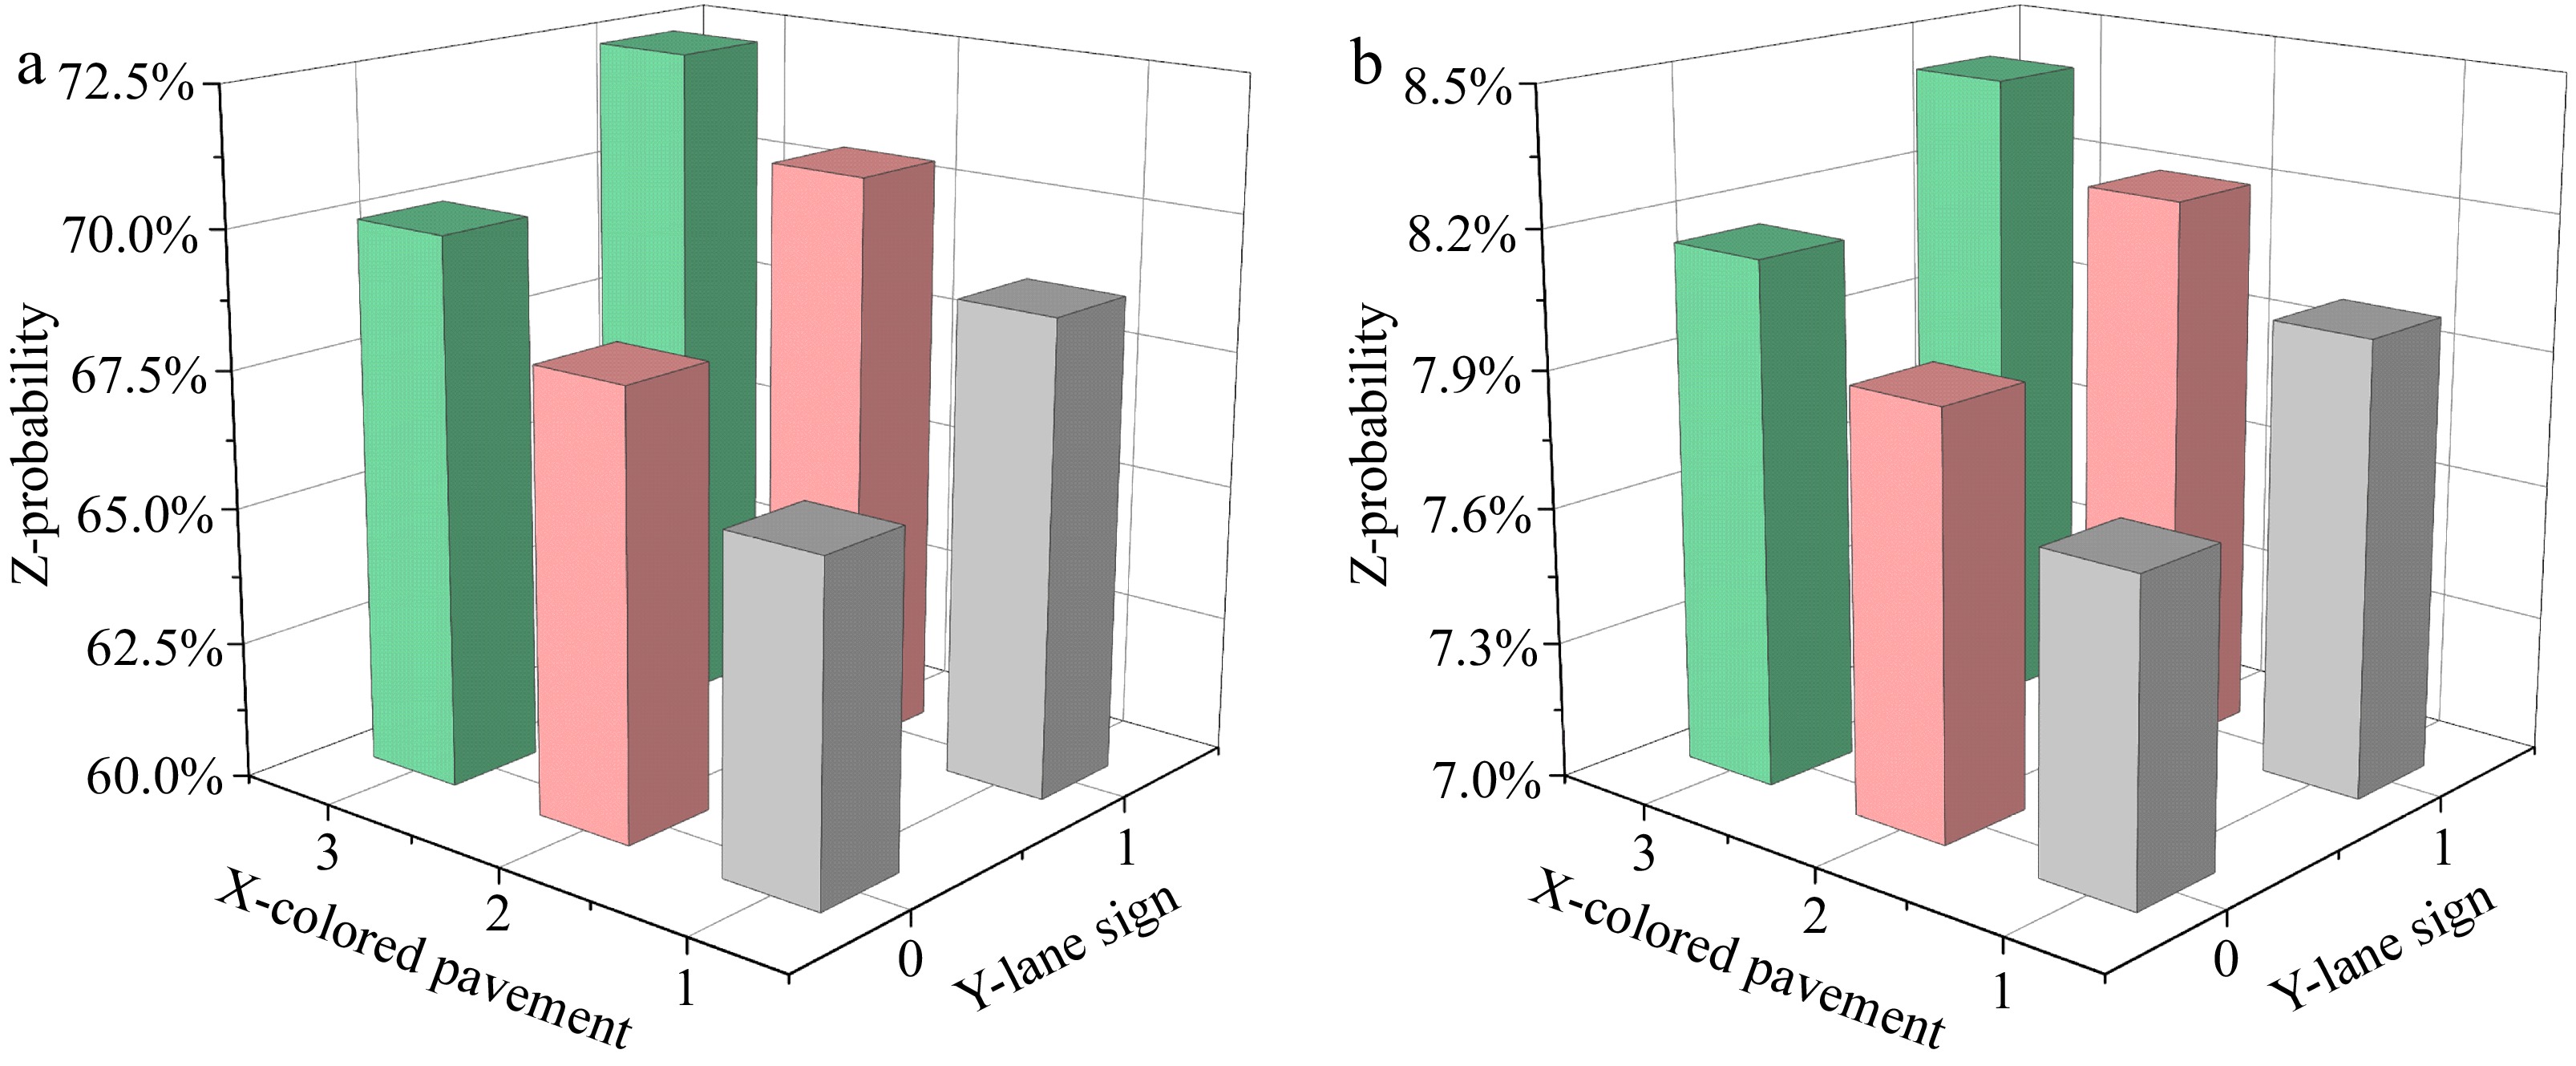
Figure 5.
Influence of lane signs and colored pavements on guardrail selection. (a) Option 2: metal guardrail. (b) Option 3: warning post guardrail.
Figure 5a & b demonstrate that the probability of selecting 'warning post guardrail' (Option 3) is higher, indicating that cyclists perceive 'warning post guardrail' (Option 3) as providing a greater sense of security in the same scenario. The study by Karlsen & Fyhri[21] has shown that lanes of different colors provide varying levels of security for cyclists. Their findings indicate that cyclists favor green lanes over uncolored lanes in certain areas, a trend that aligns with the results of the present study. When the colored pavement is green, participants will be more inclined to choose the warning post guardrail. In addition, when there is no lane signs in the lane, the probability of choosing a metal guardrail decreases by 6.1%. This preference is attributed to the fact that most bicycle lanes in the country are uncolored, making green lanes more popular[21,57]. When modifying or enhancing bicycle infrastructure, incorporating features such as eye-catching guardrails, colored pavements, and clear lane signs can significantly improve cyclists' sense of safety. Research conducted by Vera-Villarroel et al.[30] indicated that cycling on colored lanes enhances participants' sense of safety. This study identified several notable phenomena. The absence of bicycle lane signage led to a higher preference for colored bicycle lanes among participants, aligning with the findings of von Stülpnagel & Binning[22] This phenomenon can be attributed to the fact that colored lanes delineate a clear riding area for cyclists, thereby boosting their confidence and drawing the attention of vehicle drivers[21,28].
-
This study employed a choice experiment methodology to examine the influence of various factors including colored pavements, traffic volume, lane signs, vehicle types of adjacent lanes, weather conditions, and personal characteristics on the selection of guardrail types for bicycle lanes. Initially, the study assessed the effects of different demographic groups on guardrail selection across varying road micro-environments. Subsequently, a panel mixed multinomial logit model was developed, incorporating a random regret minimization approach to evaluate associations while accounting for unobserved heterogeneity and panel data considerations.
The results indicate that cyclists exhibit heightened sensitivity to the presence of lane signs when selecting roads equipped with metal guardrails or warning post guardrails. Cyclists are more inclined to select roads with warning bollards when riding on colored lanes, such as those painted green. Furthermore, traffic volume influences cyclists' guardrail preferences. Specifically, as traffic volume increases, warning bollards emerge as the preferred choice among cyclists. Additionally, both age and education level are significantly associated with guardrail preferences. Finally, personal characteristics also influence guardrail selection, with beginners being more likely to opt for metal guardrails. Participants who have previously been involved in non-motor vehicle accidents are less inclined to select warning bollards.
However, the present study still has several limitations. First, the results fully rely on self-reported data without supplementary data like real-world experiments, this could limit the validation of the findings. Second, the distribution of the sample is skewed from the population, it is very difficult to collect sufficient data from elderly people. Finally, the personality traits and psychological factors were less considered. Also, the study only considered cyclists when collecting data, this may lead to differences in the sample distribution collected and the population distribution in China.
This work was supported by the National Natural Science Foundation of China (Grant Nos 71971073, 52272345, 52302432), Science and Technology Plan Project of the Housing Urban and Rural Construction in Anhui Province (Grant No. 2023-YF095), Natural Science Foundation in Anhui Province (Grant No. 23080850E189), Key research and development projects of Anhui Province (Grant No. 202304a05020050), Fundamental Research Funds for the Central Universities of China (Grant Nos JZ2022HGQA0123, JZ2023HGTA0192).
-
The authors confirm contribution to the paper as follows: study conception and design: Sun Y, Zhu D; data collection: Sun Y, Zhu D and Feng Z; analysis and interpretation of results: Sun Y, Feng Z, Zhu D; draft manuscript preparation: Sun Y, Feng Z, Zhu D. All authors reviewed the results and approved the final version of the manuscript.
-
The datasets generated during and/or analyzed during the current study are available from the corresponding author on reasonable request.
-
The authors declare that they have no conflict of interest. Zhongxiang Feng is the Editorial Board member of Digital Transportation and Safety who was blinded from reviewing or making decisions on the manuscript. The article was subject to the journal’s standard procedures, with peer-review handled independently of this Editorial Board member and the research groups.
- Copyright: © 2025 by the author(s). Published by Maximum Academic Press, Fayetteville, GA. This article is an open access article distributed under Creative Commons Attribution License (CC BY 4.0), visit https://creativecommons.org/licenses/by/4.0/.
-
About this article
Cite this article
Sun Y, Feng Z, Zhu D. 2025. Evaluation of cyclists' preference on guardrails on urban roads: a stated choice analysis based on a panel mixed regret-based model. Digital Transportation and Safety 4(1): 10−20 doi: 10.48130/dts-0024-0026 

Evaluation of cyclists' preference on guardrails on urban roads: a stated choice analysis based on a panel mixed regret-based model
- Received: 05 September 2024
- Revised: 19 November 2024
- Accepted: 25 November 2024
- Published online: 31 March 2025
Abstract: Cycling as a sustainable mode of transport has become more prominent in urban settings. However, the design of bicycle infrastructure, particularly the setup of guardrails, directly impacts cyclists' sense of security and comfort. This study assessed cyclists' preferences for different types of guardrails and how these guardrails influence perceived safety and comfort through a stated choice experiment. Cyclists were asked to choose among stepping stone guardrails, metal guardrails, and warning post guardrails under varying hypothetical scenarios, considering factors such as colored pavements, traffic volume, weather, and vehicle type of adjacent lanes. A random parameter utility model and random parameter regret model were adopted to explore the possible factors and choice of guardrails. The results revealed that increases in traffic volume and changes in colored pavements significantly heightened the likelihood of choosing warning post guardrails, indicating that cyclists prefer guardrails that offer a higher sense of security in areas with dense traffic. Moreover, younger cyclists and those with higher educational levels exhibited a preference for warning post guardrails, reflecting their greater safety needs and sensitivity to traffic environments. These findings provide empirical support for urban bicycle lane design and offer insights for the formulation of effective urban traffic safety policies.
-
Key words:
- Cycling /
- Stated choice analysis /
- Sense of security /
- Guardrails /
- Random parameter model