-
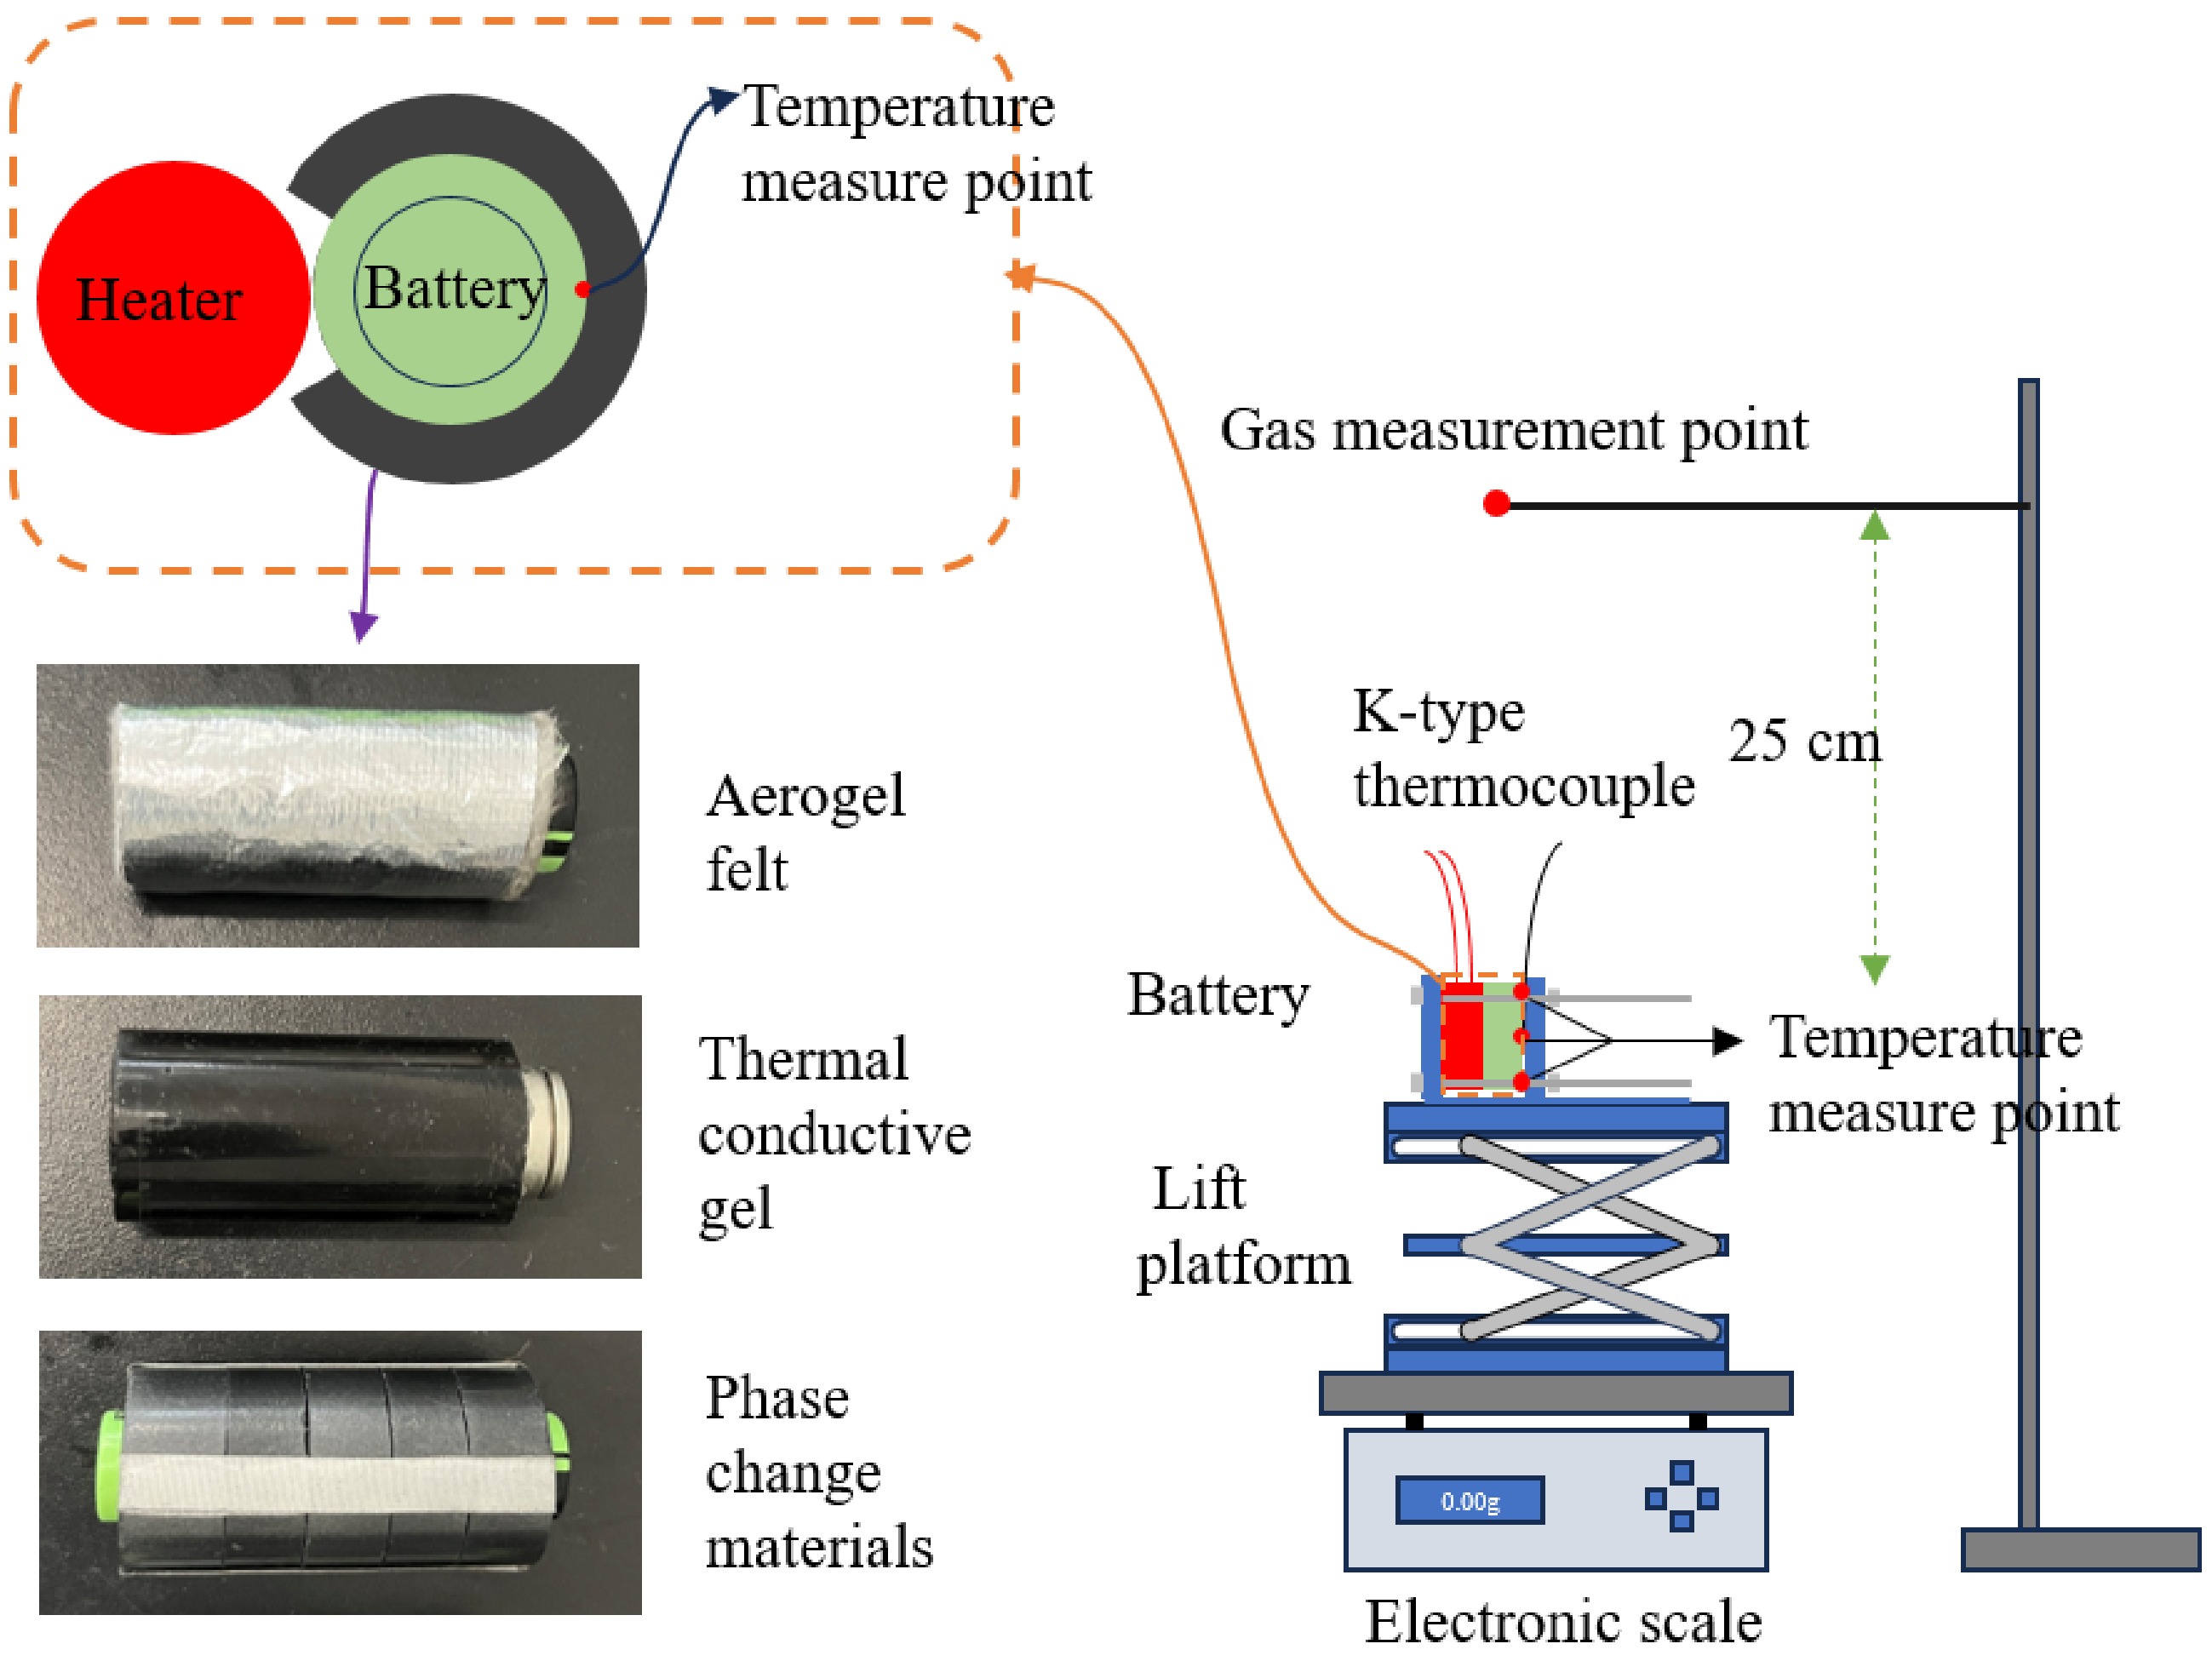
Figure 1.
Schematic diagram of the battery experimental test platform.
-
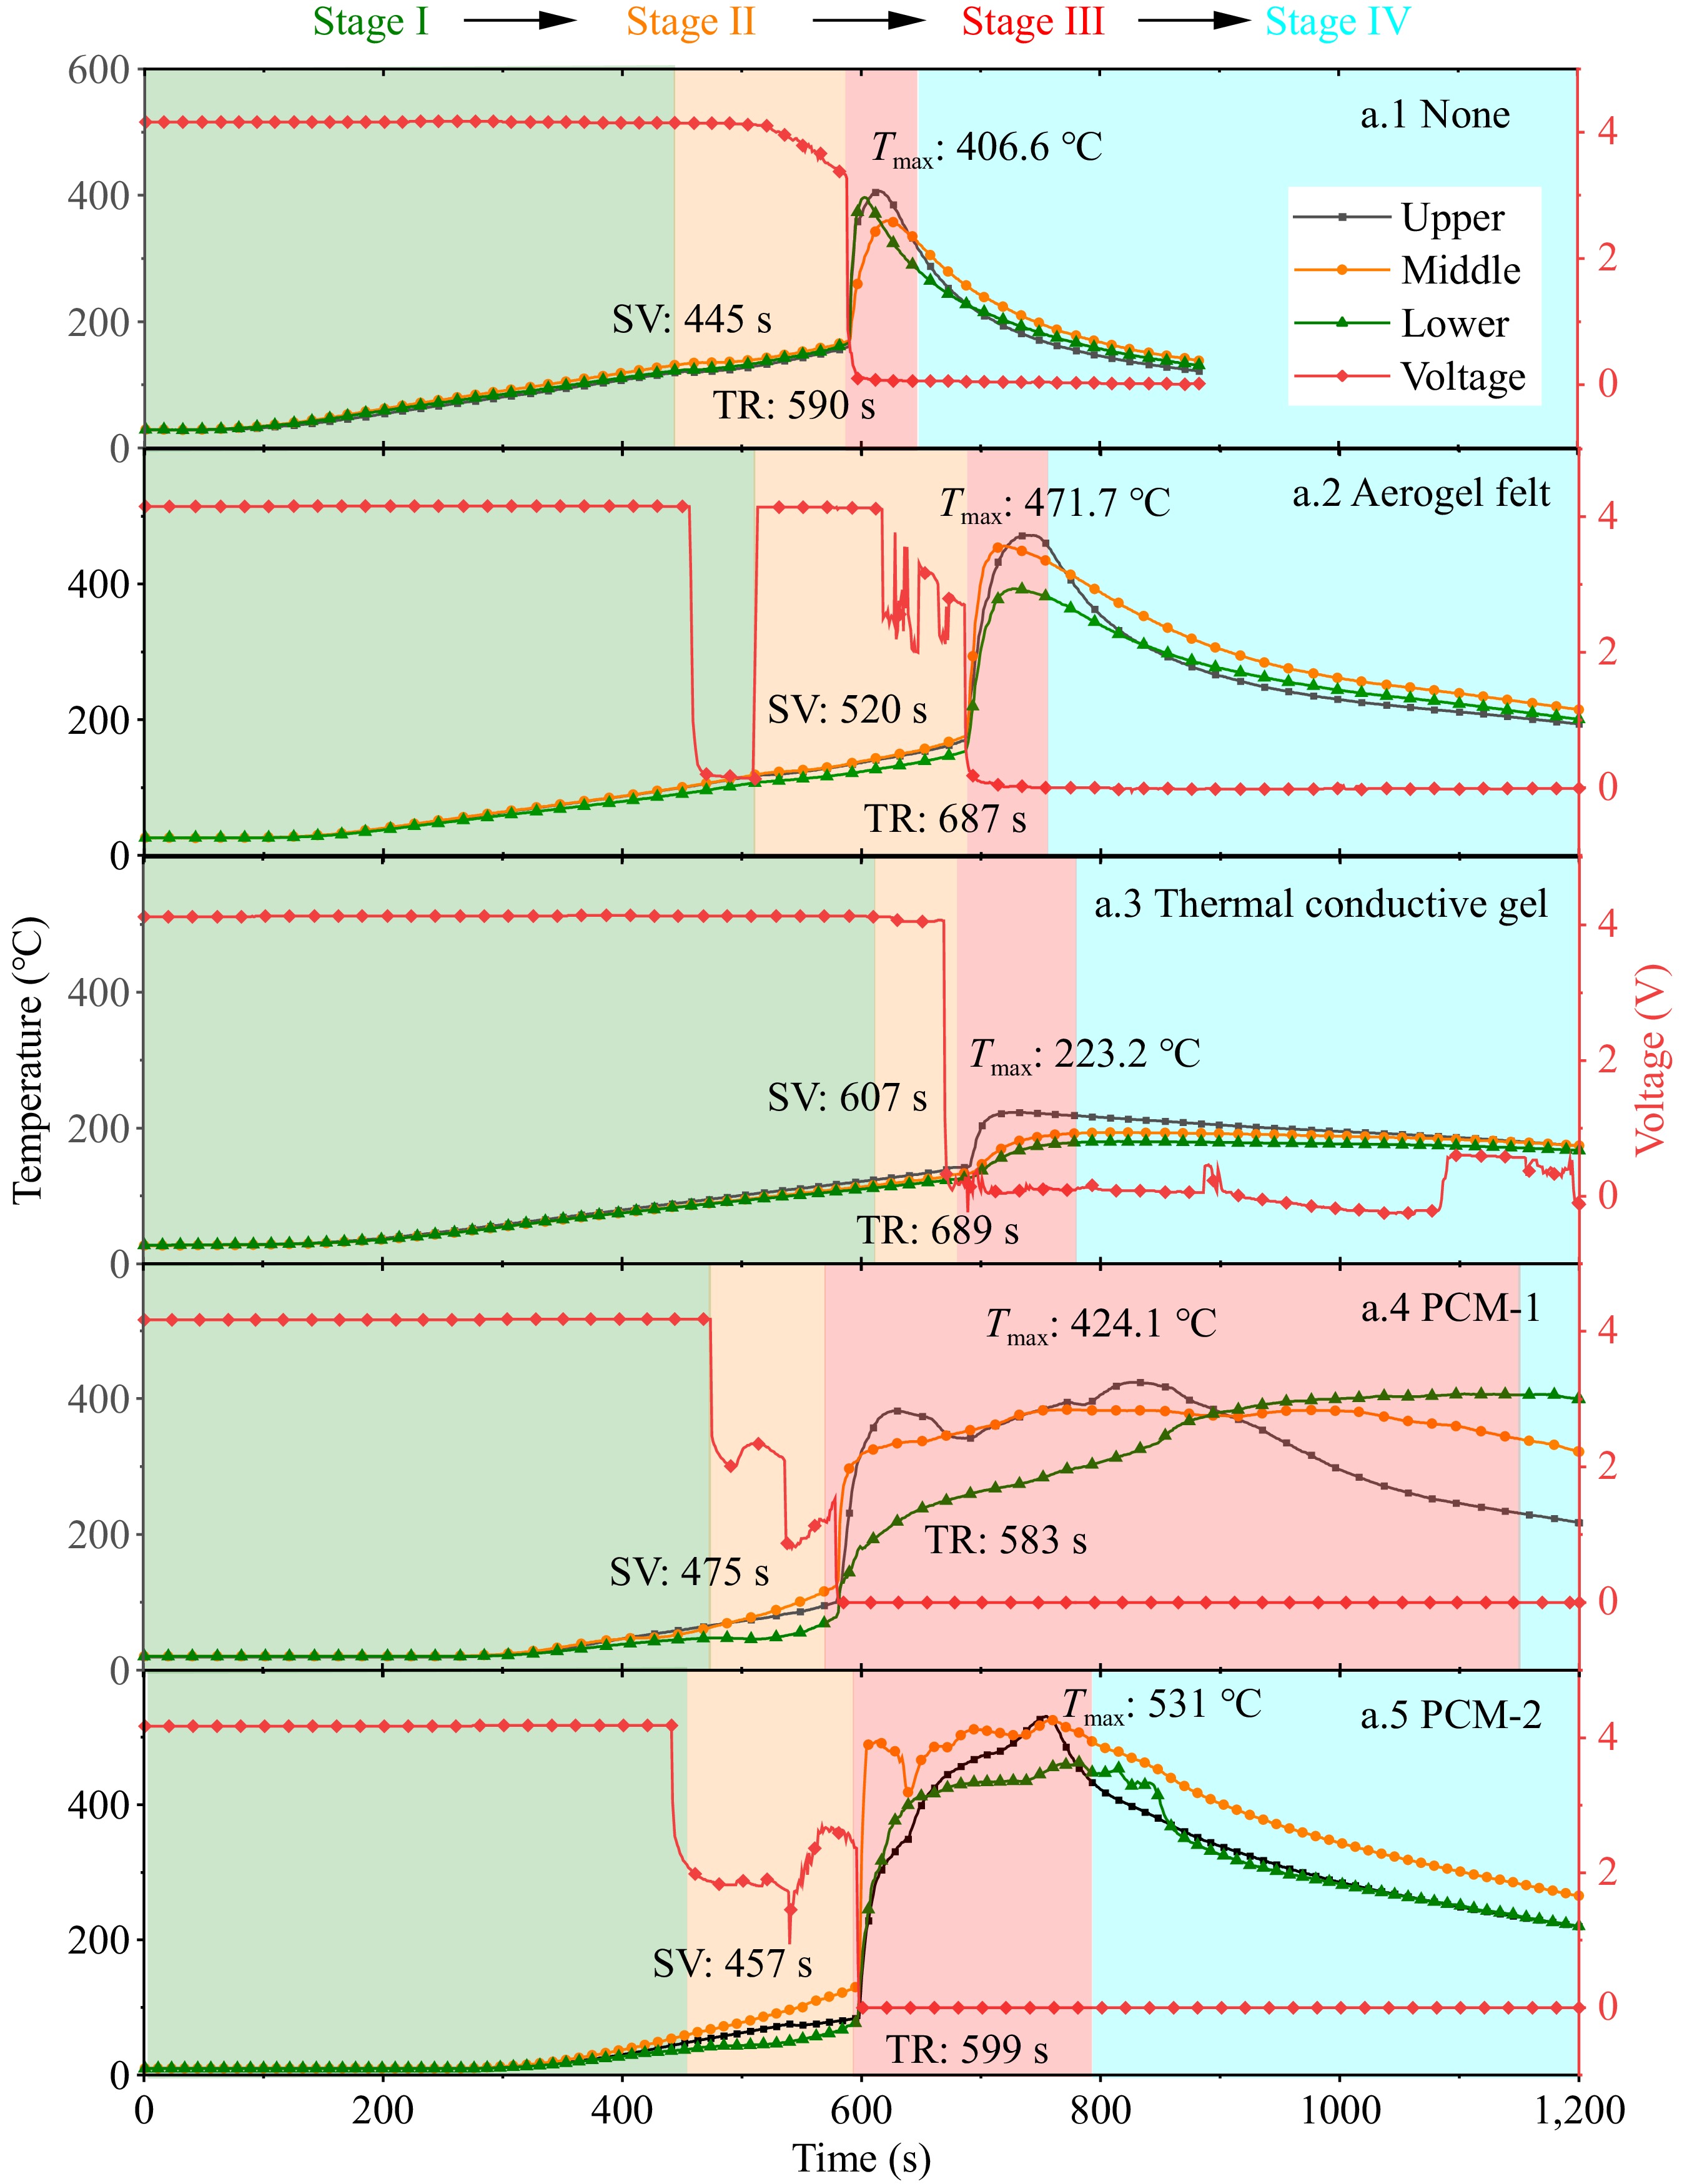
Figure 2.
Temperature and voltage changes during thermal runaway.
-
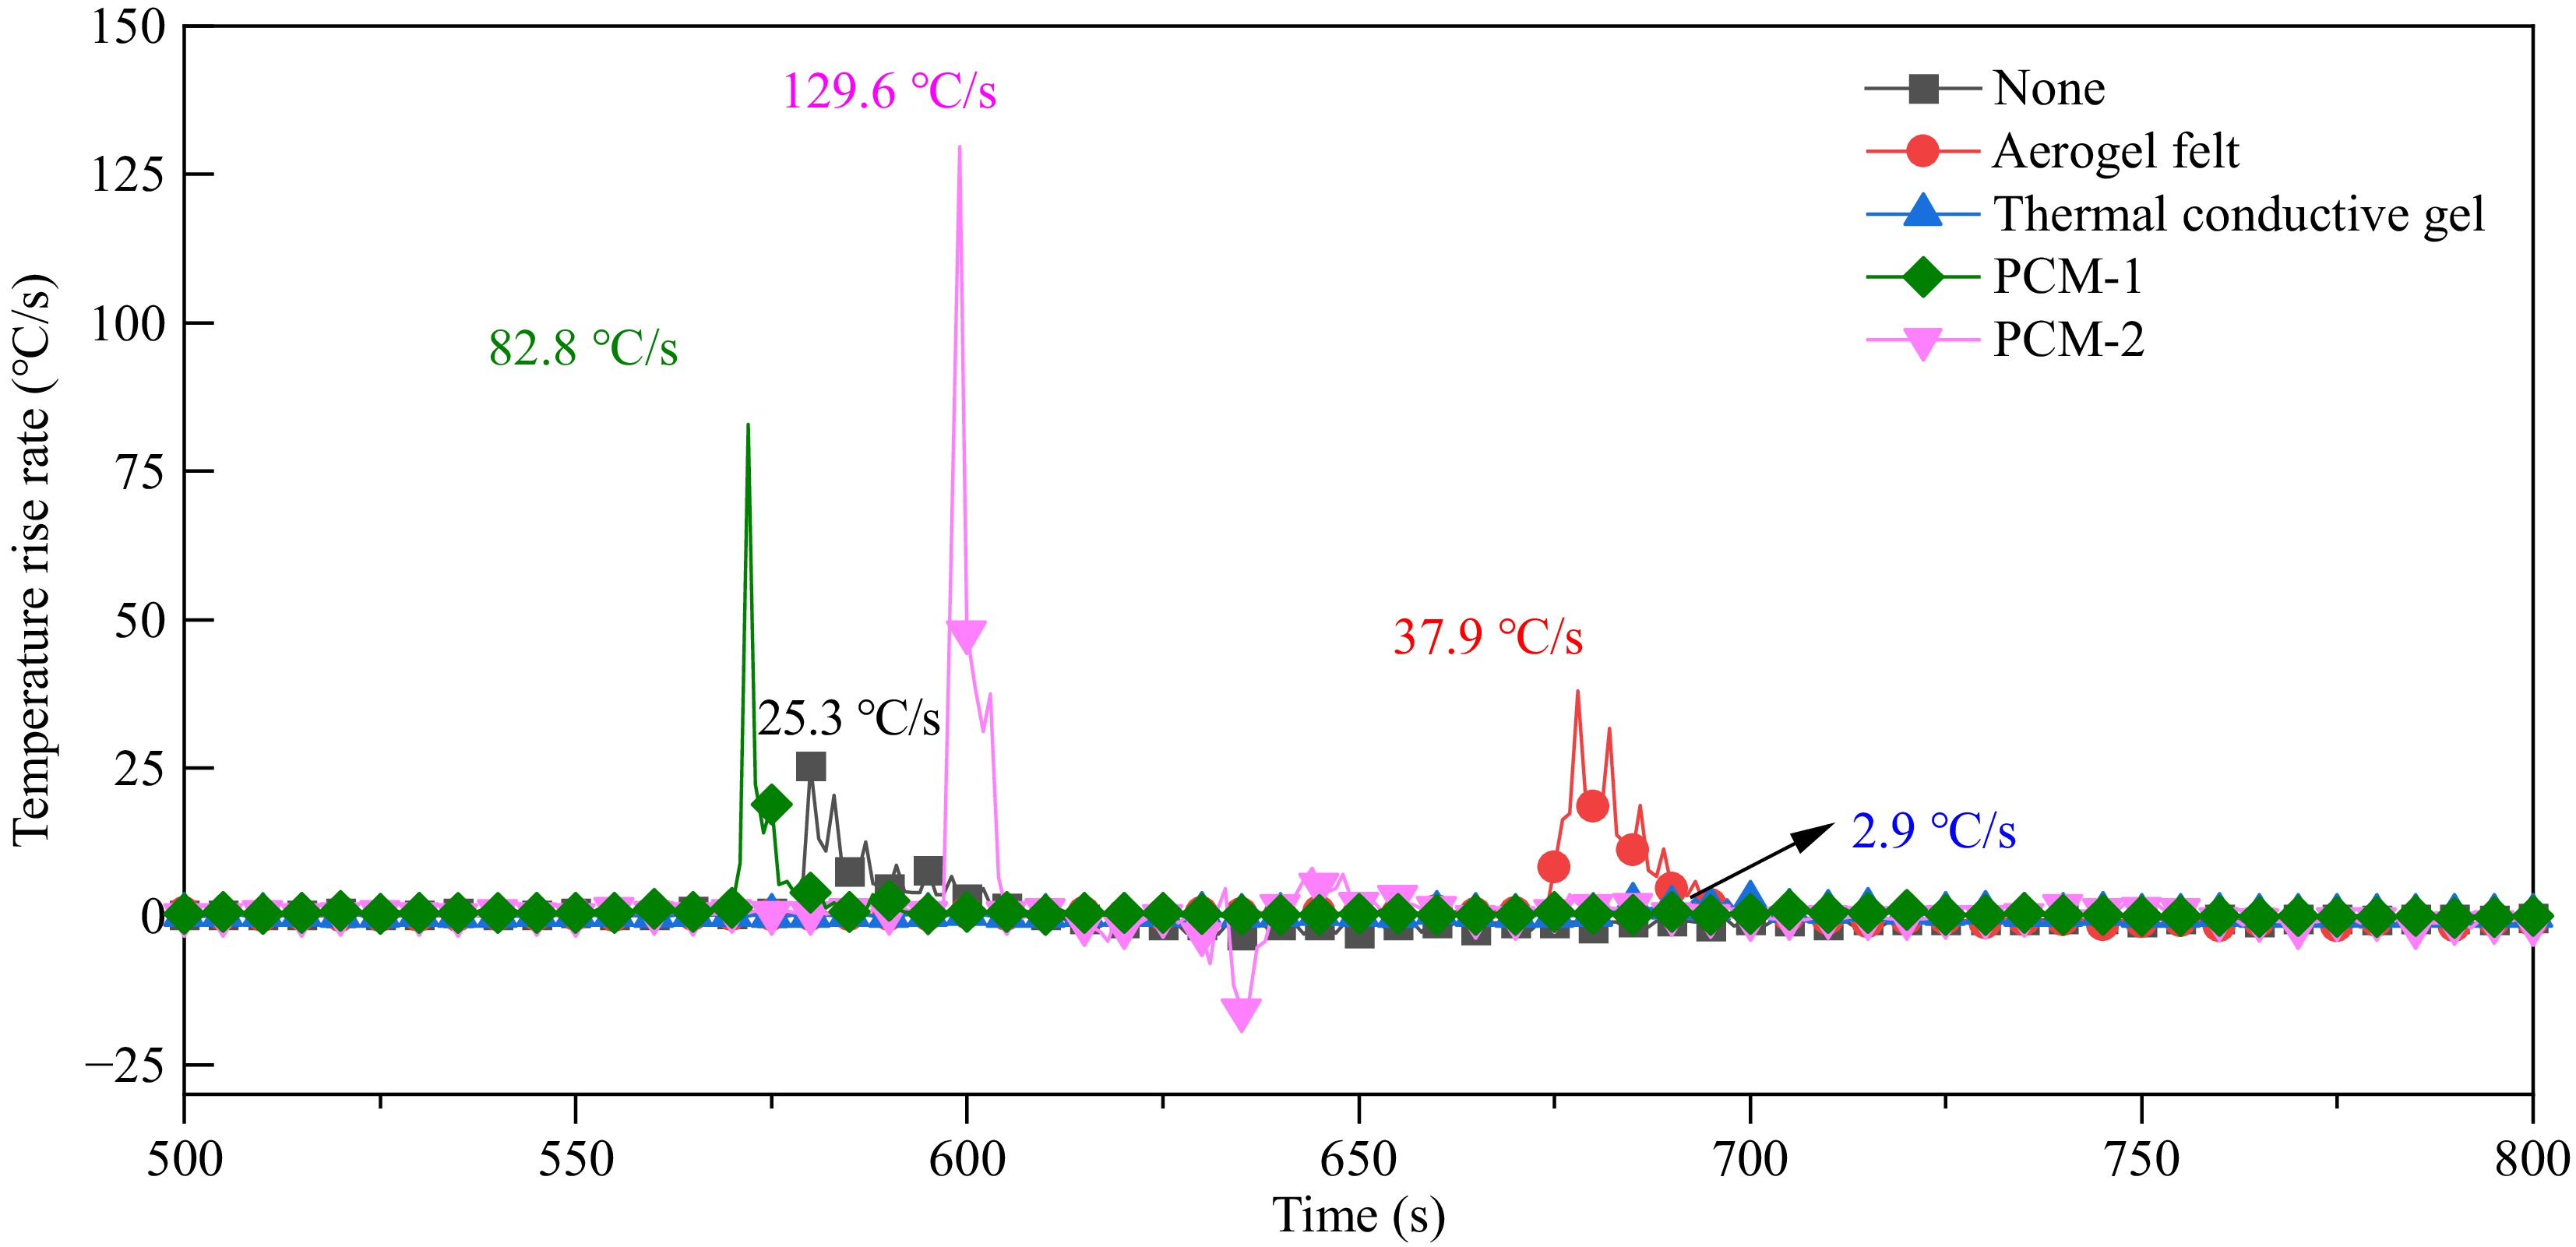
Figure 3.
Temperature rise rate during thermal runaway.
-
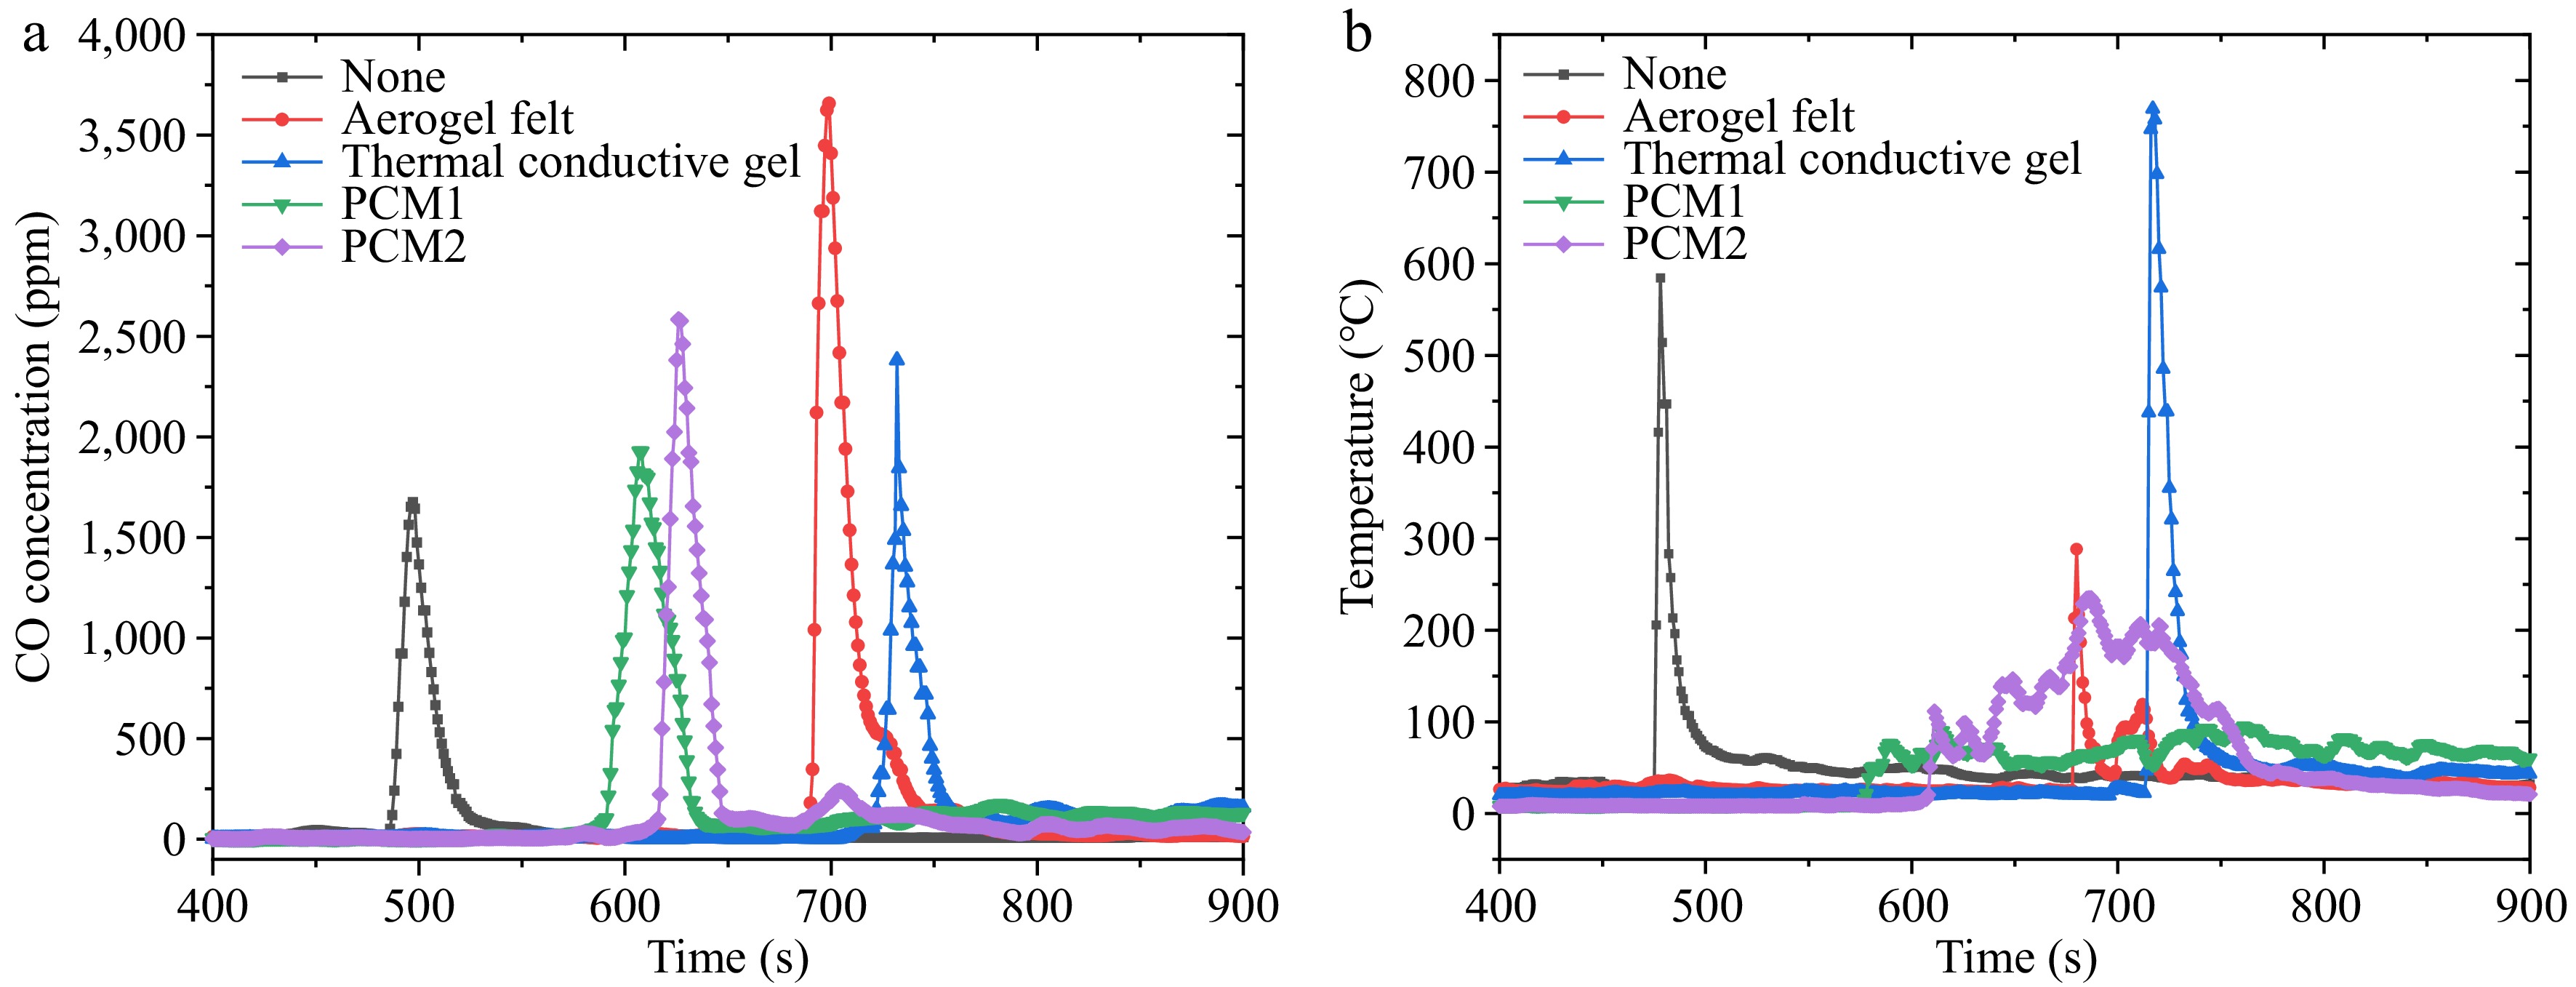
Figure 4.
CO concentration and gas temperature changes during thermal runaway.
-
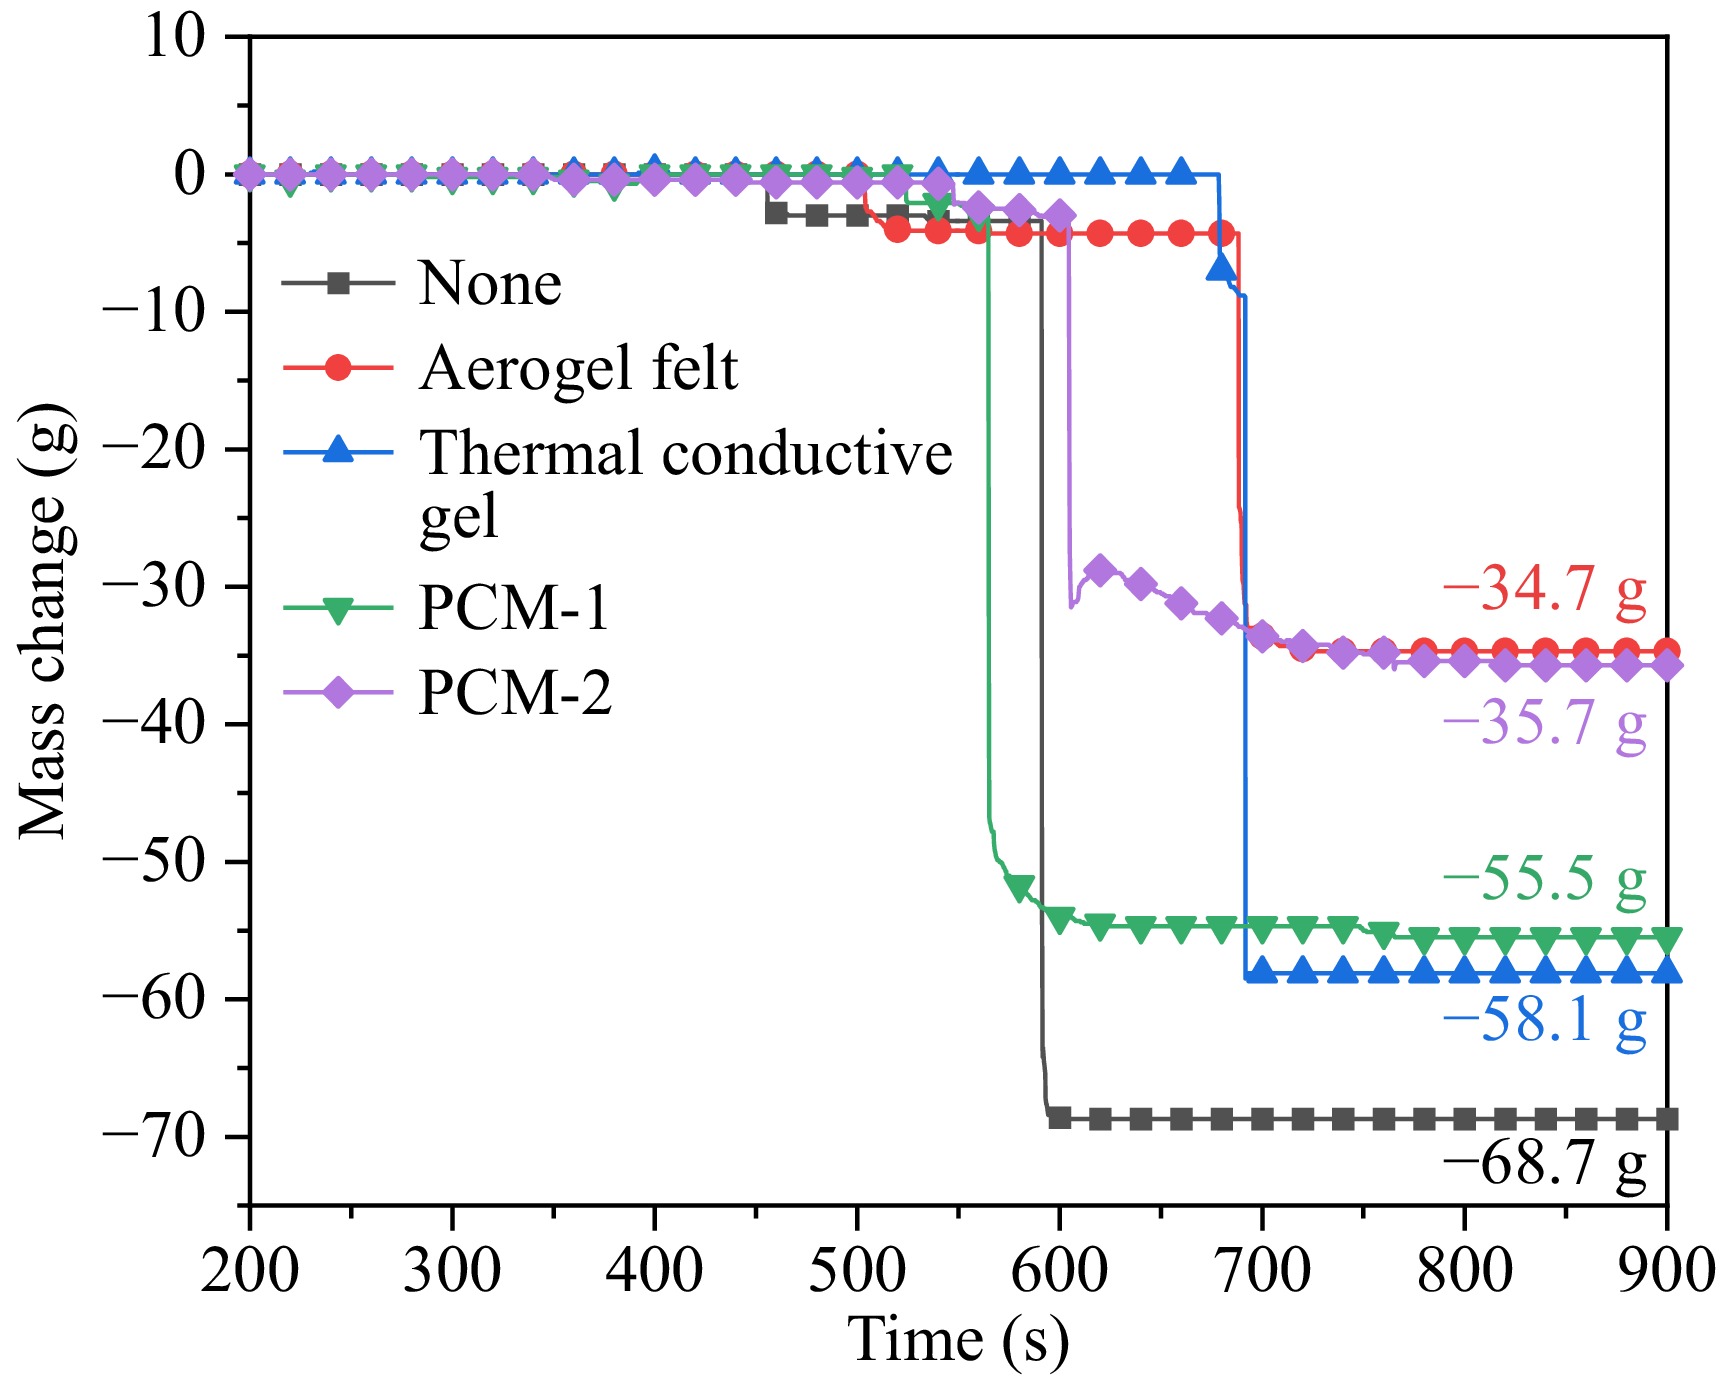
Figure 5.
Mass changes during thermal runaway.
-
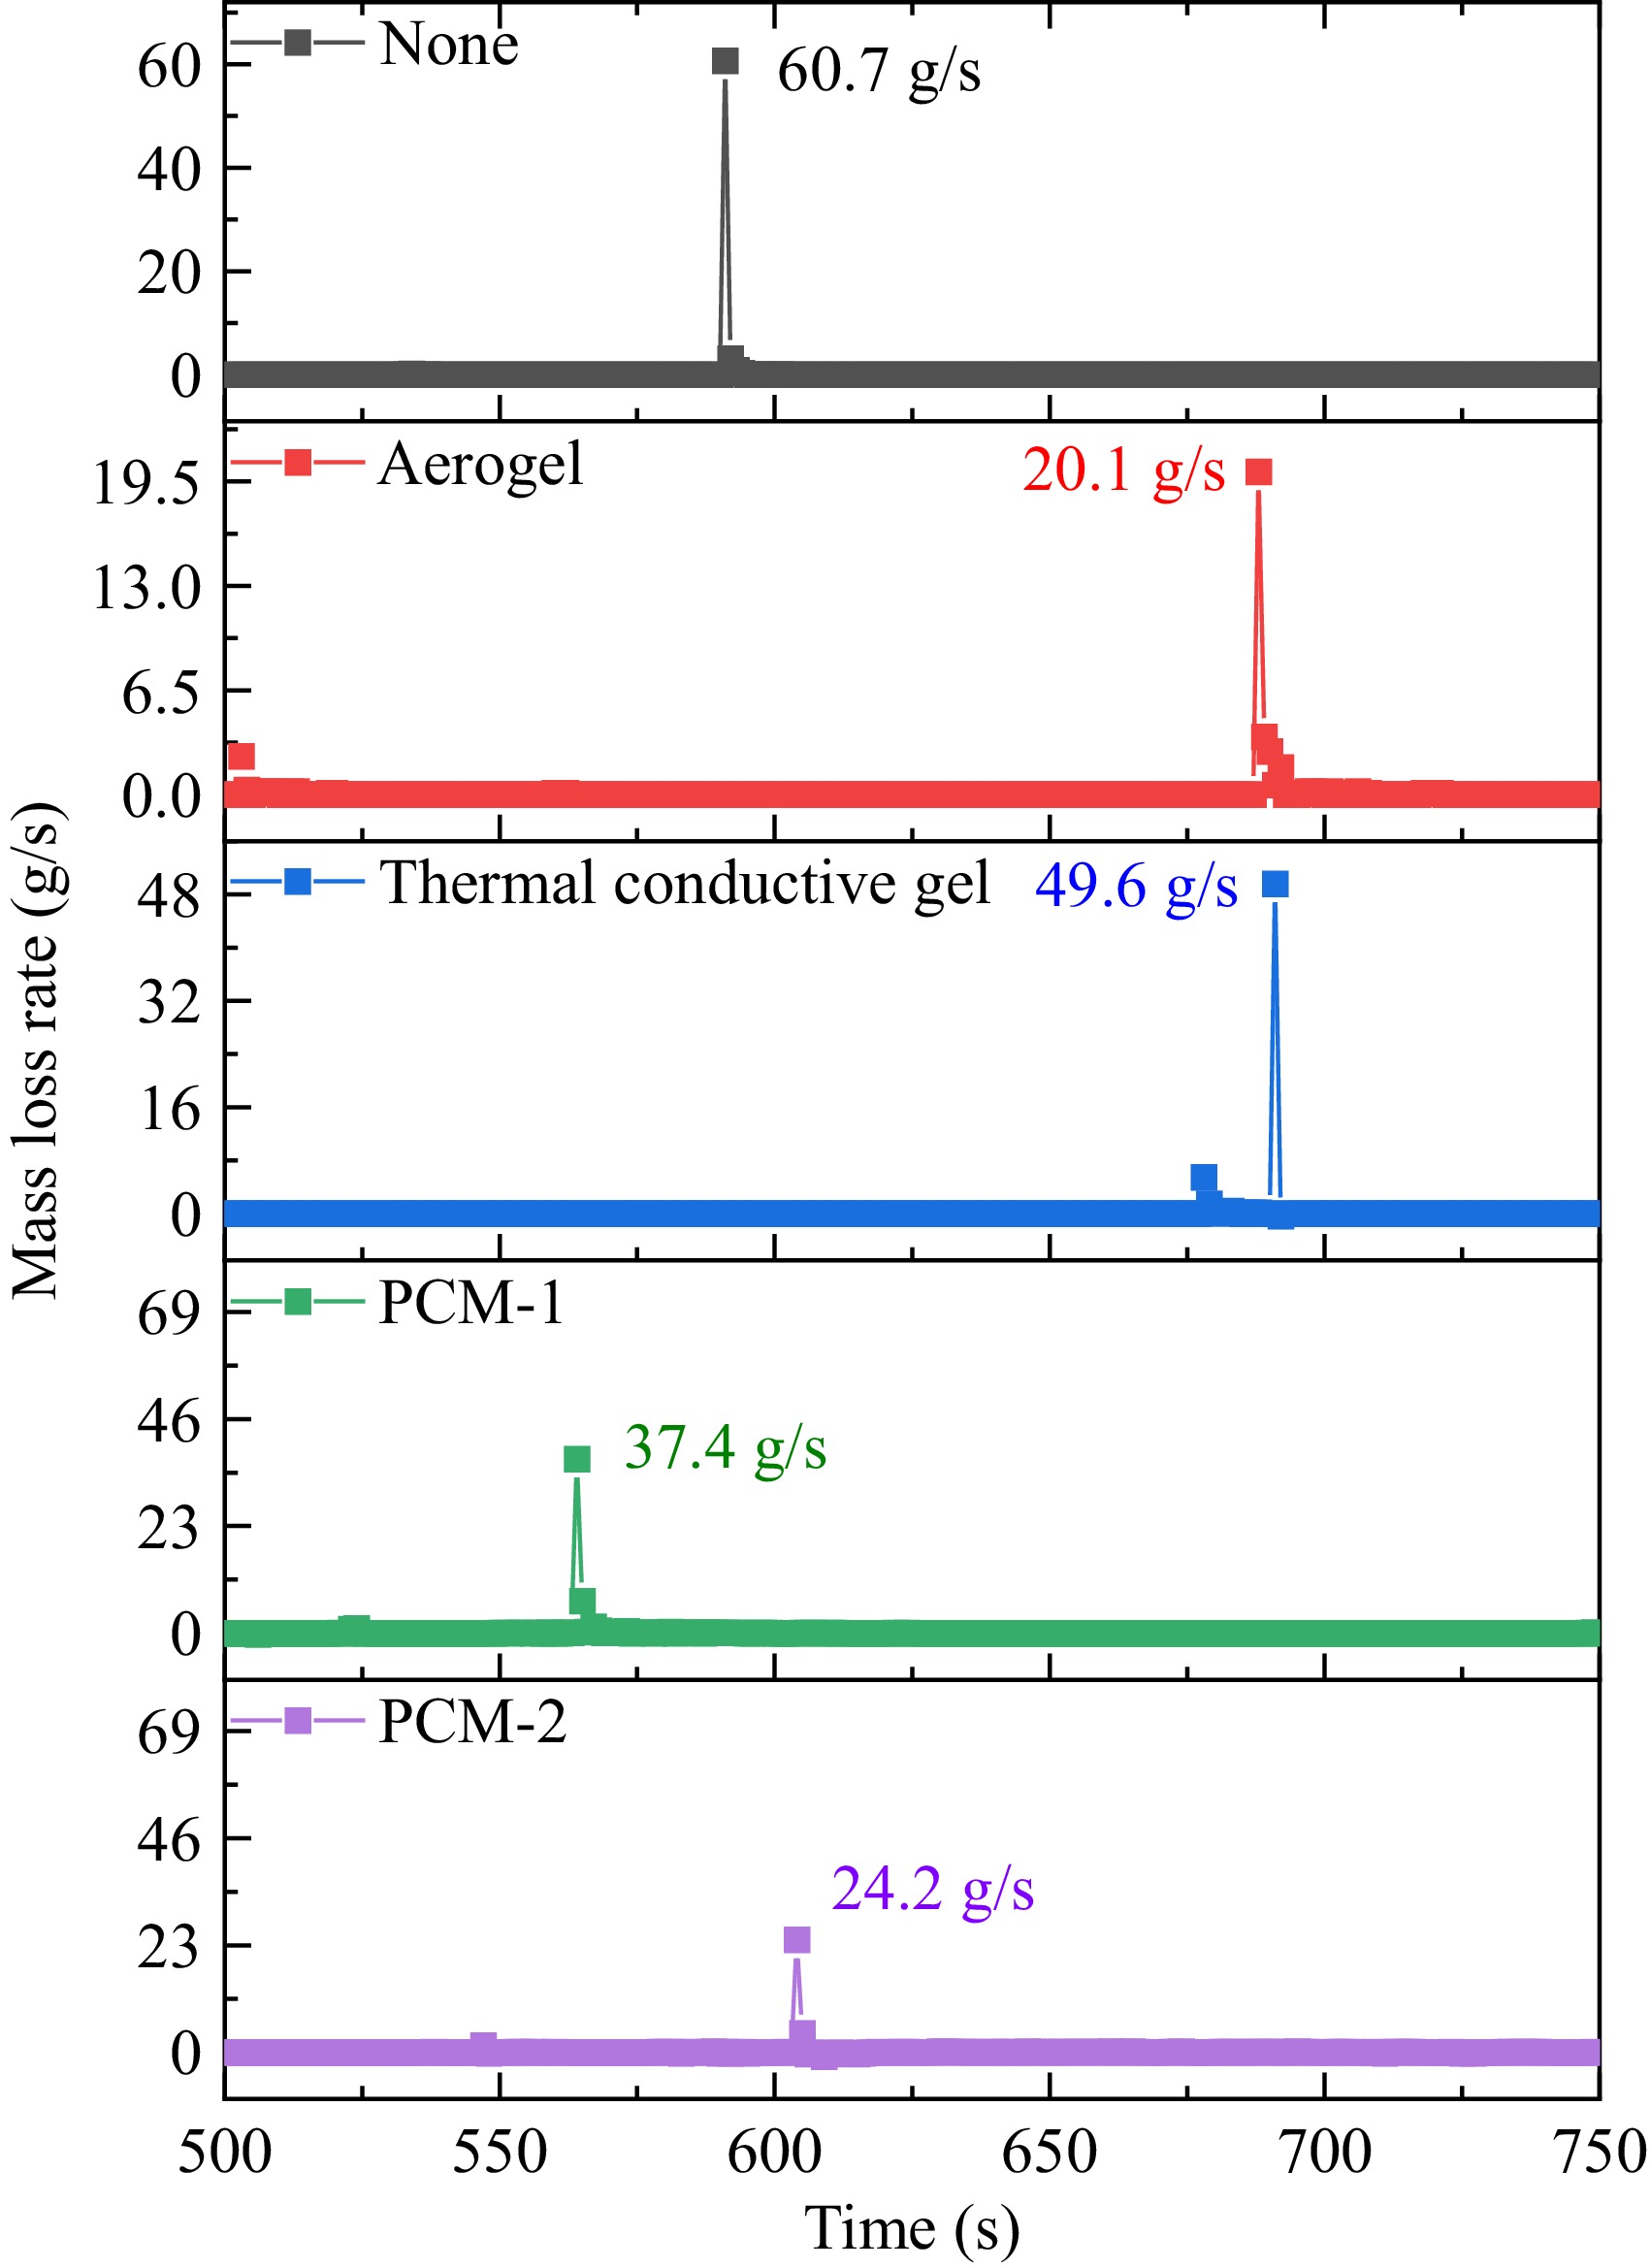
Figure 6.
Mass loss rate changes during thermal runaway.
-
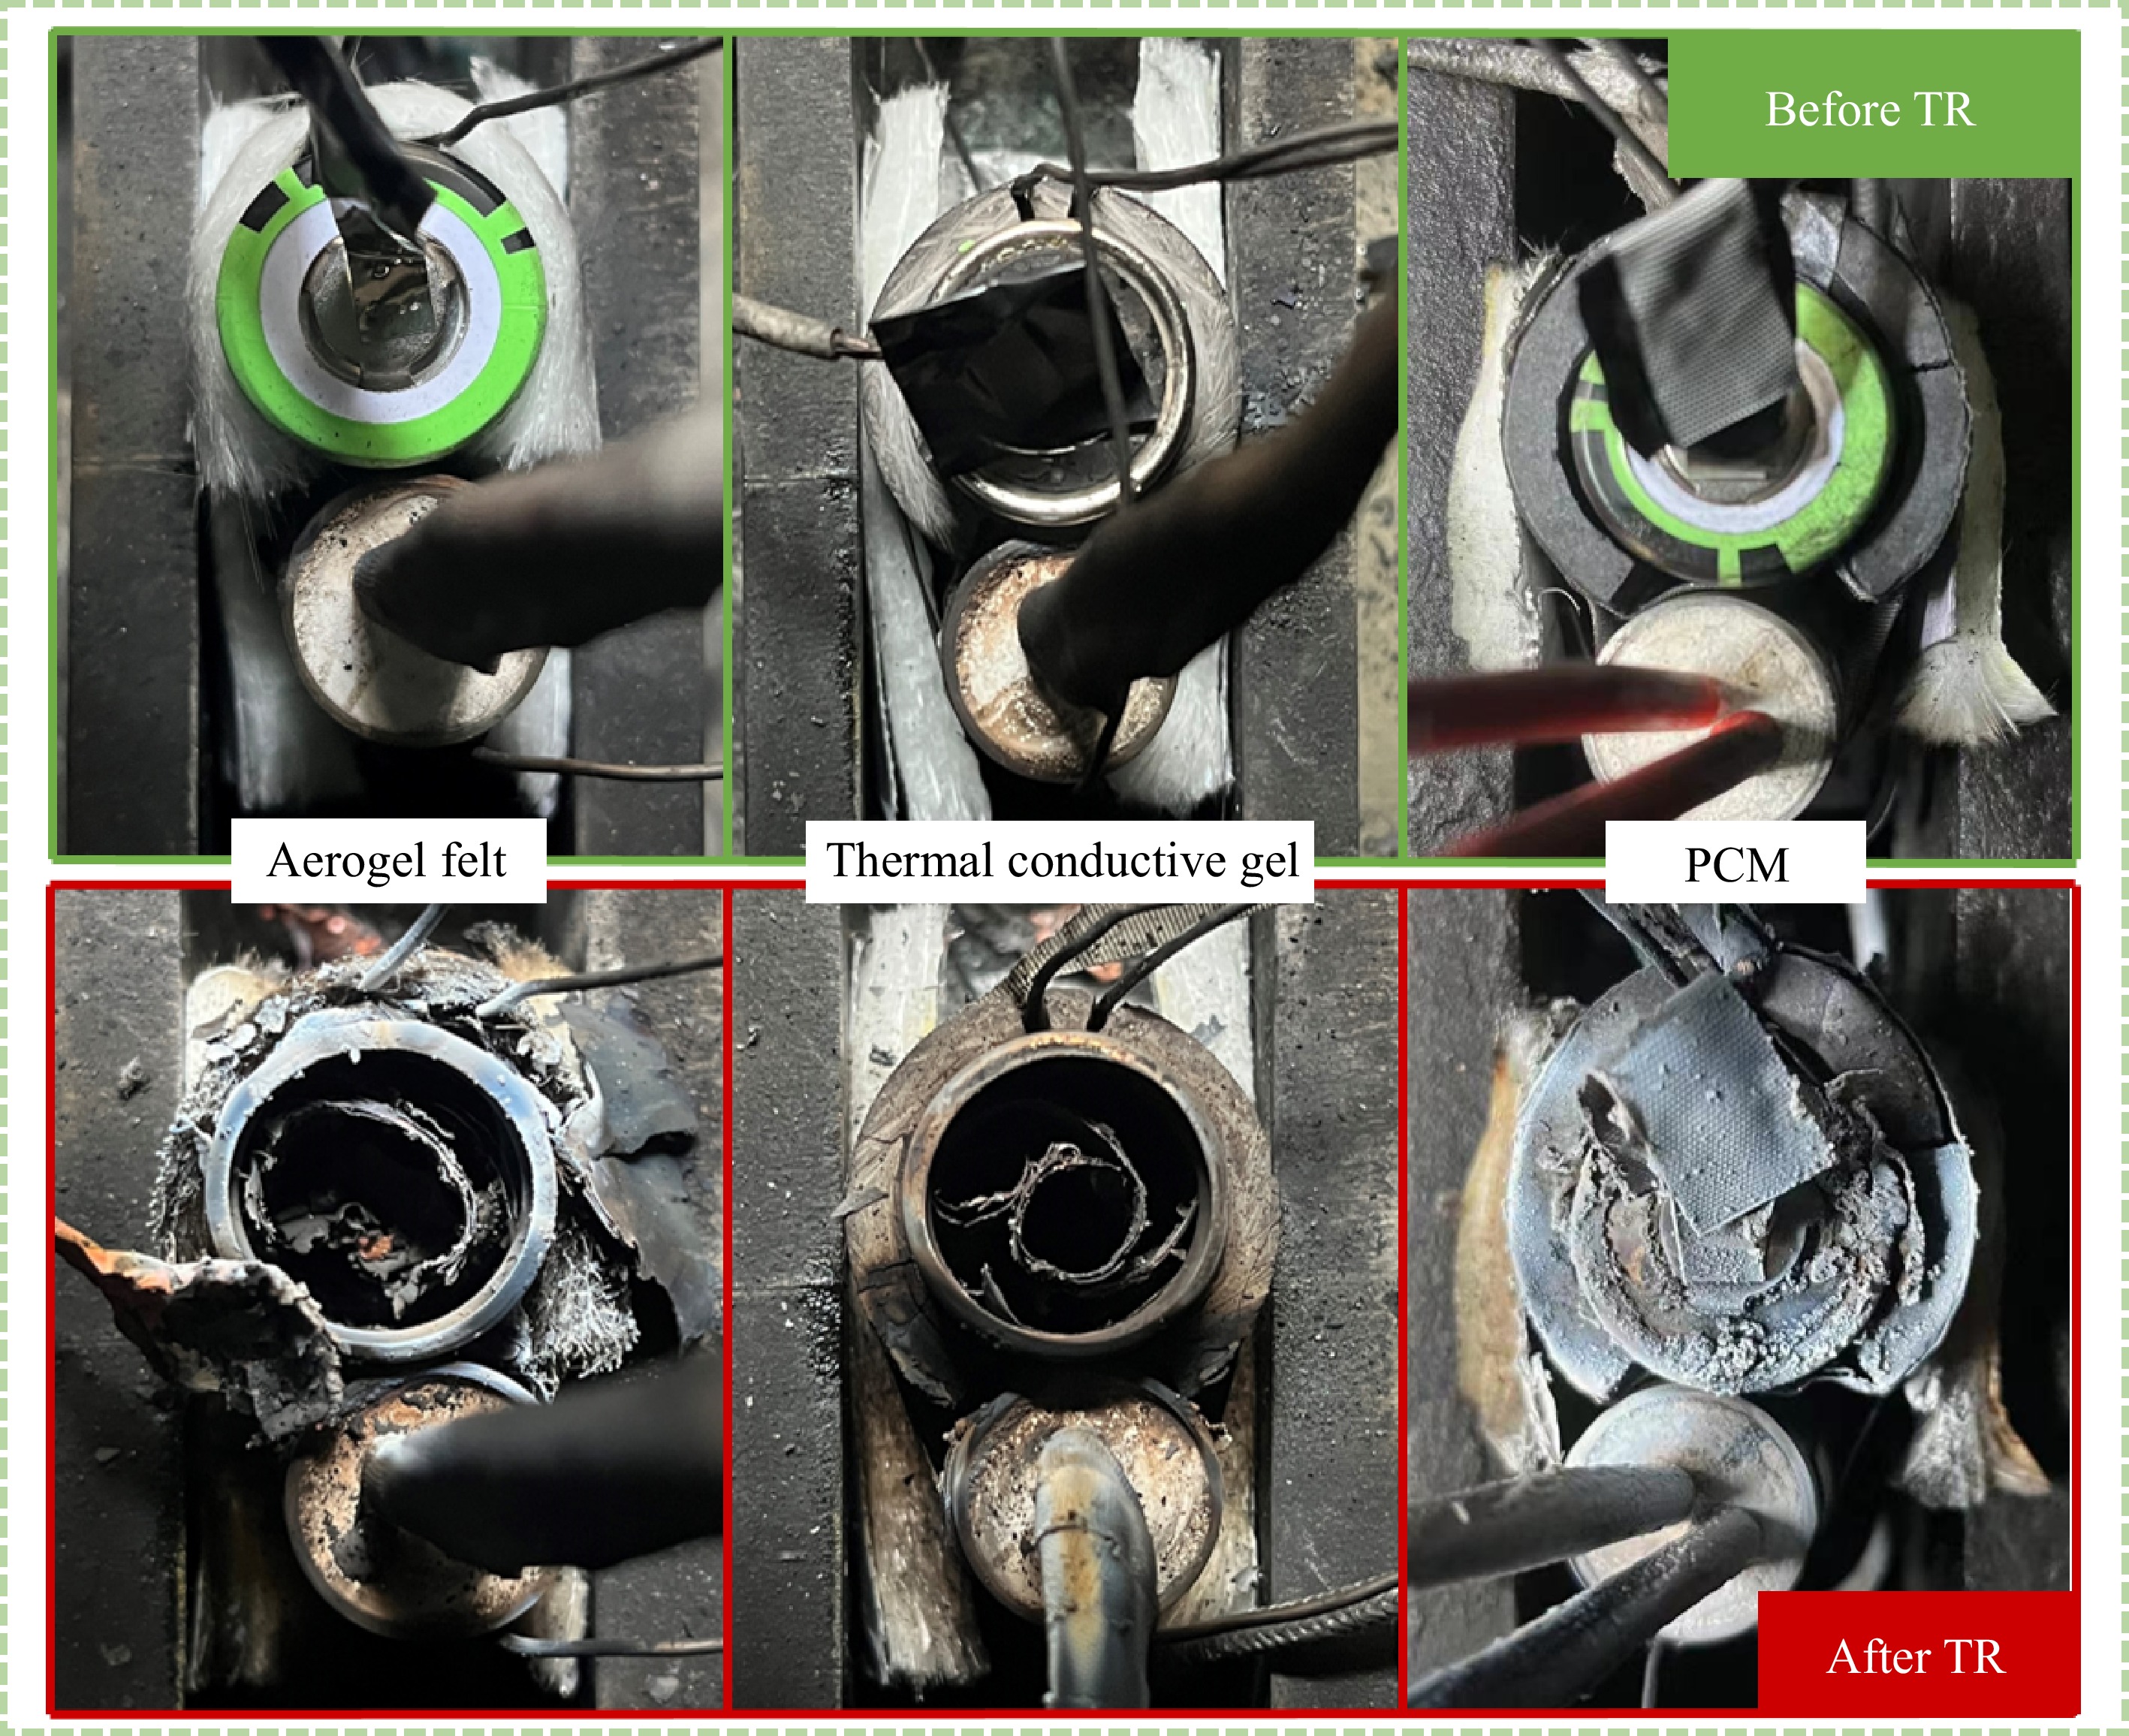
Figure 7.
Battery and material appearance before and after thermal runaway under different protection materials.
-
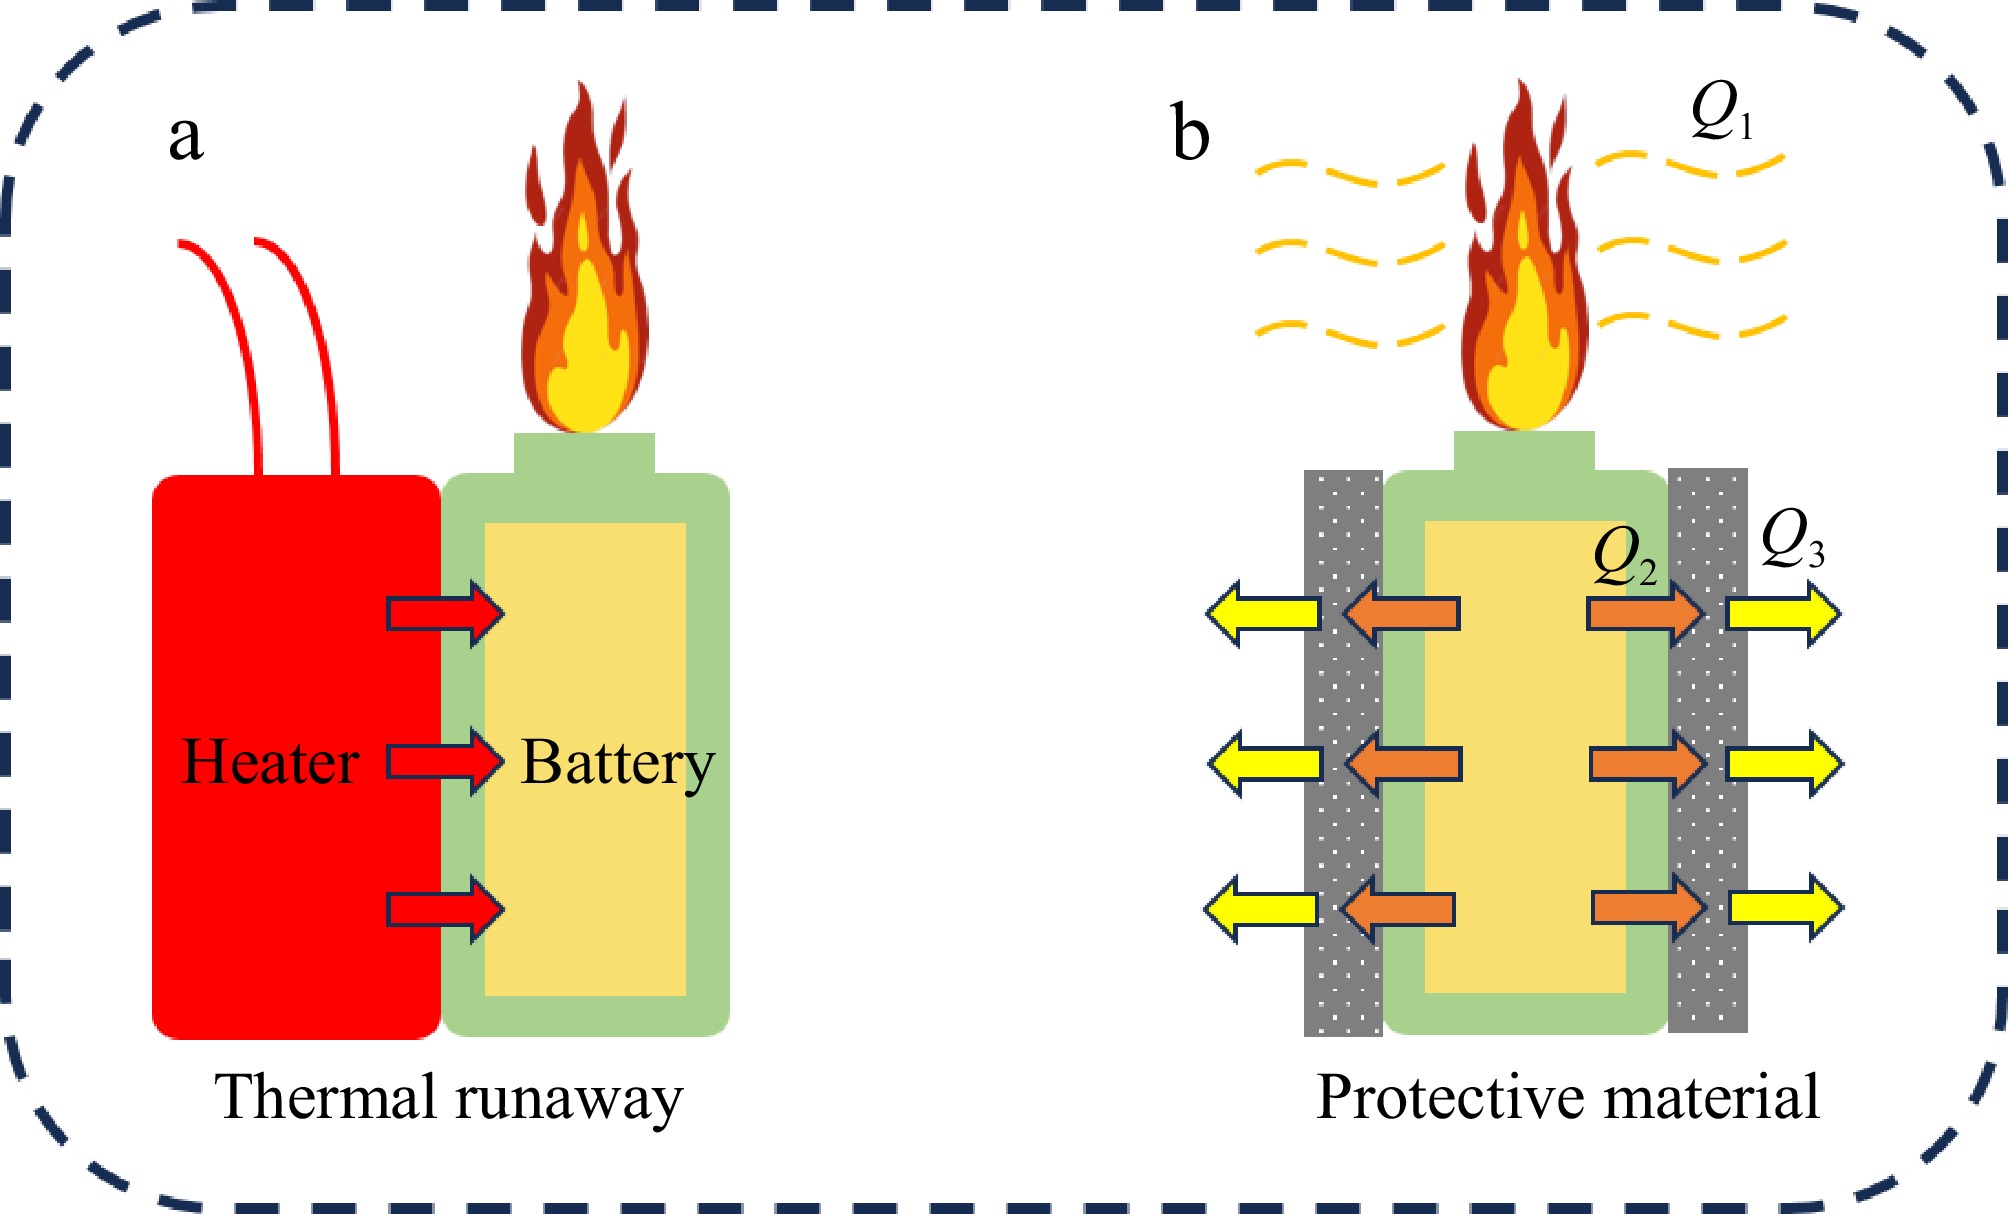
Figure 8.
Schematic diagram of thermal runaway heat transfer in battery.
-
Parameter Value Battery Panasonic NCR 21700T Capacity 4,800 mAh Voltage 3.7 V (discharge cut-off voltage 3.0 V, maximum charge voltage 4.2 V) Dimensions Φ 18 × 65 mm Anode Graphite Cathode NCA Electrolyte Solvents, salts, and additives Table 1.
Composition of 21700T lithium-ion battery.
-
Sample Mass content (wt%) PA EG Graphene DOPO PCM-1 93 7 0 0 PCM-2 85 5 8 2 Table 2.
Mass content of the components in the obtained CPCMs.
-
Protective material Safety valve
rupture time (s)Thermal runaway
occurs time (s)None 445 590 Aerogel felt 520 687 Thermal conductive gel 607 689 PCM-1 475 583 PCM-2 457 599 Table 3.
Starting time of safety valve rupture and thermal runaway.
Figures
(8)
Tables
(3)