-
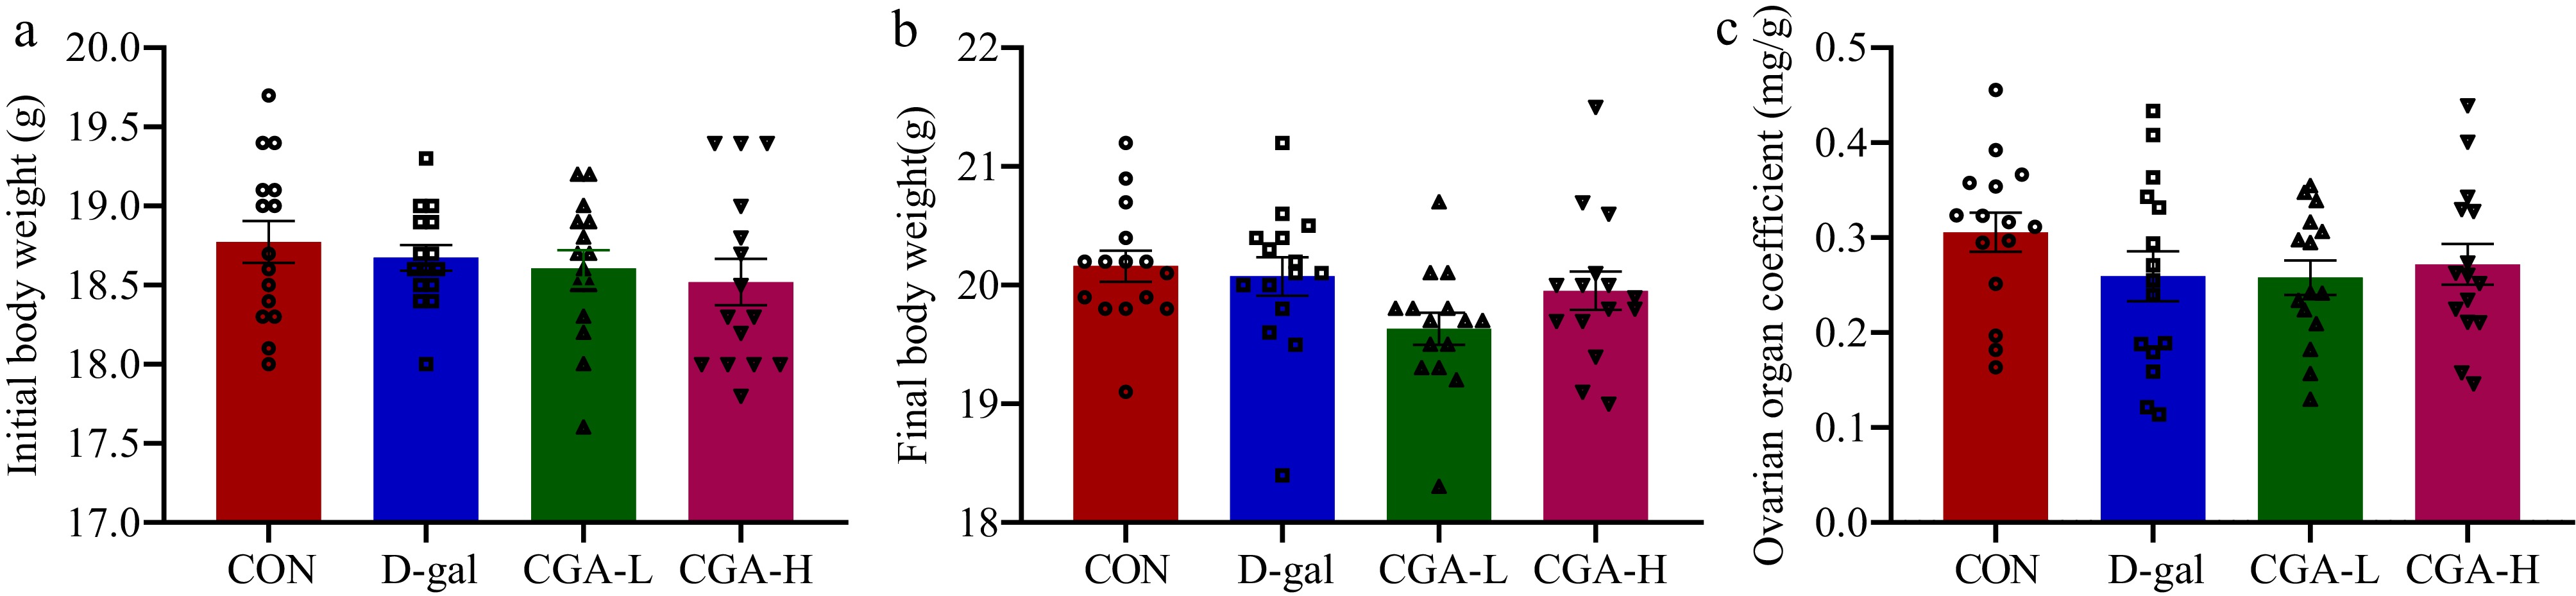
Figure 1.
Effects of CGA on body weights and ovarian organ coefficient in POF mice. The (a) initial body weights, (b) final body weights, and (c) ovarian organ coefficient were confirmed (n = 15). The ovarian organ coefficient was calculated as follows: ovarian organ coefficient (mg/g) = ovarian weight (mg) / final body weight of mice (g). The data are shown as the means ± SEMs.
-
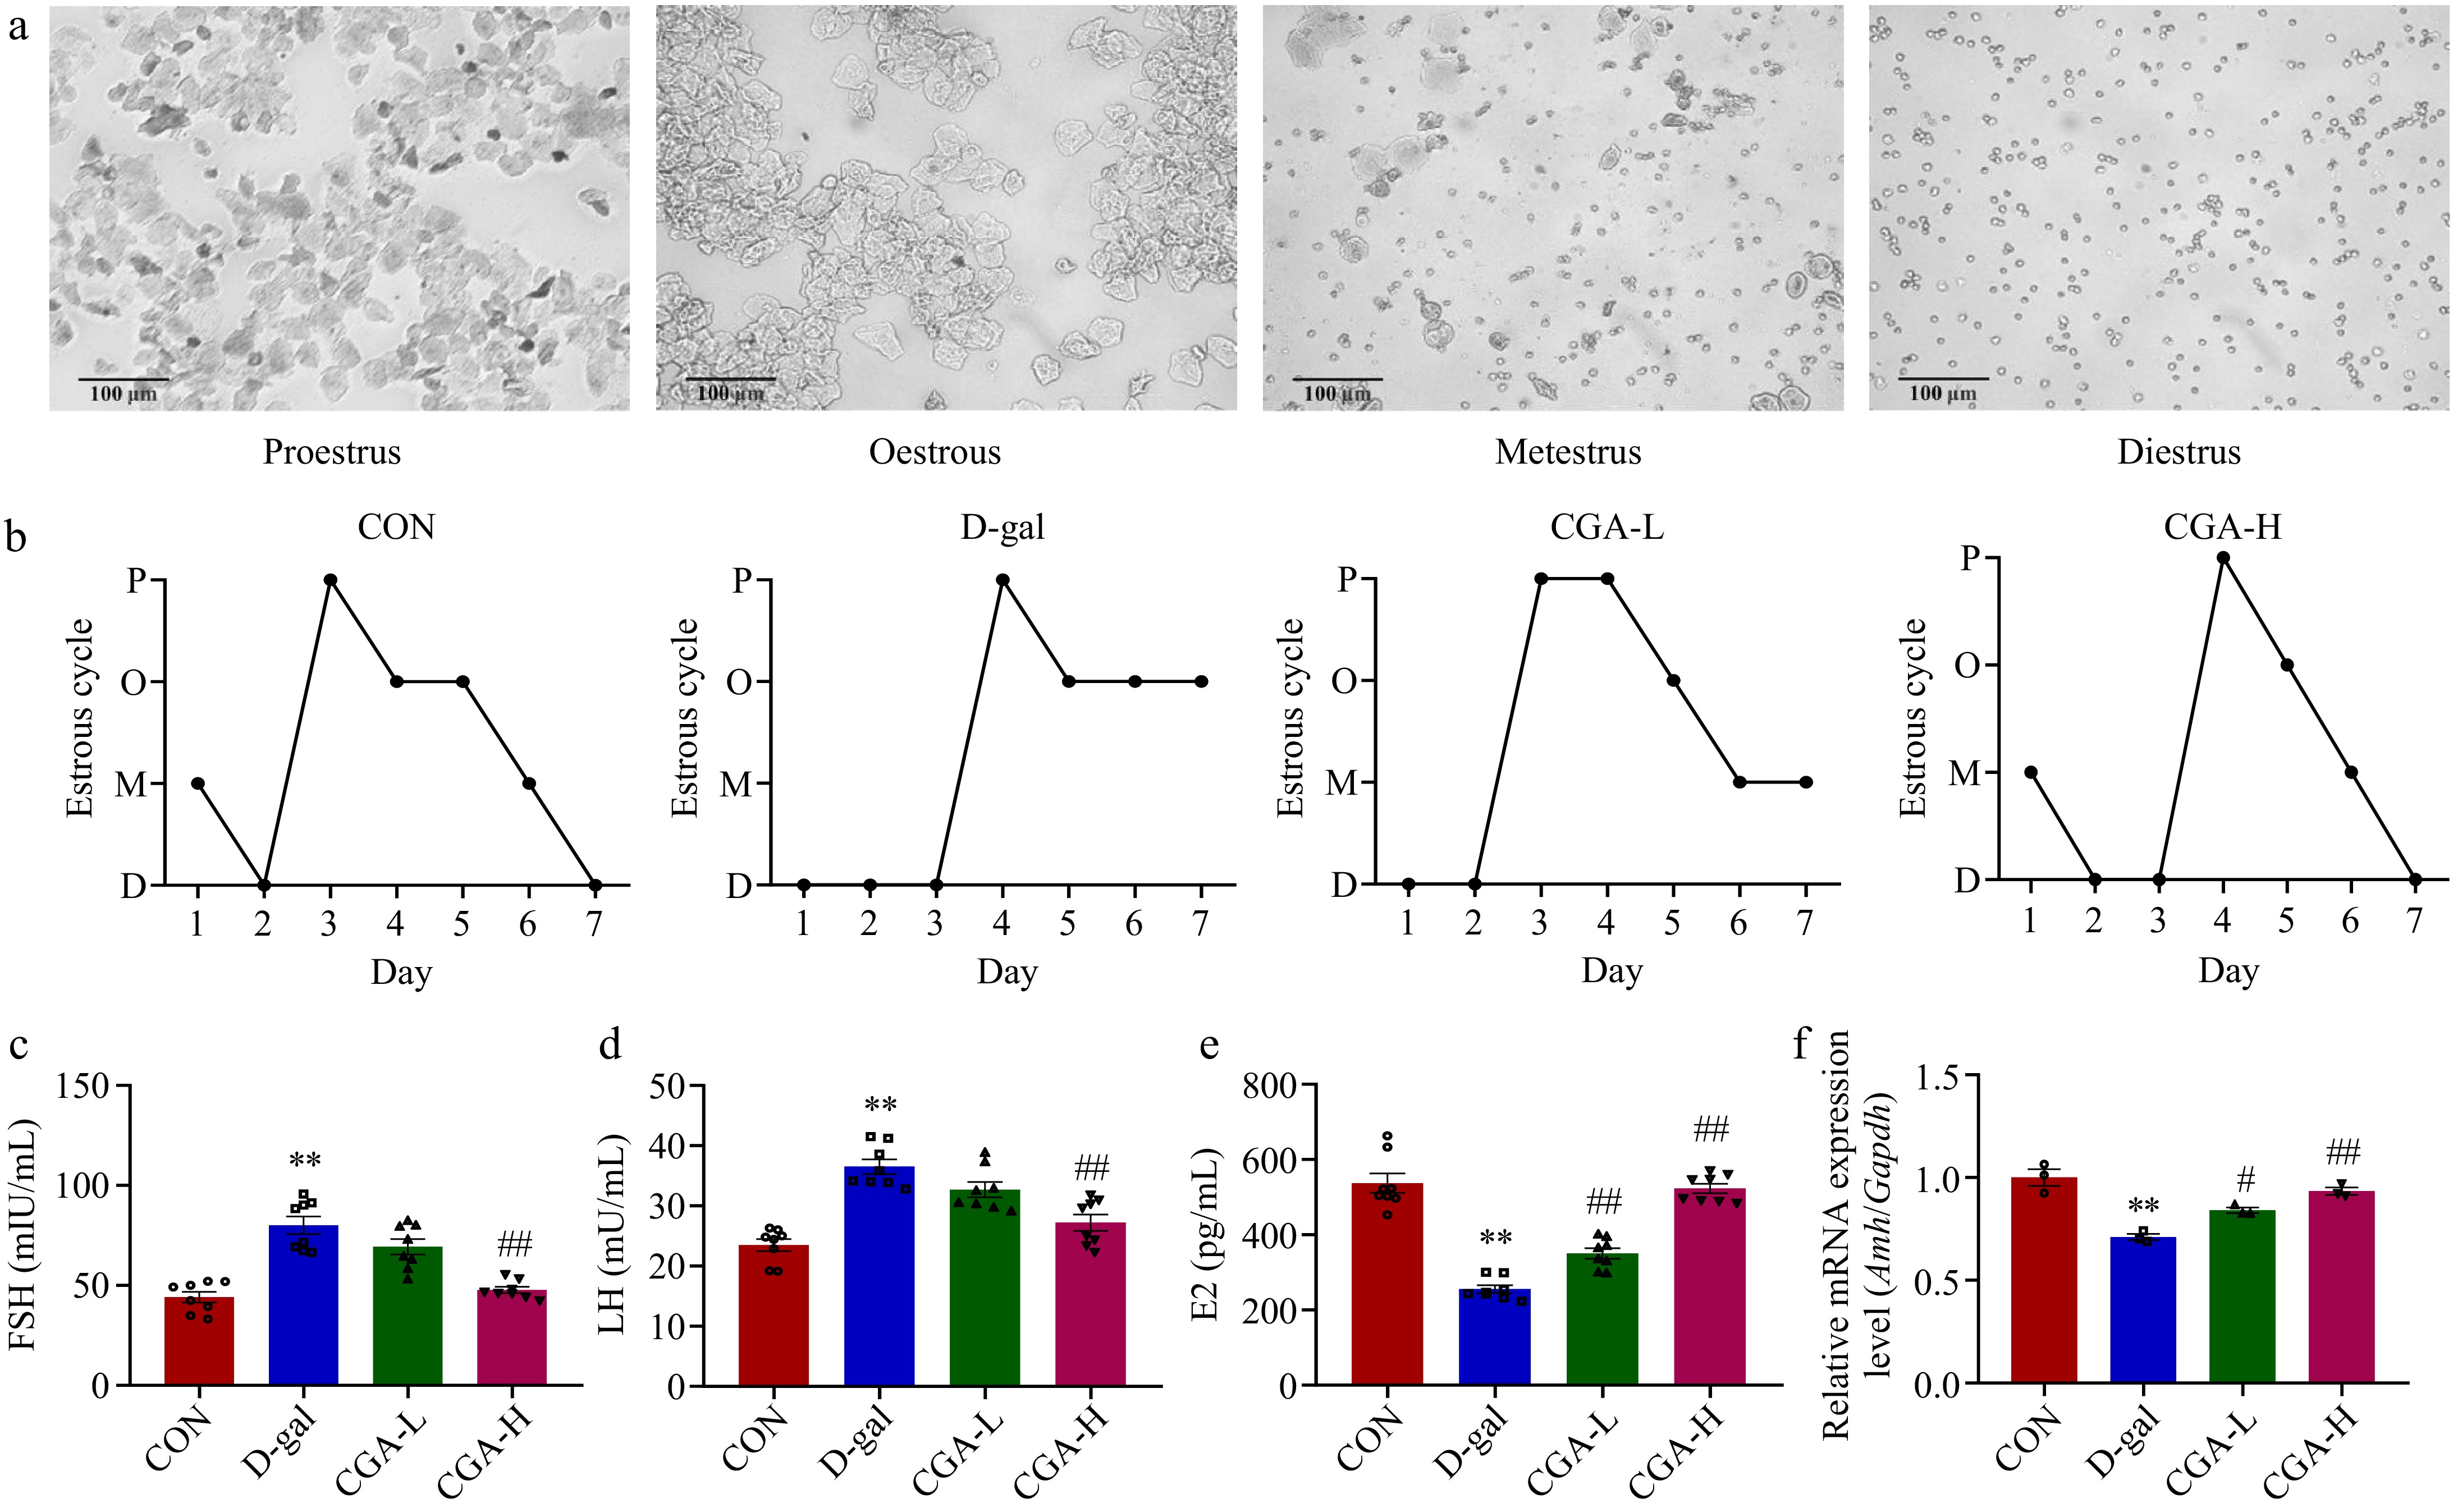
Figure 2.
Effects of CGA treatment on ovarian performance in POF mice. (a) Representative vaginal smears (scale bar: 100 μm); (b) four stages (P, O, M, and D indicate proestrus, oestrous, metestrus, and diestrus, respectively) of the oestrous cycle (n = 5); serum (c) FSH, (d) LH, and (e) E2 levels (n = 8); and (f) ovarian tissue Amh mRNA expression was evaluated (n = 3). Data are shown as the means ± SEMs. ** Significance vs the CON group (p < 0.01), # and ## significance vs the D-gal group (p < 0.05, p < 0.01).
-
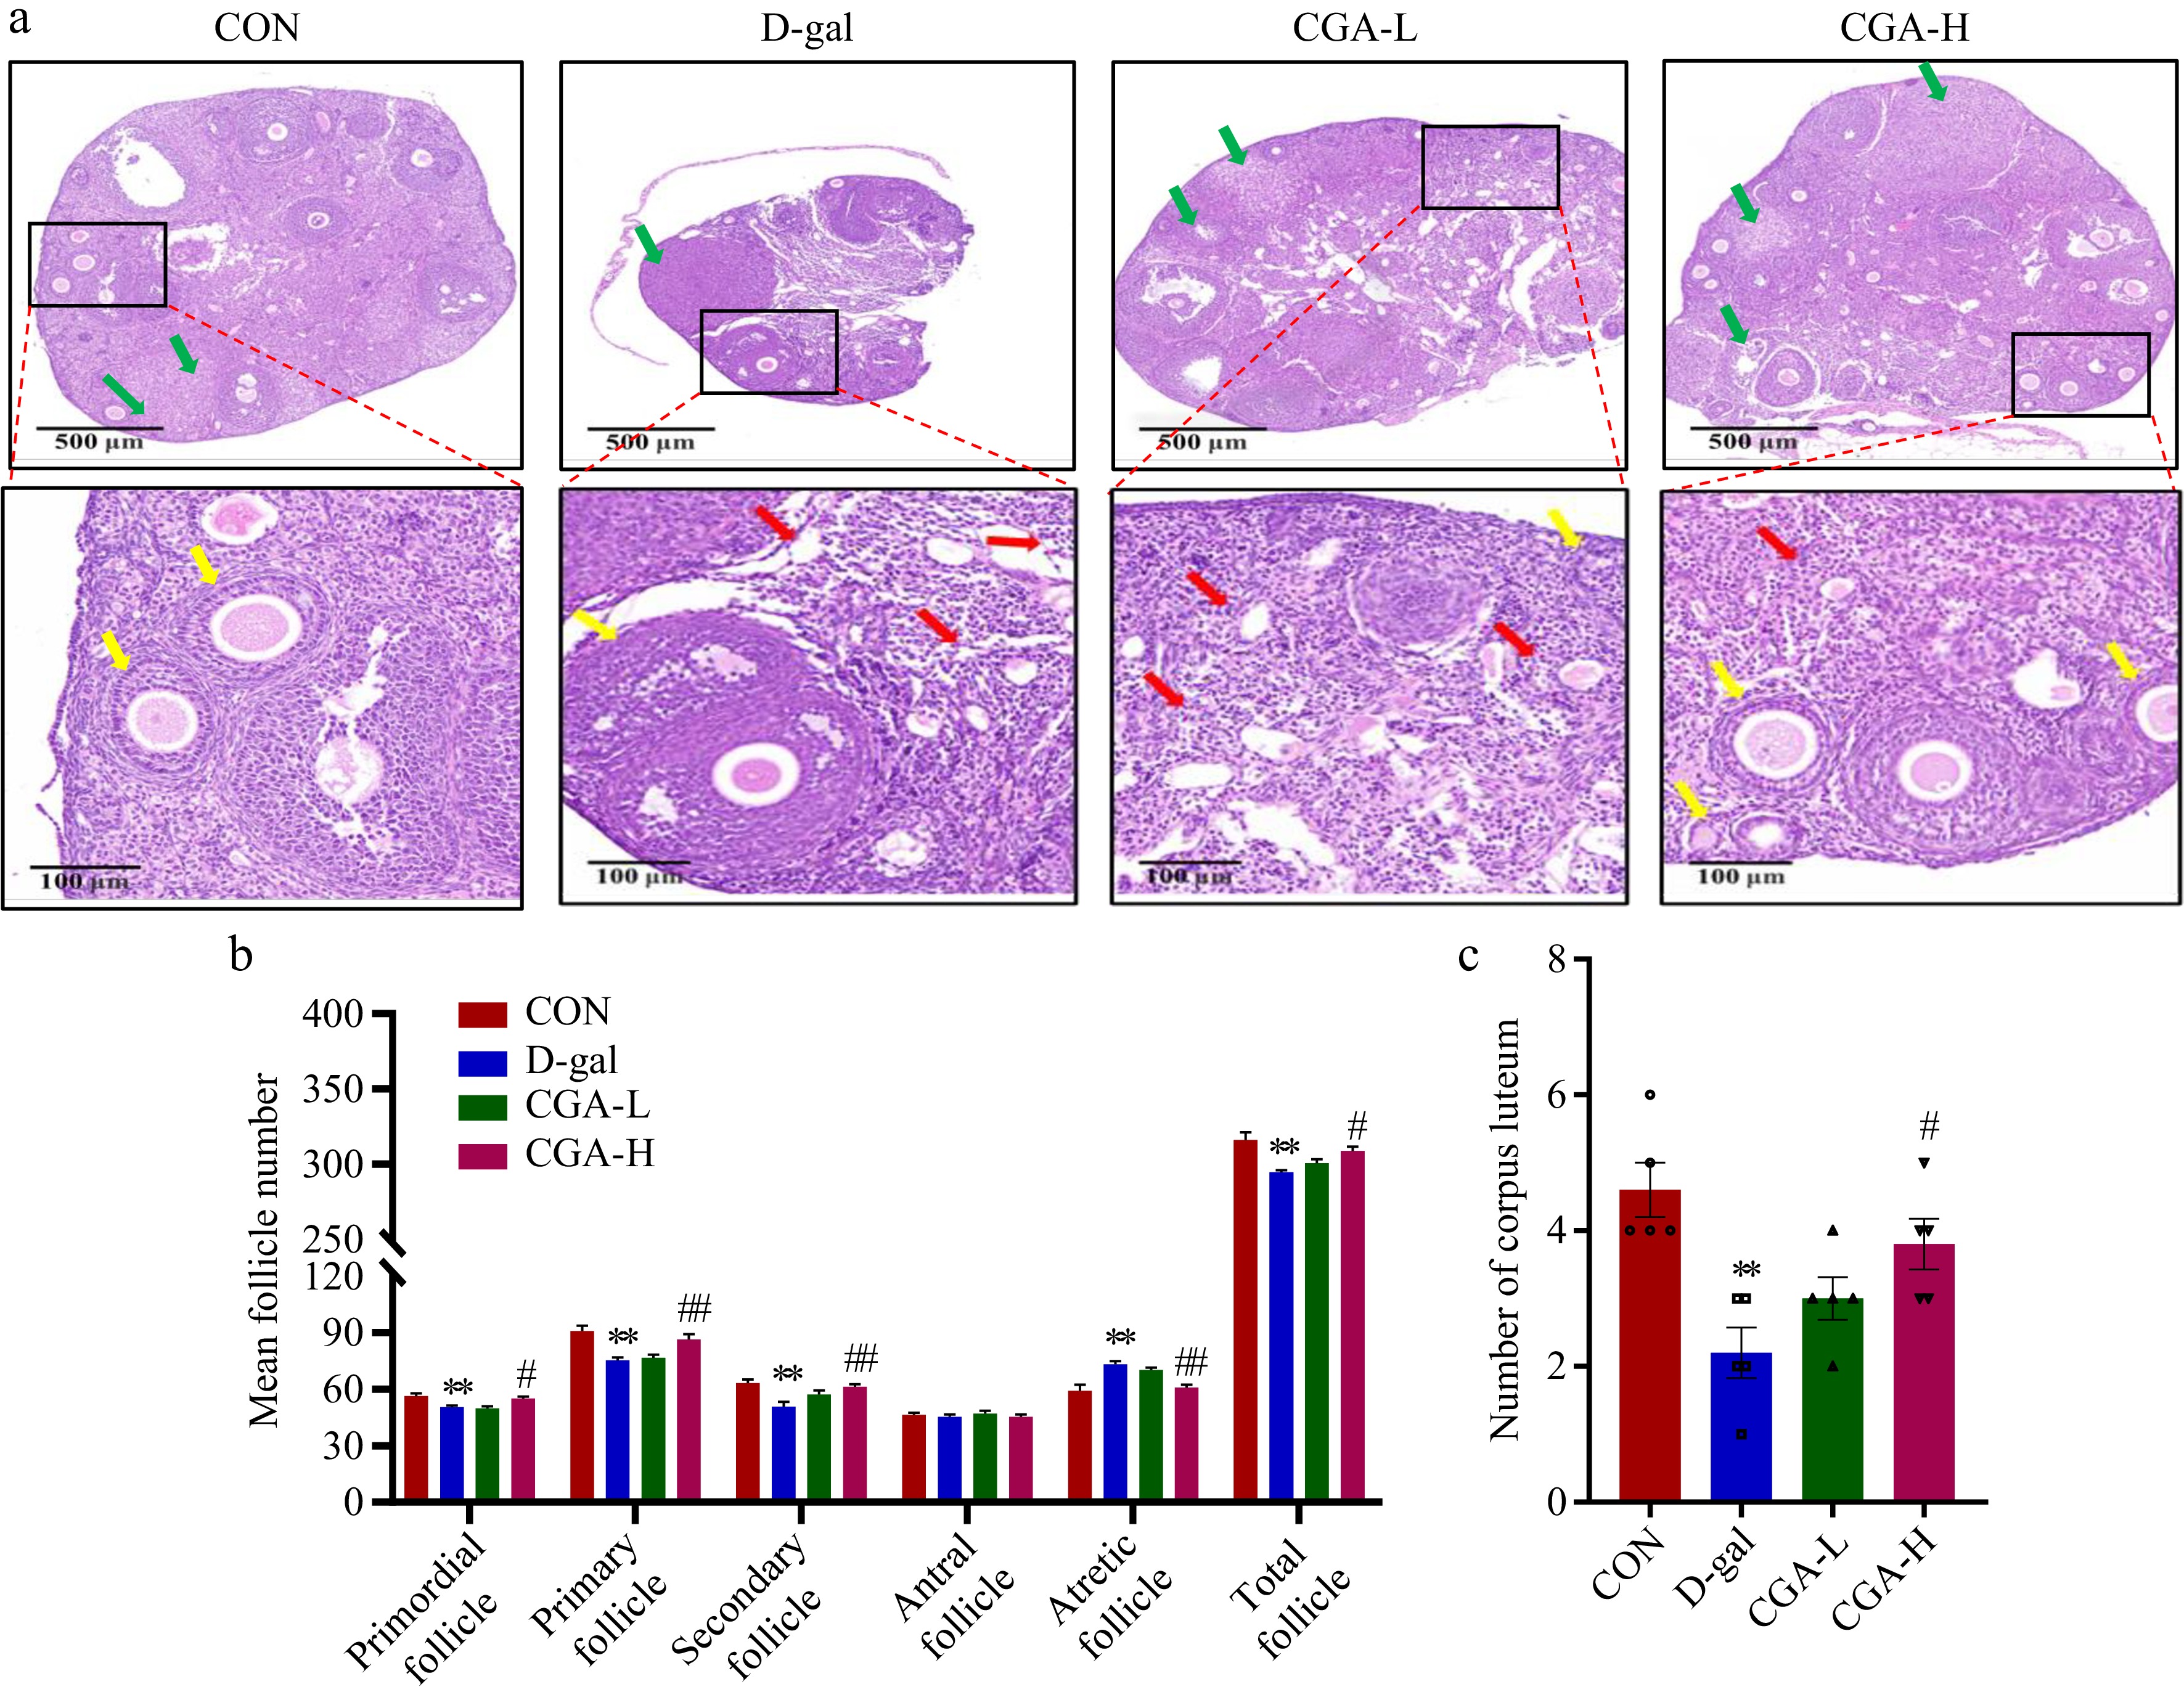
Figure 3.
Effects of CGA treatment on follicular development in POF mice. (a) Histology of ovary sections stained with H&E. The yellow arrows represent the primordial, primary, secondary, or antral follicles. The red arrows represent atretic follicles. The green arrows represent corpora lutea. Scale bars = 500 μm at 5× and 100 μm at 20× magnification. The counts of (b) follicles, and (c) corpora lutea at various stages of development in the ovaries are summarized (n = 5). The data are shown as the means ± SEMs. ** Significance vs the CON group (p < 0.01), # and ## significance vs the D-gal group (p < 0.05, p < 0.01).
-
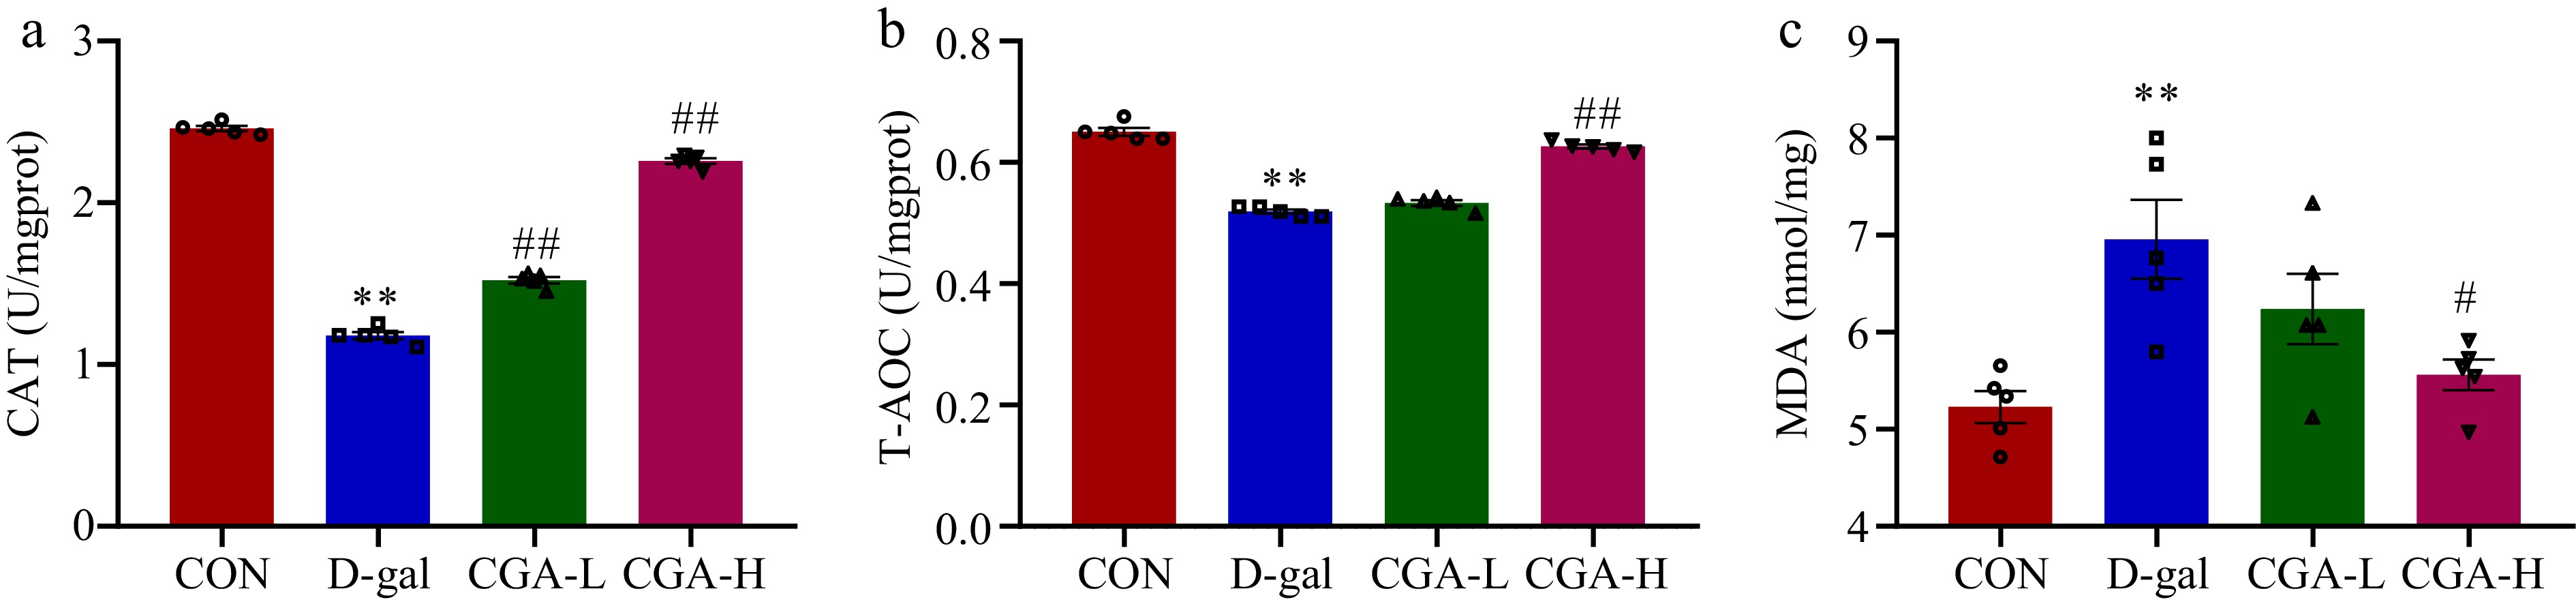
Figure 4.
Effect of CGA treatment on ovarian oxidative stress in POF mice. (a)−(c) The CAT and T-AOC activities and the MDA content were determined via commercial ELISA kits (n = 5). The data are shown as the means ± SEMs. ** Significance vs the CON group (p < 0.01), # and ## significance vs the D-gal group (p < 0.05, p < 0.01).
-
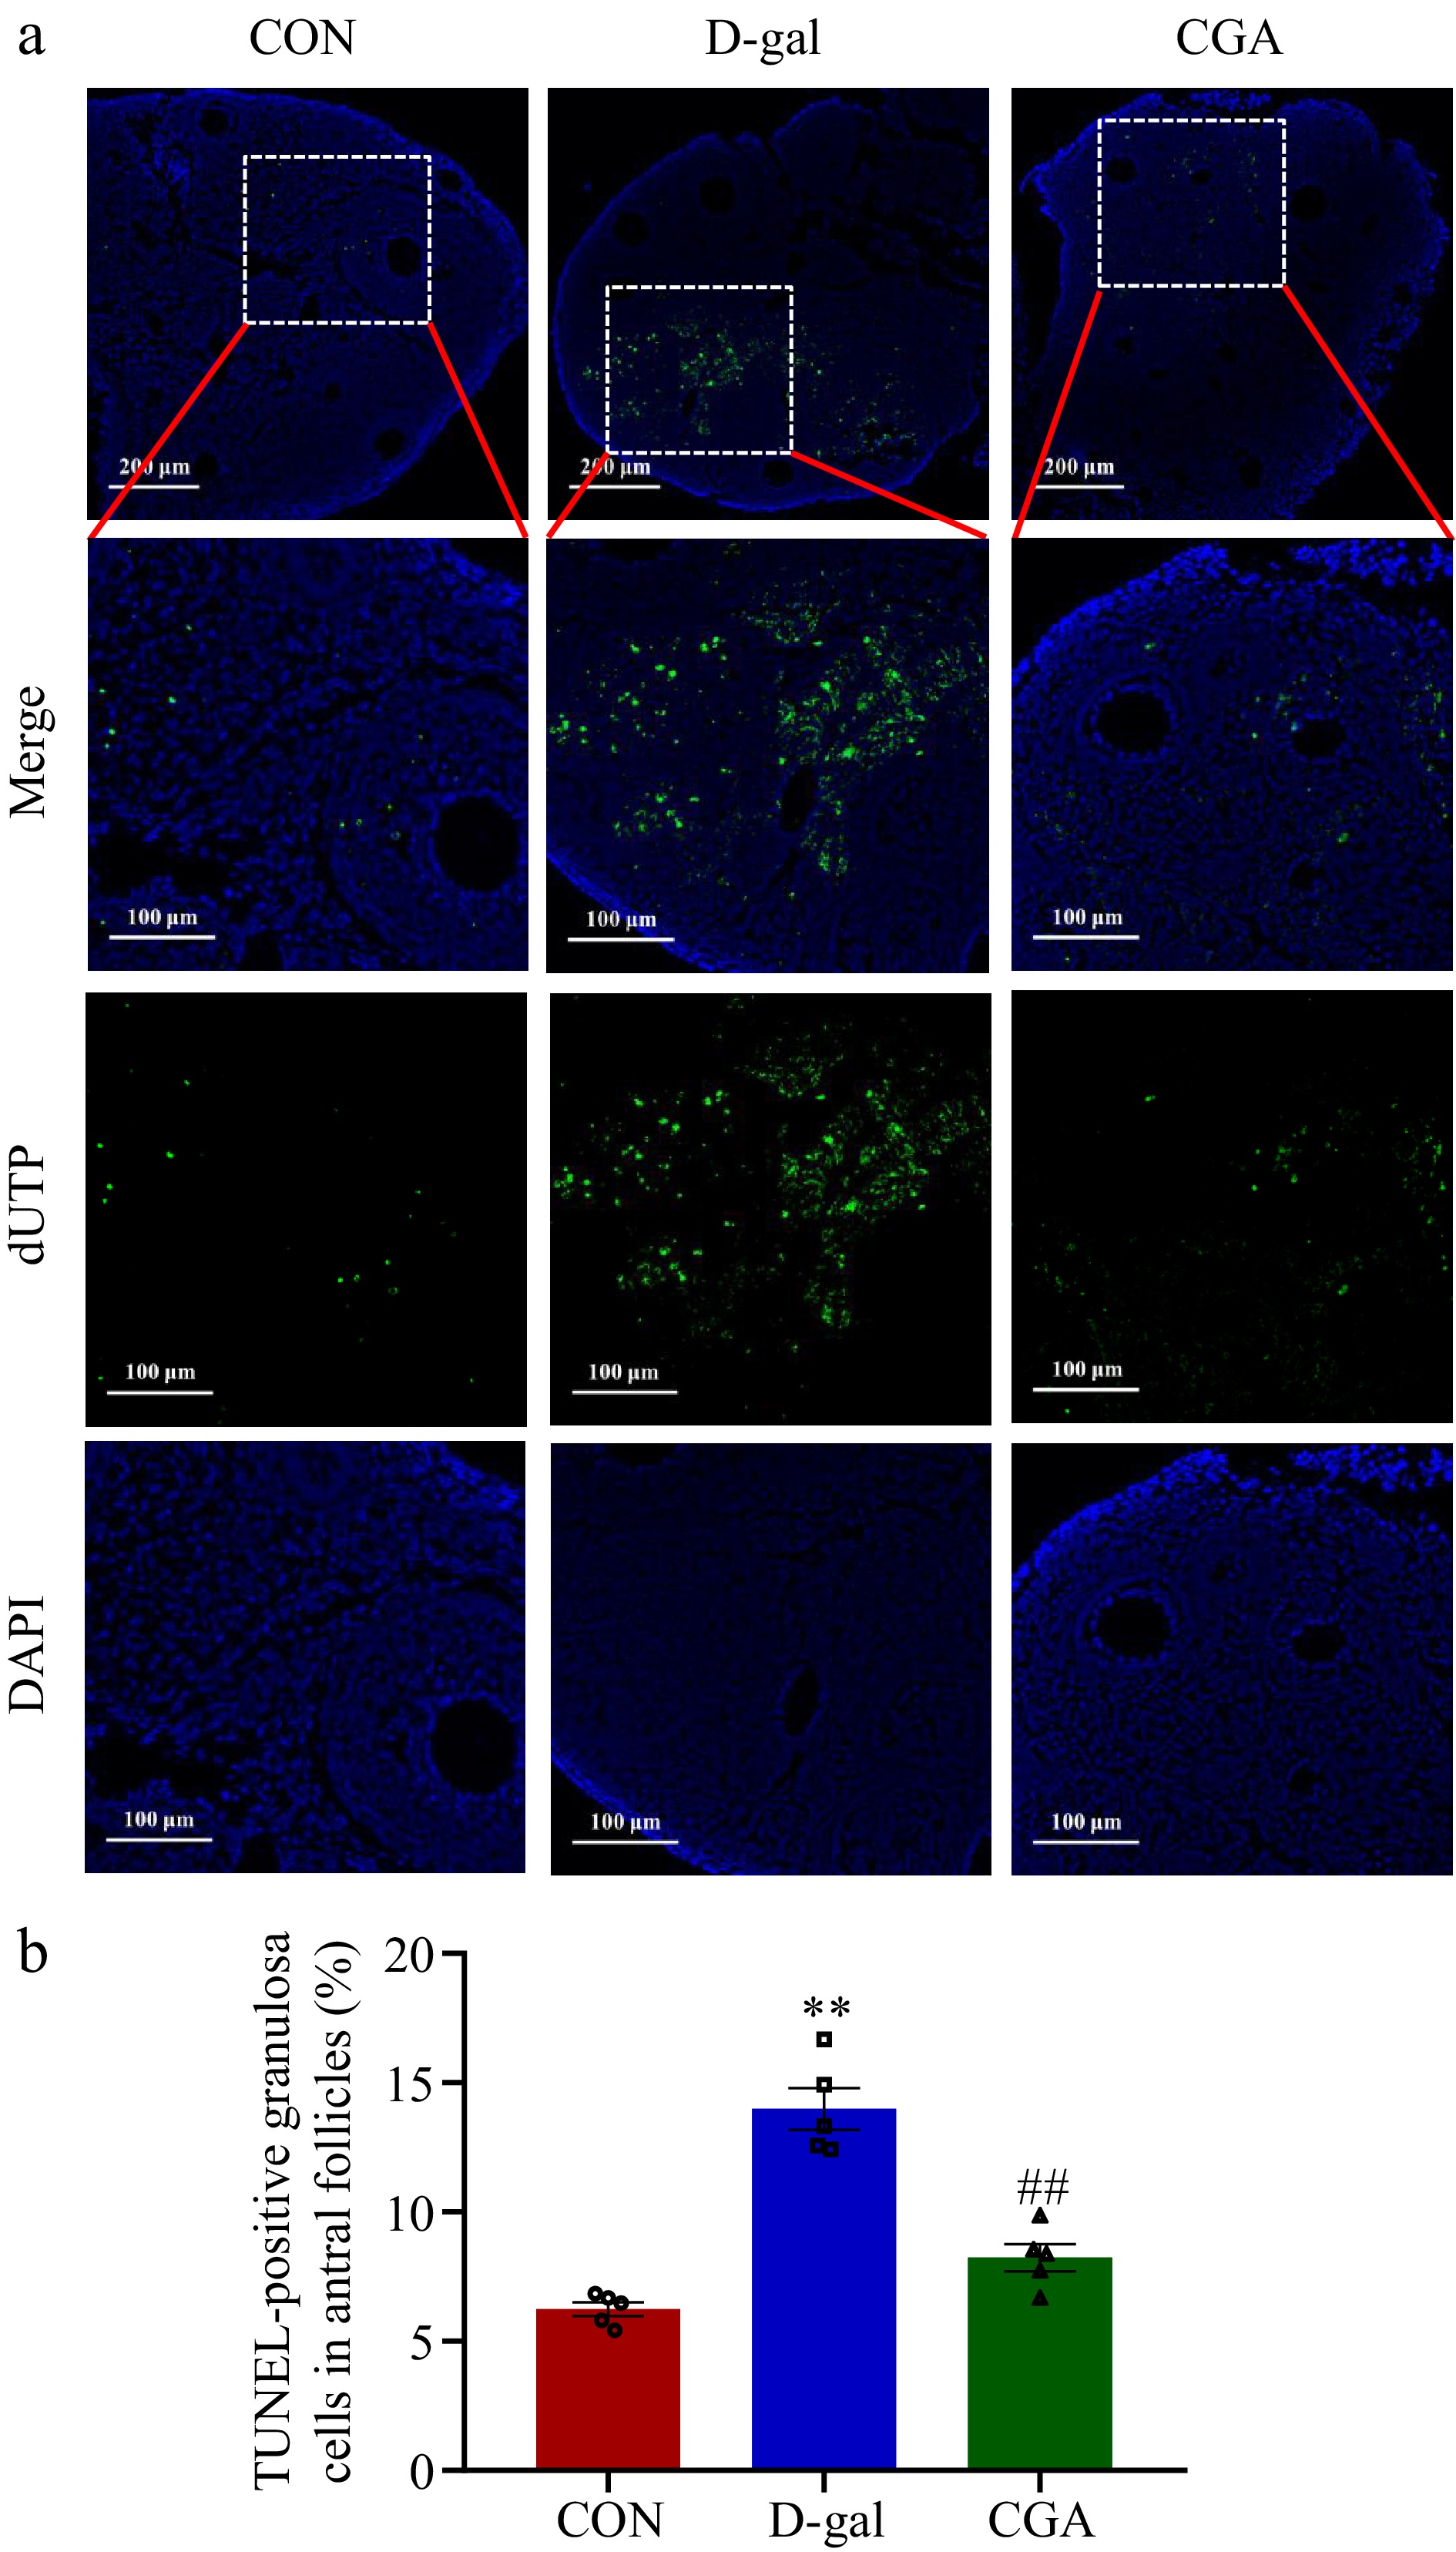
Figure 5.
Effect of CGA treatment on ovarian cell apoptosis in POF mice. (a) Apoptosis was detected via in situ TUNEL fluorescence. The nuclei of TUNEL-positive (apoptotic) cells were stained green. Scale bar = 200 μm at 10.7× and 100 μm at 24.5× magnification. (b) The percentage of TUNEL-positive granulosa cells in antral follicles was compared among the three groups (n = 5). The data are shown as the means ± SEMs. ** Significance vs the CON group (p < 0.01), ## significance vs the D-gal group (p < 0.01).
-
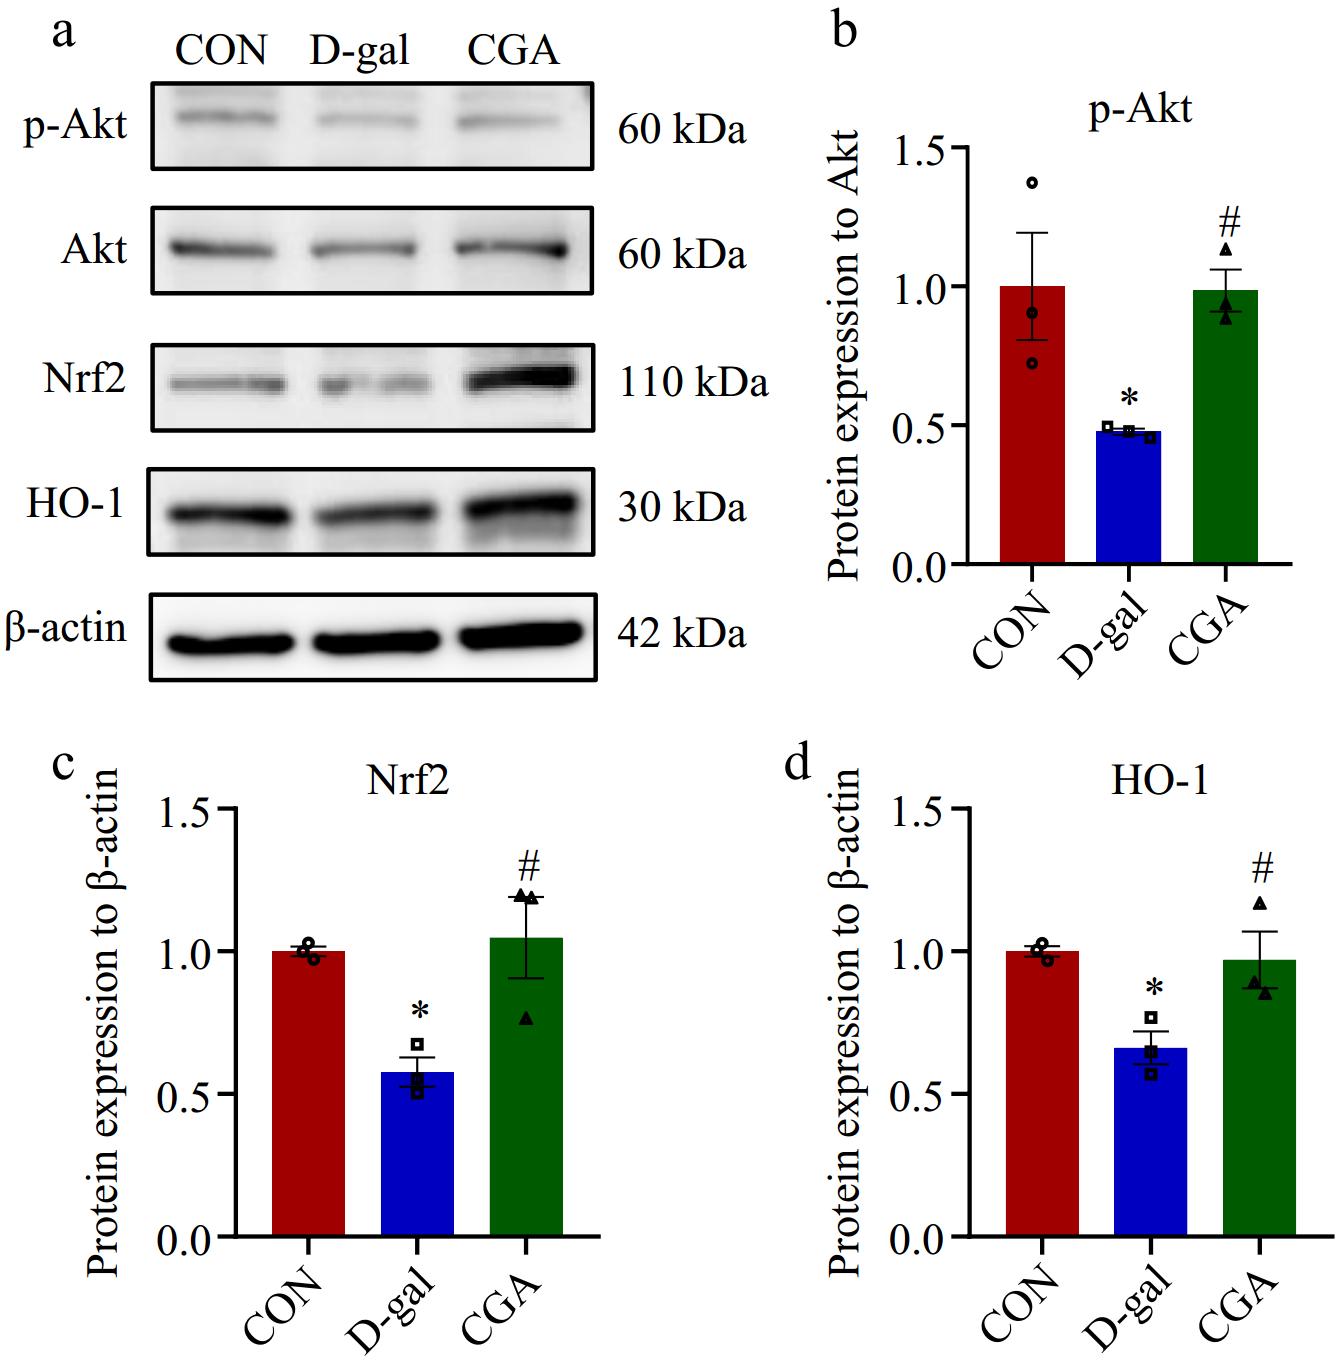
Figure 6.
Effect of CGA treatment on the expression of proteins associated with the oxidative stress signalling pathway in POF mice. (a) The expression levels of associated proteins were assessed via Western blotting. (b)−(d) The expression levels of associated proteins were quantitatively detected (n = 3). The data are shown as the means ± SEMs. * Significance vs the CON group (p < 0.05), # significance vs the D-gal group (p < 0.05).
-
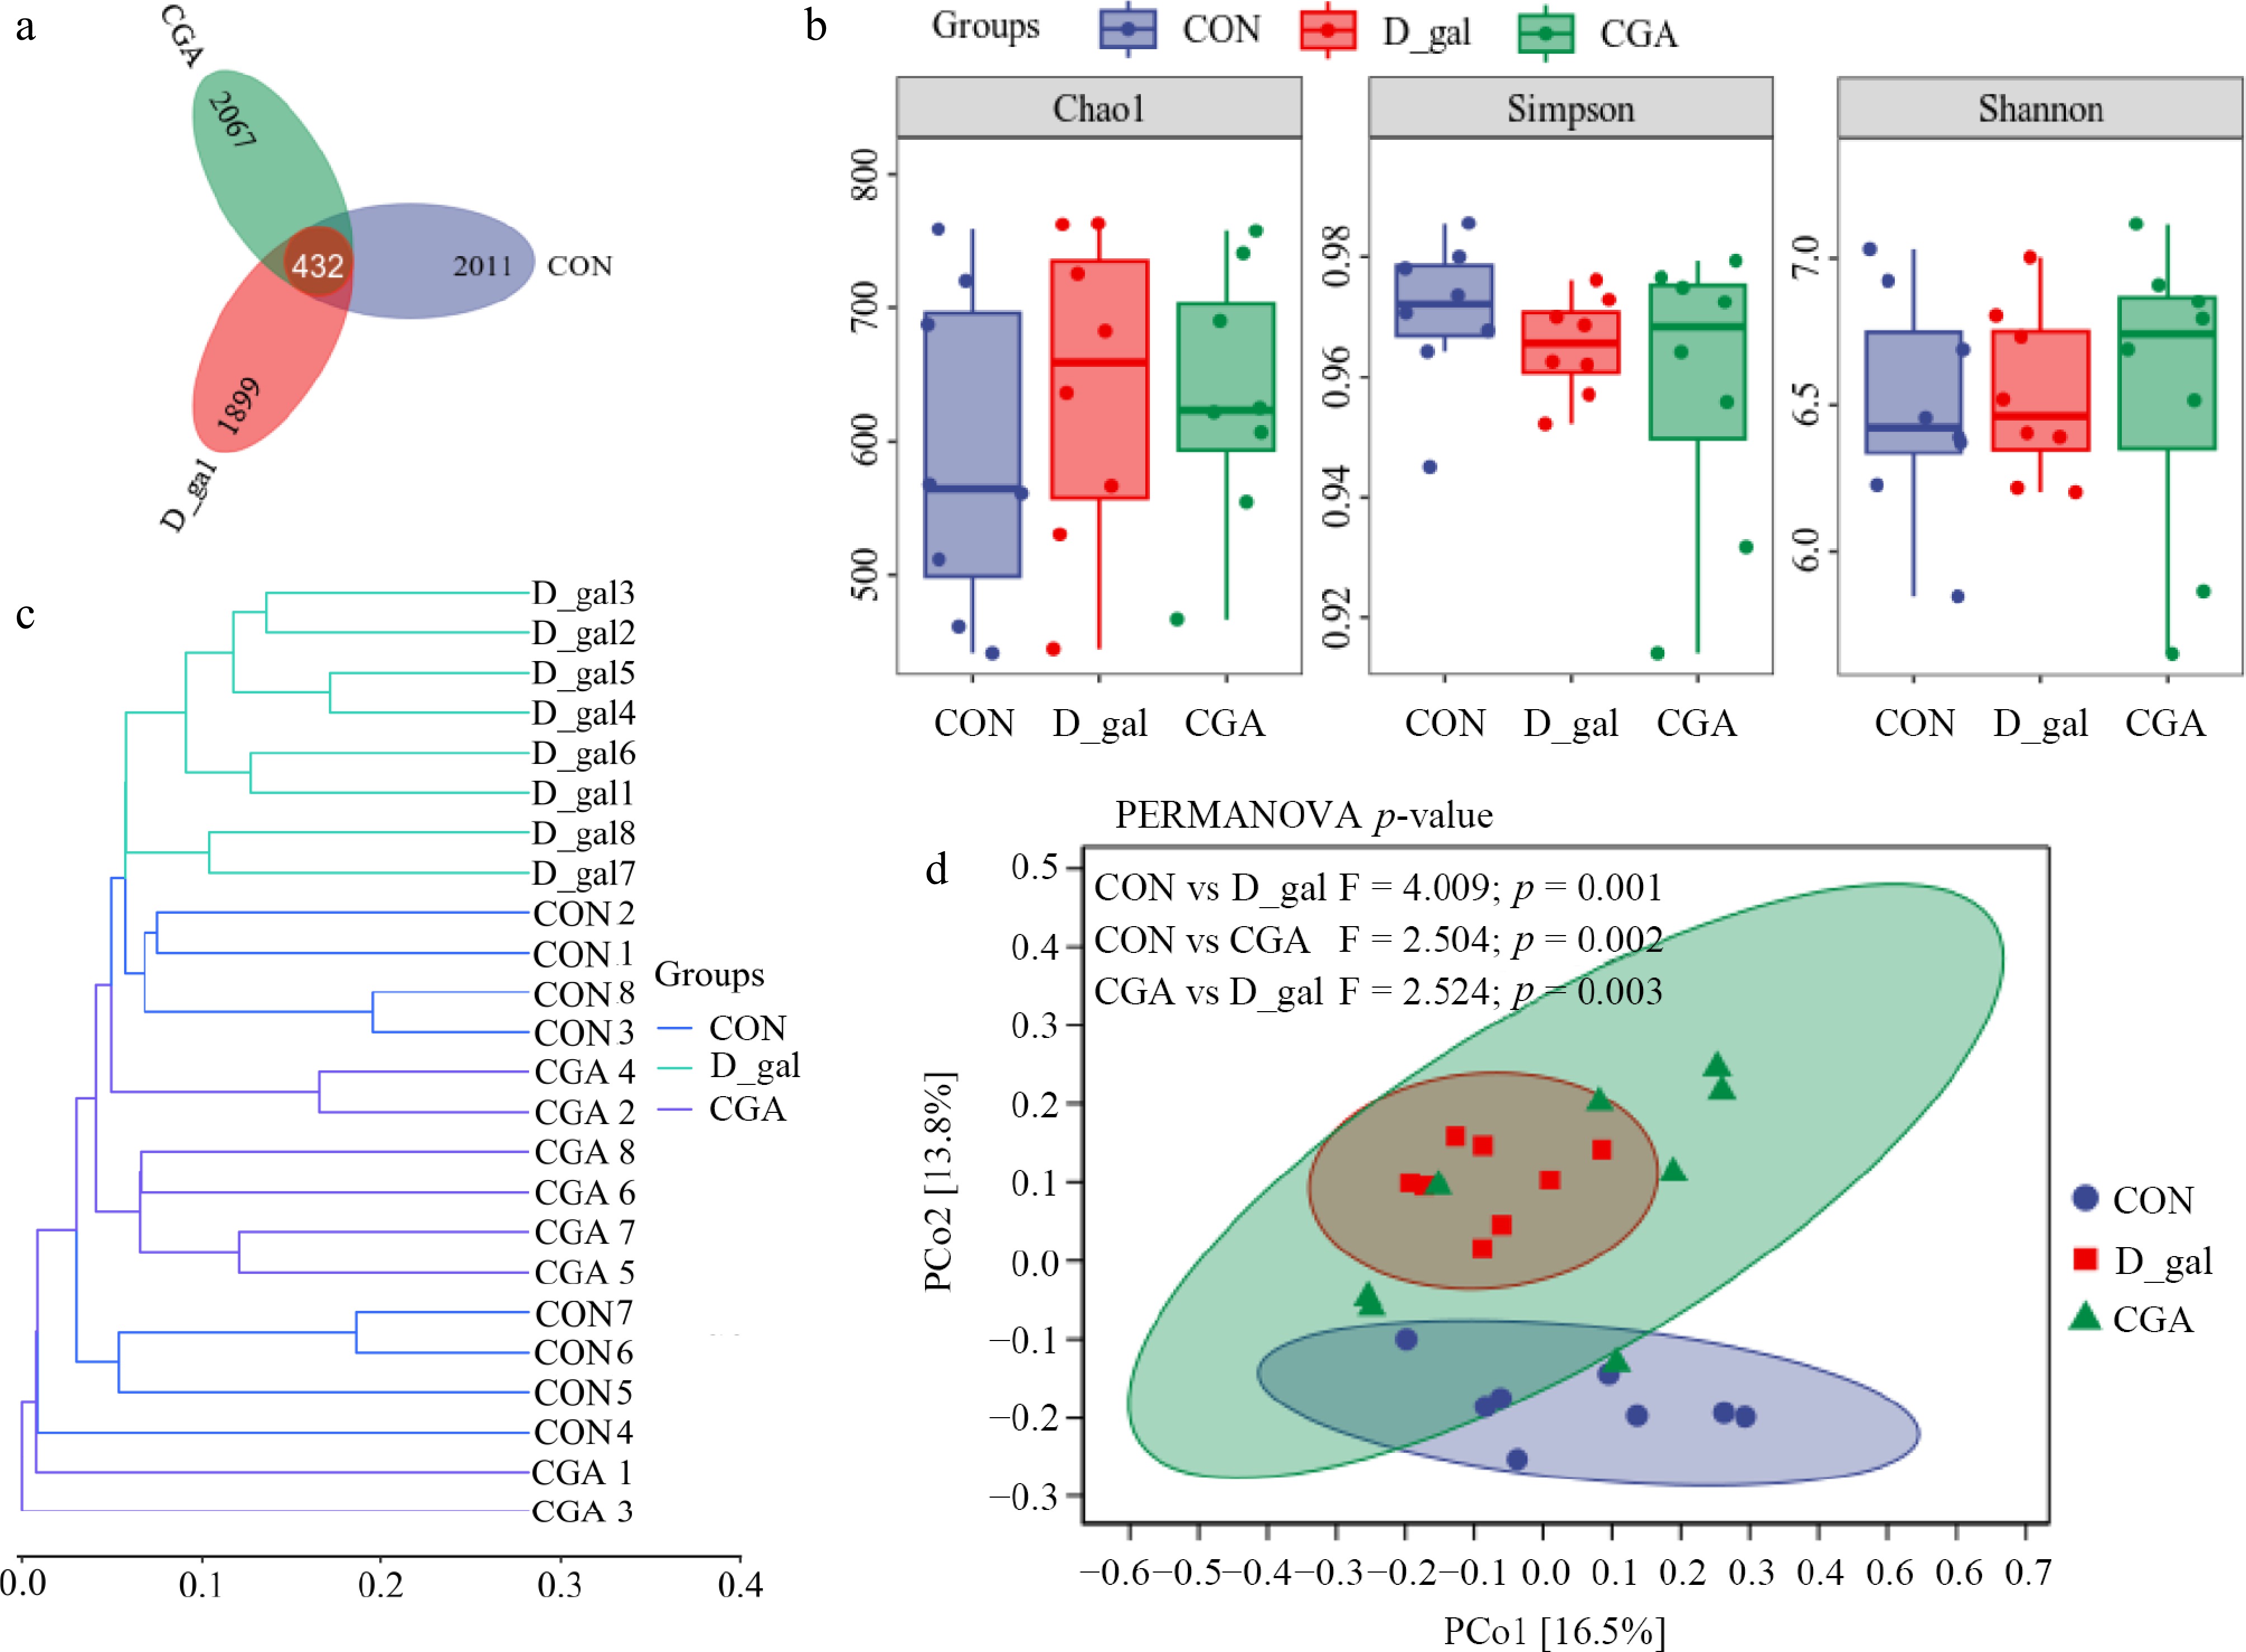
Figure 7.
Effects of CGA treatment on faecal microbial diversity in POF mice. (a) Venn diagram displaying the number of shared ASVs within each sample (n = 8). (b) Alpha diversity was evaluated via the Chao1, Shannon, and Simpson indices (n = 8). Beta diversity was measured based on the Bray‒Curtis distance and shown by (c) hierarchical clustering analysis, and (d) principal coordinate analysis (PCoA) (n = 8). PERMANOVA was used to detect differences between the groups.
-
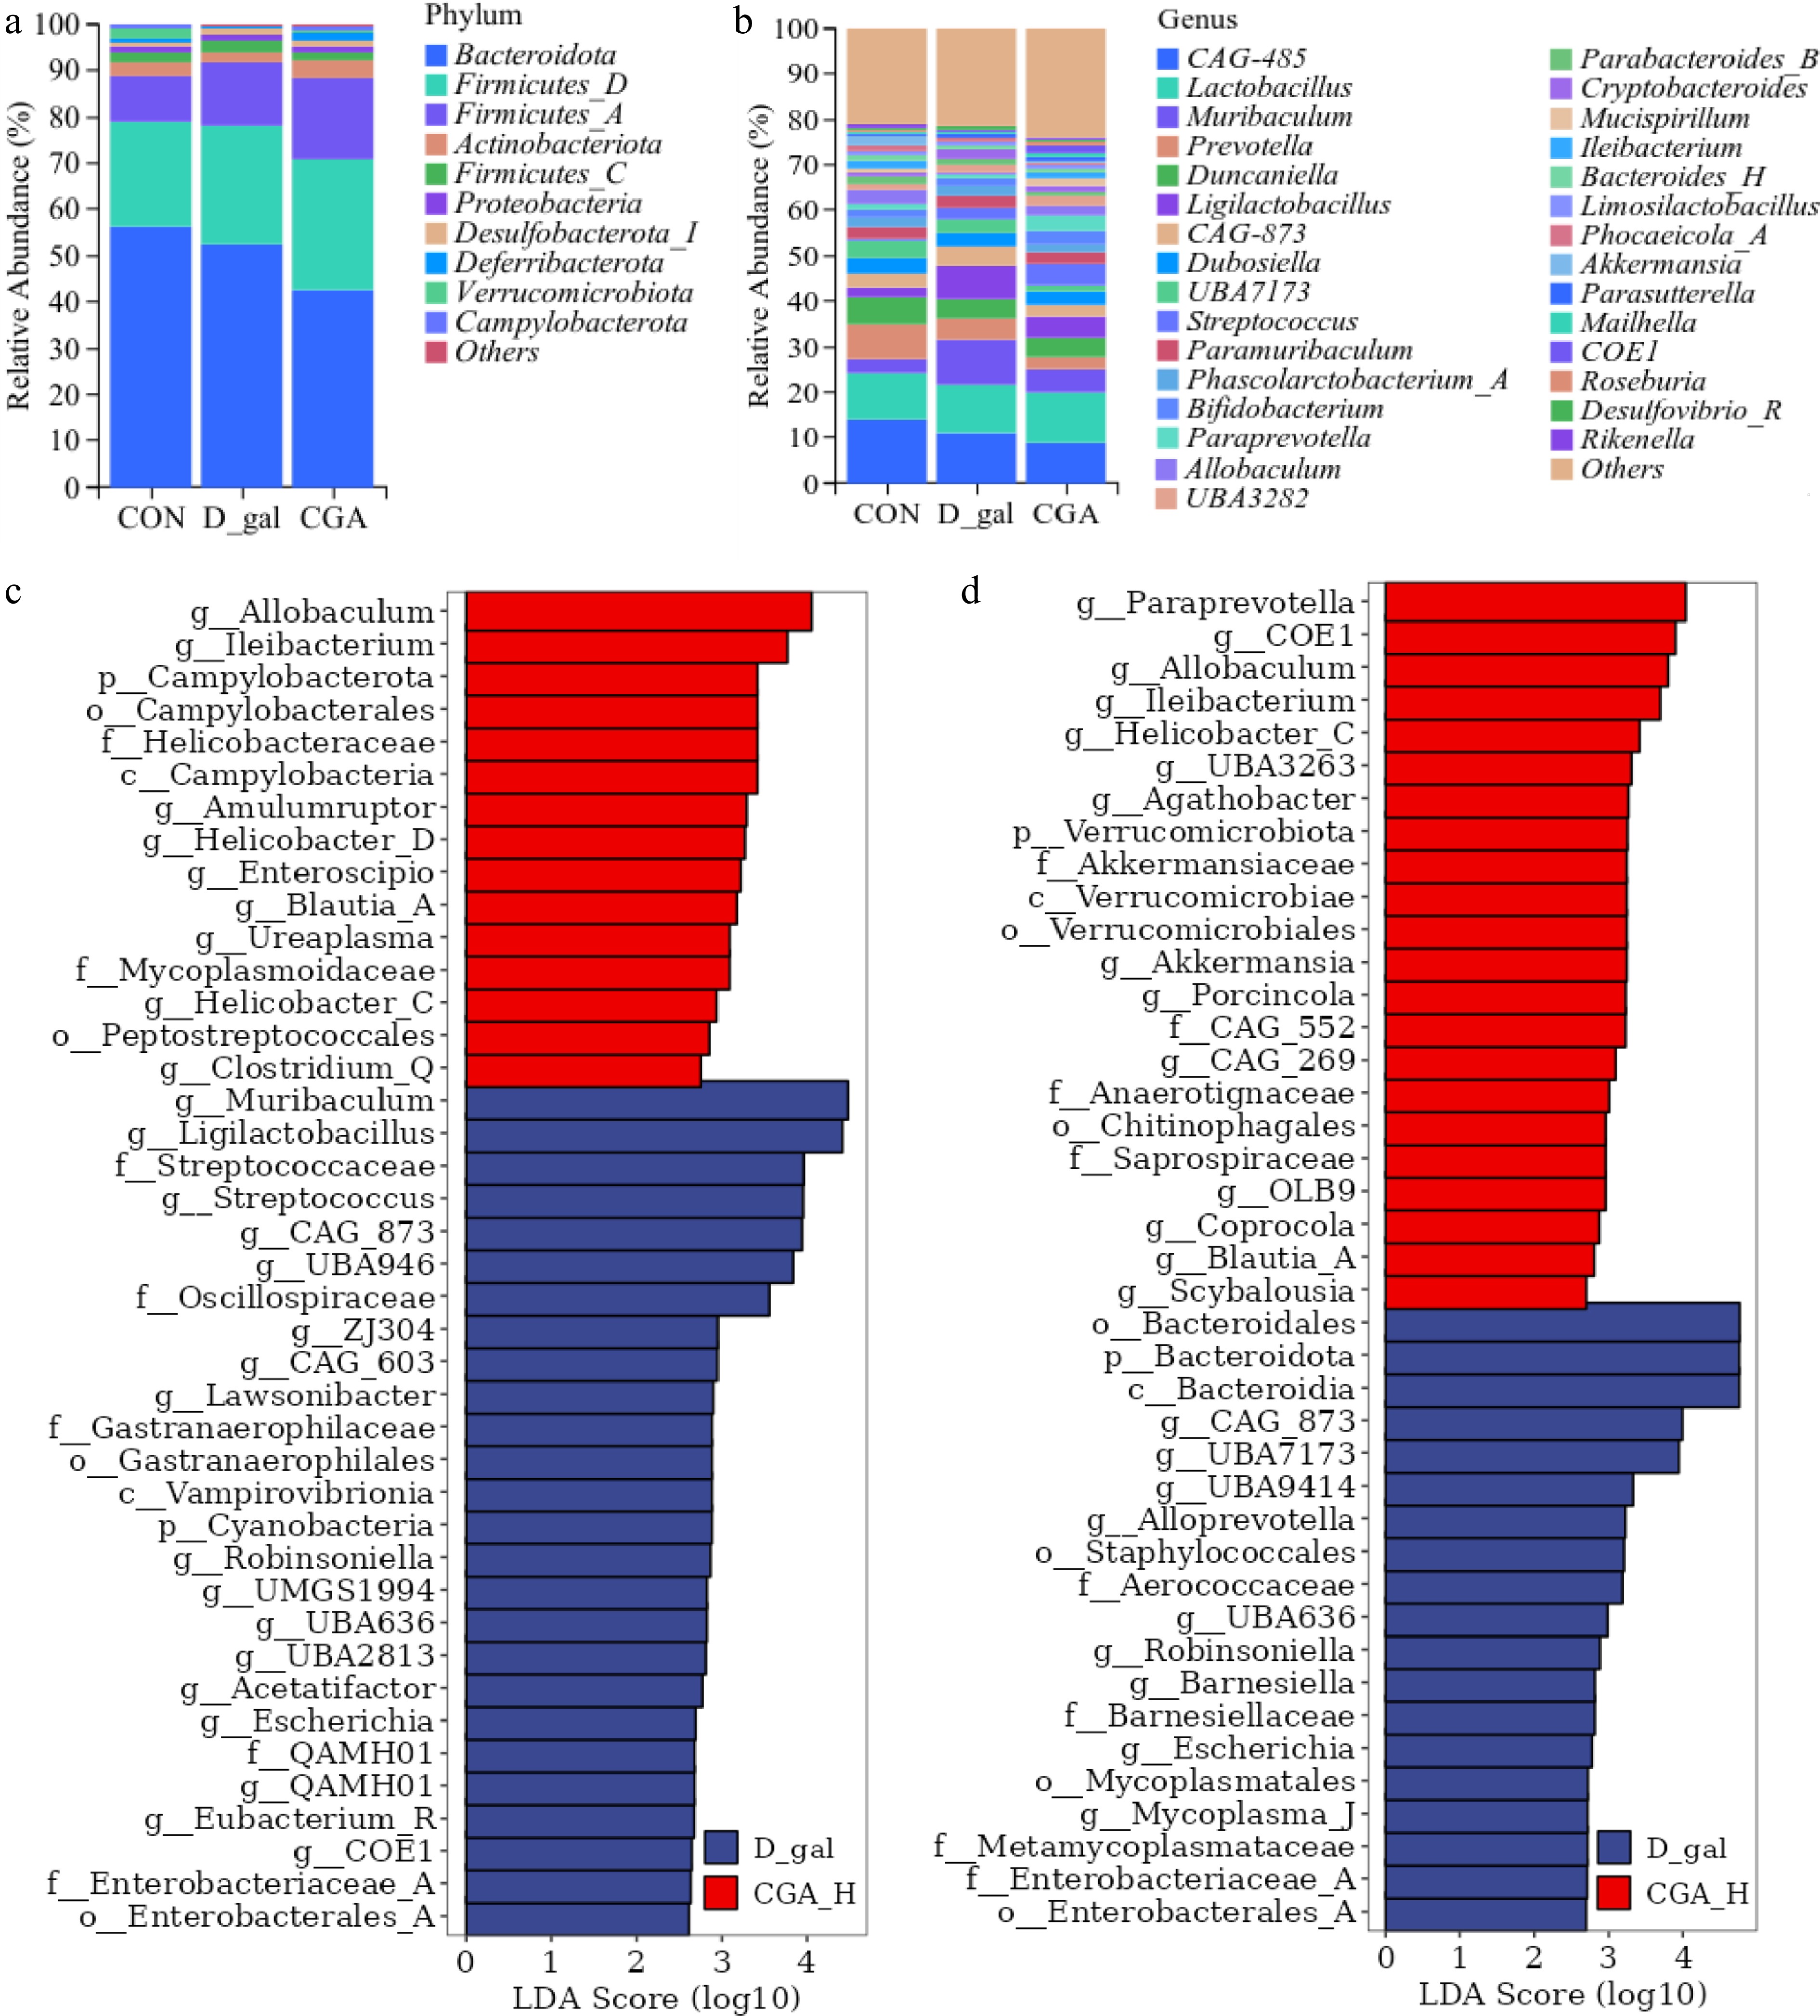
Figure 8.
Effects of CGA treatment on the faecal microbial composition of POF mice. The relative abundances of the (a) phyla, and (b) genera of the faecal microbial taxa in the mice. Linear discriminant analysis effect size (LEfSe) analysis with an LDA score > 2 for the faecal microbial communities of the mice. (c) The enriched faecal microbial taxa between the mice in the CON group and those in the D-gal group, and (d) the enriched faecal microbial taxa between the mice in the D-gal group and those in the CGA group are shown (n = 8). The red bars suggest enrichment in the CON or CGA group; the blue bars suggest enrichment in the D-gal group.
-
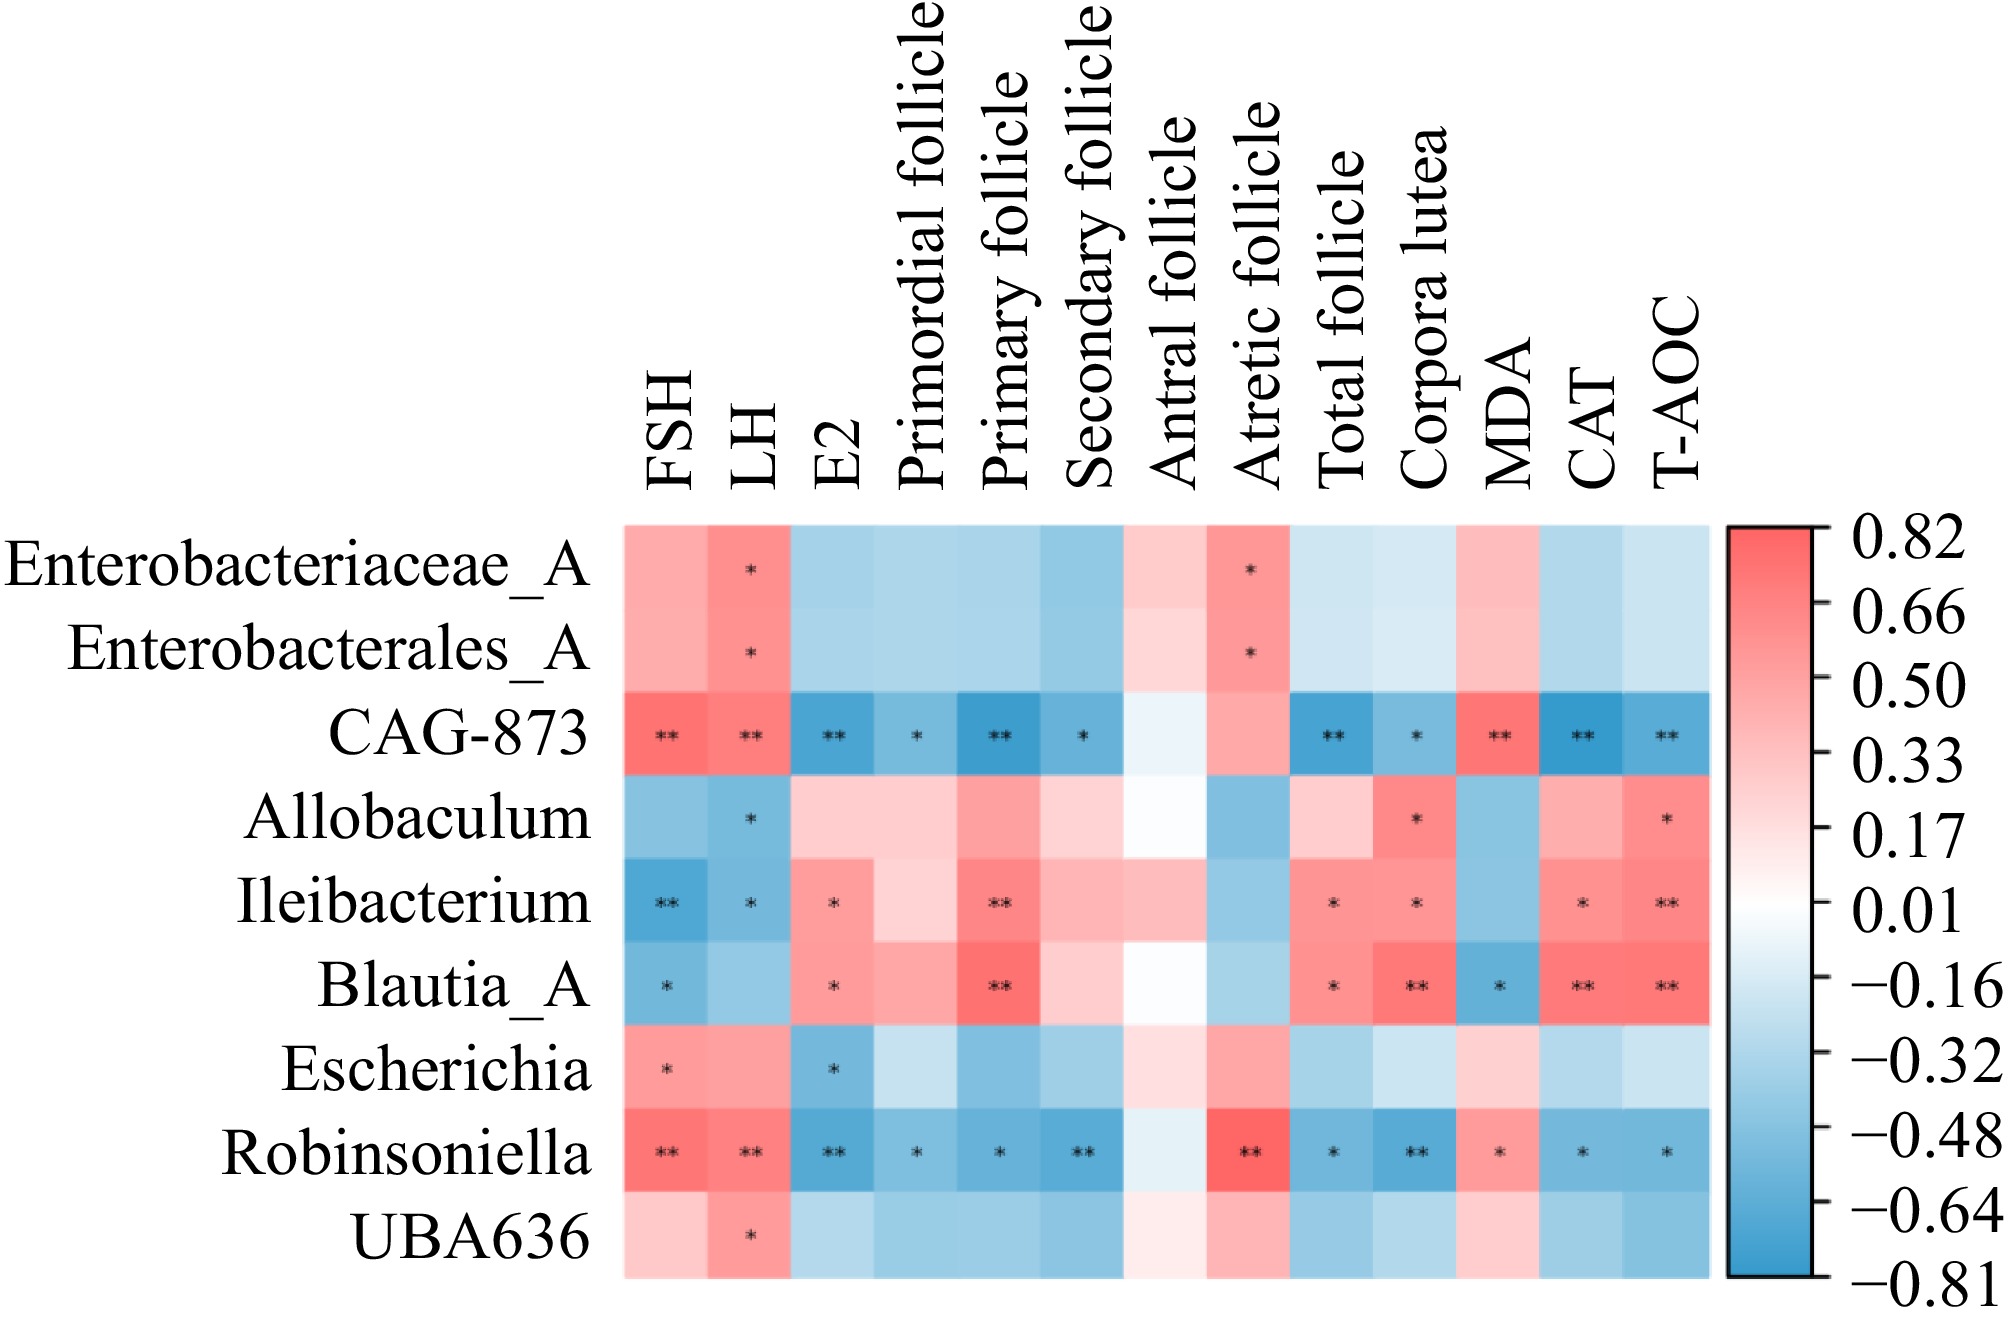
Figure 9.
Heatmap of the Spearman correlation coefficient between the CGA-responding microbiota and the parameters related to POF (n = 5). Red indicates a positive association, whereas blue indicates a negative association.
-
Genes Primer sequence (5'-3') Accession no. Length of
product (bp)Amh Forward: CCACACCTCTCTCCACTGGTA NM_007445.3 151 Reverse: GGCACAAAGGTTCAGGGGG Gapdh Forward: AGGTCGGTGTGAACGGATTTG NM_001411840.1 123 Reverse: TGTAGACCATGTAGTTGAGGTCA Table 1.
Primers used for qRT‒PCR.
Figures
(9)
Tables
(1)