-
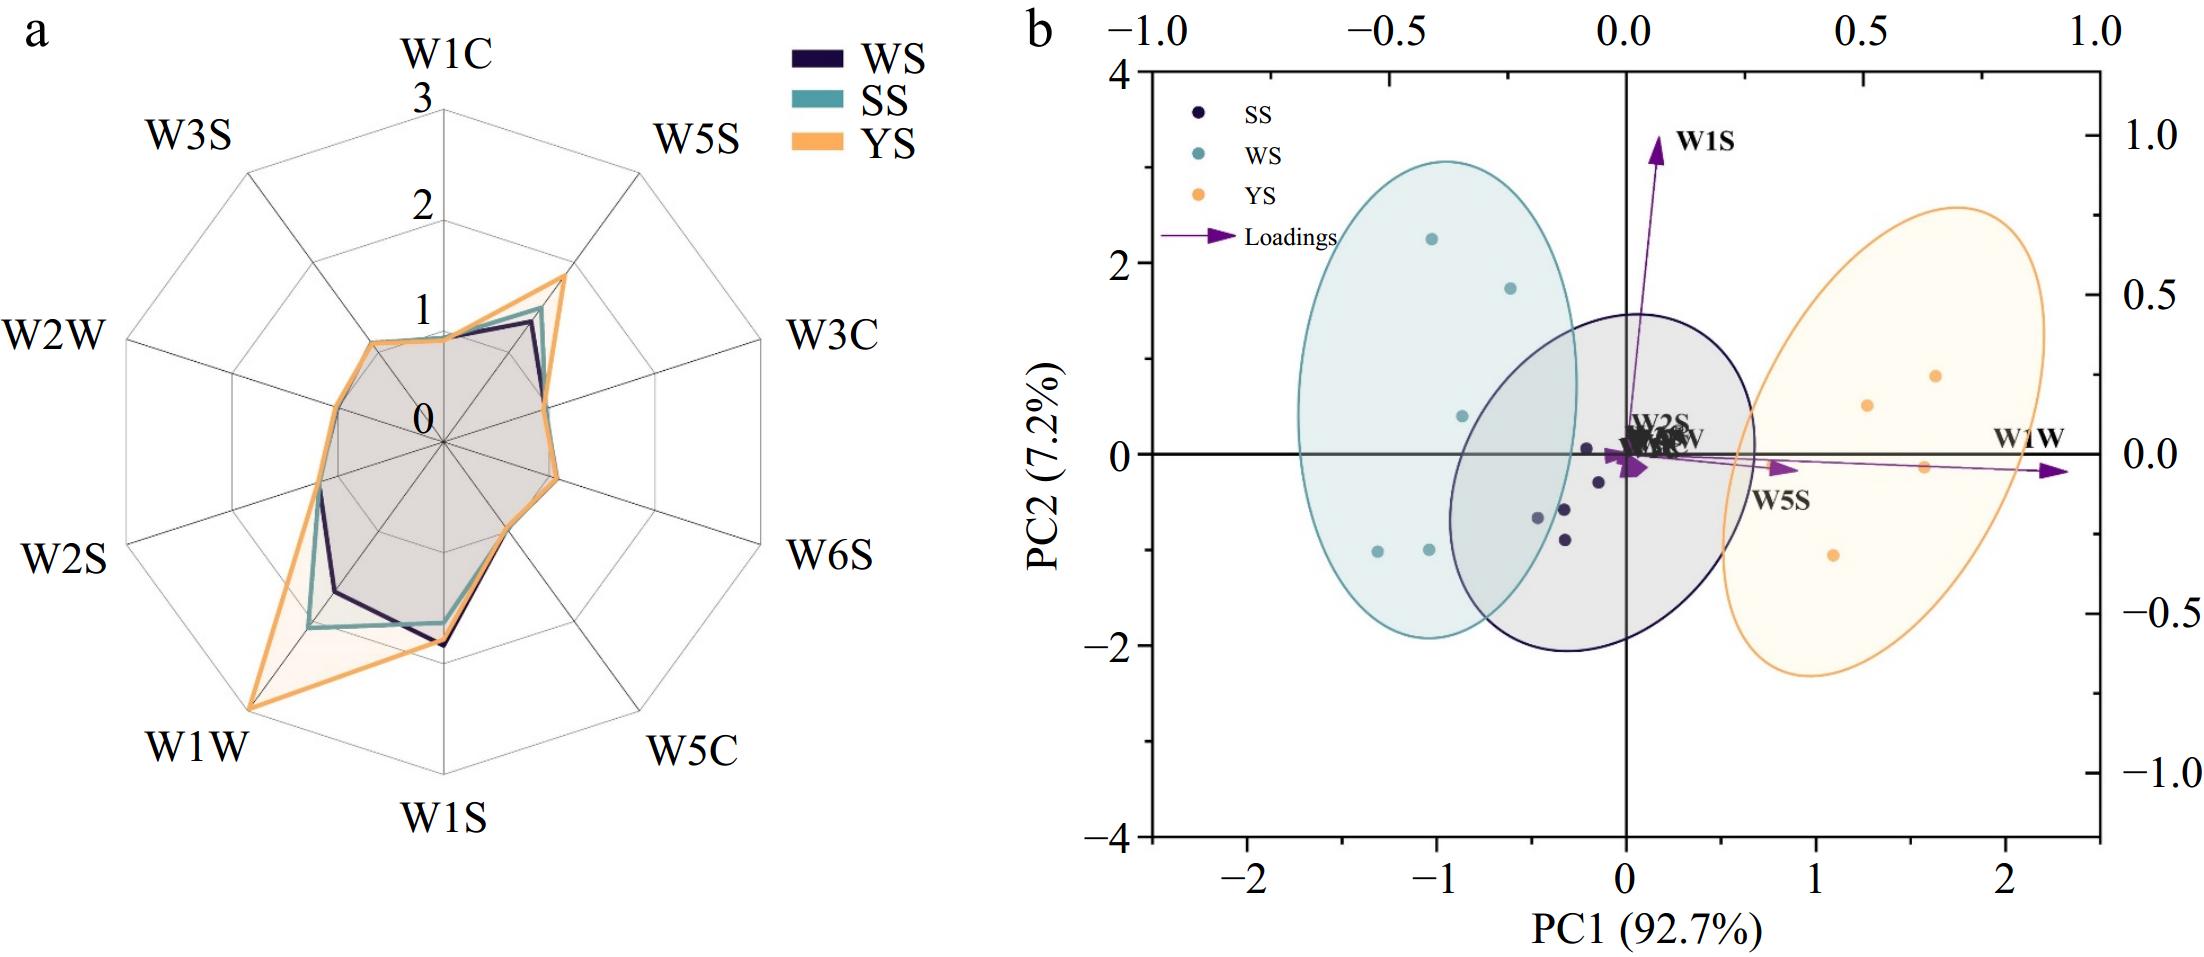
Figure 1.
(a) E-nose sensor response value, (b) PCA score plots of sturgeon surimi gels. Note: E-nose means electronic nose. PCA means Principal component analysis. WS: surimi gel made from sturgeon's white meat. SS: surimi gel made from sturgeon whole flesh. YS: surimi gel made from sturgeon's yellow meat.
-
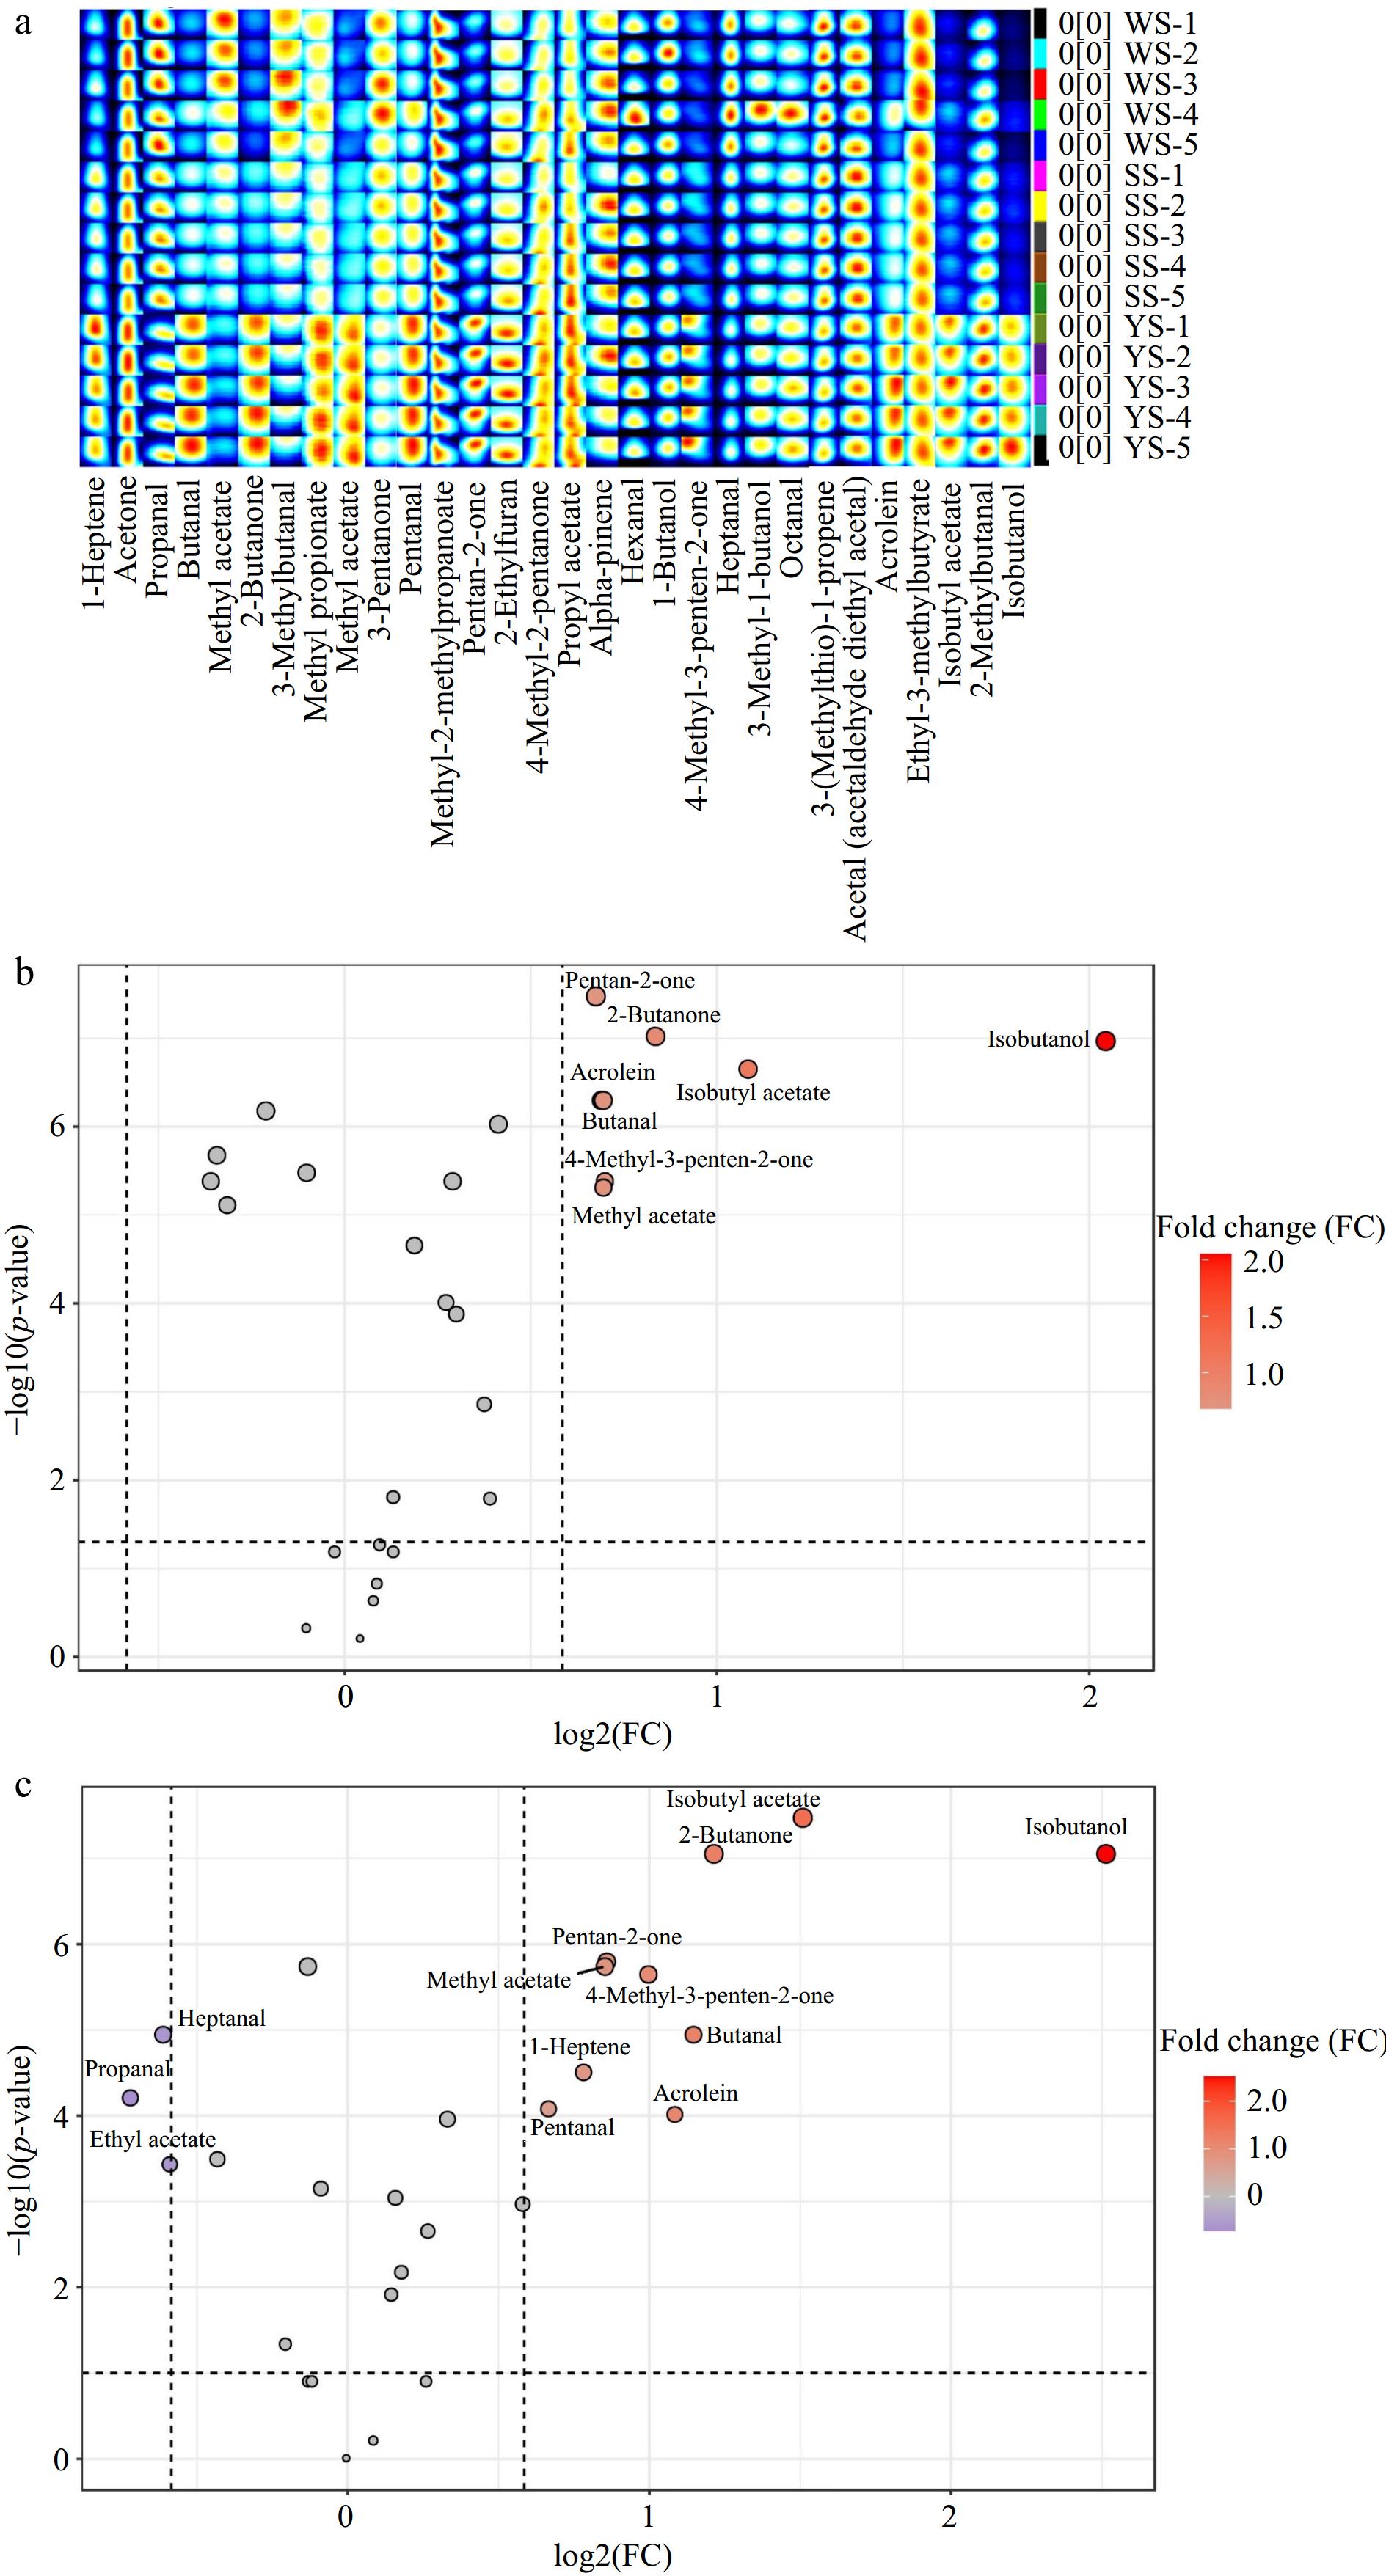
Figure 2.
(a) Gallery plot of sturgeon surimi gels' volatile compounds (VCs) detected by GC-IMS. (b) Volcano plot of VCs comparing YS and SS. (c) Volcano plot of VCs comparing YS and WS. Note: GC-IMS means gas chromatography–ion mobility spectrometry. The intensity information of GC-IMS signal was displayed via the color (white to red: low to high concentrations). The condition of volcano plot was set as Fold change (FC) > 1.5, p < 0.05, and FDR correction was used. WS: surimi gel made from sturgeon's white meat. SS: surimi gel made from sturgeon whole flesh. YS: surimi gel made from sturgeon's yellow meat.
-
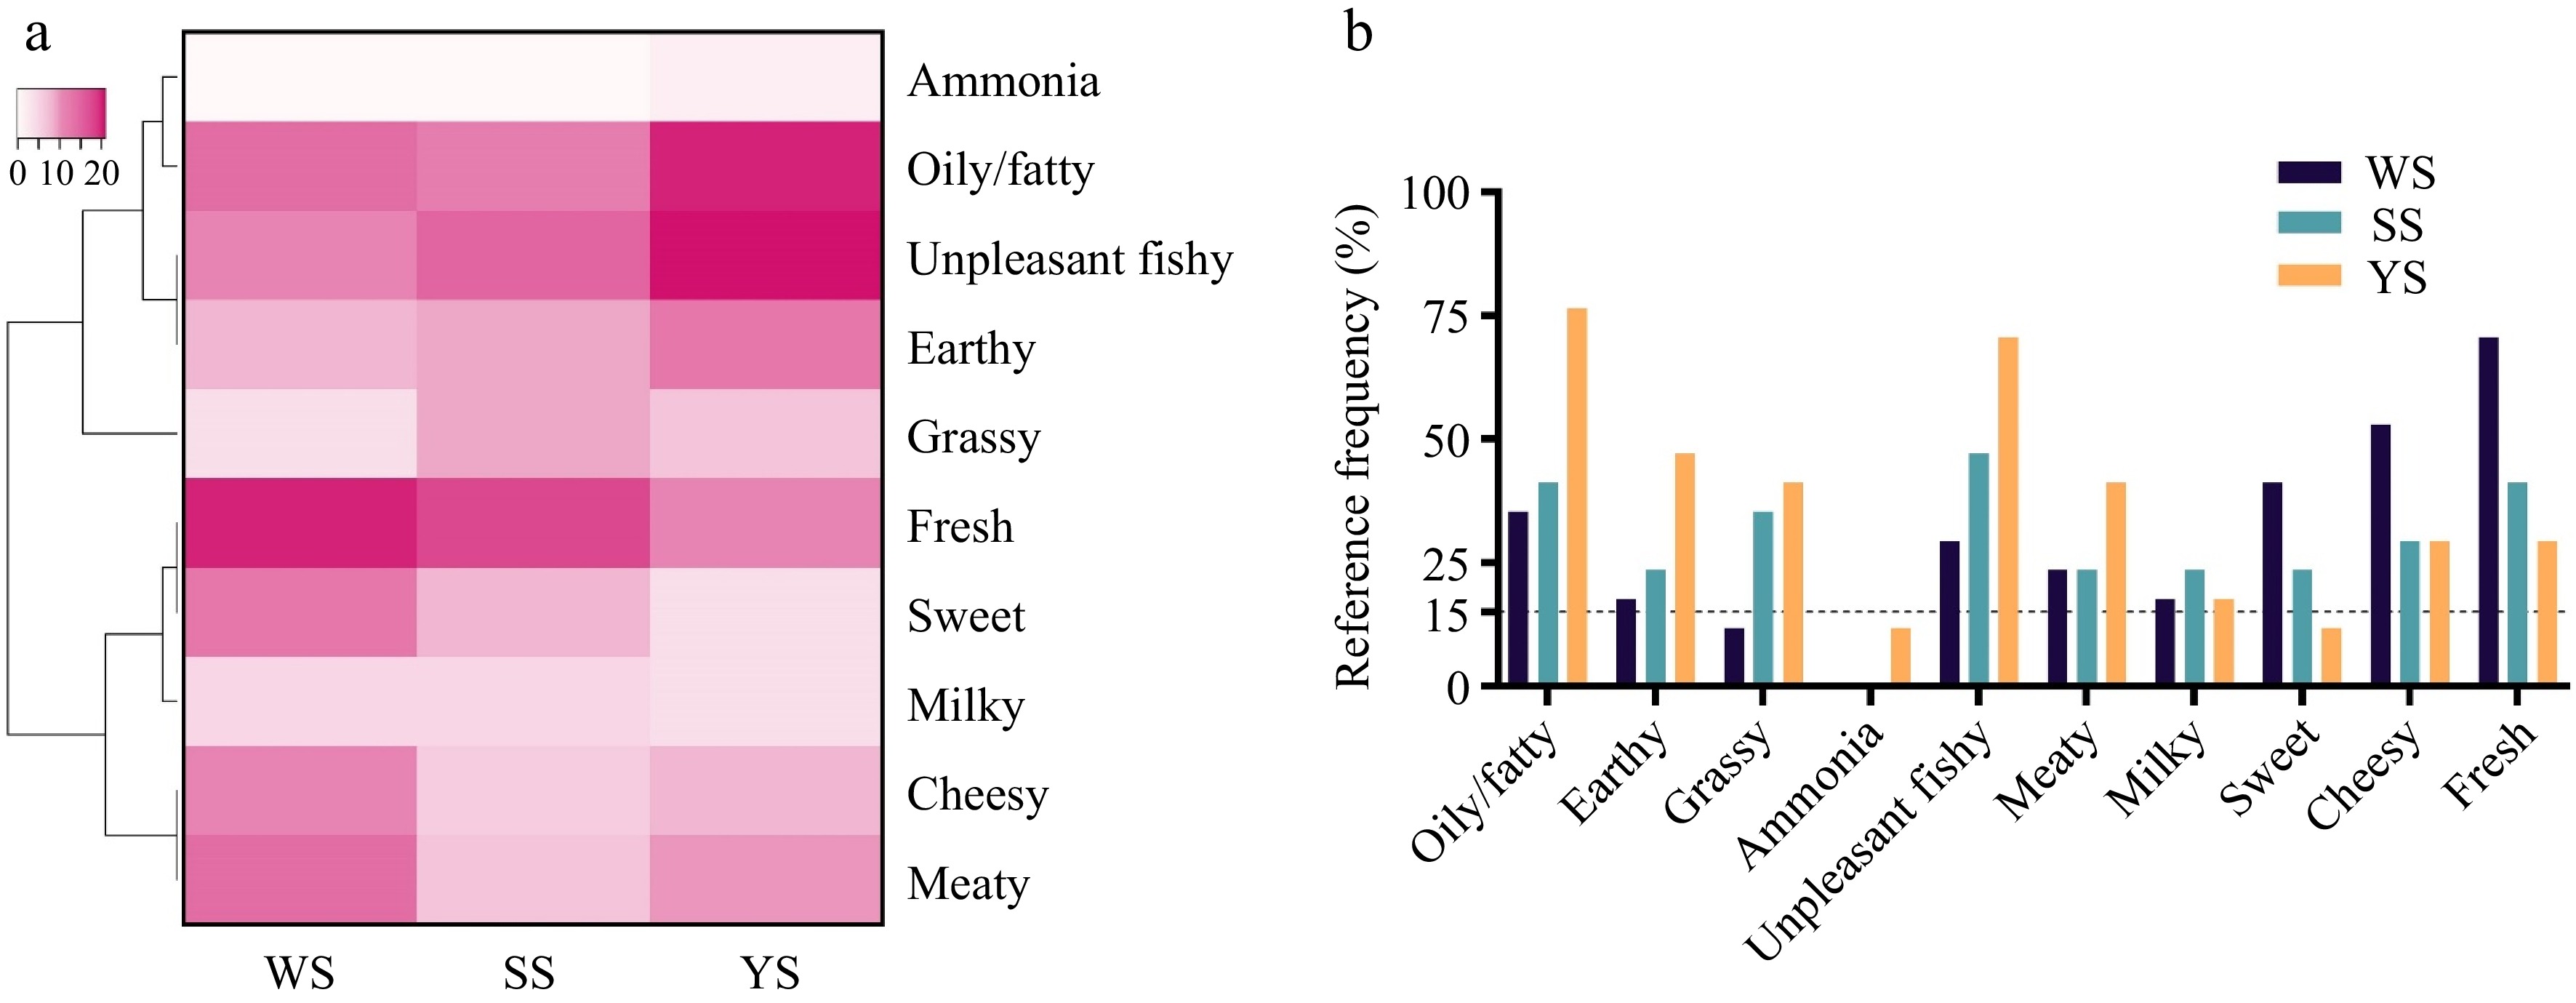
Figure 3.
(a) Clustering heatmap of the cited descriptors by FCP method. (b) Descriptors (quoting frequency > 15%) of sturgeon surimi gels by the CATA method. Note: FCP means Free Choice Profiling. CATA means Check-All-That-Apply. Cluster analysis using Pearman correlation coefficient. WS: surimi gel made from sturgeon's white meat. SS: surimi gel made from sturgeon whole flesh. YS: surimi gel made from sturgeon's yellow meat.
-
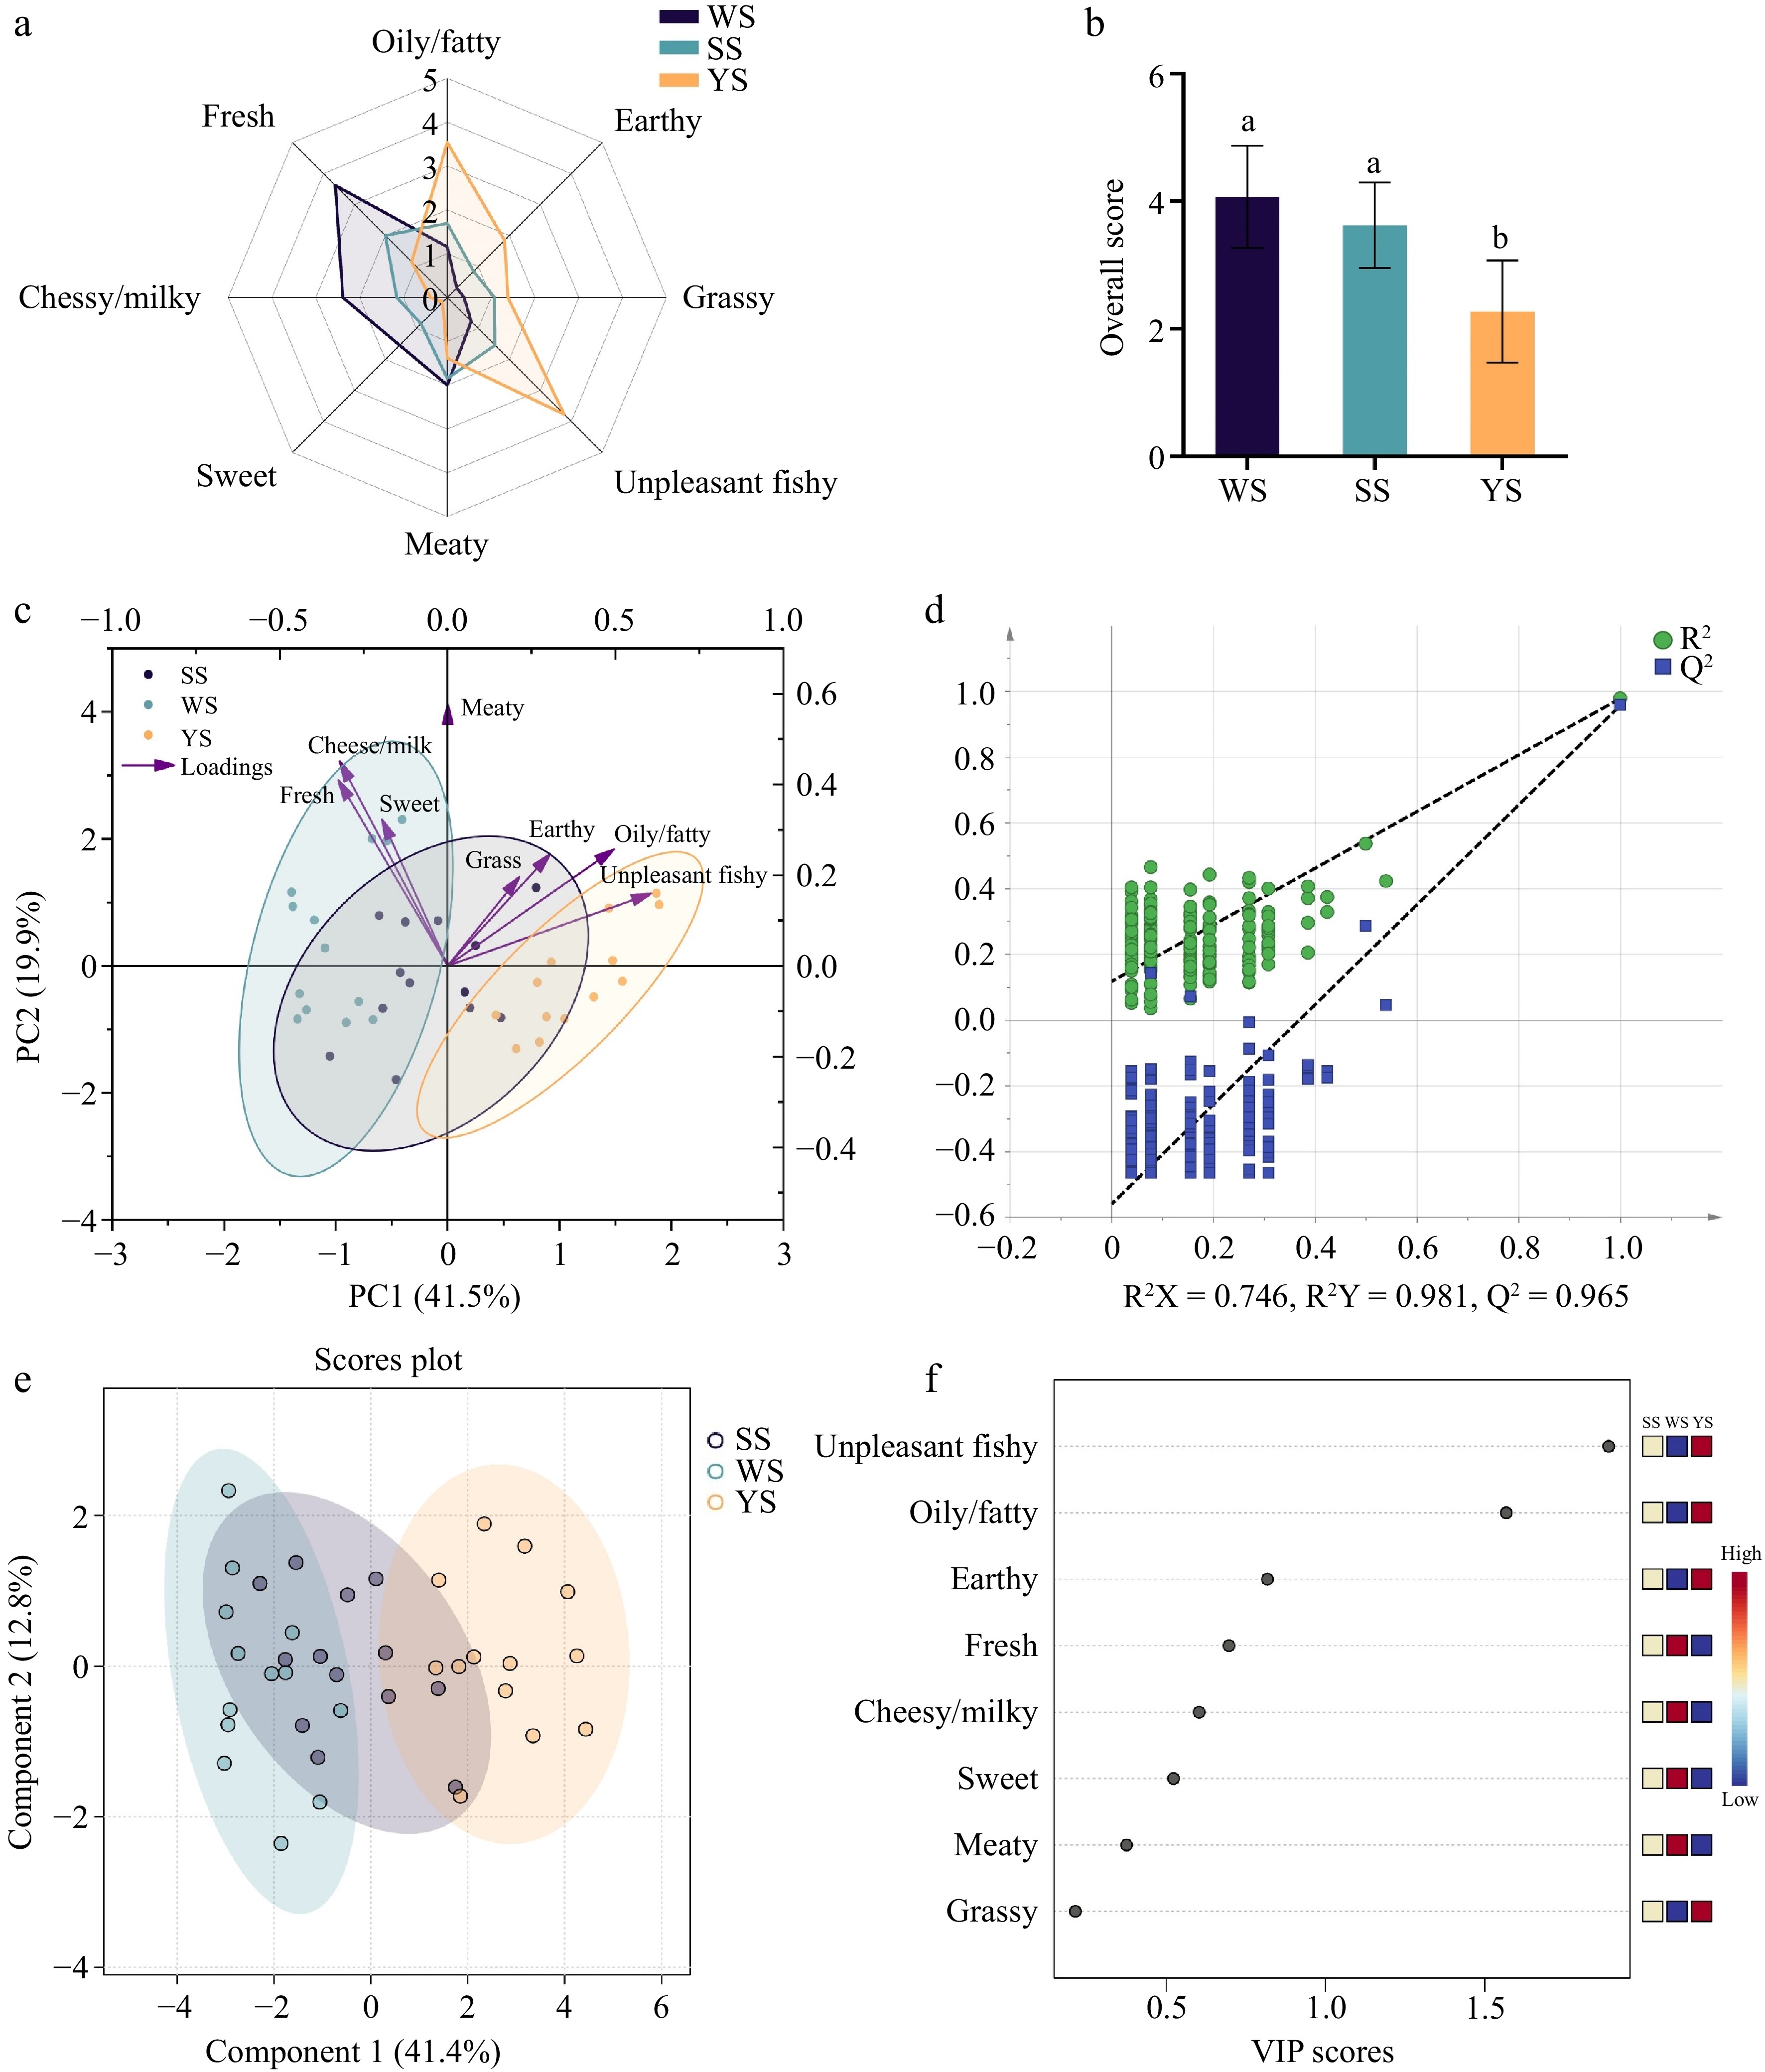
Figure 4.
(a) Flavor profile of sturgeon surimi gels. (b) Overall scores of sturgeon surimi gels. (c) PCA score plots of sturgeon surimi gels' flavor. (d) Permutation test of PLS-DA model. (e) PLS-DA score plots of sturgeon surimi gels' flavor. (f) VIP scores of sturgeon surimi gels' flavor in PLS-DA model. Note: PCA means Principal component analysis. PLS-DA means partial least squares discriminant analysis. VIP means variable importance in projection. WS: surimi gel made from sturgeon's white meat. SS: surimi gel made from sturgeon whole flesh. YS: surimi gel made from sturgeon's yellow meat.
-
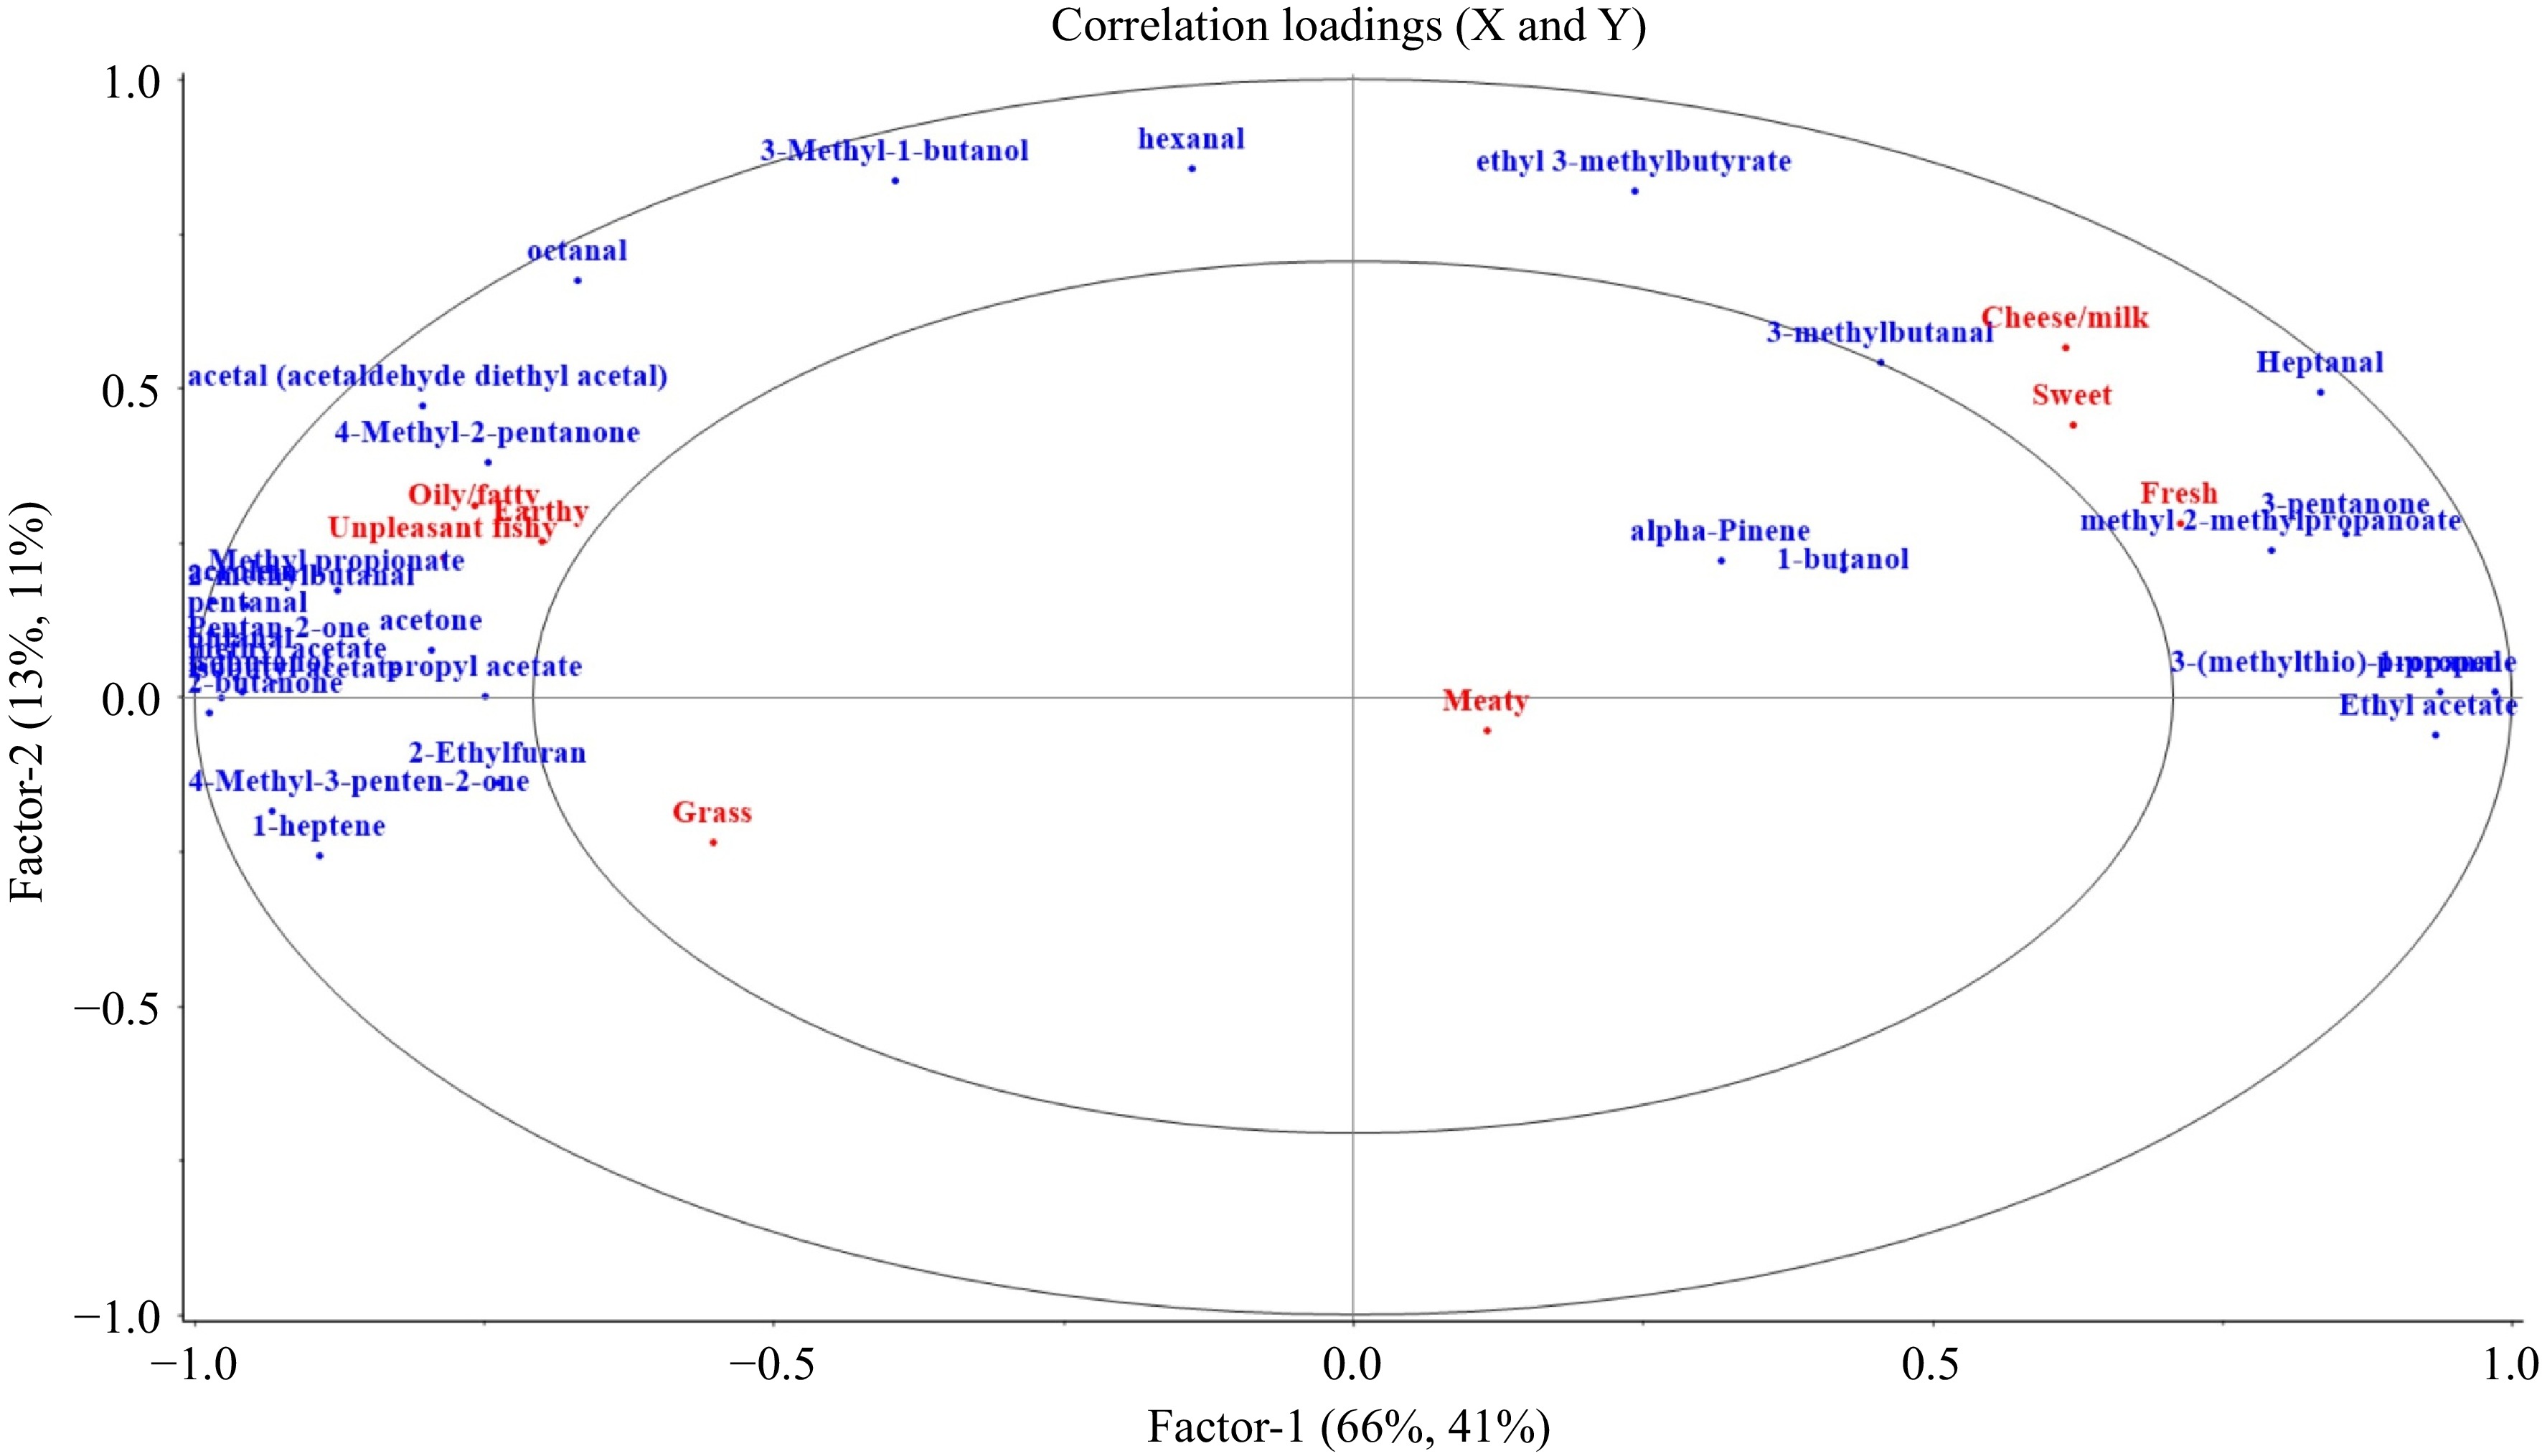
Figure 5.
Correlation loading plot from PLSR. Note: PLSR means Partial least squares regression. The ellipses represent R2 values of 0.5 and 1.0, with each ellipse corresponding to a specific R2 value. The X matrix is the signal intensity projection of volatile compounds identified by GC-IMS, and the Y matrix is the scores of flavor attributes. The principal components accounted for 79% of the total variance, with most points clustering within ellipses representing R2 values between 0.5 and 1.0, indicating a well-fitted model.
Figures
(5)
Tables
(0)