-
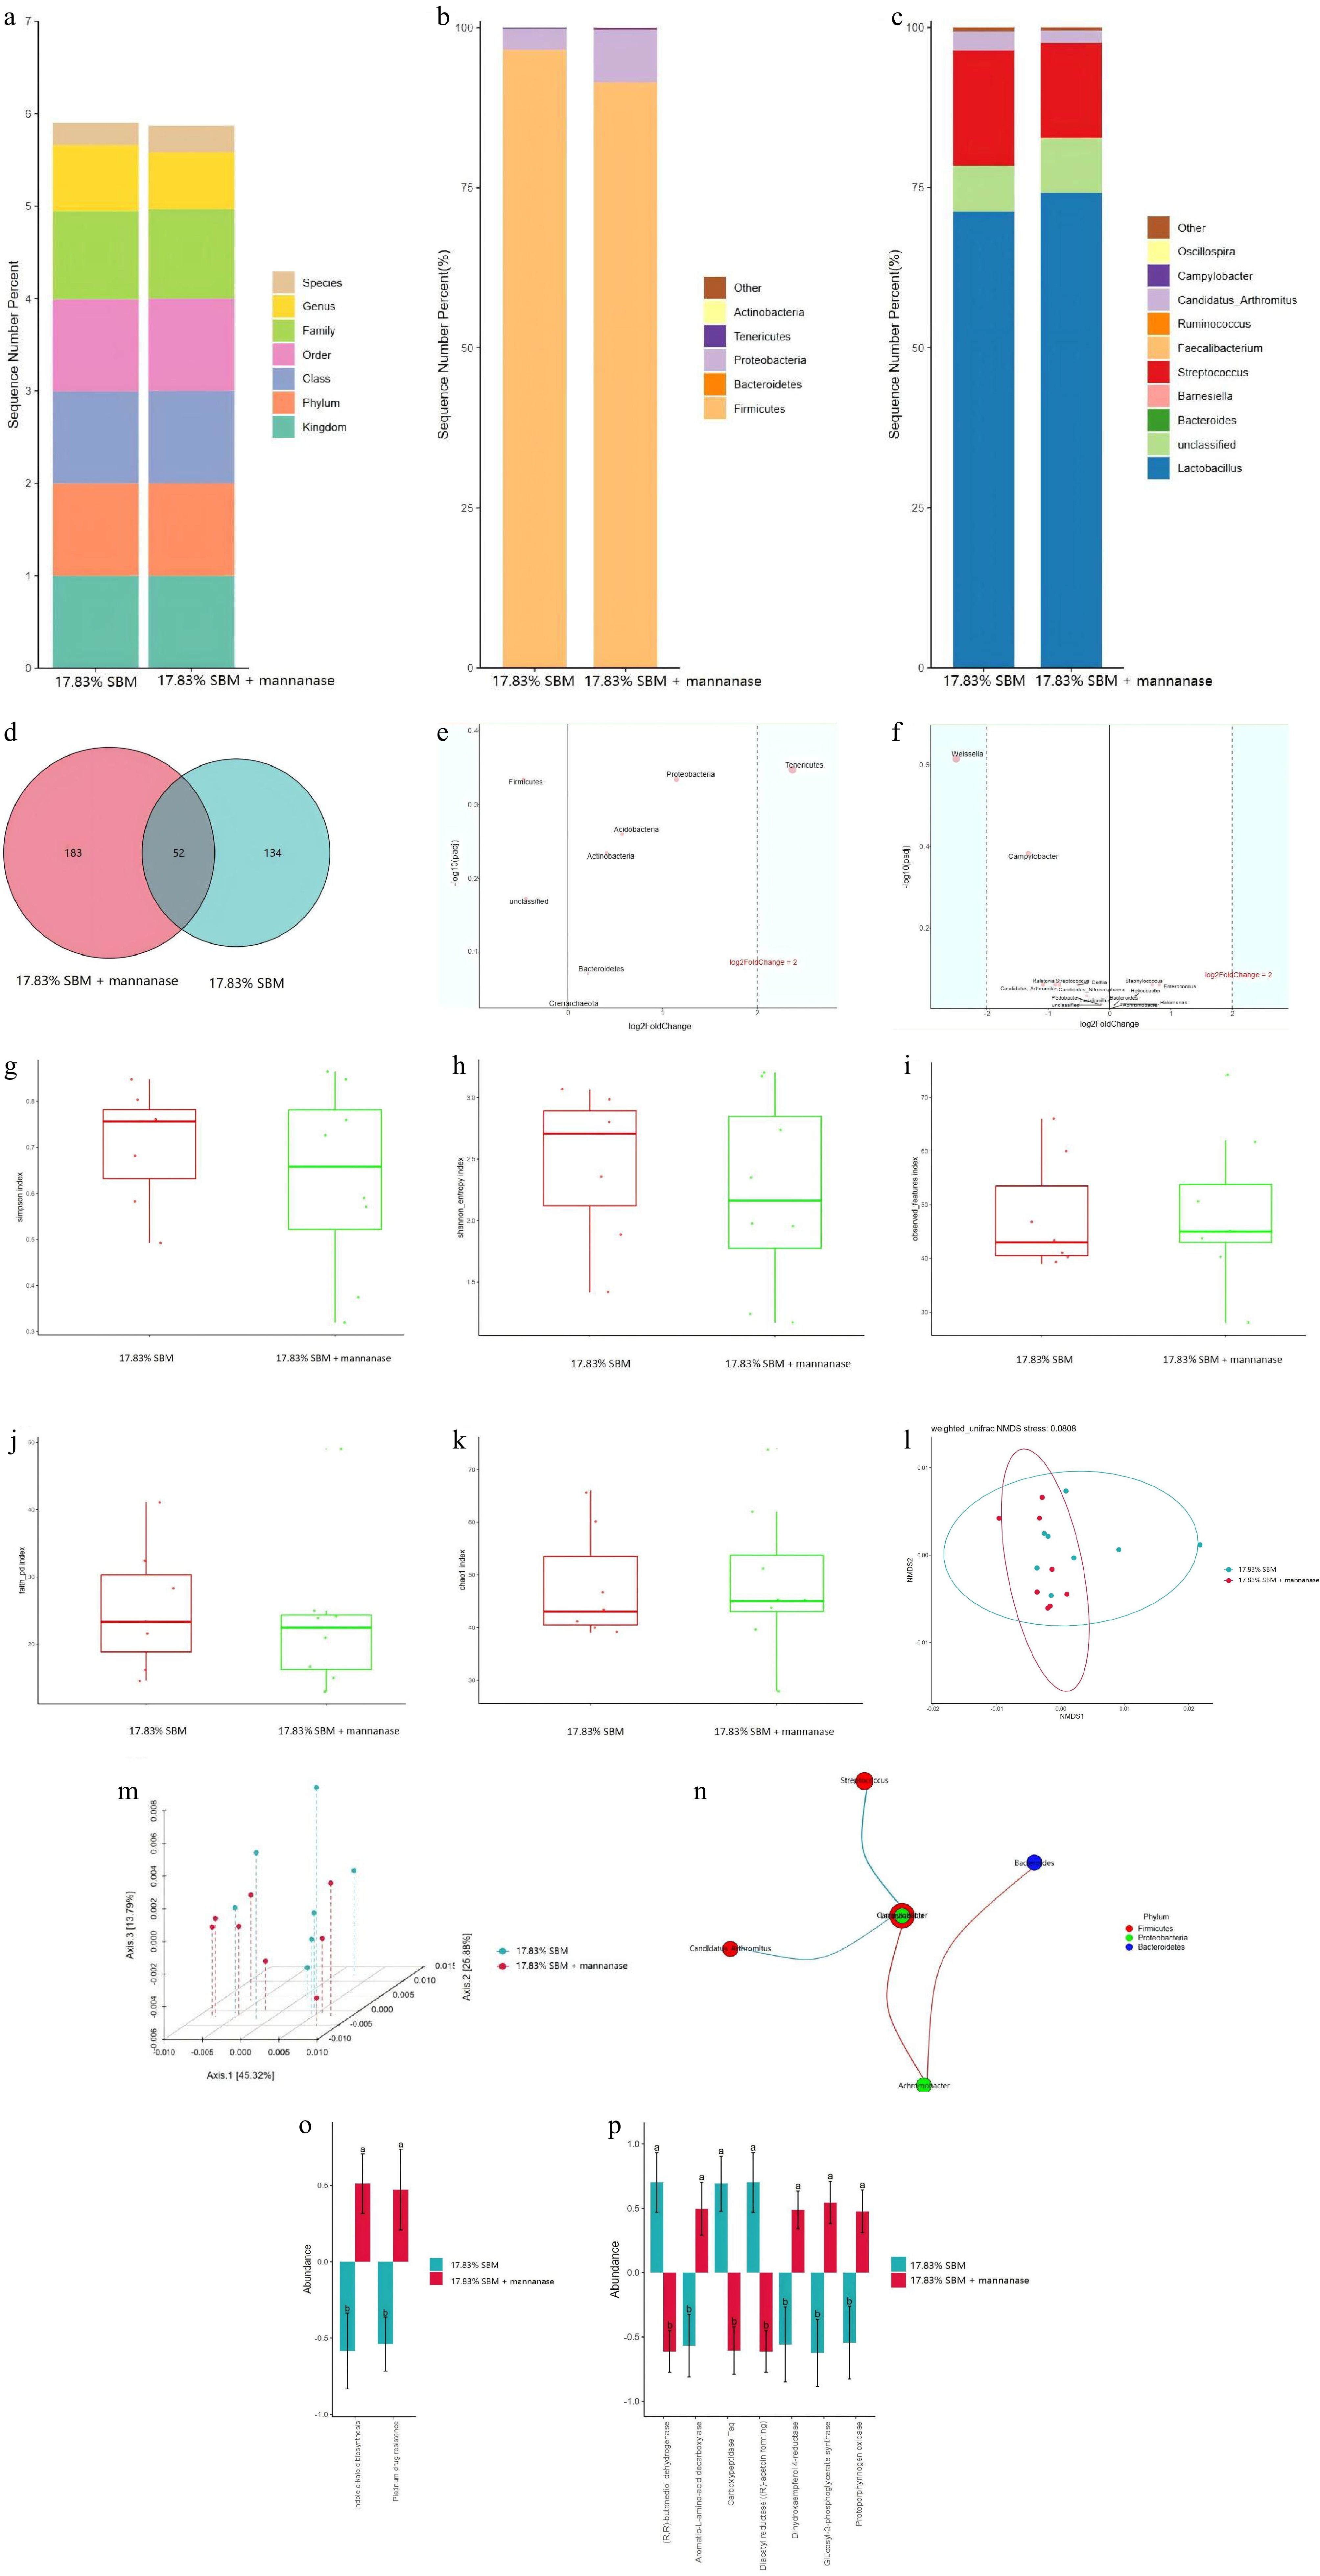
Figure 1.
Effect of mannanase addition to the diet with 17.83% SBM content on ileal microflora of broilers at 21 d. (a) In this study, the Greengenes database was used as the basis for species-level classification of ASVs using sklearn, followed by species screening to retain Bacteria and Archaea. The top 5 species in terms of relative abundance at the phylum level and the top 10 species in relative abundance at the genus level were analyzed in the form of (b), (c) bar charts; and (d) venn diagrams were used to represent the two groups of endemic and shared features. (e), (f) The relative abundance of differential ASVs at the phylum level and genus level of ileum was screened by volcano plots from DESeq2 analysis using 17.83% SBM group as control and 17.83% SBM + 100 mg/kg mannanase as the treatment group, respectively. (g)−(k) The alpha diversity was expressed as simpson’s index, shannon index, observed_features, faith_pd and Chao1, and the microorganisms were subjected to (l), (m) NMDS and PCoA based on weighted Unifrac distances to express the beta diversity, respectively. (n) The correlation coefficients of the features were calculated and the nodes with significantly correlated features were connected to plot the network graphs of the Spearman’s correlation analysis at the genus level. (o), (p) Based on the relative abundance and sequence of ASVs in the samples, PICRUSt2 was used to predict the macrogenomic results at the level of the KEGG-L3 and CAZymes, respectively, while the comparative analyses were performed to analyze the differences between the groups.
-
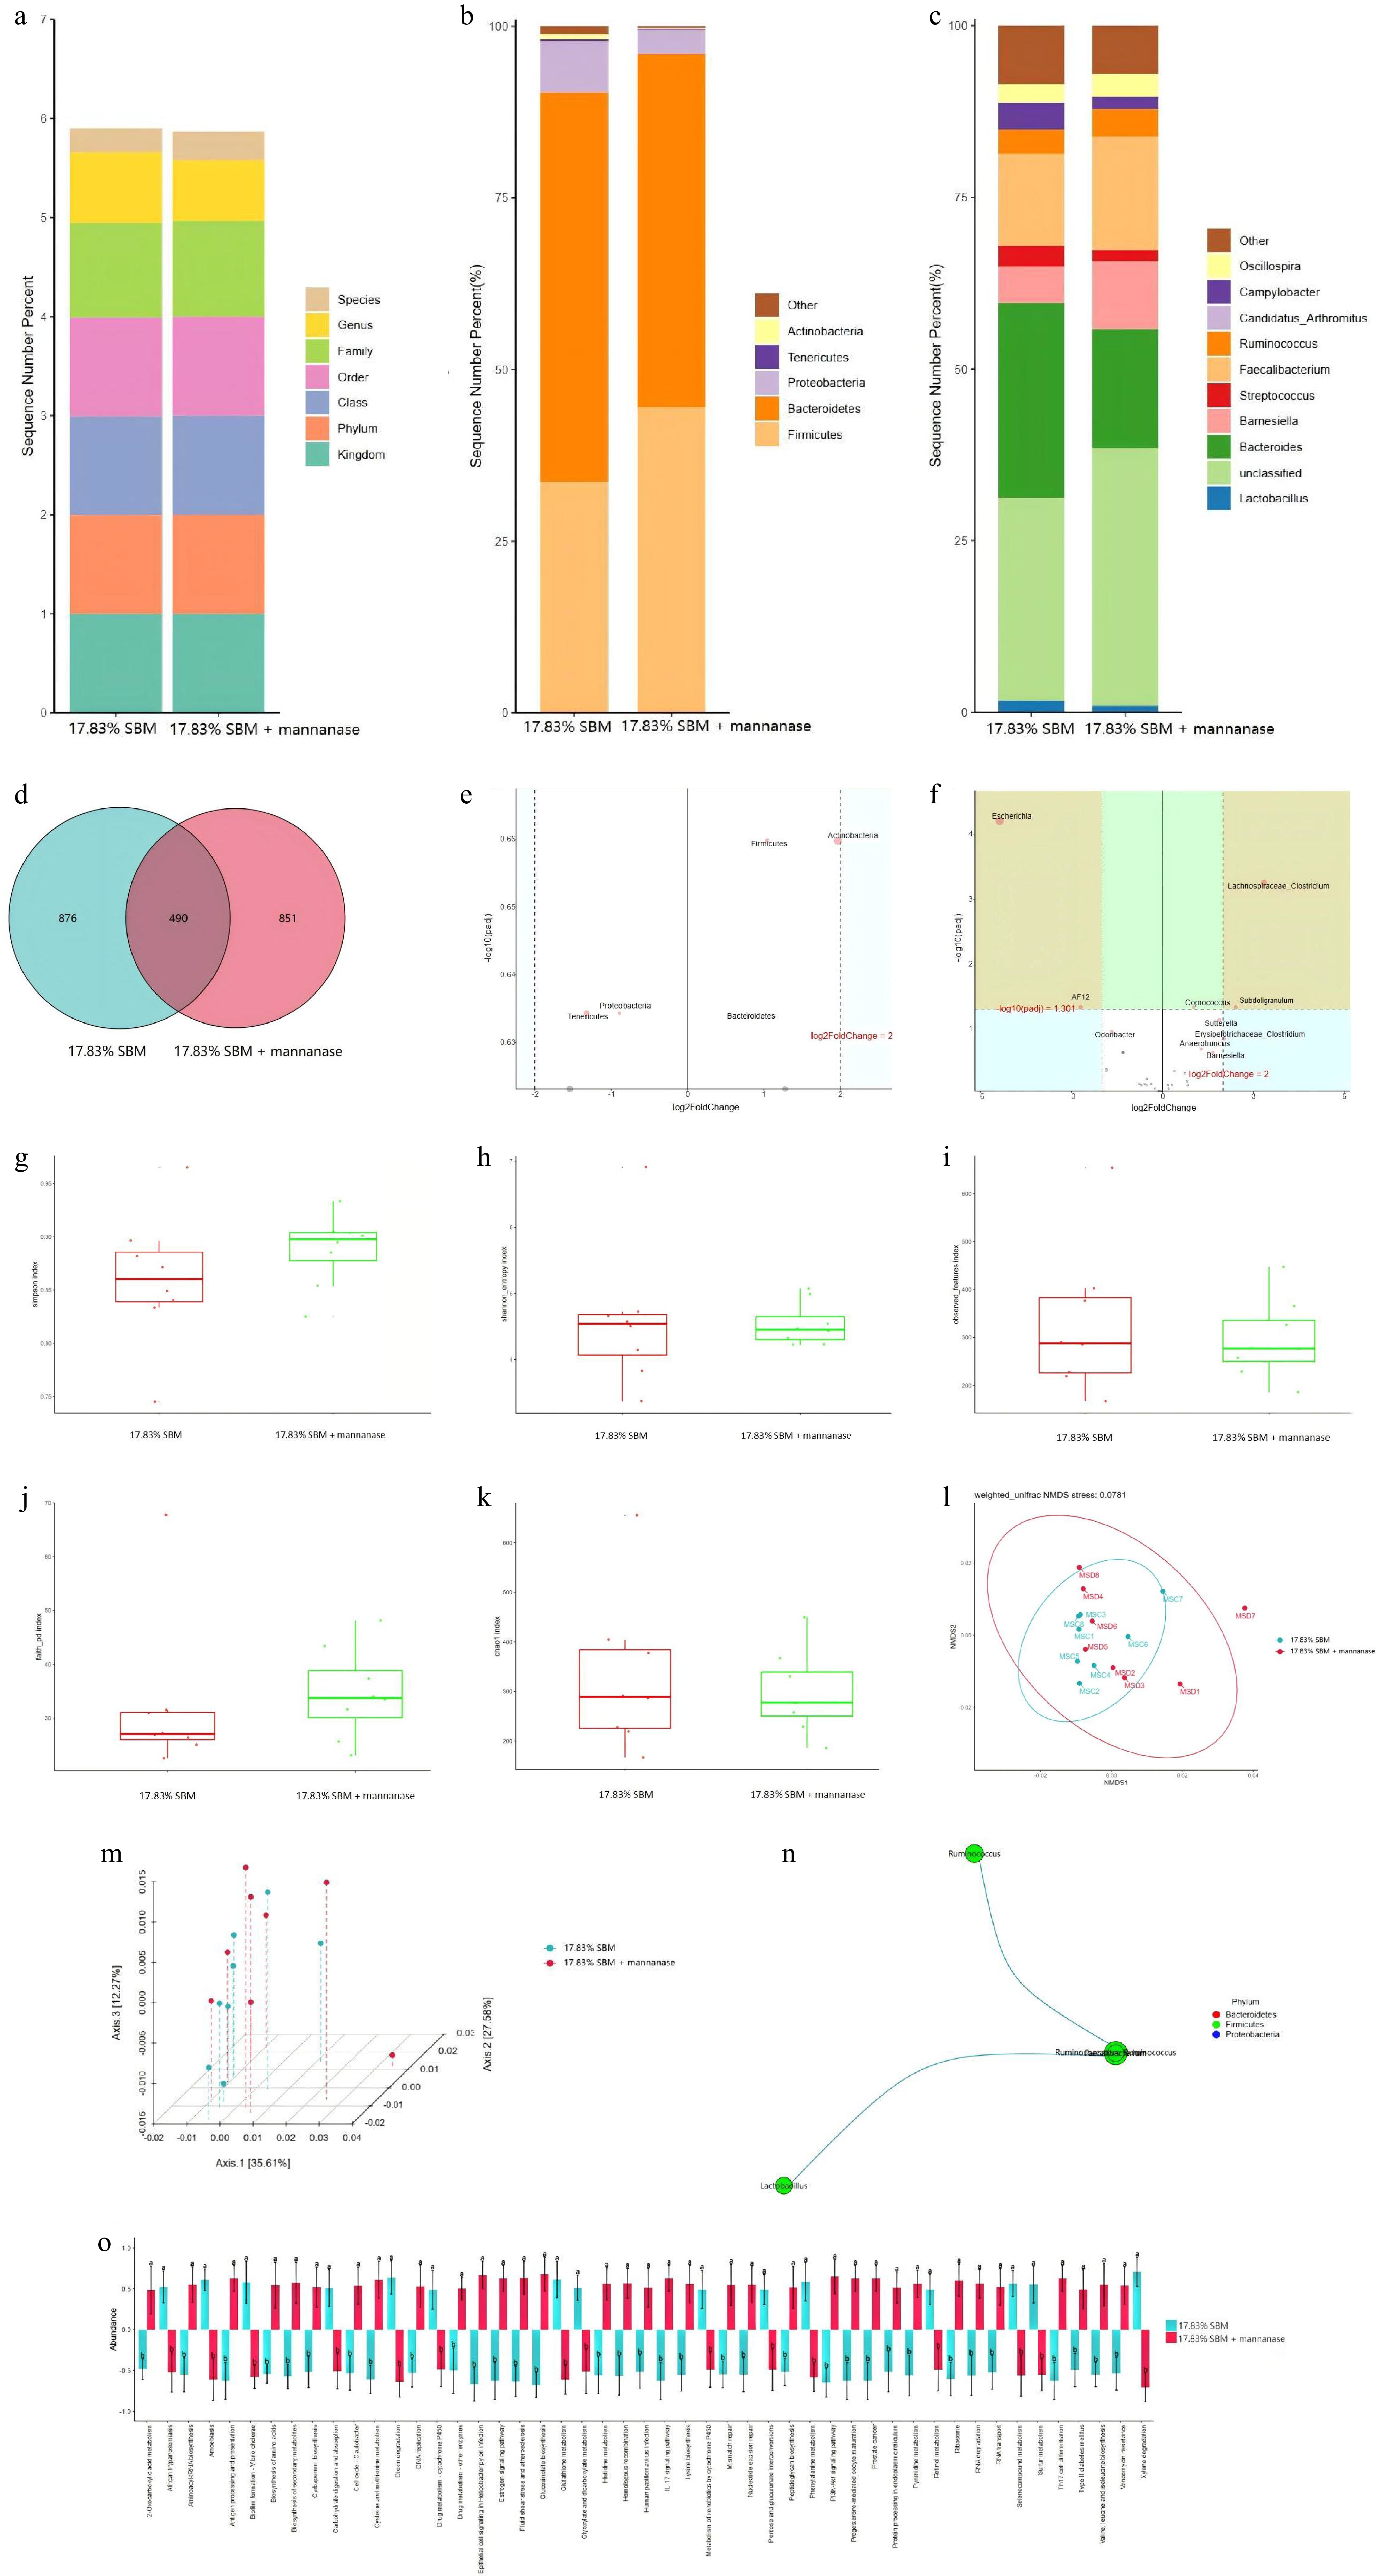
Figure 2.
Effect of mannanase addition to the diet with 17.83% SBM content on cecal microflora of broilers at 21 d. (a) In this study, the Greengenes database was used as the basis for species-level classification of ASVs using sklearn, followed by species screening to retain Bacteria and Archaea. (b), (c) The top five species in terms of relative abundance at the phylum level and the top 10 species in relative abundance at the genus level were analyzed in the form of bar charts; and (d) venn diagrams were used to represent the two groups of endemic and shared features. (e), (f) The relative abundance of differential ASVs at the phylum level and genus level of cecum was screened by volcano plots from DESeq2 analysis using 17.83% SBM group as control and 17.83% SBM + 100 mg/kg mannanase as the treatment group, respectively. (g) - (k) The alpha diversity was expressed as simpson’s index, shannon index, observed_features, faith_pd, and Chao1, and the microorganisms were subjected to (l), (m) NMDS and PCoA based on weighted Unifrac distances to express the beta diversity, respectively. (n) The correlation coefficients of the features were calculated and the nodes with significantly correlated features were connected to plot the network graphs of the Spearman’s correlation analysis at the genus level. (o) Based on the relative abundance and sequence of ASVs in the samples, PICRUSt2 was used to predict the macrogenomic results at the level of the KEGG-L3 and CAZymes, respectively, while the comparative analyses were performed to analyze the differences between the groups.
-
Item Day 0 to 21 Day 22 to 42 35.66% SBM group 17.83% SBM group 8.92% SBM group 30.58% SBM group 15.29% SBM group 7.65% SBM group Composition ratio (%) Corn (7.8% CP) 54.00 59.82 59.91 58.17 62.78 65.73 SBM (44% CP) 35.66 17.83 8.92 30.58 15.29 7.65 DCP 10.00 12.00 9.65 13.18 CGM 3.24 6.00 10.44 3.17 5.15 7.11 Soybean oil 2.76 1.15 1.02 4.46 3.20 2.25 L-lysine hydrochloride (98.5%) 0.12 0.45 0.60 0.16 0.37 0.50 Calcium hydrogen phosphate 1.84 1.96 2.10 1.51 1.55 1.53 Stone powder 1.25 1.36 1.34 1.26 1.32 1.37 NaCl 0.39 0.39 0.43 0.24 0.24 0.25 Trace mineral feedb 0.20 0.20 0.20 0.10 0.10 0.10 Choline chloride (50%) 0.20 0.20 0.20 0.10 0.10 0.10 DL-Methionine (99%) 0.21 0.22 0.17 0.14 0.13 0.11 L-Tryproan 0.10 0.12 L-Threonine 0.20 0.21 Antioxidants 0.05 0.05 0.05 0.05 0.05 0.05 Vitamin premixc 0.03 0.03 0.03 0.02 0.03 0.03 Phytase 0.02 0.02 0.02 0.02 0.02 0.02 Zeolite 0.02 0.02 2.24 0.02 0.02 0.02 Calculated nutrient levels ME, Mcal/kg 2.95 2.95 2.95 3.10 3.10 3.10 CP 22.13 22.13 22.12 20.19 20.19 20.19 Ca 1.01 1.05 1.05 0.92 0.93 0.93 Available phosphorus 0.45 0.47 0.49 0.39 0.40 0.40 Lysine 1.20 1.25 1.22 1.10 1.11 1.12 Methionine 0.56 0.59 0.56 0.46 0.47 0.47 Tryproan 0.18 0.25 0.24 Threonine 0.72 0.86 0.85 a The feed was in granular form. b The analytical values for each kg of trace mineral feed ingredients were presented as follows: Cu 8 g; Fe 40 g; Zn 55 g; Mn 60 g; I 750 mg; Se 150 mg; Co 250 mg; moisture ≤ 10%. c The analytical values for each kg of vitamin premix composition were presented as follows: vitamin A 50 million IU; vitamin D3 12 million IU; vitamin E 100,000 IU; vitamin K3 10 g; vitamin B1 8 g; vitamin B2 32 g; vitamin B6 12 g; vitamin B12 100 mg; nicotinamide 150 g; D-pantothenic acid 46 g; folic acid 5 g; biotin 500 mg; moisture ≤ 6%. Table 1.
Composition and proportions of experimental dietsa (%, as is basis).
-
Items 35.66% SBM 17.83% SBM 8.92% SBM ME (Mcal/kg) 2.94 2.94 2.97 NE (Mcal/kg) 2.23 2.35 2.22 Digestible lysine 1.20 1.18 1.17 Digestible methionine 0.50 0.55 0.53 Digestible threonine 0.77 0.82 0.84 Digestible tryptophan 0.17 0.25 0.24 Digestible arginine 1.32 1.37 1.30 Digestible leucine 1.76 1.71 1.78 Digestible isoleucine 0.69 0.64 0.61 Digestible histidine 0.42 0.45 0.43 Digestible phenylalanine 0.91 0.92 0.95 Digestible glycine 0.37 0.38 0.37 Digestible cystine 0.26 0.30 0.30 Digestible valine 0.77 0.79 0.78 Digestible tyrosine 0.46 0.50 0.52 Table 2.
Measured values of effective energy and digestible essential amino acid contents of experimental diets from 0 to 21 d (%).
-
Geneb Sequences of primers (5'-3')c Serial No. Claudin-1 F: CATACTCCTGGGTCTGGTTGGT NM_001013611.2 R: GACAGCCATCCGCATCTTCT β-actin F: CAACACAGTGCTGTCTGGTGGTAC NM_205518.1 R: CTCCTGCTTGCTGATCCACATCTG Occludin F: ACGGCAGCACCTACCTCAA NM_205128.1 R: GGGCGAAGAAGCAGATGAG ZO-1 F: CTTCAGGTGTTTCTCTTCCTCCTC XM_015278981.1 R: CTGTGGTTTCATGGCTGGATC MUC 2 F: TTCATGATGCCTGCTCTTGTG XM_421035 R: CCTGAGCCTTGGTACATTCTTGT IL-1β F: ACTGGGCATCAAGGGCTA NM_204524.1 R: GGTAGAAGATGAAGCGGGTC IL-6 F: CGCCCAGAAATCCCTCCTC XM_015281283.1 R: AGGCACTGAAACTCCTGGTC IL-8 F: ATGAACGGCAAGCTTGGAGCTG XM_015301388.1 R: TCCAAGCACACCTCTCTTCCATCC IL-10 F: GCTGCCAAGCCCTGTT NM_001004414.2 R: CCTCAAACTTCACCCTCA IL-18 F: TGATGAGCTGGAATGCGATG NM_204608.3 R: ACTGCCAGATTTCACCTCCTG TNF-α F: GAGCGTTGACTTGGCTGTC XM_204267 R: AAGCAACAACCAGCTATGCAC MyD88 F: TGCAAGACCATGAAGAACGA NM_001030962.5 R: TCACGGCAGCAAGAGAGATT NF-κB F: GTG TGA AGA AAC GGG AAC TG NM_205129.1 R: GGC ACG GTT GTC ATA GAT GG TLR-4 F: CCACTATTCGGTTGGTGGAC NM_001030693.1 R: ACAGCTTCTCAGCAGGCAAT a Primers were designed using Primer Express software (Sangon Biotech Co., LTD., Shanghai, China). b Zonula occludens-1 (ZO-1); mucin2 (MUC 2); interleukin-1β (IL-1β); interleukin-6 (IL-6); interleukin-8 (IL-8); interleukin-10 (IL-10); interleukin-18 (IL-18); tumor necrosis factor α (TNF-α); myeloid differentiation factor 88 (MyD88); nuclear factor kappa B (NF-κB); toll-like receptor-4 (TLR-4). c F for forward; R for reverse. Table 3.
Sequences of oligonucleotide primersa for real-time quantitative fluorescence PCR.
-
SBM content Mannanase Day 0 to 21 Day 22 to 42 Day 0 to 42 BW (kg) ADG (kg) ADFI (kg) FCR BW (kg) ADG (kg) ADFI (kg) FCR ADG, kg ADFI, kg FCR Control group 0 mg/kg 0.832bc 0.037b 0.054 1.427bc 2.690 0.088 0.151 1.711 0.063 0.102 1.569 100 mg/kg 0.877a 0.040a 0.055 1.375d 2.852 0.094 0.153 1.631 0.067 0.104 1.503 50% of SBM of control 0 mg/kg 0.822cd 0.037b 0.054 1.450b 2.625 0.086 0.154 1.797 0.061 0.104 1.623 100 mg/kg 0.862ab 0.039a 0.055 1.412c 2.678 0.087 0.153 1.765 0.063 0.104 1.589 25% of SBM of control 0 mg/kg 0.804cd 0.036b 0.054 1.493a 2.475 0.080 0.149 1.879 0.058 0.102 1.686 100 mg/kg 0.798d 0.036b 0.054 1.496a 2.427 0.077 0.143 1.848 0.057 0.098 1.672 SEM 0.006 0.000 0.000 0.008 0.029 0.001 0.001 0.015 0.001 0.007 0.010 Main effect Mannanase 0 mg/kg 0.819 0.037b 0.054 1.457a 2.597 0.085 0.151 1.795a 0.061 0.103 1.626a 100 mg/kg 0.846 0.038a 0.054 1.428b 2.652 0.095 0.150 1.748b 0.062 0.102 1.588b SBM content control group 0.855 0.039a 0.054 1.401c 2.771a 0.091a 0.152a 1.671c 0.065a 0.103a 1.536c 50% of SBM of control 0.842 0.038a 0.054 1.431b 2.652b 0.086b 0.153a 1.781b 0.062b 0.104a 1.606b 25% of SBM of control 0.801 0.036b 0.054 1.494a 2.451c 0.078c 0.146b 1.863a 0.057c 0.100b 1.679a p-value Mannanase 0.003 0.004 0.269 0.003 0.211 0.469 0.422 0.022 0.154 0.658 < 0.001 SBM content < 0.001 < 0.001 0.762 < 0.001 < 0.001 < 0.001 0.036 < 0.001 < 0.001 0.041 < 0.001 Mannanase × SBM 0.036 0.069 0.526 0.055 0.161 0.267 0.339 0.515 0.140 0.292 0.120 a, b, c The data in the same row with shoulder labels containing different letters indicate significant differences (p < 0.05). Table 4.
Effect of mannanase addition to diets with different SBM content on growth performance of broilers.
-
SBM content Mannanase VO2 (L) VCO2(L) RQ Nint (g/d) Nexc (g/d) TRN (g/d) 35.66% SBM 0 mg/kg 35.407 36.399 1.028a 3.470 1.413 2.057b 100 mg/kg 34.152 34.300 1.011bc 3.640 1.094 2.546a 17.83% SBM 0 mg/kg 32.990 33.632 1.020ab 3.494 1.634 1.861b 100 mg/kg 32.771 32.432 1.003c 3.521 1.530 1.992b 8.92% SBM 0 mg/kg 36.165 36.354 1.006bc 3.462 1.573 1.889b 100 mg/kg 31.563 32.075 1.013abc 3.532 1.576 1.957b SEM 0.510 0.516 0.002 0.019 0.045 0.053 Main effect Mannanase 0 mg/kg 34.854a 35.462a 1.018 3.476b 1.540a 1.936b 100 mg/kg 32.829b 32.936b 1.009 3.565a 1.400b 2.165a SBM content 35.66% SBM 34.780 35.350 1.020 3.555 1.256b 2.302a 17.83% SBM 32.880 33.032 1.012 3.508 1.582a 1.926b 8.92% SBM 33.864 34.215 1.010 3.497 1.574a 1.923b p-value Mannanase 0.039 0.010 0.043 0.012 0.061 0.005 SBM content 0.270 0.141 0.147 0.328 0.001 < 0.001 Mannanase × SBM 0.154 0.388 0.037 0.213 0.196 0.068 a, b, c The data in the same row with shoulder labels containing different letters indicate significant differences (p < 0.05). Table 5.
Effect of mannanase addition to diets with different SBM content on the respiratory metabolism and N balance of broilers at 21 d.
-
SBM content Mannanase THP (KJ) HI (KJ) RE (KJ) REpro (KJ) REfat (KJ) AME
(MJ/kg)AMEn
(MJ/kg)NE
(MJ/kg)NE :
AMEAME : ADG
(KJ/g)NE : ADG
(KJ/g)35.66% SBM 0 mg/kg 755.609 318.010 553.430 306.545b 246.884 12.307 11.641 9.330 0.758 12.667 9.607 100 mg/kg 724.772 267.340 647.049 379.367a 267.682 12.527 11.803 10.153 0.812 12.602 10.213 17.83% SBM 0 mg/kg 702.607 262.826 608.921 277.277b 331.644 12.323 11.723 9.841 0.798 12.690 10.130 100 mg/kg 693.039 249.293 634.557 296.747b 337.811 12.454 11.811 10.116 0.812 12.633 10.261 8.92% SBM 0 mg/kg 767.646 333.854 553.408 281.412b 271.996 12.438 11.827 9.294 0.748 12.977 9.696 100 mg/kg 671.706 263.332 649.486 291.569b 357.916 12.485 11.849 9.993 0.800 13.094 10.478 SEM 10.776 10.552 15.626 7.846 13.337 0.077 0.071 0.109 0.008 0.084 0.107 Main effect Mannanase 0 mg/kg 741.954a 304.897a 571.920b 288.412b 283.508 12.356 11.730 9.488b 0.768b 12.778 9.811b 100 mg/kg 696.506b 259.988b 643.697a 322.561a 321.136 12.489 11.821 10.087a 0.808a 12.776 10.317a SBM content 35.66% SBM 740.191 292.675 600.240 342.956a 257.283b 12.417 11.722 9.741 0.785 12.635 9.910 17.83% SBM 697.823 256.060 621.739 287.012b 334.728a 12.389 11.767 9.978 0.805 12.662 10.195 8.92% SBM 719.676 298.593 601.447 286.491b 314.956ab 12.462 11.838 9.643 0.774 13.035 10.087 p-value Mannanase 0.028 0.030 0.025 0.005 0.135 0.426 0.551 0.005 0.006 0.993 0.017 SBM content 0.230 0.178 0.810 < 0.001 0.040 0.935 0.820 0.377 0.189 0.111 0.508 Mannanase × SBM 0.193 0.494 0.566 0.068 0.379 0.911 0.931 0.503 0.431 0.883 0.398 a, b The data in the same row with shoulder labels containing different letters indicate significant differences (p < 0.05). Table 6.
Effect of mannanase addition to diets with different SBM content on energy metabolism in broilers at 21 d.
-
SBM content Mannanase ATTD
of DMATTD
of CPATTD
of GE35.66% SBM 0 mg/kg 67.062 59.355b 72.360 100 mg/kg 69.497 71.307a 73.988 17.83% SBM 0 mg/kg 68.646 53.074b 74.507 100 mg/kg 69.777 56.517b 76.043 8.92% SBM 0 mg/kg 69.744 54.575b 76.982 100 mg/kg 70.157 55.347b 75.970 SEM 0.541 1.417 0.560 Main effect Mannanase 0 mg/kg 68.484 55.668b 74.616 100 mg/kg 69.810 61.057a 75.334 SBM content 35.66% SBM 68.280 65.331a 73.174b 17.83% SBM 69.211 54.795b 75.275ab 8.92% SBM 69.950 54.961b 76.476a p-value Mannanase 0.239 0.015 0.508 SBM content 0.474 < 0.001 0.053 Mannanase × SBM 0.752 0.093 0.527 a, b The data in the same row with shoulder labels containing different letters indicate significant differences (p < 0.05). Table 7.
Effect of mannanase addition to diets with different SBM content on the ATTD of DM, CP, and GE of broilers at 21 d (%).
-
SBM content Mannanase Threonine Lysine Tryptophan Methionine Arginine Leucine Valine Isoleucine Phenylalanine 35.66% SBM 0 mg/kg 0.830 0.894 0.852 0.935 0.937 0.890 0.829 0.851 0.897 100 mg/kg 0.838 0.907 0.845 0.942 0.943 0.899 0.860 0.876 0.914 17.83% SBM 0 mg/kg 0.817 0.872 0.877 0.929 0.934 0.872 0.815 0.826 0.884 100 mg/kg 0.830 0.881 0.905 0.934 0.934 0.879 0.826 0.834 0.891 8.92% SBM 0 mg/kg 0.836 0.870 0.872 0.928 0.932 0.883 0.828 0.832 0.898 100 mg/kg 0.840 0.886 0.903 0.931 0.933 0.897 0.836 0.847 0.904 SEM 0.004 0.003 0.008 0.002 0.002 0.003 0.004 0.005 0.003 Main effect Mannanase 0 mg/kg 0.828 0.879b 0.867 0.931 0.934 0.882b 0.824b 0.836b 0.893b 100 mg/kg 0.836 0.892a 0.884 0.936 0.937 0.891a 0.840a 0.852a 0.903a SBM content 35.66% SBM 0.834 0.901a 0.848b 0.939 0.940 0.894a 0.845a 0.864a 0.905a 17.83% SBM 0.824 0.877b 0.891a 0.931 0.934 0.876b 0.820b 0.830b 0.888b 8.92% SBM 0.838 0.881b 0.888a 0.929 0.933 0.890a 0.832ab 0.840b 0.901a p-value Mannanase 0.299 0.005 0.222 0.170 0.488 0.079 0.039 0.037 0.072 SBM content 0.310 < 0.001 0.034 0.101 0.300 0.019 0.047 0.003 0.031 Mannanase × SBM 0.879 0.789 0.475 0.918 0.813 0.850 0.444 0.612 0.668 SBM content Mannanase Histidine Glycine Aspartic acid Glutamic acid Cystine Alanine Serine Proline Tyrosine 35.66% SBM 0 mg/kg 0.875 0.484 0.832 0.896 0.757 0.831 0.836 0.844 0.858 100 mg/kg 0.892 0.549 0.861 0.907 0.781 0.862 0.861 0.866 0.892 17.83% SBM 0 mg/kg 0.846 0.483 0.823 0.894 0.768 0.828 0.828 0.832 0.874 100 mg/kg 0.860 0.497 0.832 0.900 0.790 0.842 0.837 0.842 0.872 8.92% SBM 0 mg/kg 0.853 0.502 0.832 0.904 0.780 0.856 0.845 0.851 0.871 100 mg/kg 0.852 0.543 0.835 0.908 0.802 0.867 0.851 0.857 0.890 SEM 0.005 0.012 0.005 0.003 0.006 0.004 0.004 0.004 0.004 Main effect Mannanase 0 mg/kg 0.858 0.490b 0.829 0.898 0.768b 0.839b 0.836b 0.842b 0.867b 100 mg/kg 0.868 0.530a 0.843 0.905 0.791a 0.857a 0.850a 0.855a 0.885a SBM content 35.66% SBM 0.884a 0.516 0.846 0.902 0.769 0.847ab 0.849 0.855 0.875 17.83% SBM 0.853b 0.490 0.827 0.897 0.779 0.835b 0.832 0.837 0.873 8.92% SBM 0.853b 0.523 0.833 0.906 0.791 0.862a 0.848 0.854 0.880 p-value Mannanase 0.243 0.096 0.119 0.203 0.062 0.015 0.083 0.089 0.020 SBM content 0.005 0.470 0.202 0.450 0.329 0.019 0.154 0.106 0.665 Mannanase × SBM 0.612 0.665 0.444 0.865 0.998 0.450 0.522 0.631 0.124 a, b The data in the same row with shoulder labels containing different letters indicate significant differences (p < 0.05). Table 8.
Effect of mannanase addition to diets with different SBM content on the ATTD of AA of broilers at 21 d (%).
-
SBM content Mannanase 21 d 42 d Control group 0 mg/kg 1.083 1.120a 100 mg/kg 1.059 1.079b 50% of SBM of control 0 mg/kg 1.070 1.113a 100 mg/kg 1.033 1.096ab 25% of SBM of control 0 mg/kg 1.048 1.096ab 100 mg/kg 1.046 1.124a SEM 0.004 0.005 Main effect Mannanase 0 mg/kg 1.067a 1.110 100 mg/kg 1.046b 1.110 SBM content Control group 1.071a 1.099 50% of SBM of control 1.051b 1.104 25% of SBM of control 1.047b 1.110 p-value Mannanase 0.004 0.251 SBM content 0.015 0.604 Mannanase × SBM 0.108 0.008 a, b The data in the same row with shoulder labels containing different letters indicate significant differences (p < 0.05). Table 9.
Effect of mannanase addition to diets with different SBM content on jejunal chyme viscosity in broilers (P).
-
SBM content Mannanase DAO (ng/mL) D-LA (nmol/L) ET (EU/ml) 35.66% SBM 0 mg/kg 24.711 73.848a 0.219 100 mg/kg 24.171 68.059c 0.188 17.83% SBM 0 mg/kg 25.079 68.146c 0.152 100 mg/kg 22.858 63.183d 0.135 8.92% SBM 0 mg/kg 24.433 69.186bc 0.170 100 mg/kg 23.430 72.881ab 0.151 SEM 0.295 0.785 0.007 Main effect Mannanase 0 mg/kg 24.741a 70.393 0.180a 100 mg/kg 23.486b 68.041 0.158b SBM content 35.66% SBM 24.441 70.953 0.204a 17.83% SBM 23.969 65.664 0.160b 8.92% SBM 23.932 71.034 0.143b p-value Mannanase 0.036 0.069 0.048 SBM content 0.728 0.001 < 0.001 Mannanase × SBM 0.480 0.006 0.850 a, b, c, d The data in the same row with shoulder labels containing different letters indicate significant differences (p < 0.05). Table 10.
Effect of mannanase addition to diets with different SBM content on intestinal barrier integrity of broilers at 21 d.
-
SBM content Mannanase VH (μm) CD (μm) V:C 35.66% SBM 0 mg/kg 656.073b 111.063a 5.441c 100 mg/kg 729.529a 109.180ab 6.695a 17.83% SBM 0 mg/kg 664.777b 113.061a 5.879b 100 mg/kg 712.769a 108.930ab 6.492a 8.92% SBM 0 mg/kg 666.053b 100.126c 6.005b 100 mg/kg 679.013b 104.606bc 6.546a SEM 5.584 0.889 0.079 Main effect Mannanase 0 mg/kg 662.301 108.084 5.775 100 mg/kg 707.103 107.572 6.578 SBM content 35.66% SBM 692.801 110.122 6.068 17.83% SBM 688.773 110.996 6.185 8.92% SBM 672.533 102.366 6.276 p-value Mannanase < 0.001 0.703 < 0.001 SBM content 0.124 < 0.001 0.220 Mannanase × SBM 0.018 0.032 0.007 a, b, c The data in the same row with shoulder labels containing different letters indicate significant differences (p < 0.05). Table 11.
Effect of mannanase addition to diets with different SBM content on morphological indexes of ileal epithelium in broilers at 21 d.
-
SBM content Mannanase ZO-1 Occludin Claudin-1 MUC-2 35.66% SBM 0 mg/kg 1.000 1.000 1.000 1.000 100 mg/kg 1.070 1.579 1.081 1.118 17.83% SBM 0 mg/kg 0.884 1.143 0.748 0.933 100 mg/kg 0.916 1.321 1.539 1.049 8.92% SBM 0 mg/kg 0.660 1.500 0.641 1.004 100 mg/kg 1.111 1.770 1.330 0.968 SEM 0.060 0.125 0.082 0.052 Main effect Mannanase 0 mg/kg 0.848 1.215 0.796b 0.979 100 mg/kg 1.032 1.556 1.316a 1.045 SBM content 35.66% SBM 1.035 1.289 1.040 1.059 17.83% SBM 0.900 1.232 1.143 0.991 8.92% SBM 0.886 1.635 0.985 0.986 p-value Mannanase 0.127 0.183 0.001 0.550 SBM content 0.529 0.378 0.667 0.831 Mannanase × SBM 0.289 0.794 0.109 0.805 a, b The data in the same row with shoulder labels containing different letters indicate significant differences (p < 0.05). Table 12.
Effect of mannanase addition to diets with different SBM content on the relative expression of genes associated with the jejunal barrier in broilers at 21 d.
-
SBM content Mannanase ZO-1 Occludin Claudin-1 MUC-2 35.66% SBM 0 mg/kg 1.000 1.000 1.000 1.000 100 mg/kg 1.363 1.336 1.332 1.227 17.83% SBM 0 mg/kg 0.922 0.793 0.912 0.978 100 mg/kg 0.935 0.925 1.094 1.177 8.92% SBM 0 mg/kg 0.701 0.733 1.020 1.226 100 mg/kg 1.254 1.135 1.865 1.004 SEM 0.083 0.067 0.111 0.081 Main effect Mannanase 0 mg/kg 0.875b 0.842b 0.977b 1.068 100 mg/kg 1.184a 1.132a 1.430a 1.136 SBM content 35.66% SBM 1.182 1.168 1.166 1.113 17.83% SBM 0.928 0.859 1.003 1.077 8.92% SBM 0.978 0.934 1.442 1.115 p-value Mannanase 0.062 0.029 0.040 0.691 SBM content 0.405 0.133 0.247 0.979 Mannanase × SBM 0.392 0.672 0.420 0.481 a, b The data in the same row with shoulder labels containing different letters indicate significant differences (p < 0.05). Table 13.
Effect of mannanase addition to diets with different SBM content on the relative expression of genes associated with the ileal barrier in broilers at 21 d.
-
SBM content Mannanase IL-1β IL-6 IL-8 IL-10 IL-18 TNF-a MyD88 NF-kB TLR-4 35.66% SBM 0 mg/kg 1.000a 1.000 1.000 1.000 1.000a 1.000 1.000 1.000a 1.000 100 mg/kg 0.546b 0.302 0.658 1.274 0.547b 0.829 0.754 0.612bc 0.751 17.83% SBM 0 mg/kg 0.434b 0.709 0.385 0.617 0.414bc 0.867 0.685 0.575bc 0.612 100 mg/kg 0.436b 0.345 0.269 0.843 0.226c 0.809 0.520 0.330c 0.555 8.92% SBM 0 mg/kg 0.434b 0.734 0.337 0.690 0.295bc 0.912 0.941 0.541bc 0.885 100 mg/kg 0.768ab 0.647 0.426 1.141 0.579b 0.700 0.556 0.679b 0.575 SEM 0.052 0.076 0.055 0.088 0.054 0.062 0.053 0.051 0.048 Main effect mannanase 0 mg/kg 0.623 0.815a 0.574 0.769b 0.570 0.926 0.876a 0.705a 0.832a 100 mg/kg 0.583 0.431b 0.451 1.086a 0.451 0.779 0.610b 0.540b 0.627b SBM content 35.66% SBM 0.773 0.651 0.829a 1.137 0.774 0.914 0.877a 0.806a 0.876a 17.83% SBM 0.435 0.527 0.327b 0.730 0.320 0.838 0.603b 0.453b 0.584b 8.92% SBM 0.601 0.691 0.382b 0.915 0.437 0.806 0.749ab 0.610ab 0.730ab p-value Mannanase 0.650 0.010 0.173 0.071 0.159 0.258 0.009 0.068 0.023 SBM content 0.011 0.626 < 0.001 0.164 < 0.001 0.779 0.078 0.008 0.031 Mannanase × SBM 0.003 0.229 0.150 0.852 0.003 0.879 0.646 0.052 0.470 a, b, c The data in the same row with shoulder labels containing different letters indicate significant differences (p < 0.05). Table 14.
Effect of mannanase addition to diets with different SBM content on the relative expression of inflammatory response genes in the ileum of broilers at 21 d.
Figures
(2)
Tables
(14)