


-
Soybean meal (SBM) is the main source of vegetable protein (VP) in poultry feed, containing about 17%−27% non-starch polysaccharides (NSP)[1], which limits its nutritional value[2]. NSP is a common anti-nutritional factor (ANF) in poultry feed that stimulates the animal’s innate immune system and leads to energy loss[3]. Hemicellulose, the second most abundant polymer in nature, is usually found in plant cell walls alongside lignin and cellulose[4]. Mannan, as a major component of hemicellulose in legumes, is relatively the most important type of ANF in SBM. It is a polysaccharide composed of mannose units linked by β-1,4-bonds[5]. NSP in SBM mainly exists as glucomannan and galactomannan[6]. It has been shown that mannan can increase the viscosity of chyme[7,8], induce feed-induced immune response (FIIR), cause energy loss[9], disrupt microbial community structure[10], and affect animal growth performance[11].
Mannanase is widely found in animals, plants, and microorganisms[4]. It can act specifically upon the β-1,4-D-mannosidic bond within mannans[12,13]. Mannanase has strict substrate specificity, allowing it to produce mannooligosaccharides (MOS) while degrading mannan, thus maximizing its energy potential[3]. Studies have shown that mannanase can lower the viscosity of intestinal chyme[14], promote the digestion and absorption of feed nutrients[11,15], and improve the nutritional value of SBM[16]. Additionally, mannanase can regulate intestinal flora structure[17,18], maintain the integrity of intestinal epithelium[19,20], enhance immune function[6,21], reduce the energy loss from FIIR[22], increase the efficiency of energy utilization[23,24], and improve the growth performance of poultry[25−27]. Poultry do not have the enzymes required to break down mannan. Thus, the exogenous supply of mannanase has increasingly emerged as an effective strategy to improve growth performance.
Studies have indicated that adding mannanase to low-energy diet increases N-corrected apparent metabolizable energy (AMEn)[22], and improves the growth performance of broilers[28]. The role played by mannanase depends mainly on the type of substrate and the amount of mannan in the diet[29]. In summary, many studies have confirmed that mannanase specifically degrades mannan, increases energy utilization efficiency, and improves intestinal health in broilers. However, there has been limited research on the interaction between mannanase and SBM. In addition, previous findings have shown that a 50 kcal/kg reduction in dietary energy levels can lead to reduced growth performance and impaired intestinal health in broilers. The addition of mannanase can improve broilers’ growth performance by alleviating intestinal inflammatory response, regulating bacterial flora structure, and increasing the efficiency of feed nutrient utilization[30]. Therefore, the aim of this study was to determine the effects of mannanase supplementation in diets with different SBM content on the growth performance, intestinal health, and effective energy value of broilers under the condition that the metabolizable energy (ME) level of the diets was reduced by 50 kcal/kg, and the effects of the interaction between mannanase and SBM content was also preliminarily explored and revealed.
-
This study was conducted on Arbor Acres (AA+) broilers and the feed formulation was designed following the nutritional demands of broilers as suggested by NY/T33-2004. Corn-SBM diet was formulated under low-energy conditions, reducing the ME by 50 kcal/kg. Diets were formulated with degossypolled cottonseed protein (DCP), and corn gluten meal (CGM) instead of SBM while ensuring that the energy and crude protein (CP) levels were consistent across treatment groups. The feeding management and nutritional supply of the birds were in accordance with the guidelines and regulations presented in the Feeding Management Manual.
Experimental design
-
This study was randomized into six treatments using a 3 × 2 factorial design. Under low-energy conditions (ME reduced by 50 kcal/kg), broilers were fed diets containing different levels of SBM (0−21 d: 35.66%, 17.83%, and 8.92%; 22−42 d: 30.58%, 15.29%, and 7.65%) with two levels of mannanase (0 or 100 mg/kg). The composition and nutrient levels of the test diets are presented in Table 1, while Table 2 shows the measured values for each treatment group. All the diets were provided in pellet form.
Table 1. Composition and proportions of experimental dietsa (%, as is basis).
Item Day 0 to 21 Day 22 to 42 35.66% SBM group 17.83% SBM group 8.92% SBM group 30.58% SBM group 15.29% SBM group 7.65% SBM group Composition ratio (%) Corn (7.8% CP) 54.00 59.82 59.91 58.17 62.78 65.73 SBM (44% CP) 35.66 17.83 8.92 30.58 15.29 7.65 DCP 10.00 12.00 9.65 13.18 CGM 3.24 6.00 10.44 3.17 5.15 7.11 Soybean oil 2.76 1.15 1.02 4.46 3.20 2.25 L-lysine hydrochloride (98.5%) 0.12 0.45 0.60 0.16 0.37 0.50 Calcium hydrogen phosphate 1.84 1.96 2.10 1.51 1.55 1.53 Stone powder 1.25 1.36 1.34 1.26 1.32 1.37 NaCl 0.39 0.39 0.43 0.24 0.24 0.25 Trace mineral feedb 0.20 0.20 0.20 0.10 0.10 0.10 Choline chloride (50%) 0.20 0.20 0.20 0.10 0.10 0.10 DL-Methionine (99%) 0.21 0.22 0.17 0.14 0.13 0.11 L-Tryproan 0.10 0.12 L-Threonine 0.20 0.21 Antioxidants 0.05 0.05 0.05 0.05 0.05 0.05 Vitamin premixc 0.03 0.03 0.03 0.02 0.03 0.03 Phytase 0.02 0.02 0.02 0.02 0.02 0.02 Zeolite 0.02 0.02 2.24 0.02 0.02 0.02 Calculated nutrient levels ME, Mcal/kg 2.95 2.95 2.95 3.10 3.10 3.10 CP 22.13 22.13 22.12 20.19 20.19 20.19 Ca 1.01 1.05 1.05 0.92 0.93 0.93 Available phosphorus 0.45 0.47 0.49 0.39 0.40 0.40 Lysine 1.20 1.25 1.22 1.10 1.11 1.12 Methionine 0.56 0.59 0.56 0.46 0.47 0.47 Tryproan 0.18 0.25 0.24 Threonine 0.72 0.86 0.85 a The feed was in granular form. b The analytical values for each kg of trace mineral feed ingredients were presented as follows: Cu 8 g; Fe 40 g; Zn 55 g; Mn 60 g; I 750 mg; Se 150 mg; Co 250 mg; moisture ≤ 10%. c The analytical values for each kg of vitamin premix composition were presented as follows: vitamin A 50 million IU; vitamin D3 12 million IU; vitamin E 100,000 IU; vitamin K3 10 g; vitamin B1 8 g; vitamin B2 32 g; vitamin B6 12 g; vitamin B12 100 mg; nicotinamide 150 g; D-pantothenic acid 46 g; folic acid 5 g; biotin 500 mg; moisture ≤ 6%. Table 2. Measured values of effective energy and digestible essential amino acid contents of experimental diets from 0 to 21 d (%).
Items 35.66% SBM 17.83% SBM 8.92% SBM ME (Mcal/kg) 2.94 2.94 2.97 NE (Mcal/kg) 2.23 2.35 2.22 Digestible lysine 1.20 1.18 1.17 Digestible methionine 0.50 0.55 0.53 Digestible threonine 0.77 0.82 0.84 Digestible tryptophan 0.17 0.25 0.24 Digestible arginine 1.32 1.37 1.30 Digestible leucine 1.76 1.71 1.78 Digestible isoleucine 0.69 0.64 0.61 Digestible histidine 0.42 0.45 0.43 Digestible phenylalanine 0.91 0.92 0.95 Digestible glycine 0.37 0.38 0.37 Digestible cystine 0.26 0.30 0.30 Digestible valine 0.77 0.79 0.78 Digestible tyrosine 0.46 0.50 0.52 The broiler chickens were randomly divided into each treatment group. In experiment 1, 576 1-day-old AA+ broilers were selected, with eight replicates of 12 chickens per treatment for 42 d. The trial was conducted in two rearing phases at the Zhuozhou Teaching Experimental Farm of China Agricultural University (Hebei, China). In experiment 2, 180 AA+ broilers aged 17 d were selected, with six replicates of five chickens per treatment, and the testing period lasted from 17 to 24 d of age. This trial was completed in three phases, with two replicates as one phase of 7 d each. All experimental broilers were reared in the experimental chicken house of the Animal Husbandry Science Branch of the Jilin Academy of Agricultural Sciences (Jilin, China).
Respiration chambers
-
In experiment 2, an open-circuit indirect calorimetry respiration chamber designed for poultry was used to assess the impacts of adding mannanase to diets with different SBM levels on nutrient digestibility, nitrogen (N) balance, and energy metabolism in broilers. This equipment was developed by the Institute of Animal Nutrition and Feed Research of Jilin Academy of Agricultural Sciences, and the overall equipment consists of multi-channel gas analysis, multi-channel data acquisition system, respiratory metabolism chamber, multi-gas path driven by vortex fan, and heating and cooling equipment. Wherein the sensor for determining the oxygen (O2) concentration is a zirconia sensor (Model 65-4-20, The Advanced Micro Instruments, USA), and the sensor for determining carbon dioxide (CO2) concentration is an infrared sensor (AGM10, Sensors Europe GmbH, Germany). Additionally, the data acquisition system can provide real-time displays of test data and the operating status of the equipment. The remote control software can automatically calculate O2 consumption, CO2 production, and respiratory quotient (RQ) of broilers, and record the temperature and humidity data inside and outside the respiratory chamber, which can be viewed on the control interface of computerized data acquisition. The equipment was tested for functionality and air-tightness before the experiment.
Measurement of growth performance
-
On d 21 and 42, feed intake (FI) and body weight (BW) were measured for each replicate of each group in experiment 1. Average daily feed intake (ADFI), average daily gain (ADG), and feed conversion rate (FCR) were respectively computed for the periods of 0−21, 22−42, and 0−42 d.
Respiratory calorimetry
-
On d 20, two healthy broilers were randomly chosen from each replicate of each treatment group in experiment 2 and placed in the metabolic chamber of the respiratory calorimetry device. Broilers were acclimatized for 1 d and then measured for 3 d. The BW of the test chickens at 21 d and 42 d were recorded respectively, and the relevant indexes were calculated according to the following formula:
$ \mathrm{\rm{G}ross\; energy\; intake\; (GEI)\; =\ The\; gross\; energy\; (GE)\; of\; feed\, \times\, EI} $ $ \mathrm{\rm{G}ross\; excretory\; energy\; (GEE)\; =\; Fecal\; energy\; (FE)\, \times\, Fecal\; output} $ $ \rm Apparent\;metabolizable\;energy\;intake\;(AMEI)\;=\;GEI\,-\,GEE $ $ \rm Apparent\;metabolizable\;energy\;(AME)\;=\;\dfrac{AMEI}{FI} $ $\rm AMEn\;=\;\dfrac{AMEI\;-\;N\;deposition\;(RN)\;\times\;34.39}{FI}$ $ \mathrm{\rm{N}et\; energy\; (NE)\; =\; \dfrac{AMEI\; -\; Heat\; increment\; (HI)}{FI}} $ where, RN is the amount of N (kg) deposited by broilers per 1 kg of feed consumed and 34.39 is the correction factor.
$\begin{split} \quad\rm Heat\;production\;(HP)\;=\;& \rm 16.18\;\times\;O_2\;consumption\;(VO_2)\;+\;5.02\;\\&\rm\times\;CO_2\;excretion\;(VCO_2) \end{split}$ $ \mathrm{\rm{F}asting\; heat\; production\; (FHP)=Metabolic\; weight\; (BW^{0.70})\; \times\; 450} $ $ \mathrm{\mathrm{R}\mathrm{Q}=\dfrac{\mathrm{V}\mathrm{C}\mathrm{O}_2}{\mathrm{V}\mathrm{O}_2}} $ $\mathrm{H}\mathrm{I}=\mathrm{H}\mathrm{P}-\mathrm{F}\mathrm{H}\mathrm{P} $ $ \rm Energy\ deposition\ (RE)=AMEI\ -\ HP $ $ \mathrm{N}\; \mathrm{ }\mathrm{d}\mathrm{e}\mathrm{p}\mathrm{o}\mathrm{s}\mathrm{i}\mathrm{t}\mathrm{i}\mathrm{o}\mathrm{n}\mathrm{ }\; \left(\mathrm{T}\mathrm{R}\mathrm{N}\right)=\mathrm{I}\mathrm{n}\mathrm{g}\mathrm{e}\mathrm{s}\mathrm{t}\mathrm{e}\mathrm{d}\; \mathrm{ }\mathrm{N}\; \mathrm{ }\; \left(\mathrm{N}_{\mathrm{i}\mathrm{n}\mathrm{t}}\right)\; -\; \mathrm{E}\mathrm{x}\mathrm{c}\mathrm{r}\mathrm{e}\mathrm{t}\mathrm{e}\mathrm{d}\; \mathrm{ }\mathrm{N}\; \mathrm{ }\left(\mathrm{N}_{\mathrm{e}\mathrm{x}\mathrm{c}}\right) $ $ \mathrm{P}\mathrm{r}\mathrm{o}\mathrm{t}\mathrm{e}\mathrm{i}\mathrm{n}\;\mathrm{d}\mathrm{e}\mathrm{p}\mathrm{o}\mathrm{s}\mathrm{i}\mathrm{t}\mathrm{i}\mathrm{o}\mathrm{n}\;\mathrm{e}\mathrm{n}\mathrm{e}\mathrm{r}\mathrm{g}\mathrm{y}\;({\mathrm{R}\mathrm{E}}_{\mathrm{p}\mathrm{r}\mathrm{o}})=\mathrm{T}\mathrm{R}\mathrm{N}\,\times\, 6.25\,\times \,23.84 $ $ \mathrm{F}\mathrm{a}\mathrm{t}\;\mathrm{d}\mathrm{e}\mathrm{p}\mathrm{o}\mathrm{s}\mathrm{i}\mathrm{t}\mathrm{i}\mathrm{o}\mathrm{n}\;\mathrm{e}\mathrm{n}\mathrm{e}\mathrm{r}\mathrm{g}\mathrm{y}\;\left({\mathrm{R}\mathrm{E}}_{\mathrm{f}\mathrm{a}\mathrm{t}}\right)=\mathrm{R}\mathrm{E}-{\mathrm{R}\mathrm{E}}_{\mathrm{p}\mathrm{r}\mathrm{o}} $ where, 6.25 is the conversion coefficient of protein to N and 23.8 is the energy contained in 1 kg of protein (MJ).
Measurement of nutrient digestibility
-
In experiment 2, excreta were collected concurrently with the respiratory calorimetry, and the apparent total tract digestibility (ATTD) of nutrients was determined using the Total Collection Method. At 21 to 24 d, two broilers were randomly chosen from each replicate of each treatment group for collecting fecal samples. The initial weight of the mixed fecal sample was recorded, and then it was dried in an oven at 65 °C for 72 h until a constant weight was achieved. The dried sample was allowed to cool at room temperature for 24 h, weighed again, and crushed. Dry matter (DM), CP, GE, and amino acid (AA) in diets and feces were determined. DM, CP, and GE were detected by GB/T 6435-2014, GB/T 6432-1994, and ISO 9831:1998, respectively. AA was determined according to GB/T 18246-2019. The ME content in the feed was calculated according to the formula: ME of feed (MJ/kg) = GE of feed × ATTD of GE.
The ATTD was calculated using the following formula:
$ \begin{split} & \mathrm{T}\mathrm{h}\mathrm{e}\; \mathrm{A}\mathrm{T}\mathrm{T}\mathrm{D}\; \mathrm{o}\mathrm{f}\; \mathrm{n}\mathrm{u}\mathrm{t}\mathrm{r}\mathrm{i}\mathrm{e}\mathrm{n}\mathrm{t}\mathrm{s}\mathrm{ }\; (\text{%})= \\ &\quad\dfrac{\mathrm{N}\mathrm{u}\mathrm{t}\mathrm{r}\mathrm{i}\mathrm{e}\mathrm{n}\mathrm{t}\; \mathrm{c}\mathrm{o}\mathrm{n}\mathrm{t}\mathrm{e}\mathrm{n}\mathrm{t}\; \mathrm{o}\mathrm{f}\; \mathrm{i}\mathrm{n}\mathrm{g}\mathrm{e}\mathrm{s}\mathrm{t}\mathrm{e}\mathrm{d}\; \mathrm{f}\mathrm{e}\mathrm{e}\mathrm{d}-\mathrm{N}\mathrm{u}\mathrm{t}\mathrm{r}\mathrm{i}\mathrm{e}\mathrm{n}\mathrm{t}\; \mathrm{c}\mathrm{o}\mathrm{n}\mathrm{t}\mathrm{e}\mathrm{n}\mathrm{t}\; \mathrm{o}\mathrm{f}\; \mathrm{f}\mathrm{e}\mathrm{c}\mathrm{e}\mathrm{s}}{\mathrm{N}\mathrm{u}\mathrm{t}\mathrm{r}\mathrm{i}\mathrm{e}\mathrm{n}\mathrm{t}\; \mathrm{c}\mathrm{o}\mathrm{n}\mathrm{t}\mathrm{e}\mathrm{n}\mathrm{t}\; \mathrm{o}\mathrm{f}\; \mathrm{i}\mathrm{n}\mathrm{g}\mathrm{e}\mathrm{s}\mathrm{t}\mathrm{e}\mathrm{d}\; \mathrm{f}\mathrm{e}\mathrm{e}\mathrm{d}} \end{split} $ Sample collection
-
On d 21 and 42, a healthy broiler was randomly chosen from each replicate in experiment 1, weighed, and blood was collected. The molecular and tissue samples were collected from the jejunum and ileum after the execution of broilers. The intestinal chyme was carefully rinsed with normal saline. The molecular samples were promptly flash-frozen in liquid nitrogen, while the tissue samples intended for morphological analysis were fixed in a 4% paraformaldehyde solution. Additionally, samples of ileal and cecal chyme were collected and rapidly flash-frozen in liquid nitrogen for further study.
Measurement of jejunal chyme viscosity
-
An Ostwald viscosimeter (1831-2; 0.55 mm; Huanguang Glass Instruments Co., Ltd., Taizhou, Zhejiang, China) was used to determine the chyme viscosity[30].
Measurement of intestinal barrier integrity
-
This test was performed using chicken diamine oxidase (DAO) and D-lactic acid (D-LA) ELISA kits produced by Shanghai Guduo Biotechnology Co., LTD. (Shanghai, China) to measure DAO and D-LA contents in serum. A chicken endotoxin (ET) test LAL kit provided by Xiamen Bioendo Technology Co., Ltd. (Xiamen, China) was used to evaluate ET levels in serum.
Measurement of intestinal morphology
-
After paraffin embedding and fixation of ileal tissues, sections were prepared. The intestinal tissues were stained with HE. Then, these stained tissues were observed using a Leica microscope (Wetzlar, Germany, ModelDMi8) to determine the morphology of the intestinal epithelium[30].
Measurement of gene expression related to intestinal immunity and intestinal barrier
-
Total RNA from the jejunum and ileum was extracted using TRIzol reagent. The concentration of total RNA was measured with a NanoDrop 2000 microspectrophotometer. In accordance with the instructions included with each kit, reverse transcription and fluorescence quantification were carried out separately. Using β-actin as an internal reference gene, the expression levels of genes related to intestinal immunity and intestinal barrier were measured by an ABI 7500 real-time fluorescence quantitative PCR instrument. Table 3 lists the primers that were employed for real-time fluorescent quantitative PCR in this trial. The relative expression of the mRNA of each target gene was calculated using the 2−ΔΔCᴛ method.
Table 3. Sequences of oligonucleotide primersa for real-time quantitative fluorescence PCR.
Geneb Sequences of primers (5'-3')c Serial No. Claudin-1 F: CATACTCCTGGGTCTGGTTGGT NM_001013611.2 R: GACAGCCATCCGCATCTTCT β-actin F: CAACACAGTGCTGTCTGGTGGTAC NM_205518.1 R: CTCCTGCTTGCTGATCCACATCTG Occludin F: ACGGCAGCACCTACCTCAA NM_205128.1 R: GGGCGAAGAAGCAGATGAG ZO-1 F: CTTCAGGTGTTTCTCTTCCTCCTC XM_015278981.1 R: CTGTGGTTTCATGGCTGGATC MUC 2 F: TTCATGATGCCTGCTCTTGTG XM_421035 R: CCTGAGCCTTGGTACATTCTTGT IL-1β F: ACTGGGCATCAAGGGCTA NM_204524.1 R: GGTAGAAGATGAAGCGGGTC IL-6 F: CGCCCAGAAATCCCTCCTC XM_015281283.1 R: AGGCACTGAAACTCCTGGTC IL-8 F: ATGAACGGCAAGCTTGGAGCTG XM_015301388.1 R: TCCAAGCACACCTCTCTTCCATCC IL-10 F: GCTGCCAAGCCCTGTT NM_001004414.2 R: CCTCAAACTTCACCCTCA IL-18 F: TGATGAGCTGGAATGCGATG NM_204608.3 R: ACTGCCAGATTTCACCTCCTG TNF-α F: GAGCGTTGACTTGGCTGTC XM_204267 R: AAGCAACAACCAGCTATGCAC MyD88 F: TGCAAGACCATGAAGAACGA NM_001030962.5 R: TCACGGCAGCAAGAGAGATT NF-κB F: GTG TGA AGA AAC GGG AAC TG NM_205129.1 R: GGC ACG GTT GTC ATA GAT GG TLR-4 F: CCACTATTCGGTTGGTGGAC NM_001030693.1 R: ACAGCTTCTCAGCAGGCAAT a Primers were designed using Primer Express software (Sangon Biotech Co., LTD., Shanghai, China). b Zonula occludens-1 (ZO-1); mucin2 (MUC 2); interleukin-1β (IL-1β); interleukin-6 (IL-6); interleukin-8 (IL-8); interleukin-10 (IL-10); interleukin-18 (IL-18); tumor necrosis factor α (TNF-α); myeloid differentiation factor 88 (MyD88); nuclear factor kappa B (NF-κB); toll-like receptor-4 (TLR-4). c F for forward; R for reverse. 16S rRNA sequencing of microorganisms in the ileum and cecum
DNA isolation and high-throughput sequencing operations
-
To further investigate the effect of mannanase addition to diets containing 17.83% SBM on intestinal microorganisms of broilers at 21 d, 16S rRNA gene sequencing was conducted on chyme samples from both the 17.83% SBM group and the mannanase addition group in experiment 1. DNA of microorganisms was extracted from the contents of the ileum and cecum. The extraction and concentration of DNA were determined. After the amplification of the bacterial DNA, the PCR products were purified. Then the library was constructed and quantified[30]. After the library met the required standards, HiSeq2500-PE250 was used for the sequencing process. The sequencing analysis was carried out by Shenzhen Weike Meng Technology Group Co., Ltd.
Processing of the sequences and analyses in bioinformatics
-
Effective tags were clustered to obtain amplicon sequencing variants (ASVs) using Divisive Amplicon Denoising Algorithm 2 (DADA 2). The sequenced samples were bipartite sequenced using the Illumina NovaSeq platform, and the obtained sequencing data were split by barcode to obtain valid sequence information. The entire raw sequences of all samples were filtered using the DADA 2 plugin of QIIME2 software, followed by denoising and merging, with chimeras removed to form operational taxonomic units (OTUs). Based on the principles of algorithmic design, the representative sequence was annotated with species. The Greengenes Database 13_8 database was used for species annotation analysis and based on the species annotation information, OTUs, and their contained sequences were checked. Based on the absolute abundance and the annotation information of OTUs, the number of sequences per sample at seven taxonomic levels were counted as a proportion of the total number of sequences to effectively assess the resolution of species annotation of samples. UniFrac distances of samples were calculated using QIIME software to construct the Unweighted Pair-Group Method with Arithmetic mean (UPGMA) clustering trees. Based on the Latent Dirichlet Allocation (LDA), Linear discriminant analysis Effect Size (LEfSe) was used to identify the biomarkers that showed statistically significant differences among different groups (bacterial categories with significant differences in relative abundance). R software (Version 2.15.3) was used to make Venn diagrams, coverage index plots, PCA and PCoA plots, along with Analysis of similarities (ANOSIM). T-tests and Kruskal Wallis tests between each group were performed using R software for microorganisms with relative abundance > 0.001. Finally, PICRUSt2 was utilized to predict and conduct an analysis of the function of the metagenome.
Statistical analyses
-
In this study, the data from each group in the two experiments were statistically analyzed by SPSS Statistics V22.0. A general linear model (univariate analysis) was employed for statistical analysis, and differences between treatments were analyzed by Duncan’s multiple comparison test. All differences that were considered statistically significant were determined based on a p value < 0.05. Additionally, p values between 0.05 and 0.1 were categorized as trends.
-
As shown in Table 4, there was a significant reciprocal effect of mannanase and SBM content on BW of broilers at 21 d (p < 0.05) and an approaching significance in the reciprocal effect on ADG (p = 0.069) and FCR of broilers from 0 to 21 d (p = 0.055). Adding mannanase to the diets significantly reduced the FCR of broilers at d 0 to 42 (p < 0.01) and d 22 to 42 (p < 0.05). A reduction in SBM content negatively impacted broiler growth performance. Specifically, compared with the SBM control group, when the SBM content was reduced to 50% and 25% of the control group, the BW of broilers at 42 d and ADG at d 0 to 42 were significantly decreased, and the FCR of broilers at d 0 to 42 was significantly increased (p < 0.01). In addition, when the SBM content was reduced to 25% of the control group, it significantly reduced the ADFI of broilers from 0 to 42 d compared to the other two groups (p < 0.05). The addition of mannanase significantly improved the growth performance of broilers from 0 to 21 d, with increasing the BW, and ADG, and reducing the FCR in both the control diet group and the 17.83% SBM group. However, mannanase showed limited efficacy when SBM content was reduced to 8.92%.
Table 4. Effect of mannanase addition to diets with different SBM content on growth performance of broilers.
SBM content Mannanase Day 0 to 21 Day 22 to 42 Day 0 to 42 BW (kg) ADG (kg) ADFI (kg) FCR BW (kg) ADG (kg) ADFI (kg) FCR ADG, kg ADFI, kg FCR Control group 0 mg/kg 0.832bc 0.037b 0.054 1.427bc 2.690 0.088 0.151 1.711 0.063 0.102 1.569 100 mg/kg 0.877a 0.040a 0.055 1.375d 2.852 0.094 0.153 1.631 0.067 0.104 1.503 50% of SBM of control 0 mg/kg 0.822cd 0.037b 0.054 1.450b 2.625 0.086 0.154 1.797 0.061 0.104 1.623 100 mg/kg 0.862ab 0.039a 0.055 1.412c 2.678 0.087 0.153 1.765 0.063 0.104 1.589 25% of SBM of control 0 mg/kg 0.804cd 0.036b 0.054 1.493a 2.475 0.080 0.149 1.879 0.058 0.102 1.686 100 mg/kg 0.798d 0.036b 0.054 1.496a 2.427 0.077 0.143 1.848 0.057 0.098 1.672 SEM 0.006 0.000 0.000 0.008 0.029 0.001 0.001 0.015 0.001 0.007 0.010 Main effect Mannanase 0 mg/kg 0.819 0.037b 0.054 1.457a 2.597 0.085 0.151 1.795a 0.061 0.103 1.626a 100 mg/kg 0.846 0.038a 0.054 1.428b 2.652 0.095 0.150 1.748b 0.062 0.102 1.588b SBM content control group 0.855 0.039a 0.054 1.401c 2.771a 0.091a 0.152a 1.671c 0.065a 0.103a 1.536c 50% of SBM of control 0.842 0.038a 0.054 1.431b 2.652b 0.086b 0.153a 1.781b 0.062b 0.104a 1.606b 25% of SBM of control 0.801 0.036b 0.054 1.494a 2.451c 0.078c 0.146b 1.863a 0.057c 0.100b 1.679a p-value Mannanase 0.003 0.004 0.269 0.003 0.211 0.469 0.422 0.022 0.154 0.658 < 0.001 SBM content < 0.001 < 0.001 0.762 < 0.001 < 0.001 < 0.001 0.036 < 0.001 < 0.001 0.041 < 0.001 Mannanase × SBM 0.036 0.069 0.526 0.055 0.161 0.267 0.339 0.515 0.140 0.292 0.120 a, b, c The data in the same row with shoulder labels containing different letters indicate significant differences (p < 0.05). Respiratory metabolism and N balance
-
As shown in Table 5, there was a significant reciprocal effect of mannanase and SBM content on RQ in broilers at 21 d (p < 0.05), and there was a relative trend in the reciprocal effect on TRN (p = 0.068). Adding mannanase to the diet significantly increased TRN in broilers (p < 0.01), reduced VO2 and VCO2 (p < 0.05) and increased Nint in broilers at 21 d (p < 0.05), with a relative trend to decrease Nexc (p = 0.061). The effect of SBM content on the N balance of broilers at 21 d was specifically shown that compared with the 35.66% SBM group, when the SBM content was reduced to 17.83% and 8.92%, the Nexc was significantly increased and TRN was significantly decreased in broilers at 21 d (p < 0.01). Adding mannanase significantly reduced the RQ of broilers at 21 d in both the control diet group and the 17.83% SBM group. However, mannanase showed limited efficacy when SBM content was reduced to 8.92%.
Table 5. Effect of mannanase addition to diets with different SBM content on the respiratory metabolism and N balance of broilers at 21 d.
SBM content Mannanase VO2 (L) VCO2(L) RQ Nint (g/d) Nexc (g/d) TRN (g/d) 35.66% SBM 0 mg/kg 35.407 36.399 1.028a 3.470 1.413 2.057b 100 mg/kg 34.152 34.300 1.011bc 3.640 1.094 2.546a 17.83% SBM 0 mg/kg 32.990 33.632 1.020ab 3.494 1.634 1.861b 100 mg/kg 32.771 32.432 1.003c 3.521 1.530 1.992b 8.92% SBM 0 mg/kg 36.165 36.354 1.006bc 3.462 1.573 1.889b 100 mg/kg 31.563 32.075 1.013abc 3.532 1.576 1.957b SEM 0.510 0.516 0.002 0.019 0.045 0.053 Main effect Mannanase 0 mg/kg 34.854a 35.462a 1.018 3.476b 1.540a 1.936b 100 mg/kg 32.829b 32.936b 1.009 3.565a 1.400b 2.165a SBM content 35.66% SBM 34.780 35.350 1.020 3.555 1.256b 2.302a 17.83% SBM 32.880 33.032 1.012 3.508 1.582a 1.926b 8.92% SBM 33.864 34.215 1.010 3.497 1.574a 1.923b p-value Mannanase 0.039 0.010 0.043 0.012 0.061 0.005 SBM content 0.270 0.141 0.147 0.328 0.001 < 0.001 Mannanase × SBM 0.154 0.388 0.037 0.213 0.196 0.068 a, b, c The data in the same row with shoulder labels containing different letters indicate significant differences (p < 0.05). Energy metabolism
-
As shown in Table 6, there was a relative trend in the reciprocal effect of mannanase and SBM content on REpro (p = 0.068). Mannanase significantly reduced HP and HI in broilers at 21 d (p < 0.05), significantly increased RE and NE:ADG (p < 0.05), and also highly significantly increased NE value of the feed, NE:AME, and REpro in broilers at 21 d (p < 0.01). The effect of SBM content on energy metabolism in broilers at 21 d was mainly reflected in the fact that when the SBM content was reduced to 17.83% and 8.92%, the REpro in broilers at 21 d was significantly decreased. The 17.83% SBM group significantly increased the REfat. When SBM content was 35.66%, adding mannanase significantly increased the REpro in broilers at 21 d. However, mannanase showed limited efficacy when SBM content was reduced to 8.92%.
Table 6. Effect of mannanase addition to diets with different SBM content on energy metabolism in broilers at 21 d.
SBM content Mannanase THP (KJ) HI (KJ) RE (KJ) REpro (KJ) REfat (KJ) AME
(MJ/kg)AMEn
(MJ/kg)NE
(MJ/kg)NE :
AMEAME : ADG
(KJ/g)NE : ADG
(KJ/g)35.66% SBM 0 mg/kg 755.609 318.010 553.430 306.545b 246.884 12.307 11.641 9.330 0.758 12.667 9.607 100 mg/kg 724.772 267.340 647.049 379.367a 267.682 12.527 11.803 10.153 0.812 12.602 10.213 17.83% SBM 0 mg/kg 702.607 262.826 608.921 277.277b 331.644 12.323 11.723 9.841 0.798 12.690 10.130 100 mg/kg 693.039 249.293 634.557 296.747b 337.811 12.454 11.811 10.116 0.812 12.633 10.261 8.92% SBM 0 mg/kg 767.646 333.854 553.408 281.412b 271.996 12.438 11.827 9.294 0.748 12.977 9.696 100 mg/kg 671.706 263.332 649.486 291.569b 357.916 12.485 11.849 9.993 0.800 13.094 10.478 SEM 10.776 10.552 15.626 7.846 13.337 0.077 0.071 0.109 0.008 0.084 0.107 Main effect Mannanase 0 mg/kg 741.954a 304.897a 571.920b 288.412b 283.508 12.356 11.730 9.488b 0.768b 12.778 9.811b 100 mg/kg 696.506b 259.988b 643.697a 322.561a 321.136 12.489 11.821 10.087a 0.808a 12.776 10.317a SBM content 35.66% SBM 740.191 292.675 600.240 342.956a 257.283b 12.417 11.722 9.741 0.785 12.635 9.910 17.83% SBM 697.823 256.060 621.739 287.012b 334.728a 12.389 11.767 9.978 0.805 12.662 10.195 8.92% SBM 719.676 298.593 601.447 286.491b 314.956ab 12.462 11.838 9.643 0.774 13.035 10.087 p-value Mannanase 0.028 0.030 0.025 0.005 0.135 0.426 0.551 0.005 0.006 0.993 0.017 SBM content 0.230 0.178 0.810 < 0.001 0.040 0.935 0.820 0.377 0.189 0.111 0.508 Mannanase × SBM 0.193 0.494 0.566 0.068 0.379 0.911 0.931 0.503 0.431 0.883 0.398 a, b The data in the same row with shoulder labels containing different letters indicate significant differences (p < 0.05). The ATTD of nutrients
-
As shown in Table 7, there was a relative trend in the reciprocal effect of mannanase and SBM content on the ATTD of CP in broiler chickens at 21 d (p = 0.093). Adding mannanase to diets significantly increased the ATTD of CP in broilers at 21 d (p < 0.05). The effects of SBM content on the ATTD of nutrients of broilers at 21 d were mainly shown as follows: compared with the 35.66% SBM group, the 17.83% and 8.92% SBM groups significantly decreased the ATTD of CP (p < 0.01) and also had a relative tendency to increase the ATTD of GE when the SBM content was reduced to 8.92% (p = 0.053). When the SBM content was 35.66%, adding mannanase significantly increased the ATTD of CP at 21 d.
Table 7. Effect of mannanase addition to diets with different SBM content on the ATTD of DM, CP, and GE of broilers at 21 d (%).
SBM content Mannanase ATTD
of DMATTD
of CPATTD
of GE35.66% SBM 0 mg/kg 67.062 59.355b 72.360 100 mg/kg 69.497 71.307a 73.988 17.83% SBM 0 mg/kg 68.646 53.074b 74.507 100 mg/kg 69.777 56.517b 76.043 8.92% SBM 0 mg/kg 69.744 54.575b 76.982 100 mg/kg 70.157 55.347b 75.970 SEM 0.541 1.417 0.560 Main effect Mannanase 0 mg/kg 68.484 55.668b 74.616 100 mg/kg 69.810 61.057a 75.334 SBM content 35.66% SBM 68.280 65.331a 73.174b 17.83% SBM 69.211 54.795b 75.275ab 8.92% SBM 69.950 54.961b 76.476a p-value Mannanase 0.239 0.015 0.508 SBM content 0.474 < 0.001 0.053 Mannanase × SBM 0.752 0.093 0.527 a, b The data in the same row with shoulder labels containing different letters indicate significant differences (p < 0.05). As shown in Table 8, the addition of mannanase to the diets significantly increased the ATTD of essential amino acids (EAA) such as Lysine (Lys), Valine (Val), and Isoleucine (Ile) in broilers at 21 d, and significantly increased the ATTD of nonessential amino acid such as Alanine (Ala) (p < 0.05), with a relative trend to increase the ATTD of Leucine (Leu) (p = 0.079) and the ATTD of Phenylalanine (Phe) in broilers at 21 d (p = 0.072). The effect of SBM content on the ATTD of AA in broilers at 21 d were mainly expressed in the following ways: compared with the 35.66% SBM group, the 17.83% and 8.92% SBM groups significantly reduced the ATTD of Lys, Ile, and Histidine (His), and increased the ATTD of Tryptophan (Trp) in broilers at 21 d (p < 0.01).
Table 8. Effect of mannanase addition to diets with different SBM content on the ATTD of AA of broilers at 21 d (%).
SBM content Mannanase Threonine Lysine Tryptophan Methionine Arginine Leucine Valine Isoleucine Phenylalanine 35.66% SBM 0 mg/kg 0.830 0.894 0.852 0.935 0.937 0.890 0.829 0.851 0.897 100 mg/kg 0.838 0.907 0.845 0.942 0.943 0.899 0.860 0.876 0.914 17.83% SBM 0 mg/kg 0.817 0.872 0.877 0.929 0.934 0.872 0.815 0.826 0.884 100 mg/kg 0.830 0.881 0.905 0.934 0.934 0.879 0.826 0.834 0.891 8.92% SBM 0 mg/kg 0.836 0.870 0.872 0.928 0.932 0.883 0.828 0.832 0.898 100 mg/kg 0.840 0.886 0.903 0.931 0.933 0.897 0.836 0.847 0.904 SEM 0.004 0.003 0.008 0.002 0.002 0.003 0.004 0.005 0.003 Main effect Mannanase 0 mg/kg 0.828 0.879b 0.867 0.931 0.934 0.882b 0.824b 0.836b 0.893b 100 mg/kg 0.836 0.892a 0.884 0.936 0.937 0.891a 0.840a 0.852a 0.903a SBM content 35.66% SBM 0.834 0.901a 0.848b 0.939 0.940 0.894a 0.845a 0.864a 0.905a 17.83% SBM 0.824 0.877b 0.891a 0.931 0.934 0.876b 0.820b 0.830b 0.888b 8.92% SBM 0.838 0.881b 0.888a 0.929 0.933 0.890a 0.832ab 0.840b 0.901a p-value Mannanase 0.299 0.005 0.222 0.170 0.488 0.079 0.039 0.037 0.072 SBM content 0.310 < 0.001 0.034 0.101 0.300 0.019 0.047 0.003 0.031 Mannanase × SBM 0.879 0.789 0.475 0.918 0.813 0.850 0.444 0.612 0.668 SBM content Mannanase Histidine Glycine Aspartic acid Glutamic acid Cystine Alanine Serine Proline Tyrosine 35.66% SBM 0 mg/kg 0.875 0.484 0.832 0.896 0.757 0.831 0.836 0.844 0.858 100 mg/kg 0.892 0.549 0.861 0.907 0.781 0.862 0.861 0.866 0.892 17.83% SBM 0 mg/kg 0.846 0.483 0.823 0.894 0.768 0.828 0.828 0.832 0.874 100 mg/kg 0.860 0.497 0.832 0.900 0.790 0.842 0.837 0.842 0.872 8.92% SBM 0 mg/kg 0.853 0.502 0.832 0.904 0.780 0.856 0.845 0.851 0.871 100 mg/kg 0.852 0.543 0.835 0.908 0.802 0.867 0.851 0.857 0.890 SEM 0.005 0.012 0.005 0.003 0.006 0.004 0.004 0.004 0.004 Main effect Mannanase 0 mg/kg 0.858 0.490b 0.829 0.898 0.768b 0.839b 0.836b 0.842b 0.867b 100 mg/kg 0.868 0.530a 0.843 0.905 0.791a 0.857a 0.850a 0.855a 0.885a SBM content 35.66% SBM 0.884a 0.516 0.846 0.902 0.769 0.847ab 0.849 0.855 0.875 17.83% SBM 0.853b 0.490 0.827 0.897 0.779 0.835b 0.832 0.837 0.873 8.92% SBM 0.853b 0.523 0.833 0.906 0.791 0.862a 0.848 0.854 0.880 p-value Mannanase 0.243 0.096 0.119 0.203 0.062 0.015 0.083 0.089 0.020 SBM content 0.005 0.470 0.202 0.450 0.329 0.019 0.154 0.106 0.665 Mannanase × SBM 0.612 0.665 0.444 0.865 0.998 0.450 0.522 0.631 0.124 a, b The data in the same row with shoulder labels containing different letters indicate significant differences (p < 0.05). Chyme viscosity of the jejunum
-
As shown in Table 9, there was a highly significant reciprocal effect of mannanase and SBM content on the chyme viscosity of jejunum in broilers at 21 d. Mannanase significantly reduced the chyme viscosity of jejunum (p < 0.01). The effects of SBM content on jejunal chyme viscosity were mainly manifested by the fact that the 17.83% and 8.92% SBM reduction groups significantly reduced the chyme viscosity of the jejunum in broilers at 21 d compared with the 35.66% SBM diet (p < 0.05). The addition of mannanase to the diets significantly reduced the jejunal chyme viscosity of broilers at 21 d, and when the SBM content was 30.58%, mannanase could highly significantly reduce chyme viscosity of broilers at 42 d.
Table 9. Effect of mannanase addition to diets with different SBM content on jejunal chyme viscosity in broilers (P).
SBM content Mannanase 21 d 42 d Control group 0 mg/kg 1.083 1.120a 100 mg/kg 1.059 1.079b 50% of SBM of control 0 mg/kg 1.070 1.113a 100 mg/kg 1.033 1.096ab 25% of SBM of control 0 mg/kg 1.048 1.096ab 100 mg/kg 1.046 1.124a SEM 0.004 0.005 Main effect Mannanase 0 mg/kg 1.067a 1.110 100 mg/kg 1.046b 1.110 SBM content Control group 1.071a 1.099 50% of SBM of control 1.051b 1.104 25% of SBM of control 1.047b 1.110 p-value Mannanase 0.004 0.251 SBM content 0.015 0.604 Mannanase × SBM 0.108 0.008 a, b The data in the same row with shoulder labels containing different letters indicate significant differences (p < 0.05). Intestinal barrier integrity
-
As shown in Table 10, there was a highly significant interaction effect of mannanase and SBM content on serum D-LA levels in broiler chickens at 21 d. Adding mannanase to the diets significantly reduced DAO and ET in the serum of broilers at 21 d (p < 0.05). The levels of ET in the serum of broilers at 21 d decreased with a reduction in SBM content and was significantly reduced in the 17.83% and 8.92% SBM groups compared to the 35.66% SBM diet (p < 0.01). Adding mannanase significantly reduced the serum D-LA levels of broilers at 21 d in the control diet and the 17.83% SBM group. However, mannanase showed limited efficacy when SBM content was reduced to 8.92%.
Table 10. Effect of mannanase addition to diets with different SBM content on intestinal barrier integrity of broilers at 21 d.
SBM content Mannanase DAO (ng/mL) D-LA (nmol/L) ET (EU/ml) 35.66% SBM 0 mg/kg 24.711 73.848a 0.219 100 mg/kg 24.171 68.059c 0.188 17.83% SBM 0 mg/kg 25.079 68.146c 0.152 100 mg/kg 22.858 63.183d 0.135 8.92% SBM 0 mg/kg 24.433 69.186bc 0.170 100 mg/kg 23.430 72.881ab 0.151 SEM 0.295 0.785 0.007 Main effect Mannanase 0 mg/kg 24.741a 70.393 0.180a 100 mg/kg 23.486b 68.041 0.158b SBM content 35.66% SBM 24.441 70.953 0.204a 17.83% SBM 23.969 65.664 0.160b 8.92% SBM 23.932 71.034 0.143b p-value Mannanase 0.036 0.069 0.048 SBM content 0.728 0.001 < 0.001 Mannanase × SBM 0.480 0.006 0.850 a, b, c, d The data in the same row with shoulder labels containing different letters indicate significant differences (p < 0.05). Intestinal morphology
-
As shown in Table 11, there was a significant reciprocal effect of mannanase and SBM content on the VH and CD of ileal epithelium in broilers at 21 d (p < 0.05). At the same time, it had a highly significant reciprocal effect on the V:C (p < 0.01). When the SBM content was 35.66% and 17.83%, adding mannanase significantly increased the VH and V:C of ileal epithelium in broilers at 21 d. When the SBM content was 8.92%, mannanase highly significantly increased the V:C of ileal epithelium in broilers at 21 d, but it did not improve the VH of ileal epithelium.
Table 11. Effect of mannanase addition to diets with different SBM content on morphological indexes of ileal epithelium in broilers at 21 d.
SBM content Mannanase VH (μm) CD (μm) V:C 35.66% SBM 0 mg/kg 656.073b 111.063a 5.441c 100 mg/kg 729.529a 109.180ab 6.695a 17.83% SBM 0 mg/kg 664.777b 113.061a 5.879b 100 mg/kg 712.769a 108.930ab 6.492a 8.92% SBM 0 mg/kg 666.053b 100.126c 6.005b 100 mg/kg 679.013b 104.606bc 6.546a SEM 5.584 0.889 0.079 Main effect Mannanase 0 mg/kg 662.301 108.084 5.775 100 mg/kg 707.103 107.572 6.578 SBM content 35.66% SBM 692.801 110.122 6.068 17.83% SBM 688.773 110.996 6.185 8.92% SBM 672.533 102.366 6.276 p-value Mannanase < 0.001 0.703 < 0.001 SBM content 0.124 < 0.001 0.220 Mannanase × SBM 0.018 0.032 0.007 a, b, c The data in the same row with shoulder labels containing different letters indicate significant differences (p < 0.05). Relative expression of genes related to the intestinal barrier
Relative expression of jejunal barrier-related genes
-
As shown in Table 12, mannanase highly significantly increased the relative expression of Claudin-1 in the jejunum of broilers at 21 d (p < 0.01). There was no significant effect of SBM content on the relative expression of genes associated with the jejunal barrier in broilers at 21 d. Mannanase could highly significantly increase the relative expression of Claudin-1 in the jejunum of broilers at 21 d.
Table 12. Effect of mannanase addition to diets with different SBM content on the relative expression of genes associated with the jejunal barrier in broilers at 21 d.
SBM content Mannanase ZO-1 Occludin Claudin-1 MUC-2 35.66% SBM 0 mg/kg 1.000 1.000 1.000 1.000 100 mg/kg 1.070 1.579 1.081 1.118 17.83% SBM 0 mg/kg 0.884 1.143 0.748 0.933 100 mg/kg 0.916 1.321 1.539 1.049 8.92% SBM 0 mg/kg 0.660 1.500 0.641 1.004 100 mg/kg 1.111 1.770 1.330 0.968 SEM 0.060 0.125 0.082 0.052 Main effect Mannanase 0 mg/kg 0.848 1.215 0.796b 0.979 100 mg/kg 1.032 1.556 1.316a 1.045 SBM content 35.66% SBM 1.035 1.289 1.040 1.059 17.83% SBM 0.900 1.232 1.143 0.991 8.92% SBM 0.886 1.635 0.985 0.986 p-value Mannanase 0.127 0.183 0.001 0.550 SBM content 0.529 0.378 0.667 0.831 Mannanase × SBM 0.289 0.794 0.109 0.805 a, b The data in the same row with shoulder labels containing different letters indicate significant differences (p < 0.05). Relative expression of ileal barrier-related genes
-
As shown in Table 13, there was no significant reciprocal effect of mannanase and SBM content on the mRNA expression of genes related to the ileal barrier in broilers at 21 d (p > 0.05). The addition of mannanase to diets significantly increased the relative expression of occludin and Claudin-1 in the ileum of broilers at 21 d (p < 0.05), with a tendency to increase the relative expression of ZO-1 (p = 0.062). SBM content had no significant effect on the relative expression of ileal barrier-related genes in broilers at 21 d (p > 0.05). Mannanase significantly increased the relative expression of occludin and Claudin-1, etc. in the ileum of broilers at 21 d, and there was no significant reciprocal effect of mannanase and SBM content on the relative expression of genes associated with the ileal barrier at 21 d.
Table 13. Effect of mannanase addition to diets with different SBM content on the relative expression of genes associated with the ileal barrier in broilers at 21 d.
SBM content Mannanase ZO-1 Occludin Claudin-1 MUC-2 35.66% SBM 0 mg/kg 1.000 1.000 1.000 1.000 100 mg/kg 1.363 1.336 1.332 1.227 17.83% SBM 0 mg/kg 0.922 0.793 0.912 0.978 100 mg/kg 0.935 0.925 1.094 1.177 8.92% SBM 0 mg/kg 0.701 0.733 1.020 1.226 100 mg/kg 1.254 1.135 1.865 1.004 SEM 0.083 0.067 0.111 0.081 Main effect Mannanase 0 mg/kg 0.875b 0.842b 0.977b 1.068 100 mg/kg 1.184a 1.132a 1.430a 1.136 SBM content 35.66% SBM 1.182 1.168 1.166 1.113 17.83% SBM 0.928 0.859 1.003 1.077 8.92% SBM 0.978 0.934 1.442 1.115 p-value Mannanase 0.062 0.029 0.040 0.691 SBM content 0.405 0.133 0.247 0.979 Mannanase × SBM 0.392 0.672 0.420 0.481 a, b The data in the same row with shoulder labels containing different letters indicate significant differences (p < 0.05). Relative expression of genes related to intestinal immunity
-
As shown in Table 14, there was a highly significant reciprocal effect of mannanase and SBM content on the relative expression of IL-1β and IL-18 in ileum at 21 d (p < 0.01), and there was a relative trend in the reciprocal effect of mannanase and SBM content on the relative expression of NF-κB (p = 0.052). Adding mannanase highly significantly reduced the relative expression of MyD88 (p < 0.01), IL-6, and TLR-4 in the ileum of broilers at 21 d (p < 0.05). Moreover, mannanase tended to increase the relative expression of IL-10 (p = 0.071) and decrease the relative expression of NF-κB (p = 0.068). The effects of SBM content on the relative expression of genes associated with the ileal inflammatory response of broilers at 21 d were mainly manifested in the following aspects: compared with 35.66% SBM, when the SBM content was reduced to 17.83% and 8.92%, both of them significantly reduced the relative expression of IL-8 in the ileum of broilers at 21 d (p < 0.01). Furthermore, compared to the 35.66% SBM, when the SBM content was reduced to 17.83%, the relative expression of NF-κB (p < 0.01) and TLR-4 (p < 0.05) in the ileum of broilers at 21 d was significantly reduced. It also had a relative tendency to reduce the relative expression of MyD88 (p = 0.078). When the SBM content was 35.66%, mannanase significantly reduced the relative expression of genes related to the ileal inflammatory response of broilers at 21 d, such as NF-κB and IL-1β, to alleviate intestinal inflammation. However, mannanase showed limited efficacy when SBM content was reduced to 17.83% and 8.92%.
Table 14. Effect of mannanase addition to diets with different SBM content on the relative expression of inflammatory response genes in the ileum of broilers at 21 d.
SBM content Mannanase IL-1β IL-6 IL-8 IL-10 IL-18 TNF-a MyD88 NF-kB TLR-4 35.66% SBM 0 mg/kg 1.000a 1.000 1.000 1.000 1.000a 1.000 1.000 1.000a 1.000 100 mg/kg 0.546b 0.302 0.658 1.274 0.547b 0.829 0.754 0.612bc 0.751 17.83% SBM 0 mg/kg 0.434b 0.709 0.385 0.617 0.414bc 0.867 0.685 0.575bc 0.612 100 mg/kg 0.436b 0.345 0.269 0.843 0.226c 0.809 0.520 0.330c 0.555 8.92% SBM 0 mg/kg 0.434b 0.734 0.337 0.690 0.295bc 0.912 0.941 0.541bc 0.885 100 mg/kg 0.768ab 0.647 0.426 1.141 0.579b 0.700 0.556 0.679b 0.575 SEM 0.052 0.076 0.055 0.088 0.054 0.062 0.053 0.051 0.048 Main effect mannanase 0 mg/kg 0.623 0.815a 0.574 0.769b 0.570 0.926 0.876a 0.705a 0.832a 100 mg/kg 0.583 0.431b 0.451 1.086a 0.451 0.779 0.610b 0.540b 0.627b SBM content 35.66% SBM 0.773 0.651 0.829a 1.137 0.774 0.914 0.877a 0.806a 0.876a 17.83% SBM 0.435 0.527 0.327b 0.730 0.320 0.838 0.603b 0.453b 0.584b 8.92% SBM 0.601 0.691 0.382b 0.915 0.437 0.806 0.749ab 0.610ab 0.730ab p-value Mannanase 0.650 0.010 0.173 0.071 0.159 0.258 0.009 0.068 0.023 SBM content 0.011 0.626 < 0.001 0.164 < 0.001 0.779 0.078 0.008 0.031 Mannanase × SBM 0.003 0.229 0.150 0.852 0.003 0.879 0.646 0.052 0.470 a, b, c The data in the same row with shoulder labels containing different letters indicate significant differences (p < 0.05). 16S rRNA sequencing of microorganisms in the ileum
Species screening and basic statistics
-
As is clear from Fig. 1b, the top five species in terms of relative abundance at the phylum level of microorganisms in ileal chyme of broiler chickens at 21 d in the 17.83% SBM group and the 17.83% SBM diet supplemented with 100 mg/kg mannanase were Firmicutes, Bacteroidetes, Proteobacteria, Tenericutes, and Actinobacteria. As is clear from Fig. 1c, the top 10 species in terms of relative abundance at the genus level were Lactobacillus, unclassified, Bacteroides, Barnesiella, Streptococcus, Faecalibacterium, Ruminococcus, Candidatus_Arthromitus, Campylobacter, and Oscillospira. The results of the Kruskal Wallis test showed that mannanase tended to decrease the relative abundance of Firmicutes at the phylum level (p = 0.064) and to increase the relative abundance of Ruminococcus at the genus level (p = 0.082) compared to the 17.83% SBM reduction group. As is clear from Fig. 1d, the number of species common to both groups was 52 in the 17.83% SBM group and the 17.83% SBM group supplemented with mannanase, with the number of species unique to the 17.83% SBM group being 134 and the number of species unique to the mannanase group being 183.
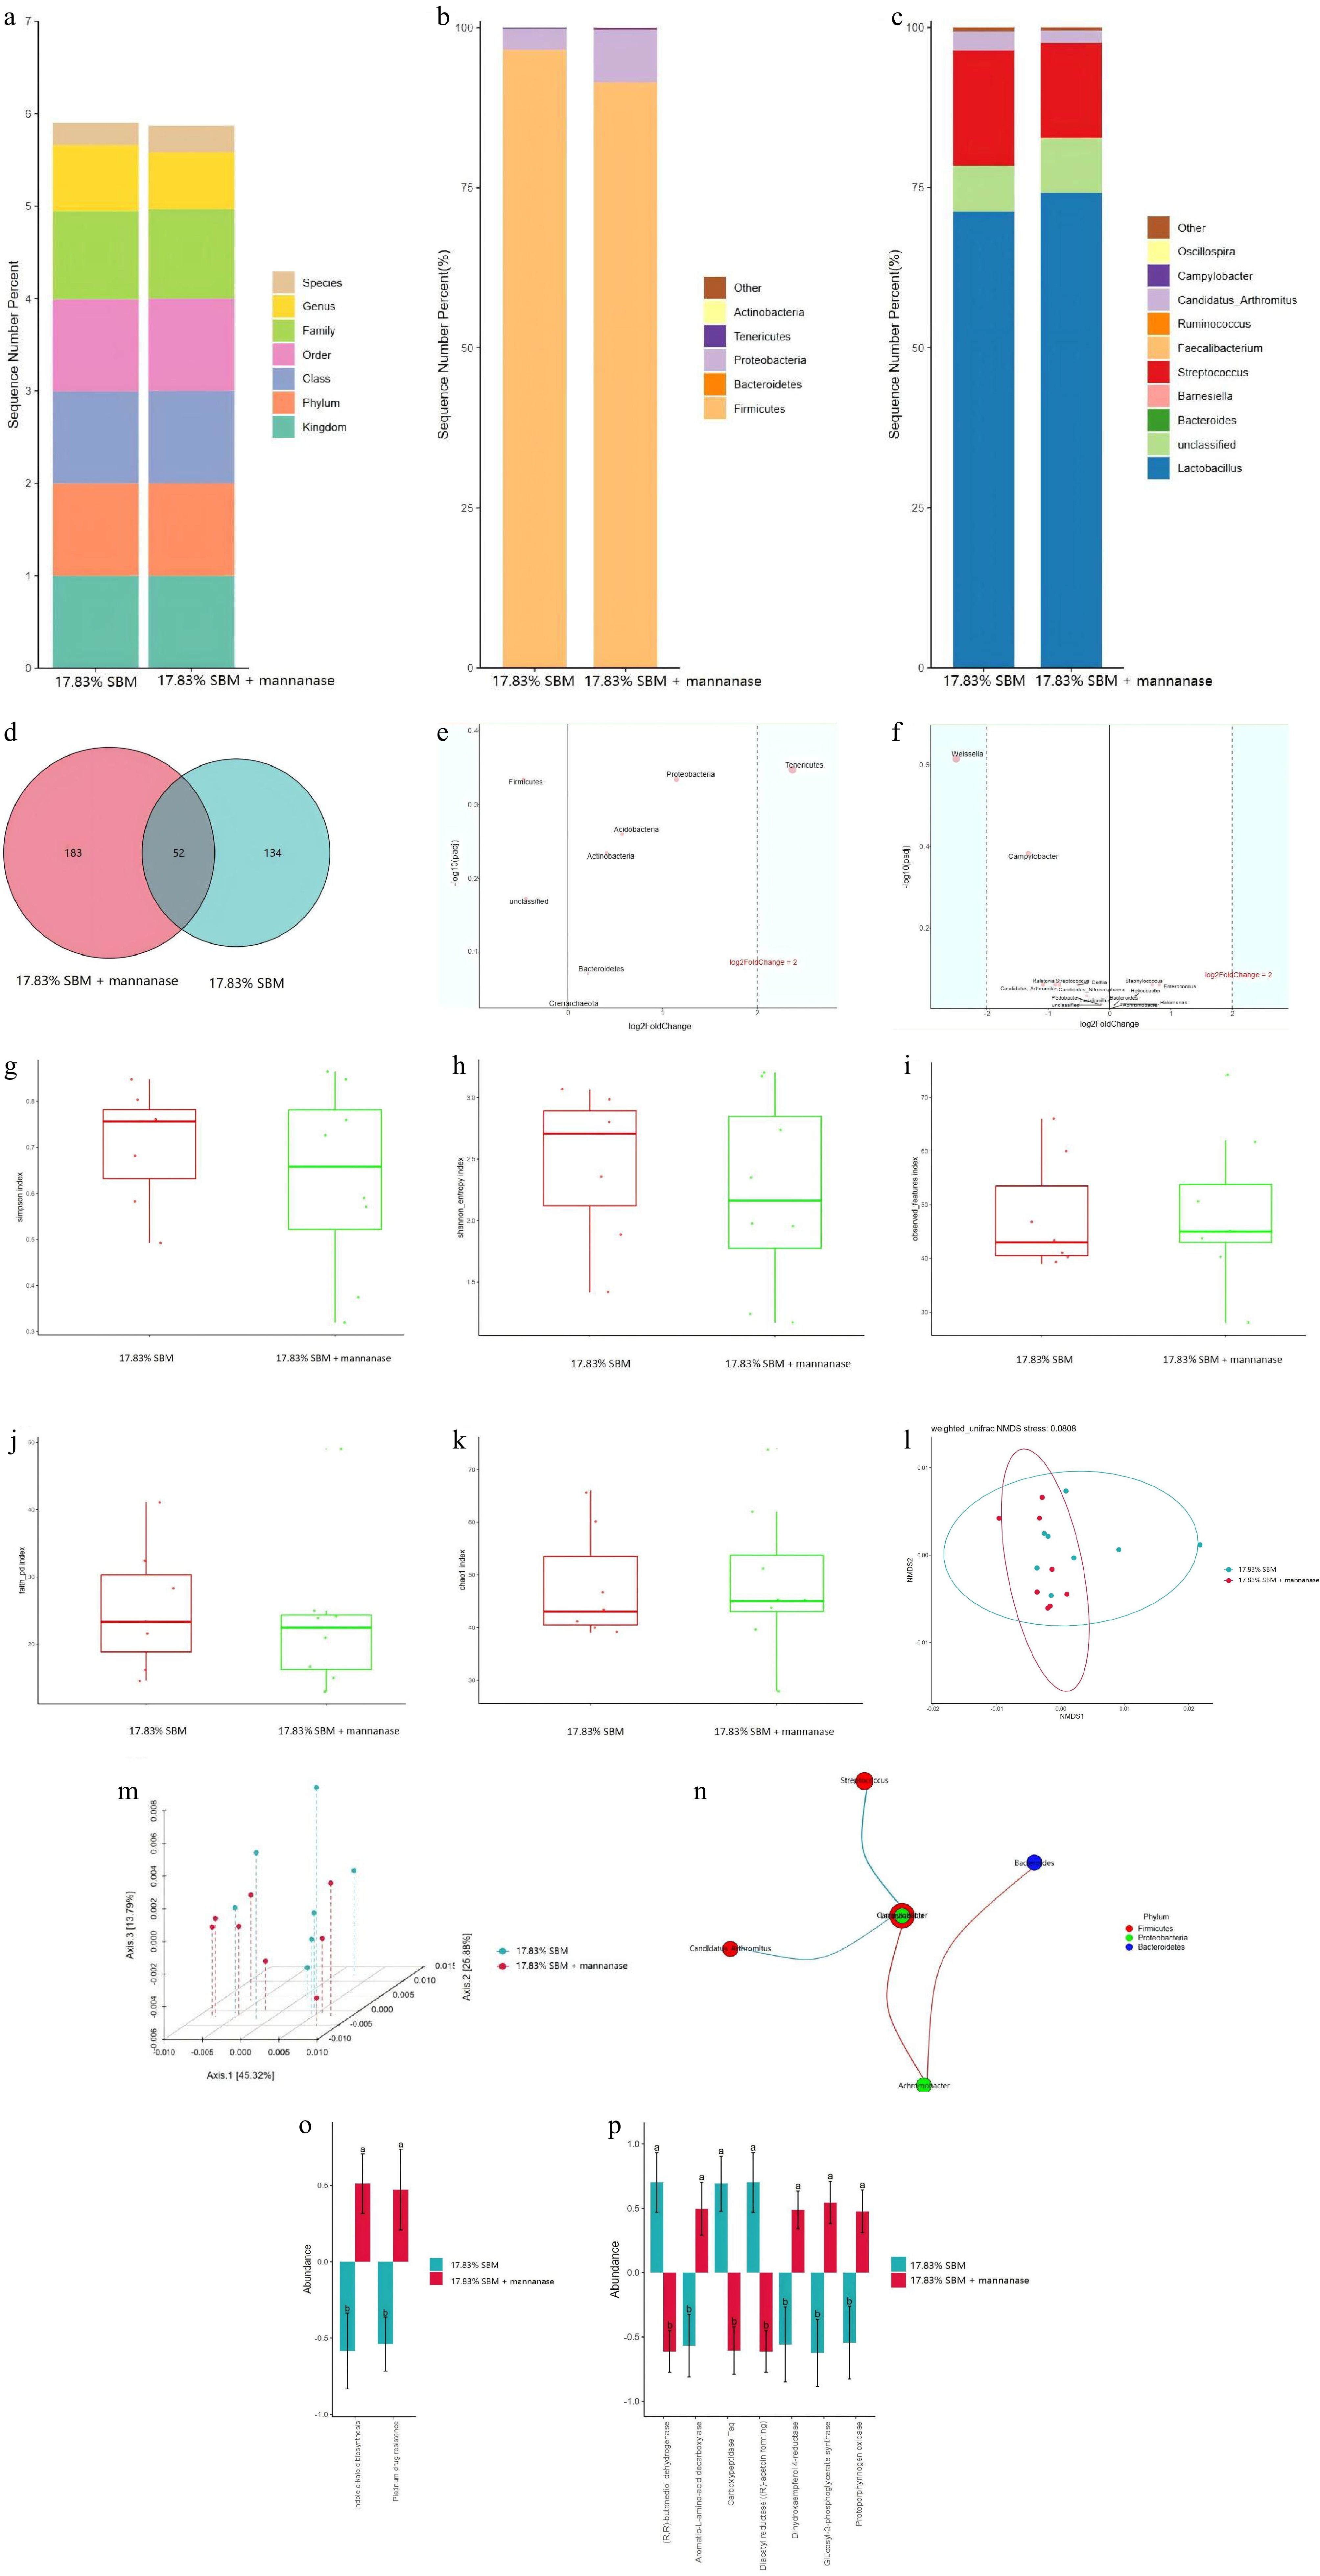
Figure 1.
Effect of mannanase addition to the diet with 17.83% SBM content on ileal microflora of broilers at 21 d. (a) In this study, the Greengenes database was used as the basis for species-level classification of ASVs using sklearn, followed by species screening to retain Bacteria and Archaea. The top 5 species in terms of relative abundance at the phylum level and the top 10 species in relative abundance at the genus level were analyzed in the form of (b), (c) bar charts; and (d) venn diagrams were used to represent the two groups of endemic and shared features. (e), (f) The relative abundance of differential ASVs at the phylum level and genus level of ileum was screened by volcano plots from DESeq2 analysis using 17.83% SBM group as control and 17.83% SBM + 100 mg/kg mannanase as the treatment group, respectively. (g)−(k) The alpha diversity was expressed as simpson’s index, shannon index, observed_features, faith_pd and Chao1, and the microorganisms were subjected to (l), (m) NMDS and PCoA based on weighted Unifrac distances to express the beta diversity, respectively. (n) The correlation coefficients of the features were calculated and the nodes with significantly correlated features were connected to plot the network graphs of the Spearman’s correlation analysis at the genus level. (o), (p) Based on the relative abundance and sequence of ASVs in the samples, PICRUSt2 was used to predict the macrogenomic results at the level of the KEGG-L3 and CAZymes, respectively, while the comparative analyses were performed to analyze the differences between the groups.
Statistically significant differences
-
As can be seen in Fig. 1e, the microorganism with a relative trend of difference between the two groups at the phylum level was Tenericutes (p = 0.056). As can be seen in Fig. 1f, the microorganism with a significant difference at the genus level was Weissella (p < 0.05) and the microorganism with a relative trend of difference was Campylobacter (p = 0.052). As is clear from Fig. 1g−k and Fig. 1l, m, the addition of mannanase to the 17.83% SBM group had no significant effect on the diversity of microorganisms in the ileum of broilers at 21 d. As can be seen in Fig. 1n, Lactobacillus showed a highly significant negative correlation with Streptococcus (p < 0.01) and significant negative correlation with Candidatus_Arthromitus (p < 0.05). Achromobacter was significantly positively correlated with Bacteroides and Campylobacter (p < 0.05).
Functional forecasting and variance analysis
-
As can be seen in Fig. 1o and p, the addition of mannanase to a diet with 17.83% SBM content significantly affected the microbial Indole alkaloid biosynthesis and Platinum drug resistance at the KEGG-L3 level, as corrected by Bonferroni. Specifically, compared to the 17.83% SBM group, mannanase promoted microbial Indole alkaloid biosynthesis and Platinum drug resistance. The analysis based on the CAZymes showed that mannanase could significantly affect the activities of enzymes associated with microbial metabolism and other pathways. Specifically, the addition of mannanase could highly significantly decrease the activities of (R,R)-butanediol dehydrogenase, Diacetyl reductase ((R)-acetoin forming), and Carboxypeptidase Taq, and significantly increase the activities of Aromatic-L-amino-acid decarboxylase and Protoporphyrinogen oxidase, among others.
16S rRNA sequencing of microorganisms in the cecum
Species screening and basic statistics
-
As is clear from Fig. 2b, the five microorganisms with the highest relative abundance at the phylum level in the cecal chyme of broiler chickens at 21 d in the 17.83% SBM group and the 17.83% SBM diet supplemented with 100 mg/kg mannanase were Firmicutes, Bacteroidetes, Proteobacteria, Tenericutes, and Actinobacteria. As is clear from Fig. 2c, the ten microorganisms with the highest relative abundance at the genus level were Lactobacillus, unclassified, Bacteroides, Barnesiella, Streptococcus, Faecalibacterium, Ruminococcus, Candidatus_Arthromitus, Campylobacter, and Oscillospira. The results of the Kruskal Wallis test showed that mannanase significantly reduced the relative abundance of Odoribacter, Bacteroides, and Lachnospiraceae_Clostridium in the cecal microbiota of broilers at 21 d compared to the 17.83% SBM group (p < 0.05), with a concomitant tendency to increase the relative abundance of Coprococcus (p = 0.074). As is clear from Fig. 2d, the number of species common to both groups was 490 in the 17.83% SBM group and the 17.83% SBM diet supplemented with mannanase, with the number of species unique to the 17.83% SBM group being 876 and the number of species unique to mannanase group being 851.
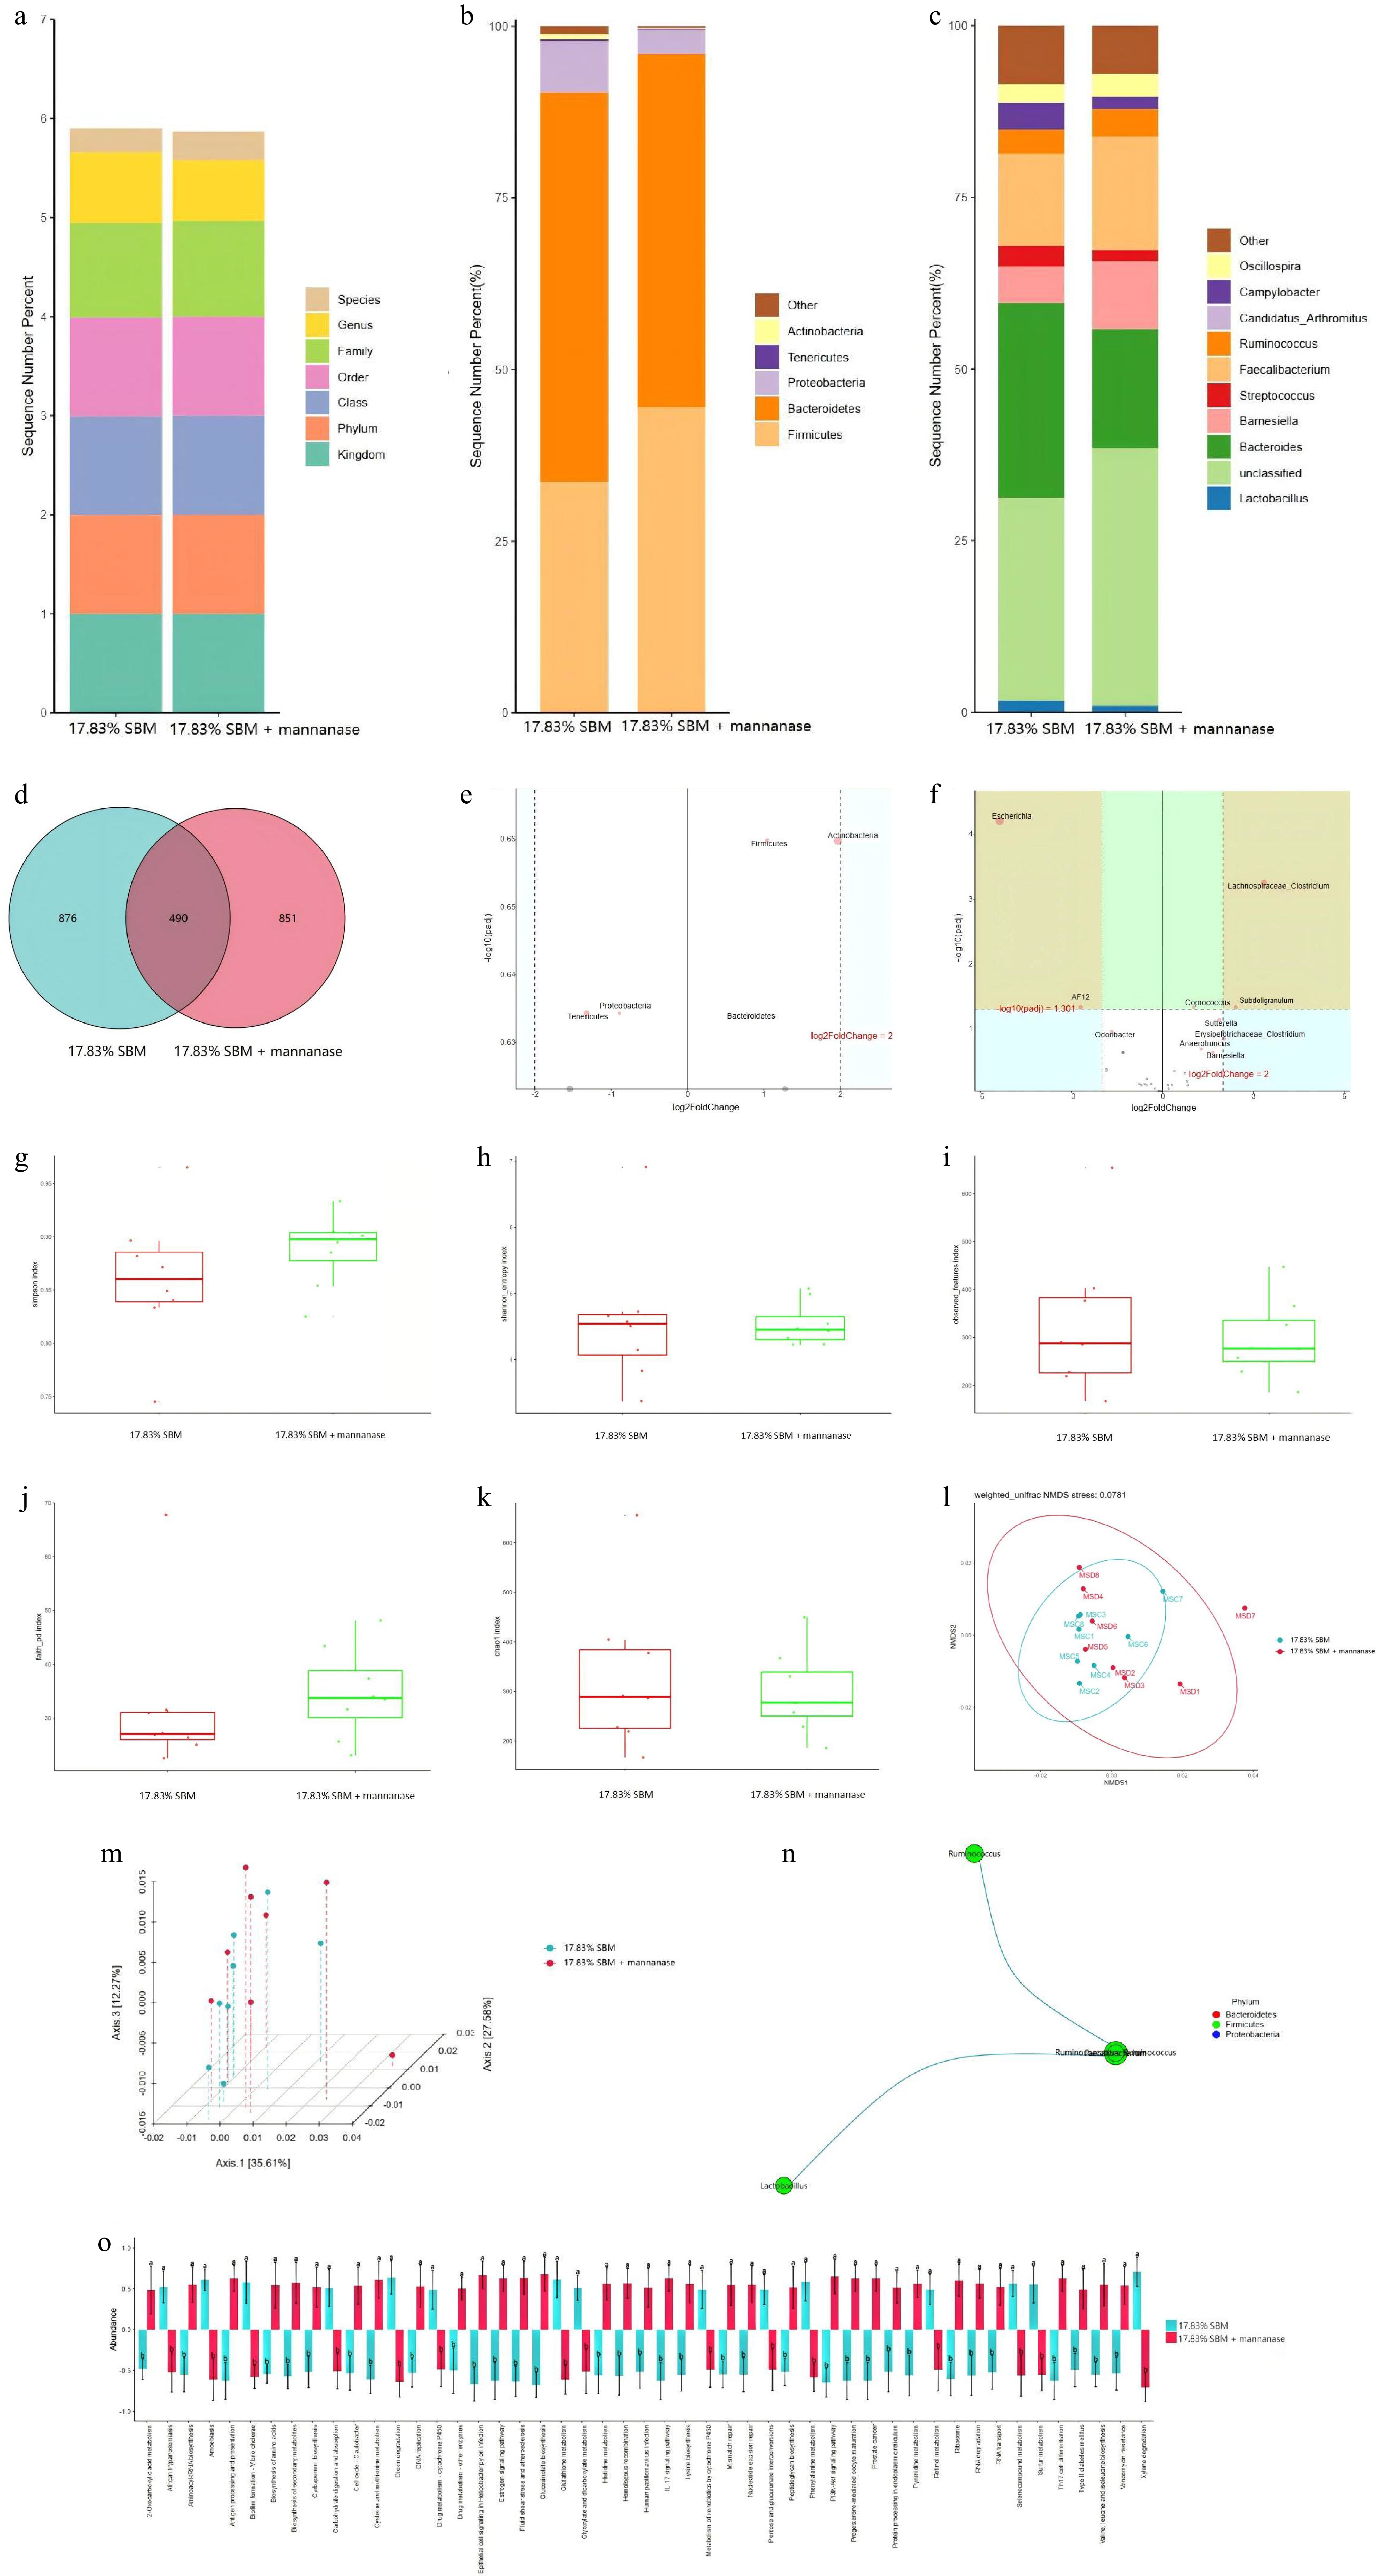
Figure 2.
Effect of mannanase addition to the diet with 17.83% SBM content on cecal microflora of broilers at 21 d. (a) In this study, the Greengenes database was used as the basis for species-level classification of ASVs using sklearn, followed by species screening to retain Bacteria and Archaea. (b), (c) The top five species in terms of relative abundance at the phylum level and the top 10 species in relative abundance at the genus level were analyzed in the form of bar charts; and (d) venn diagrams were used to represent the two groups of endemic and shared features. (e), (f) The relative abundance of differential ASVs at the phylum level and genus level of cecum was screened by volcano plots from DESeq2 analysis using 17.83% SBM group as control and 17.83% SBM + 100 mg/kg mannanase as the treatment group, respectively. (g) - (k) The alpha diversity was expressed as simpson’s index, shannon index, observed_features, faith_pd, and Chao1, and the microorganisms were subjected to (l), (m) NMDS and PCoA based on weighted Unifrac distances to express the beta diversity, respectively. (n) The correlation coefficients of the features were calculated and the nodes with significantly correlated features were connected to plot the network graphs of the Spearman’s correlation analysis at the genus level. (o) Based on the relative abundance and sequence of ASVs in the samples, PICRUSt2 was used to predict the macrogenomic results at the level of the KEGG-L3 and CAZymes, respectively, while the comparative analyses were performed to analyze the differences between the groups.
Statistically significant differences
-
As can be seen in Fig. 2e, the microorganism with a significant difference between the two groups at the phylum level was Firmicutes (p < 0.05), and the microorganism with a relative trend of difference was Actinobacteria (p = 0.063). As is clear from Fig. 2f, the microorganisms with a highly significant difference at the genus level were Escherichia, Lachnospiraceae_Clostridium, Coprococcu, and Subdoligranulum (p < 0.01), and the species with significant differences were Sutterella, Odoribacter, and Erysipelotrichaceae_Clostridium (p < 0.05). The microorganisms with relative trends of differences were Anaerotruncus (p = 0.060), Barnesiella (p = 0.083), Enterococcus (p = 0.090), and Clostridium (p = 0.077). As is evident in Fig. 2g−k and Fig. 2l, m, the addition of mannanase did not exert a significant influence on the microbial diversity in the cecum of broilers at 21 d. As can be seen in Fig. 2n, Faecalibacterium showed a significant negative correlation with Ruminococcaceae_Ruminococcus, and Lactobacillus showed a significant negative correlation with Ruminococcaceae_Ruminococcus (p < 0.05). In addition, the addition of mannanase to the diet with 17.83% SBM content also significantly reduced the relative abundance of Escherichia coli in the cecum of broilers.
Functional forecasting and variance analysis
-
As is clear from Fig. 2o, the addition of mannanase to the diet with 17.83% SBM content highly significantly affected the microbial PI3K-Akt signaling pathway, cysteine and methionine metabolism, and glutathione metabolism at the KEGG-L3 level, as corrected by Bonferroni (p < 0.01), and significantly affected the microbial cell cycle-Caulobacter, protein processing in the endoplasmic reticulum, histidine metabolism, lysine biosynthesis, carbapenem biosynthesis, and 2-Oxocarboxylic acid metabolism. Specifically, compared to the 17.83% SBM group, mannanase promoted the microbial 2-Oxocarboxylic acid metabolism and carbapenem biosynthesis. It also inhibited the glutathione metabolism and glyoxylate and dicarboxylate metabolism. The analysis based on the CAZymes showed that mannanase could significantly affect the activities of enzymes associated with microbial metabolism pathways in the cecum of broilers. Specifically, when the SBM content in the feed was reduced to 17.83%, the addition of mannanase could highly significantly reduce the activities of 2-deoxy-D-gluconate 3-dehydrogenase, increase the activities of glycerate dehydrogenase, and significantly decrease the activities of nitric oxide dioxygenase.
-
As the first line of host defense against pathogens, Toll-like receptors (TLRs) can recognize different pathogen-associated molecular patterns (PAMPs) and play key roles in inflammation and the regulation of immune cells. TLRs trigger a complex inflammatory response through both MyD88-dependent and MyD88-independent pathways, activating NF-κB, and promoting the expression of genes such as TNF-a, IL-1β, and IL-6[31]. During the onset of the inflammatory response, the activation of the TLR/NF-κB and JAK/STAT signaling pathways promotes the release of a variety of pro-inflammatory factors and stimulates immune cells to release additional cytokines[32]. Pro-inflammatory cytokines like IL-1β and TNF-a are particularly potent, inducing the production of many pro-inflammatory mediators and playing an important role in the development of the immune system[33−37]. IL-8 is a multifunctional cytokine that stimulates the proliferation of immune cells and is involved in inflammatory diseases[38]. In this study, when ME was reduced by 50 kcal/kg, the diet with 35.66% SBM content triggered an inflammatory response in broilers. In contrast, the addition of mannanase significantly reduced the relative expression of IL-1β and IL-18 in the ileum of broilers at 21 d, and it also tended to reduce the relative expression of NF-κB, alleviating the above adverse effects. In addition, the reduction of SBM content to 17.83% significantly reduced the relative expression of NF-κB, TLR-4, and IL-8, with a tendency to lower the relative expression of MyD88, compared with the 35.66% SBM group. As a surface component of several pathogens, mannan is the relatively most important ANF in SBM, which stimulates the immune system, triggers an inflammatory response, and causes energy depletion[9, 39−41]. Studies have shown that there is a reciprocal effect between mannanase and SBM content[42], showing that adding mannanase to diets reduces the incidence of inflammatory reactions[3], decreases immune stimulation[22], and improves the immune system of broilers[6]. The results mentioned above are in accordance with our findings and further suggest that mannanase alleviates the inflammatory response in broiler chickens by lowering the expression of the NF-κB and lessening the release of pro-inflammatory factors.
Activation of multiple inflammatory pathways and release of inflammatory mediators can affect intestinal barrier function, which will have an impact on the growth performance and intestinal health of broilers[43]. An intact intestinal barrier is mainly composed of a physical barrier, a biochemical barrier, and an immune barrier[44], of which tight junctions (TJs), as an important component of the intestinal barrier, are the determining factors affecting the intestinal barrier function of animals[45,46]. Occludin, claudin-1, and zonula occluden-1 (ZO-1) are the relatively most prominent TJs[47]. As a major component of mucins, MUC 2 is mainly produced by goblet cells. MUC 2 is an important component of the intestinal mucosal layer and plays an important role in separating the intestinal epithelium from microorganisms[48,49]. Mannanase has been shown to regulate intestinal barrier integrity by affecting the expression of TJs and other proteins in the broiler intestine[3]. In this experiment, adding mannanase significantly increased the relative expression of Claudin-1 in the jejunum at 21 d, significantly increased the relative expression of occludin and Claudin-1 in the ileum, and also had a tendency to increase the relative expression of ZO-1 in the ileum.
When the integrity of the intestinal barrier is impaired, pathogenic microorganisms and toxins can pass through the intestinal epithelium, which may cause a systemic inflammatory response[50−52]. Serum DAO[53], D-LA, and ET[54] are important indicators for evaluating mucosal integrity and intestinal barrier function in broilers. In this study, reducing the ME by 50 kcal/kg in a diet containing 35.66% SBM led to increased levels of D-LA in serum and disruption of intestinal epithelial barrier in broilers at 21 d. Mannanase alleviated the increased intestinal permeability due to lower energy levels and maintained the intestinal barrier function by reducing the levels of DAO and ET. In addition, there was a reciprocal effect between mannanase and SBM content. The diets were formulated with DCP and CGM instead of SBM. When SBM content in the diet was reduced to 17.83%, adding mannanase still tended to reduce serum D-LA in broilers at 21 d. The reduction of serum DAO, D-LA, and ET levels in broilers further demonstrated that mannanase could improve intestinal barrier function and maintain barrier integrity.
There is a close relationship between intestinal morphology and immune regulation. The function of the intestinal barrier and absorption function can be visualized by the microscopic structure of intestinal morphology[55]. The intestinal VH, CD, and V:C are important for measuring the morphological and structural integrity, as well as the functional status of the intestinal mucosa. Mannanase improves intestinal epithelial morphology in broilers by increasing intestinal VH and V:C[19], and decreasing CD[56]. Consistent with our findings, the diet containing 35.66% SBM significantly reduced ileal VH and V:C and disrupted the villus structure in broilers at 21 d when dietary ME was reduced by 50 kcal/kg. In addition, there was an interaction between mannanase and SBM content on the morphology of ileum epithelium at 21 d. When SBM content was reduced to 17.83%, mannanase still improved ileal morphology and alleviated intestinal damage in broilers by increasing the VH and V:C.
The immune system interacts with intestinal microorganisms to maintain homeostasis of the host’s internal environment and regulate intestinal health[57−60]. Gut microbiota composition is an important indicator for evaluating gut health, playing a key role in maintaining gut integrity, energy metabolism, and immune function[61,62]. The diversity of the intestinal flora maintains the stability of the internal environment against the invasion of pathogenic microorganisms[63]. In this study, there was no significant effect of mannanase on the gut microbiota diversity of broilers at 21 d. It has been shown that mannanase can regulate intestinal flora structure by promoting the multiplication of beneficial bacteria like Lactobacilli[19], reducing the number of intestinal Escherichia coli[7, 18], and Salmonella[64, 30]. At the same time, it also can enhance barrier functions and ultimately improve the intestinal health of broilers. Ruminococcus is an anaerobic Gram-positive bacterium related to the class Clostridia[65], which degrades polysaccharides, provides nutrients for the host[66], and is strongly implicated in the development of several diseases[67−69]. Escherichia coli is a gram-negative bacterium that can act as a pathogen causing intestinal diseases[70,71]. In this study, in terms of relative abundance of microorganisms, adding mannanase to the diet with 17.85% SBM content tended to decrease the relative abundance of Firmicutes and increase Ruminococcus in the ileum of broilers at 21 d. In addition, mannanase also significantly reduced Lachnospiraceae_Clostridium and Escherichia coli in the cecum of broilers at 21 d. In summary, when SBM content was 17.83%, adding mannanase improved intestinal health by regulating the intestinal flora structure.
A reciprocal relationship between mannanase and substrate type on the viscosity of chyme has been reported. Adding mannanase to poultry feed reduces intestinal chyme viscosity, while higher levels of mannan in diets lead to increased chyme viscosity[14, 16]. In the present study, we observed that the addition of mannanase to the diets highly significantly decreased the viscosity of the jejunal chyme in broilers at 21 d, and the chyme viscosity decreased with the decrease in SBM content. Specifically, compared to the 35.66% SBM group, when the SBM content was reduced to 17.83% and 8.92%, the chyme viscosity of broilers at 21 d was also significantly reduced. In addition, there was a reciprocal effect between mannanase and SBM content on the chyme viscosity of the jejunum at 42 d. The effect of mannanase was significant when the SBM content was 35.66%. The addition of mannanase to poultry feed has been reported to promote nutrient absorption, increase nutrient digestibility[8, 11, 22, 29], and improve the nutritive value of soybean meal-based diets[15]. Consistent with our results, adding mannanase to the low-energy diet significantly increased the ATTD of CP and AA such as Lys, Ile, and Ala in broilers at 21 d.
Energy is an important component of poultry feed and plays a central role in poultry nutrition. Compared to ME, NE expresses energy loss in the form of calories which provides a more accurate assessment of energy utilization by broilers[72]. Studies have shown that adding mannanase to diets improves energy utilization efficiency[7, 16] by increasing AMEn[10] and decreasing Nexc[22, 73]. However, studies by respiratory calorimetry to determine the effect of mannanase on N balance and energy metabolism in broilers have not been reported. In this study, we found that adding mannanase to the diets affected N balance by decreasing VO2 and VCO2 and increasing TRN in broiler chickens at 21 d. There was a reciprocal effect of mannanase and SBM content on TRN in broilers at 21 d. In addition, we also observed that mannanase supplementation significantly reduced HP and HI in broilers at 21 d, and increased the NE value of feed and NE:AME. There was a significant reciprocal effect of mannanase and SBM content on the REpro in broilers at 21 d. When SBM content was reduced to 17.83%, it significantly reduced the REpro and increased REfat in broilers at 21 d, affecting energy metabolism.
The reduction in feed energy levels and the changes in SBM content affect the growth performance of poultry[39]. Mannanase may ameliorate the decline in the growth performance of broilers due to energy deficiency by reducing FCR and increasing BW and ADG[39], and these results are consistent with our findings. Additionally, it has been shown that there is a reciprocal effect between mannanase and the type of substrate on the growth performance of broilers[18, 74] and that the action of mannanase is mainly dependent on the type of substrate and the amount of NSP contained in the feed[75]. In this study, we observed that a 50 kcal/kg reduction in ME led to decreased growth performance in broilers as SBM content was lowered. However, the addition of mannanase mitigated the above harmful effects by increasing BW and ADG of broilers at 21 d and decreasing FCR. Moreover, there was a significant reciprocal effect of mannanase and SBM content on the growth performance of broilers from 0 to 21 d of age. When the SBM content was reduced to 17.83%, the addition of mannanase still significantly improved growth performance of broilers from 0 to 21 d of age. The improved growth performance of broilers in this study also provides further evidence that mannanase can mitigate the negative effects due to lower levels of energy and the mannan content of SBM by improving intestinal barrier function and flora structure. Our findings demonstrate that mannanase supplementation enhances broiler growth performance and intestinal health, particularly in diets containing 35.66% and 17.83% SBM.
-
Adding mannanase to a low-energy diet can improve the intestinal health of broilers by enhancing intestinal barrier function, balancing intestinal flora structure, maintaining intestinal integrity, and alleviating intestinal inflammatory responses. Mannanase also increases nutrient digestibility and regulates energy metabolism by reducing HI, increasing the NE value of the feed, and NE:AME to improve broilers’ growth performance. Additionally, there was a reciprocal effect between mannanase and SBM content. Under conditions where the ME of diets was reduced by 50 kcal/kg, mannanase still exerted the above beneficial effects when the SBM content was reduced to 17.83%.
This work was supported by Shenyang Governmental Science and Technology Program (Project No. 22-316-2-02) and China Agriculture Research System Program (Project No. CARS-41-G04).
-
All procedures were reviewed and preapproved by the Beijing Experimental Animal Management Regulations and the Experimental Animal Welfare and Animal Experimentation Ethics Review Committee of China Agricultural University, identification number: AW22503202-1-2, approval date: 22/05/2023. The research followed the 'Replacement, Reduction, and Refinement' principles to minimize harm to animals. This article provides details on the housing conditions, care, and pain management for the animals, ensuring that the impact on the animals is minimized during the experiment.
-
The authors confirm contribution to the paper as follows: conceptualization, data curation, methodology, and writing - draft manuscript preparation: Zhang X; software and resources: Wang B; essential equipment and materials: Ban Z; funding acquisition: Wang M, Wang Y, Wang X; writing - review & editing: Guo Y. All authors reviewed the results and approved the final version of the manuscript.
-
All data generated or analyzed during this study are included in this published article.
-
The authors declare that they have no conflict of interest.
- Copyright: © 2025 by the author(s). Published by Maximum Academic Press on behalf of Nanjing Agricultural University. This article is an open access article distributed under Creative Commons Attribution License (CC BY 4.0), visit https://creativecommons.org/licenses/by/4.0/.
-
About this article
Cite this article
Zhang X, Wang B, Ban Z, Wang M, Wang Y, et al. 2025. Impact of mannanase on broiler performance, intestinal health, and energy utilization with varying soybean meal levels. Animal Advances 2: e012 doi: 10.48130/animadv-0025-0009 

Impact of mannanase on broiler performance, intestinal health, and energy utilization with varying soybean meal levels
- Received: 14 January 2025
- Revised: 10 February 2025
- Accepted: 19 February 2025
- Published online: 07 May 2025
Abstract: Mannanase specifically degrades mannan, increases the efficiency of energy utilization, and improves intestinal health in broilers. The interaction effects between mannanase and soybean meal (SBM) have not been extensively explored. Therefore, the present study aimed to determine effects of adding mannanase to diets with different SBM content on broilers, and to explore interaction effects between mannanase and SBM. This study was conducted on Arbor Acres broilers. Under low-energy conditions (metabolizable energy reduced by 50 kcal/kg), a 3 × 2 factorial design was used with three SBM content diets (control group, 50%, or 25% of the SBM content of control) and with two levels of mannanase (0 or 100 mg/kg) respectively. In experiment 1, growth performance and intestinal health were determined. Experiment 2 measured energy metabolism in broilers by respiratory calorimetry, while feces were collected to determine nutrient digestibility. Results indicated that low SBM diets supplemented with degossypolled cottonseed protein and corn gluten meal significantly reduced broiler growth performance during d 0−42. However, mannanase supplementation in diets containing 35.66% and 17.83% SBM significantly improved growth performance from d 0 to 21, reduced respiratory quotient at 21 d, and improved intestinal health (p < 0.05). In the 35.66% SBM diet, mannanase also enhanced energy metabolism by improving nitrogen retention and protein energy utilization (p < 0.05). However, mannanase showed limited efficacy when SBM content was reduced to 8.92%. Microbiological analyses showed that mannanase significantly reduced Escherichia coli and promoted 2-Oxocarboxylic acid metabolism in cecal microbes. In conclusion, there was a reciprocal relationship between mannanase and SBM content, with mannanase still exerting the above beneficial effects at the SBM level of 17.83%.
-
Key words:
- Mannanase /
- Soybean meal /
- Intestinal health /
- Net energy /
- Broilers