-

Figure 1.
Location of accessions in the studied area (scale 1:500 m).
-
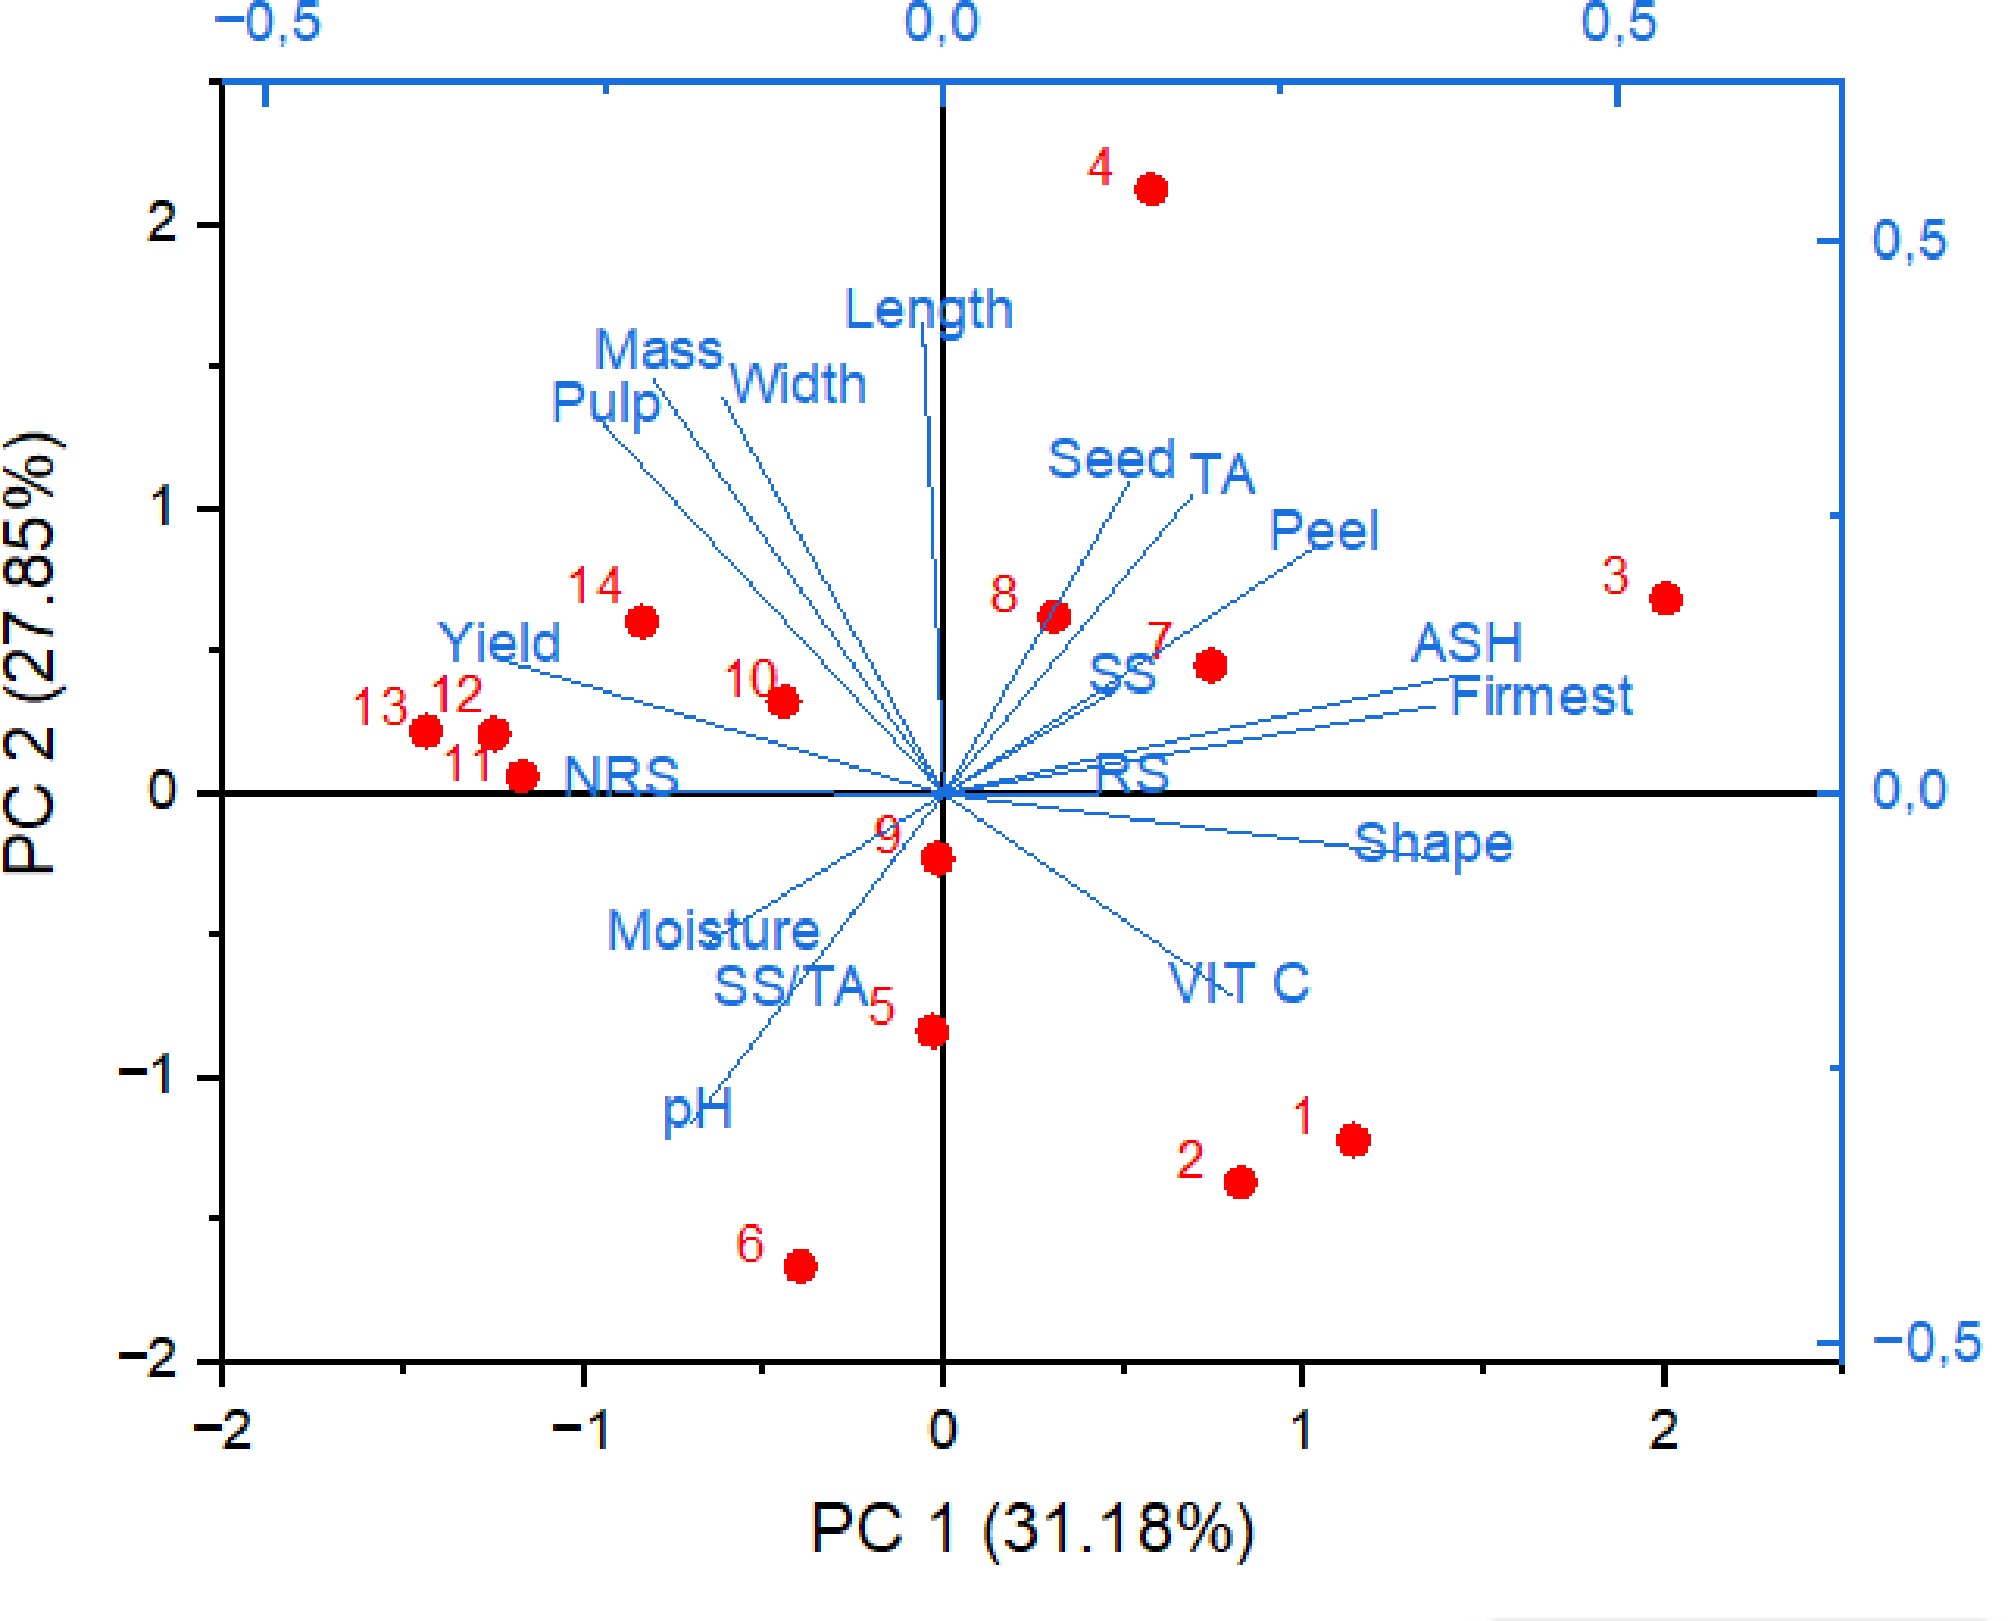
Figure 2.
Principal component analysis (PCA) of the evaluated quality attributes of umbu accessions. Red points represent the different accessions, projected onto the first two principal components (PC1 and PC2). The blue vectors correspond to the quality attributes of the accessions that contribute to the formation of the principal components.
-
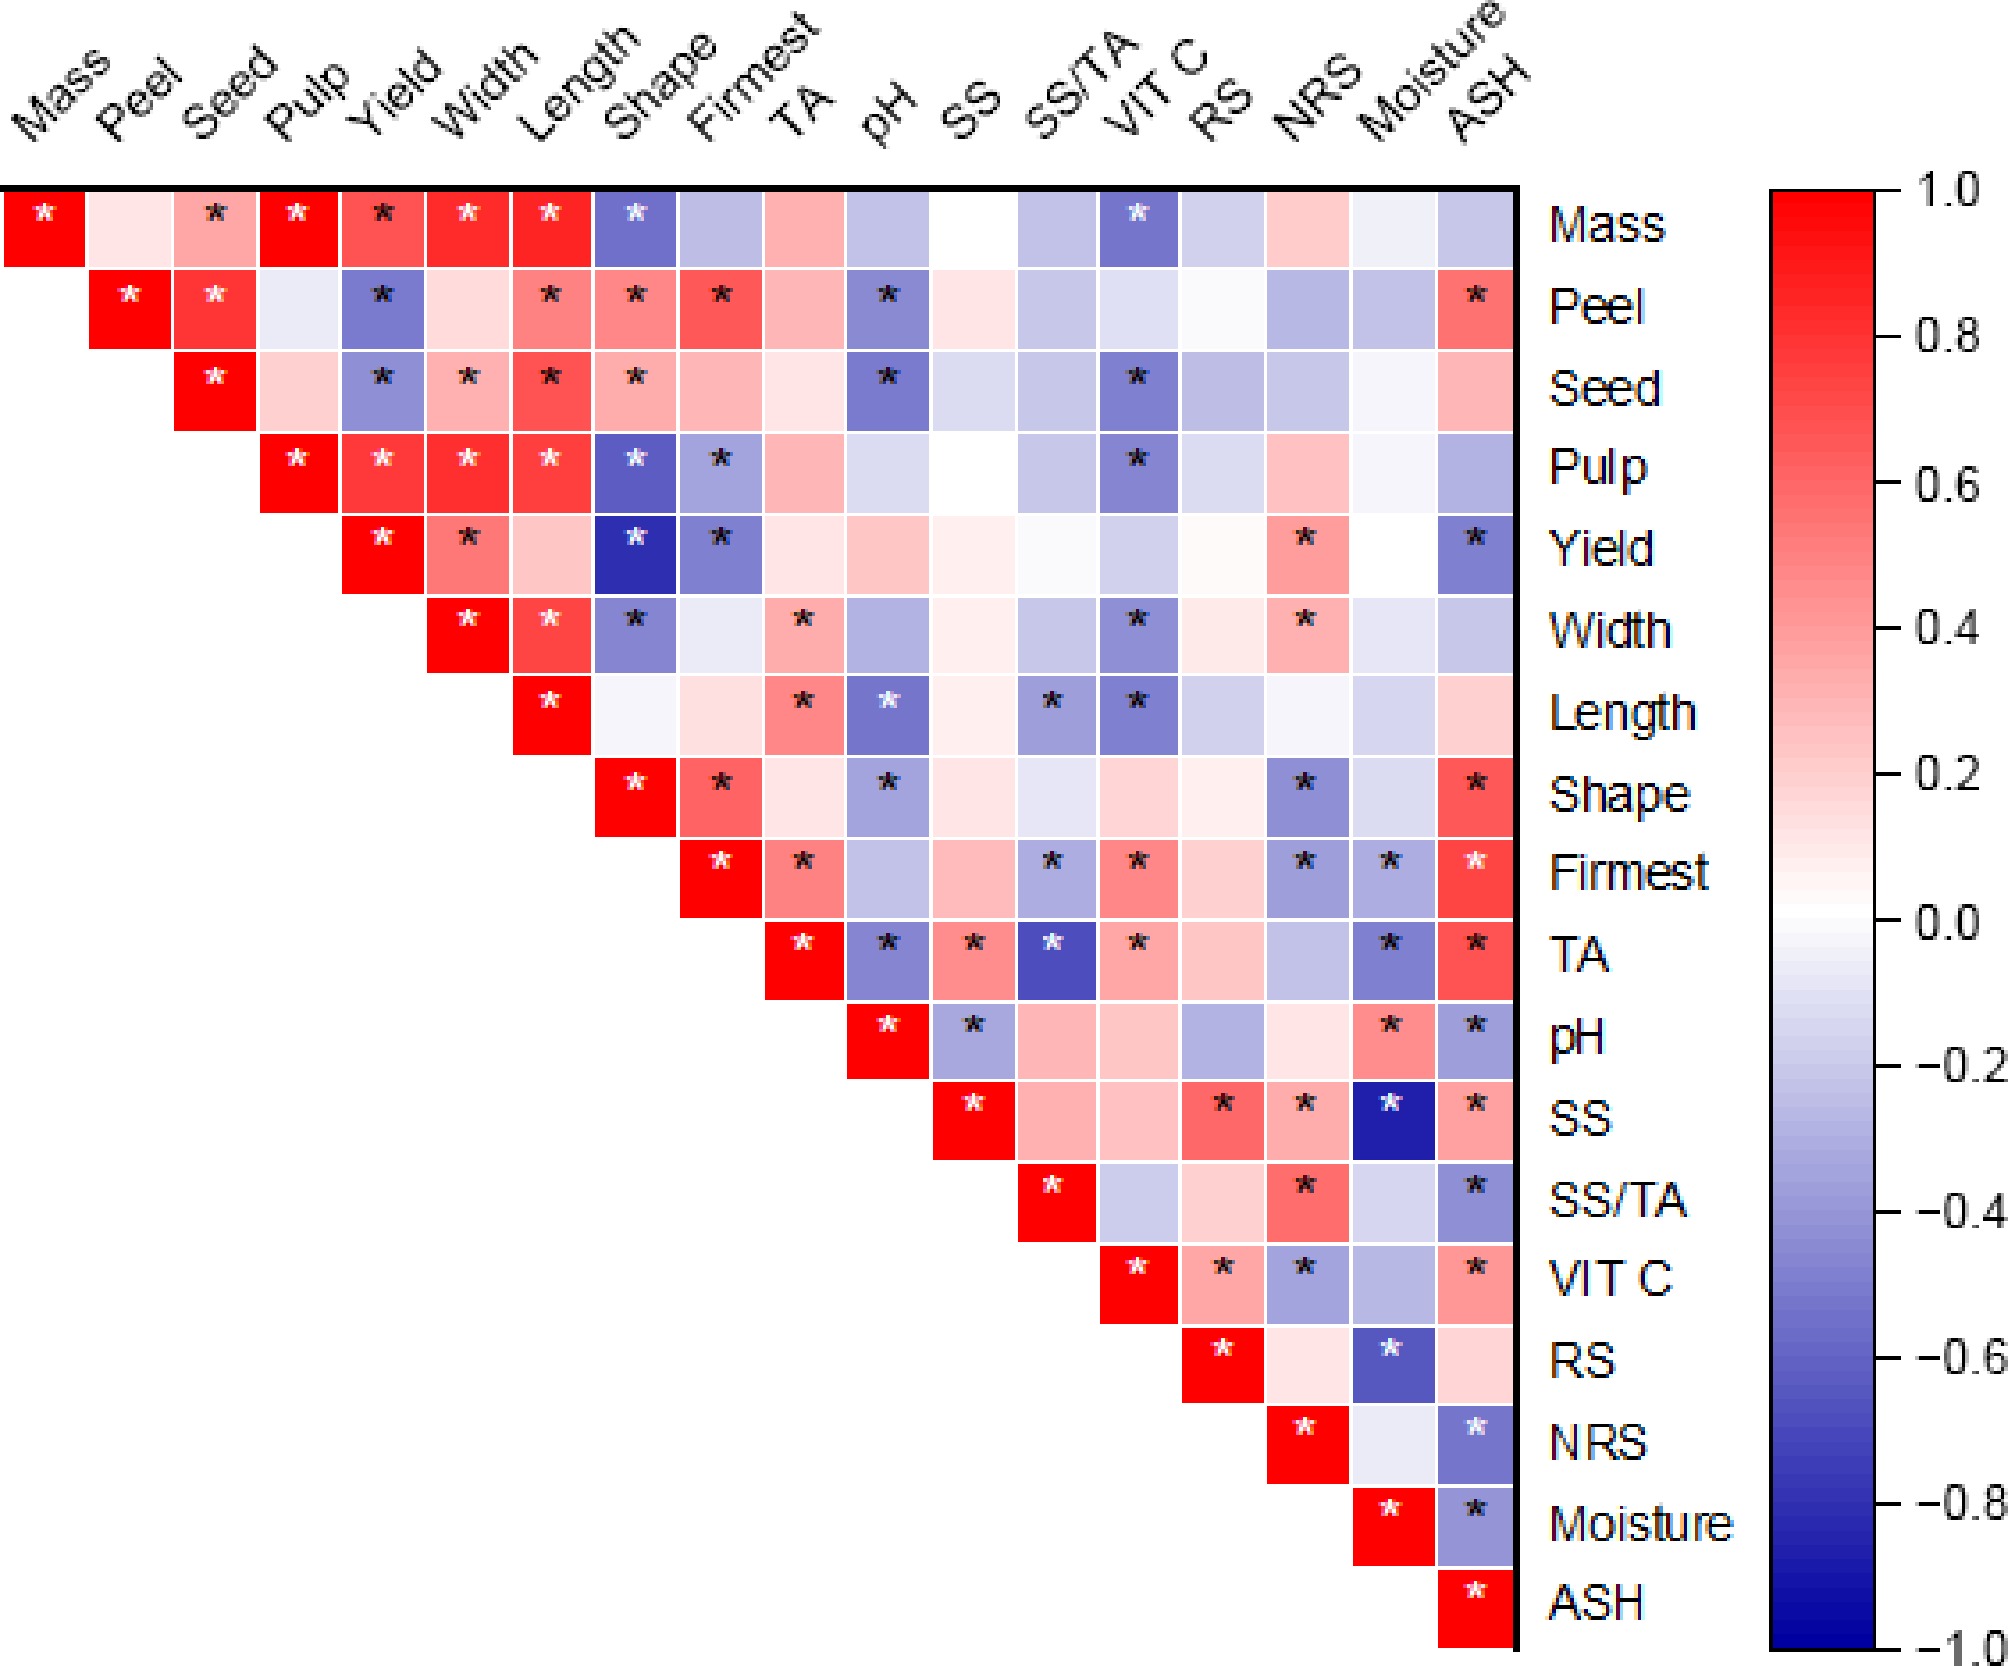
Figure 3.
Pearson correlation analysis of quality attributes across umbu accessions. * p ≤ 0.05.
-
Accessions Mass Peel Seed Pulp Yield 1 13.21f 16.59b 9.83d 73.25c 89.85b 2 12.87f 13.85c 11.54c 74.58c 88.43b 3 16.61e 20.06a 15.75a 64.86d 84.92c 4 24.42a 10.28d 8.30e 81.36a 91.64a 5 16.46e 13.19c 9.53d 77.74b 90.94a 6 13.81f 13.88c 10.88c 75.15c 89.04b 7 18.30d 11.87d 7.07e 80.94a 92.82a 8 24.00a 10.33d 8.49e 80.62a 90.96a 9 15.58e 9.84d 7.68e 82.17a 92.01a 10 19.54c 10.15d 8.74e 80.73a 90.88a 11 21.60b 10.52d 10.98c 77.93b 88.45b 12 21.74b 10.76d 9.63d 79.34b 90.10b 13 24.51a 9.87d 8.07e 81.80a 91.68a 14 18.75d 11.12d 14.02b 73.65c 84.77c Average 18.67 12.31 10.04 77.44 89.75 CV (%) 4.81 9.25 5.70 1.78 1.03 p-value < 0.0001 < 0.0001 < 0.0001 < 0.0001 < 0.0001 Mass (g), peel (%), seed (%), pulp (%), yield (% peel + % pulp). CV (%): coefficient of variation. Averages in the same column with distinct letters differ from each other by the Scott–Knott test with p < 0.001. Table 1.
Physical characteristics of umbu accessions.
-
Accessions Length Width Shape Firmest 1 2.63e 2.51f 1.04c 30.10b 2 2.79d 2.34g 1.19a 23.13c 3 3.21b 2.66e 1.21a 29.91b 4 3.50a 3.32a 1.05c 30.27b 5 2.83d 2.65e 1.07c 25.10c 6 2.61e 2.57f 1.01d 20.23d 7 3.11c 2.73e 1.14b 28.69b 8 3.21b 3.14b 1.02d 27.43b 9 2.80d 2.58f 1.08c 24.55c 10 3.19b 2.85d 1.12b 30.51b 11 3.25b 2.97c 1.09c 25.26c 12 3.03c 3.01c 1.00d 35.36a 13 3.54a 3.04c 1.16b 25.13c 14 3.03c 2.81d 1.07c 31.22b Average 3.05 2.80 1.09 27.64 CV (%) 2.30 1.93 1.99 7.22 p-value < 0.0001 < 0.0001 < 0.0001 < 0.0001 Length (cm), width (cm), firmest (N). CV (%): coefficient of variation. Averages in the same column with distinct letters differ from each other by the Scott–Knott test with p < 0.001. Table 2.
Physical dimensions and firmness of umbu accessions.
-
Accessions TA pH SS SS/TA 1 1.28c 2.45a 9.03c 7.03c 2 1.08d 2.36a 8.00d 7.34c 3 1.08d 2.22b 8.00d 7.45c 4 1.72a 2.29b 9.00c 5.22d 5 0.99e 2.45a 8.13d 8.19b 6 0.86f 2.46a 8.00d 9.23a 7 1.43b 2.30b 12.93a 9.03a 8 1.26c 2.20b 10.00b 7.90c 9 0.99e 2.38a 9.16c 9.23a 10 1.14d 2.26b 9.03c 7.90c 11 0.86f 2.37a 8.36d 9.73a 12 1.00e 2.41a 9.36c 9.36a 13 0.90f 2.42a 6.60f 7.34c 14 1.33c 2.37a 7.56e 5.67d Average 1.14 2.35 8.80 7.90 CV (%) 4.99 2.37 2.31 5.74 p-value < 0.0001 < 0.0001 < 0.0001 < 0.0001 TA: titratable acidity (g of citric acid 100 g−1), SS: soluble solids (°Brix). CV (%): coefficient of variation. Averages in the same column with distinct letters differ from each other by the Scott–Knott test with p < 0.001. Table 3.
Physicochemical characteristics of umbu accessions.
-
Accessions Vit C RS NRS Moisture Ash 1 50.06a 3.31c 1.40d 89.27b 0.42a 2 36.97b 2.65d 1.31d 91.14a 0.38b 3 25.30e 2.68d 1.32d 89.79b 0.46a 4 36.99b 2.90d 1.71c 89.22b 0.43a 5 35.04c 3.44c 2.21b 90.80a 0.32c 6 37.69b 3.06c 2.68a 90.77a 0.26d 7 34.07c 3.76b 2.70a 85.57d 0.43a 8 32.88c 4.52a 2.03c 87.57c 0.35b 9 37.74b 3.11c 1.37d 88.09c 0.33c 10 31.97c 3.26c 2.62a 89.63b 0.28d 11 21.87e 2.71d 2.68a 91.00a 0.26d 12 25.08e 2.75d 3.07a 90.10b 0.25d 13 22.65e 2.57d 1.94c 91.17a 0.21d 14 28.99d 2.38d 1.68c 91.21a 0.35b Média 32.66 3.08 2.05 89.66 0.34 CV (%) 6.20 9.19 11.61 0.50 9.99 p-value < 0.0001 < 0.0001 < 0.0001 < 0.0001 < 0.0001 Vit C: vitamin C (mg of ascorbic acid 100 g−1), RS: reducing sugars (%), NRS: non-reducing sugars (%), Moisture (%), Ash (%). CV (%): coefficient of variation. Averages in the same column with distinct letters differ from each other by the Scott–Knott test with p < 0.001. Table 4.
Physicochemical composition of umbu accessions.
Figures
(3)
Tables
(4)