-
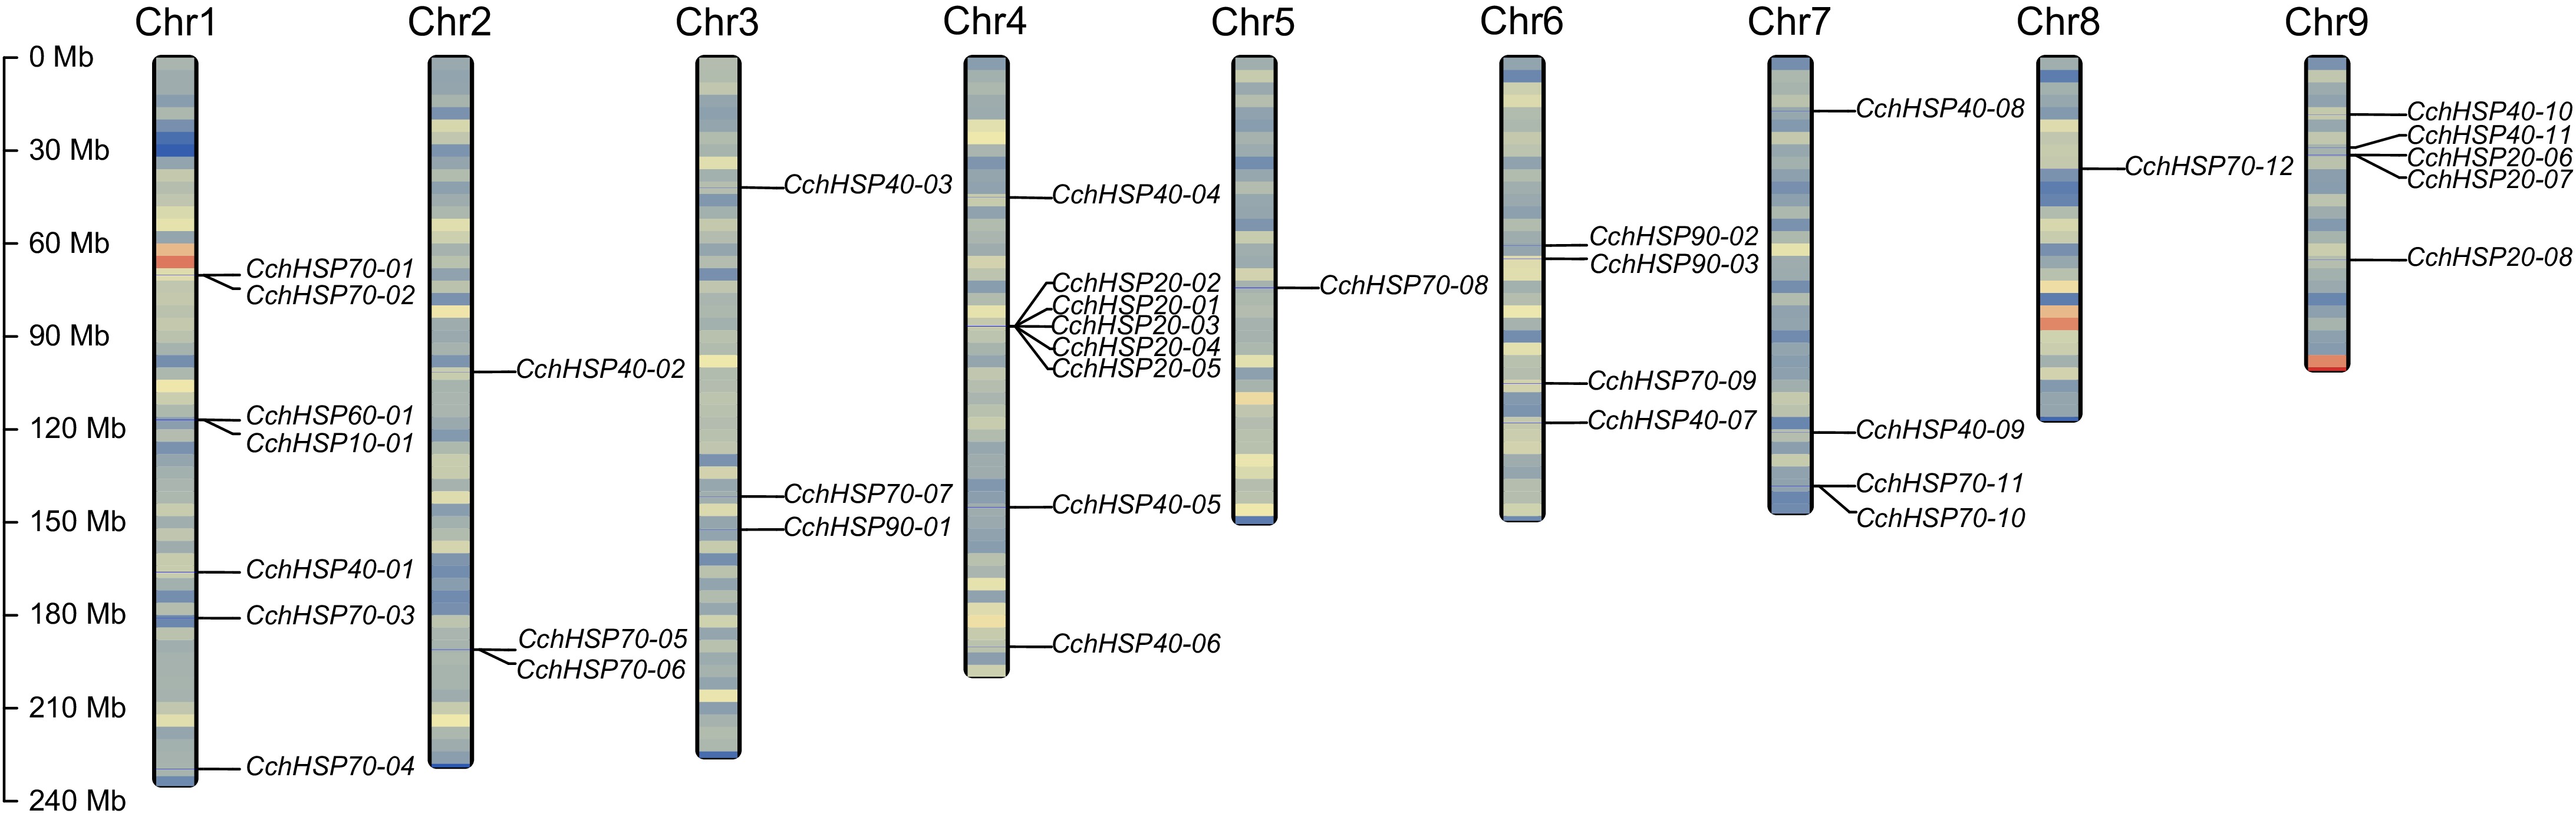
Figure 1.
The chromosomal locations of the identified CchHSPs. The chromosome gene density is expressed by the gradient color of blue-red from low to high.
-
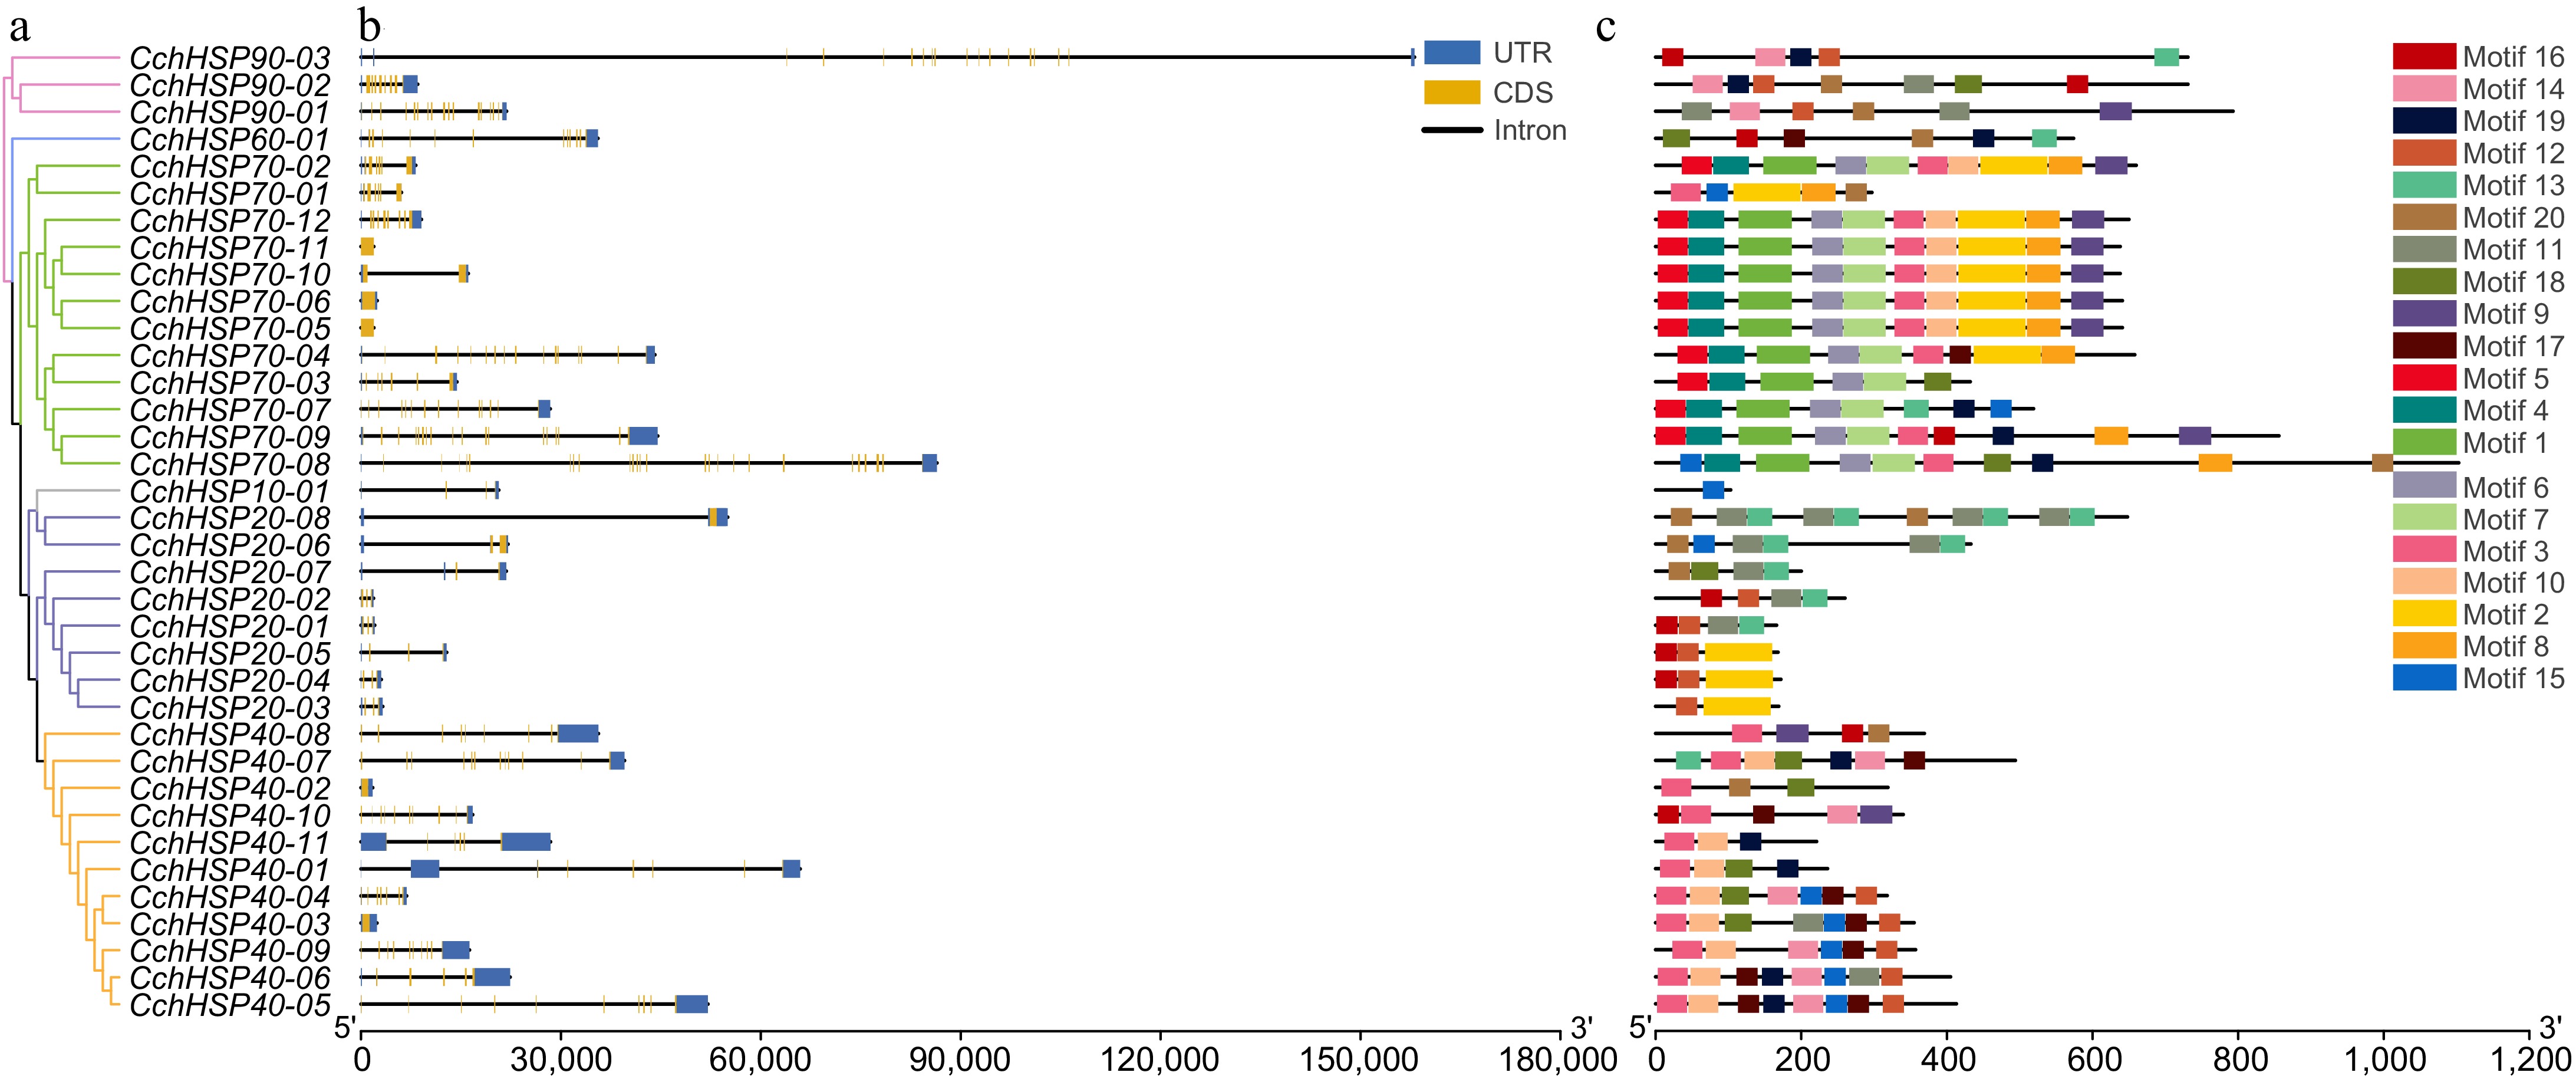
Figure 2.
(a) Phylogenetic relationships of the CchHSPs. (b) Gene structures of the CchHSPs. (c) Conserved motifs of the CchHSPs.
-
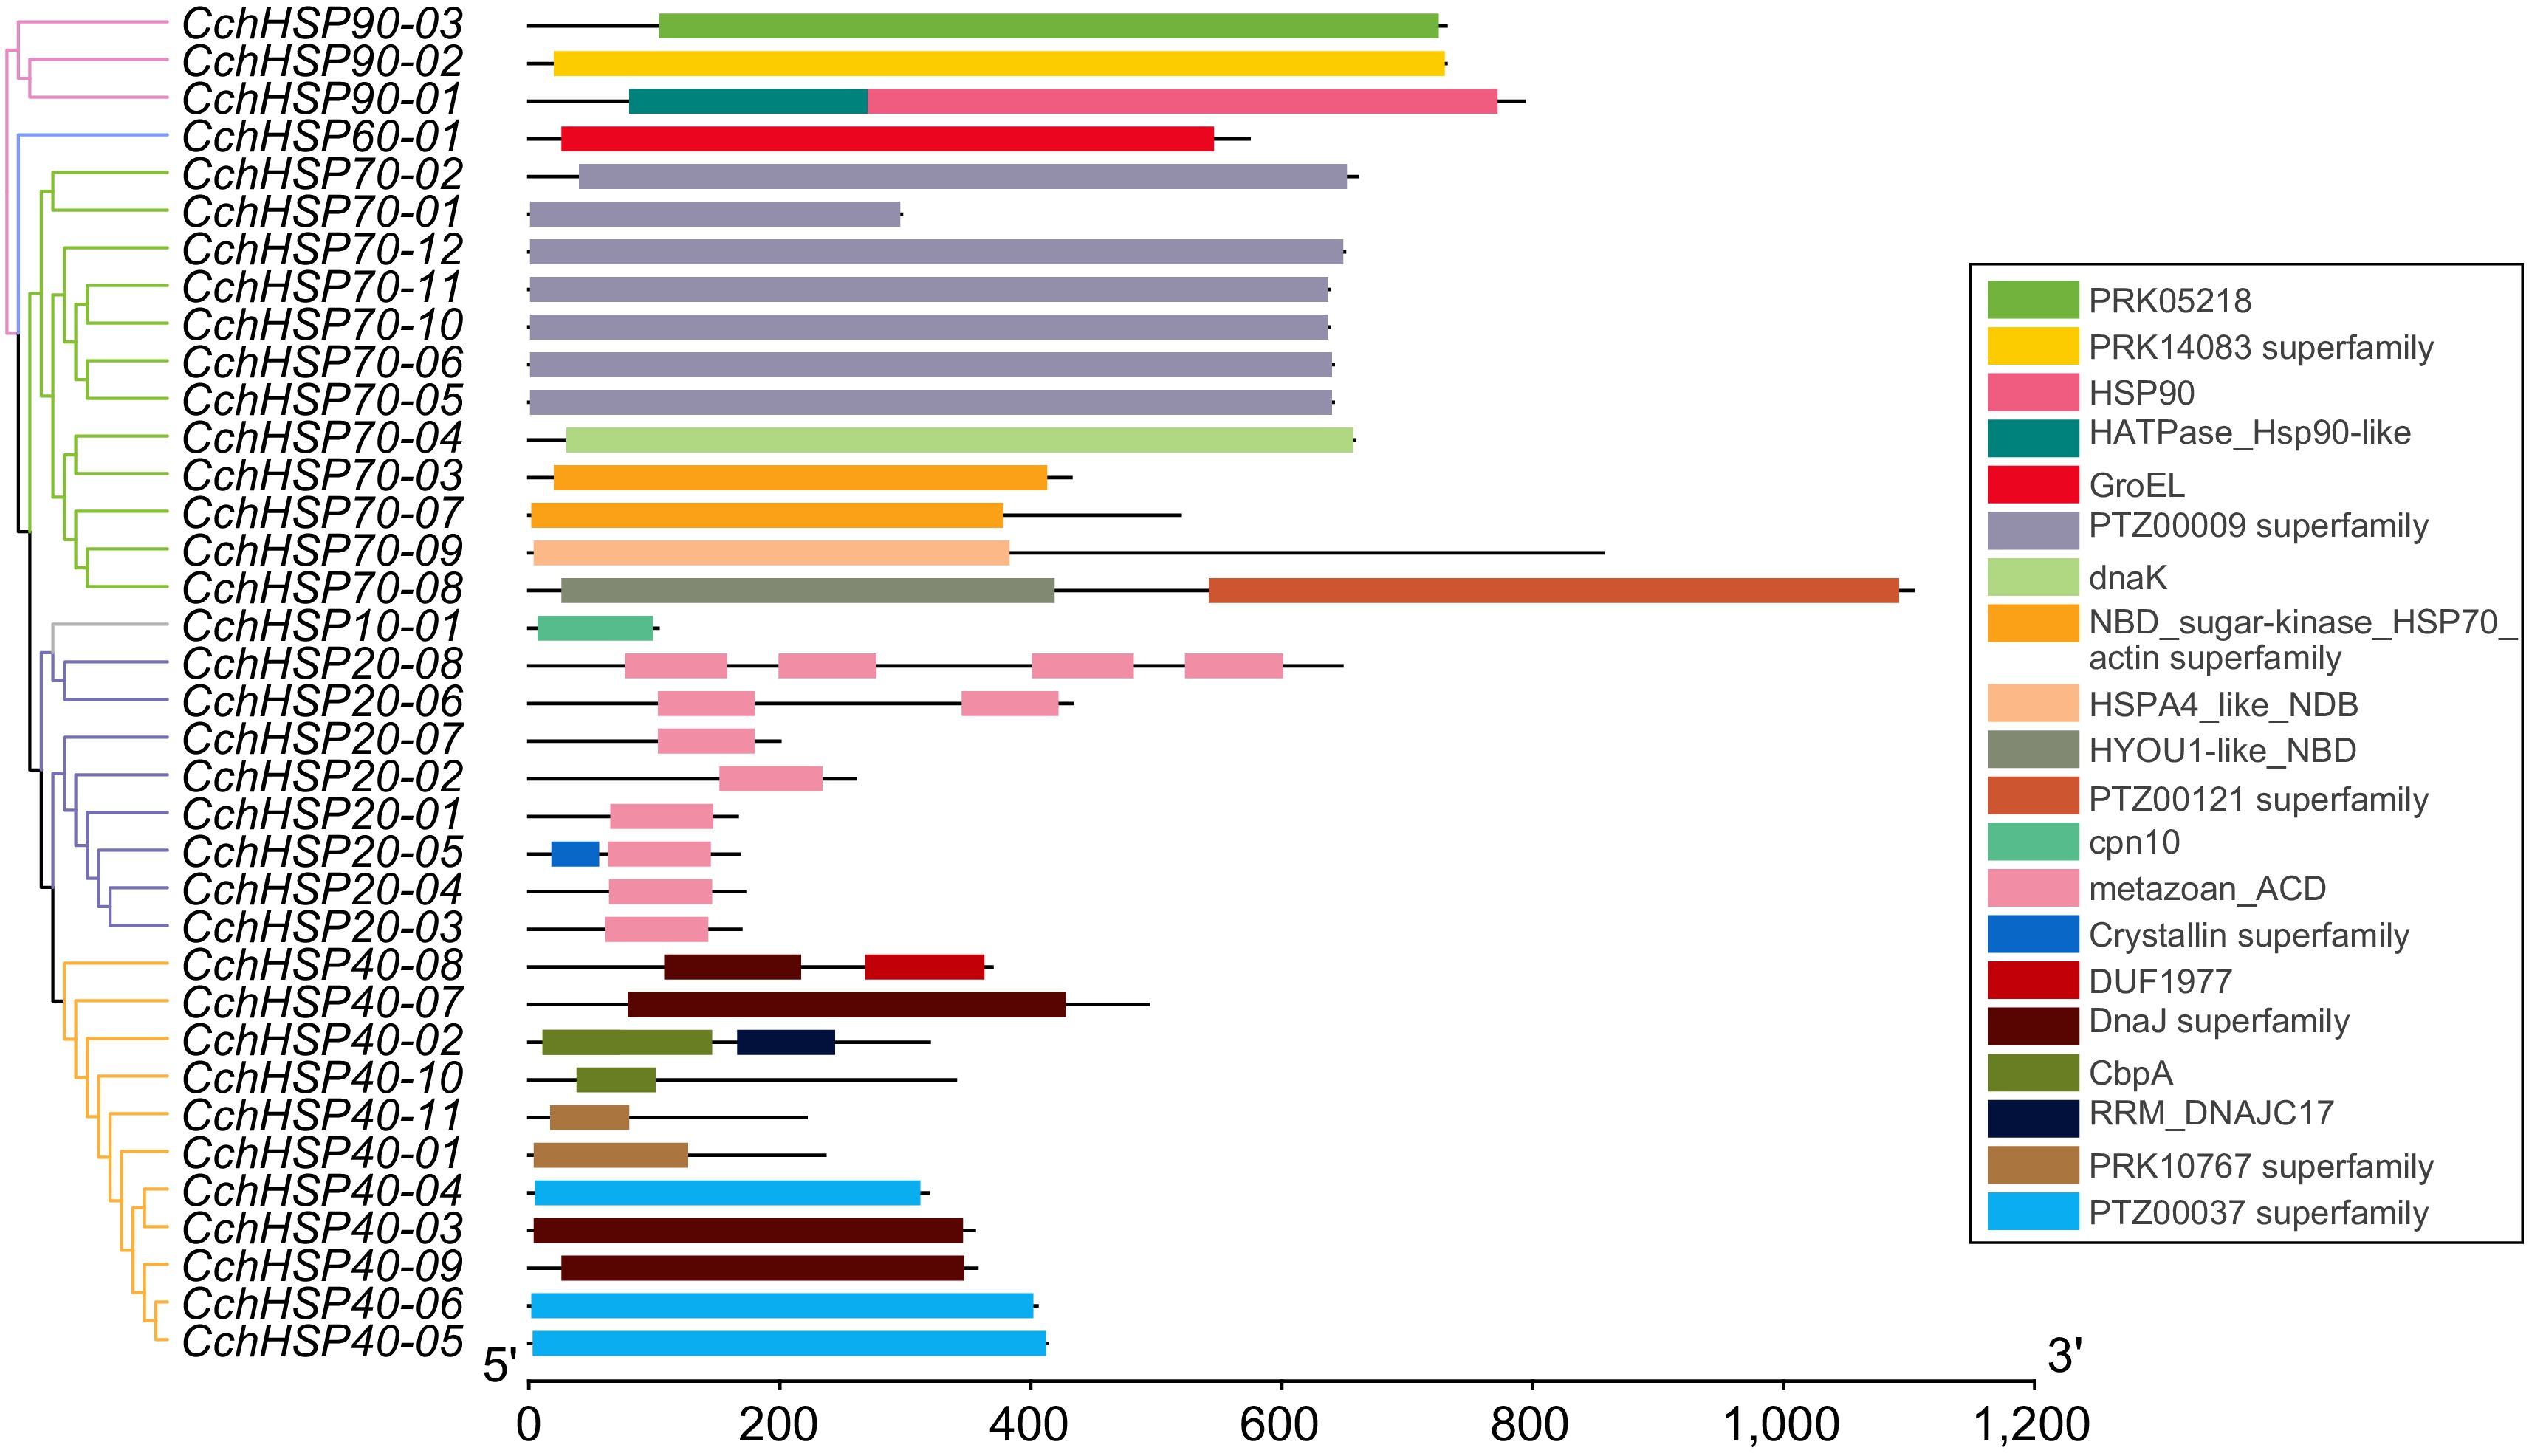
Figure 3.
The protein domain analysis of the CchHSPs.
-
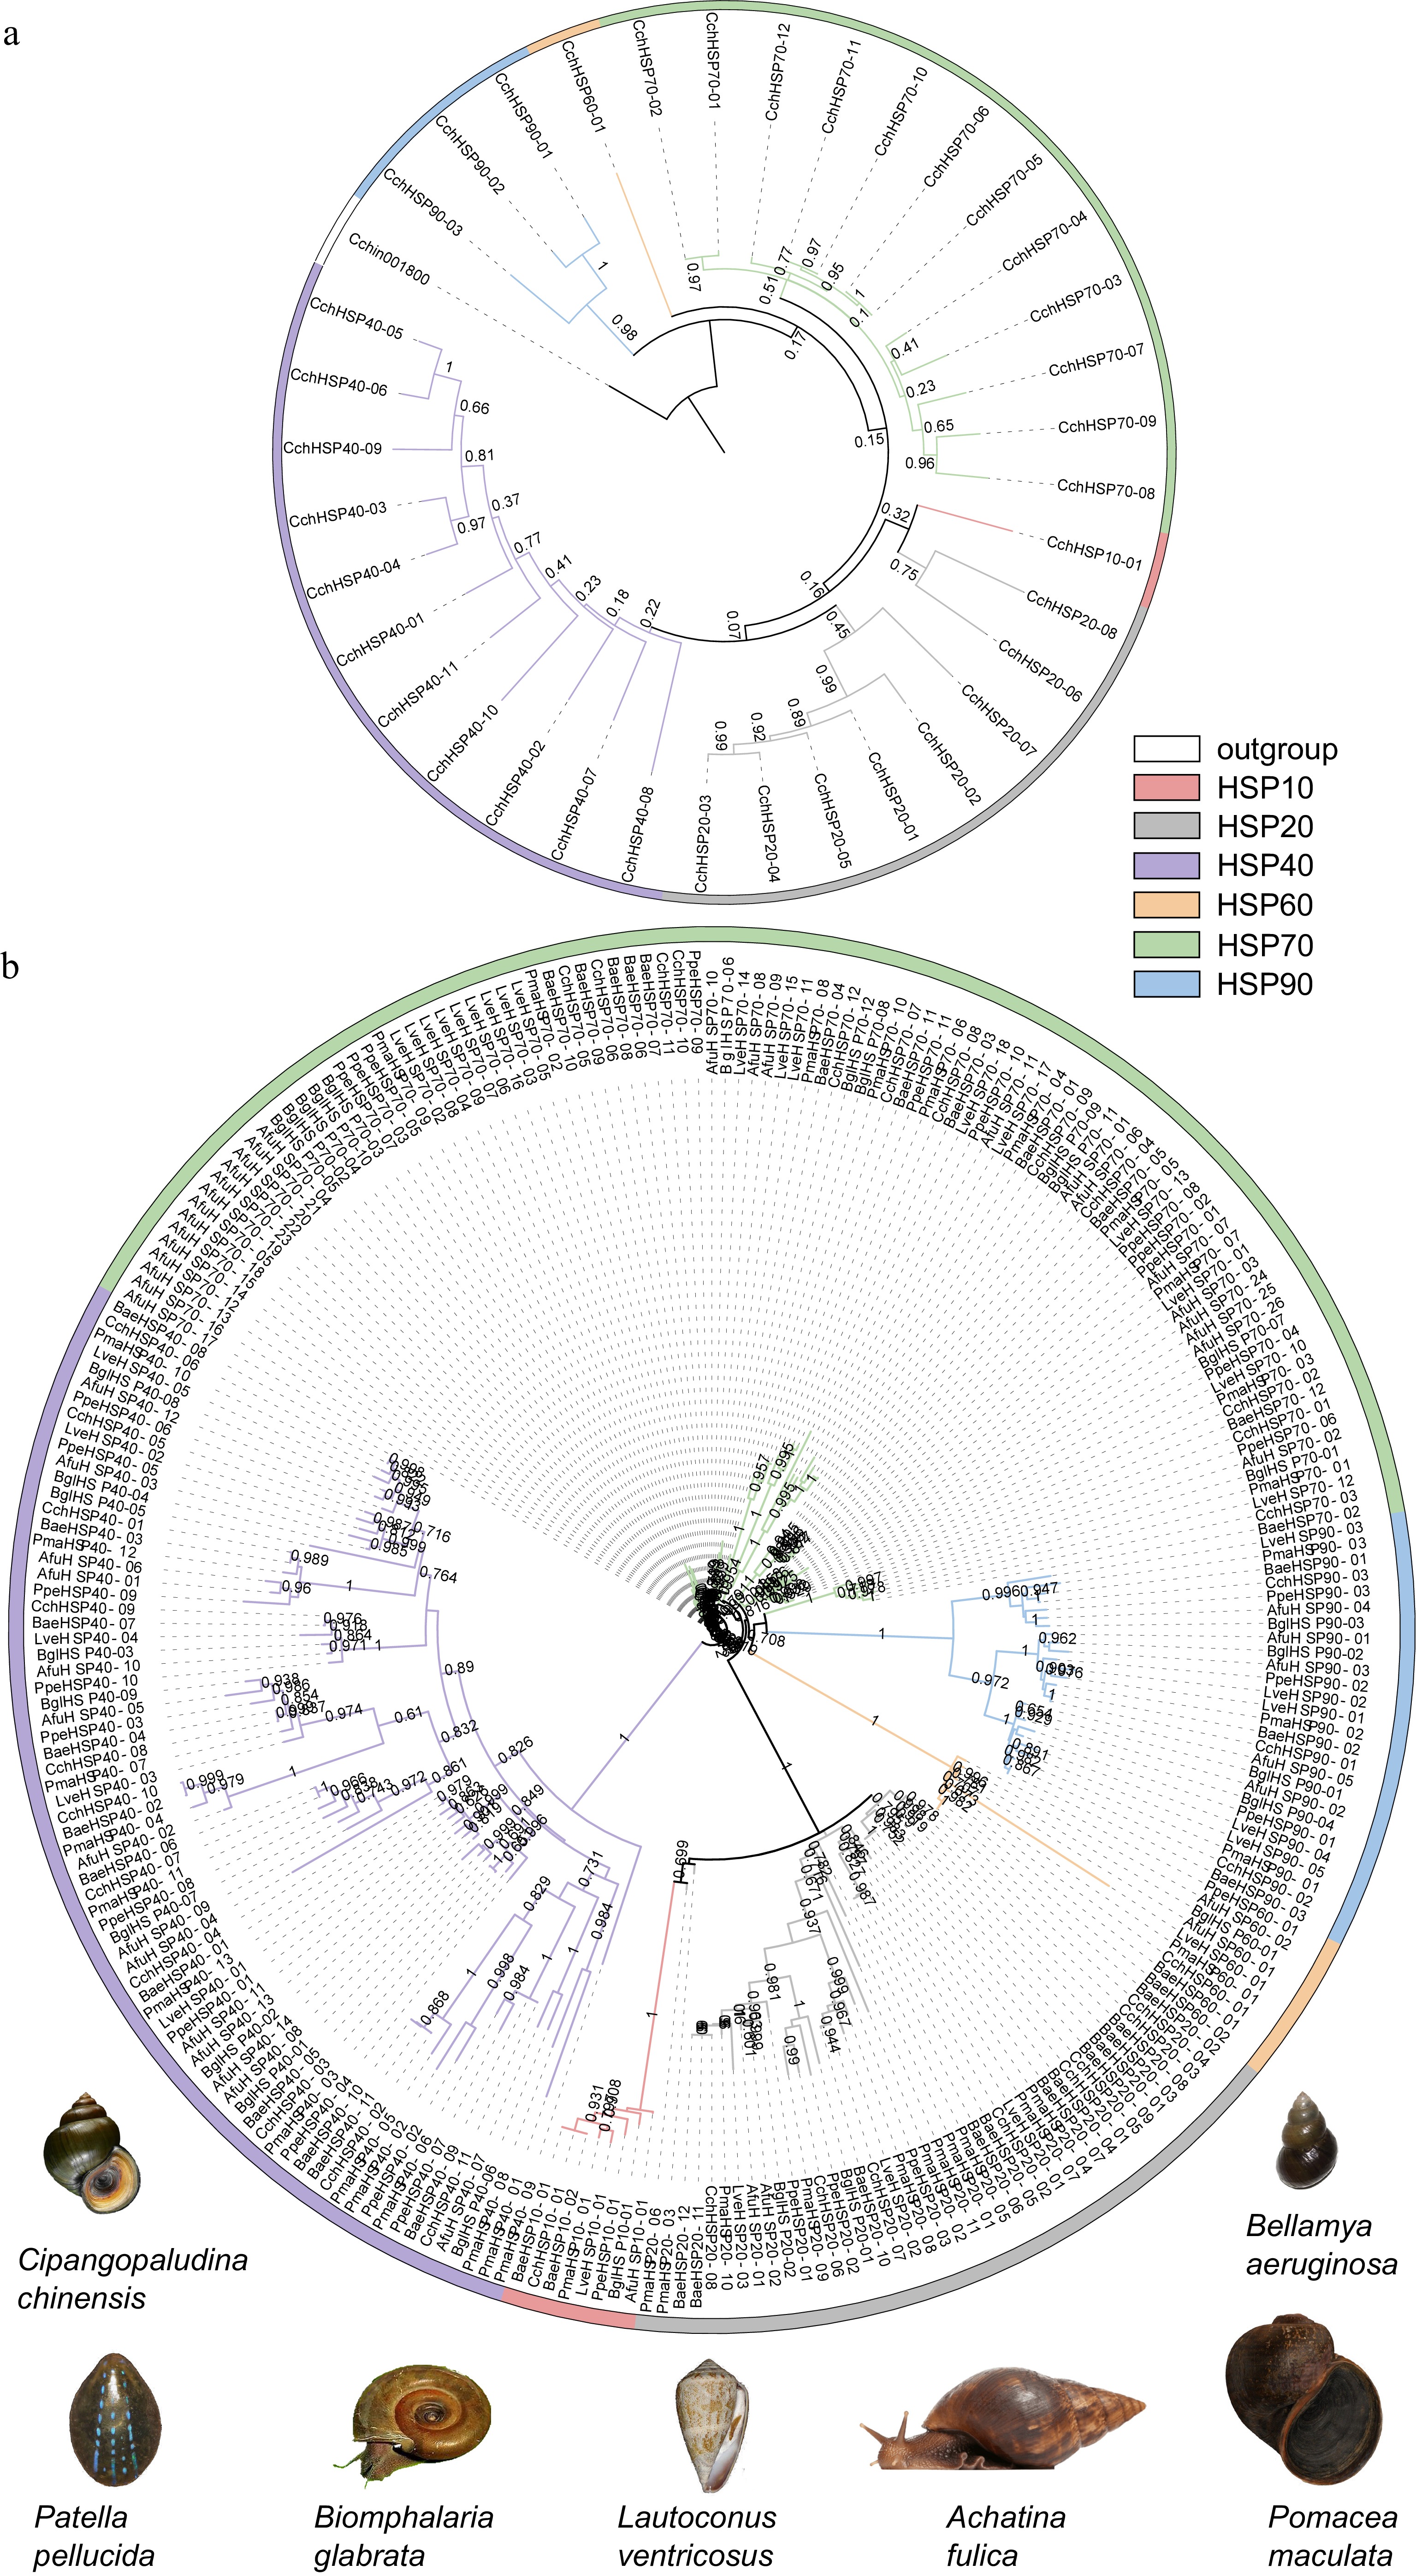
Figure 4.
(a) The phylogenetic tree of the CchHSPs via the maximum likelihood (ML) approach. (b) The phylogenetic analysis for the HSPs in C. chinensis, B. aeruginosa, P. maculate, B. glabrata, A. fulica, L. ventricosus, and P. pellucida.
-
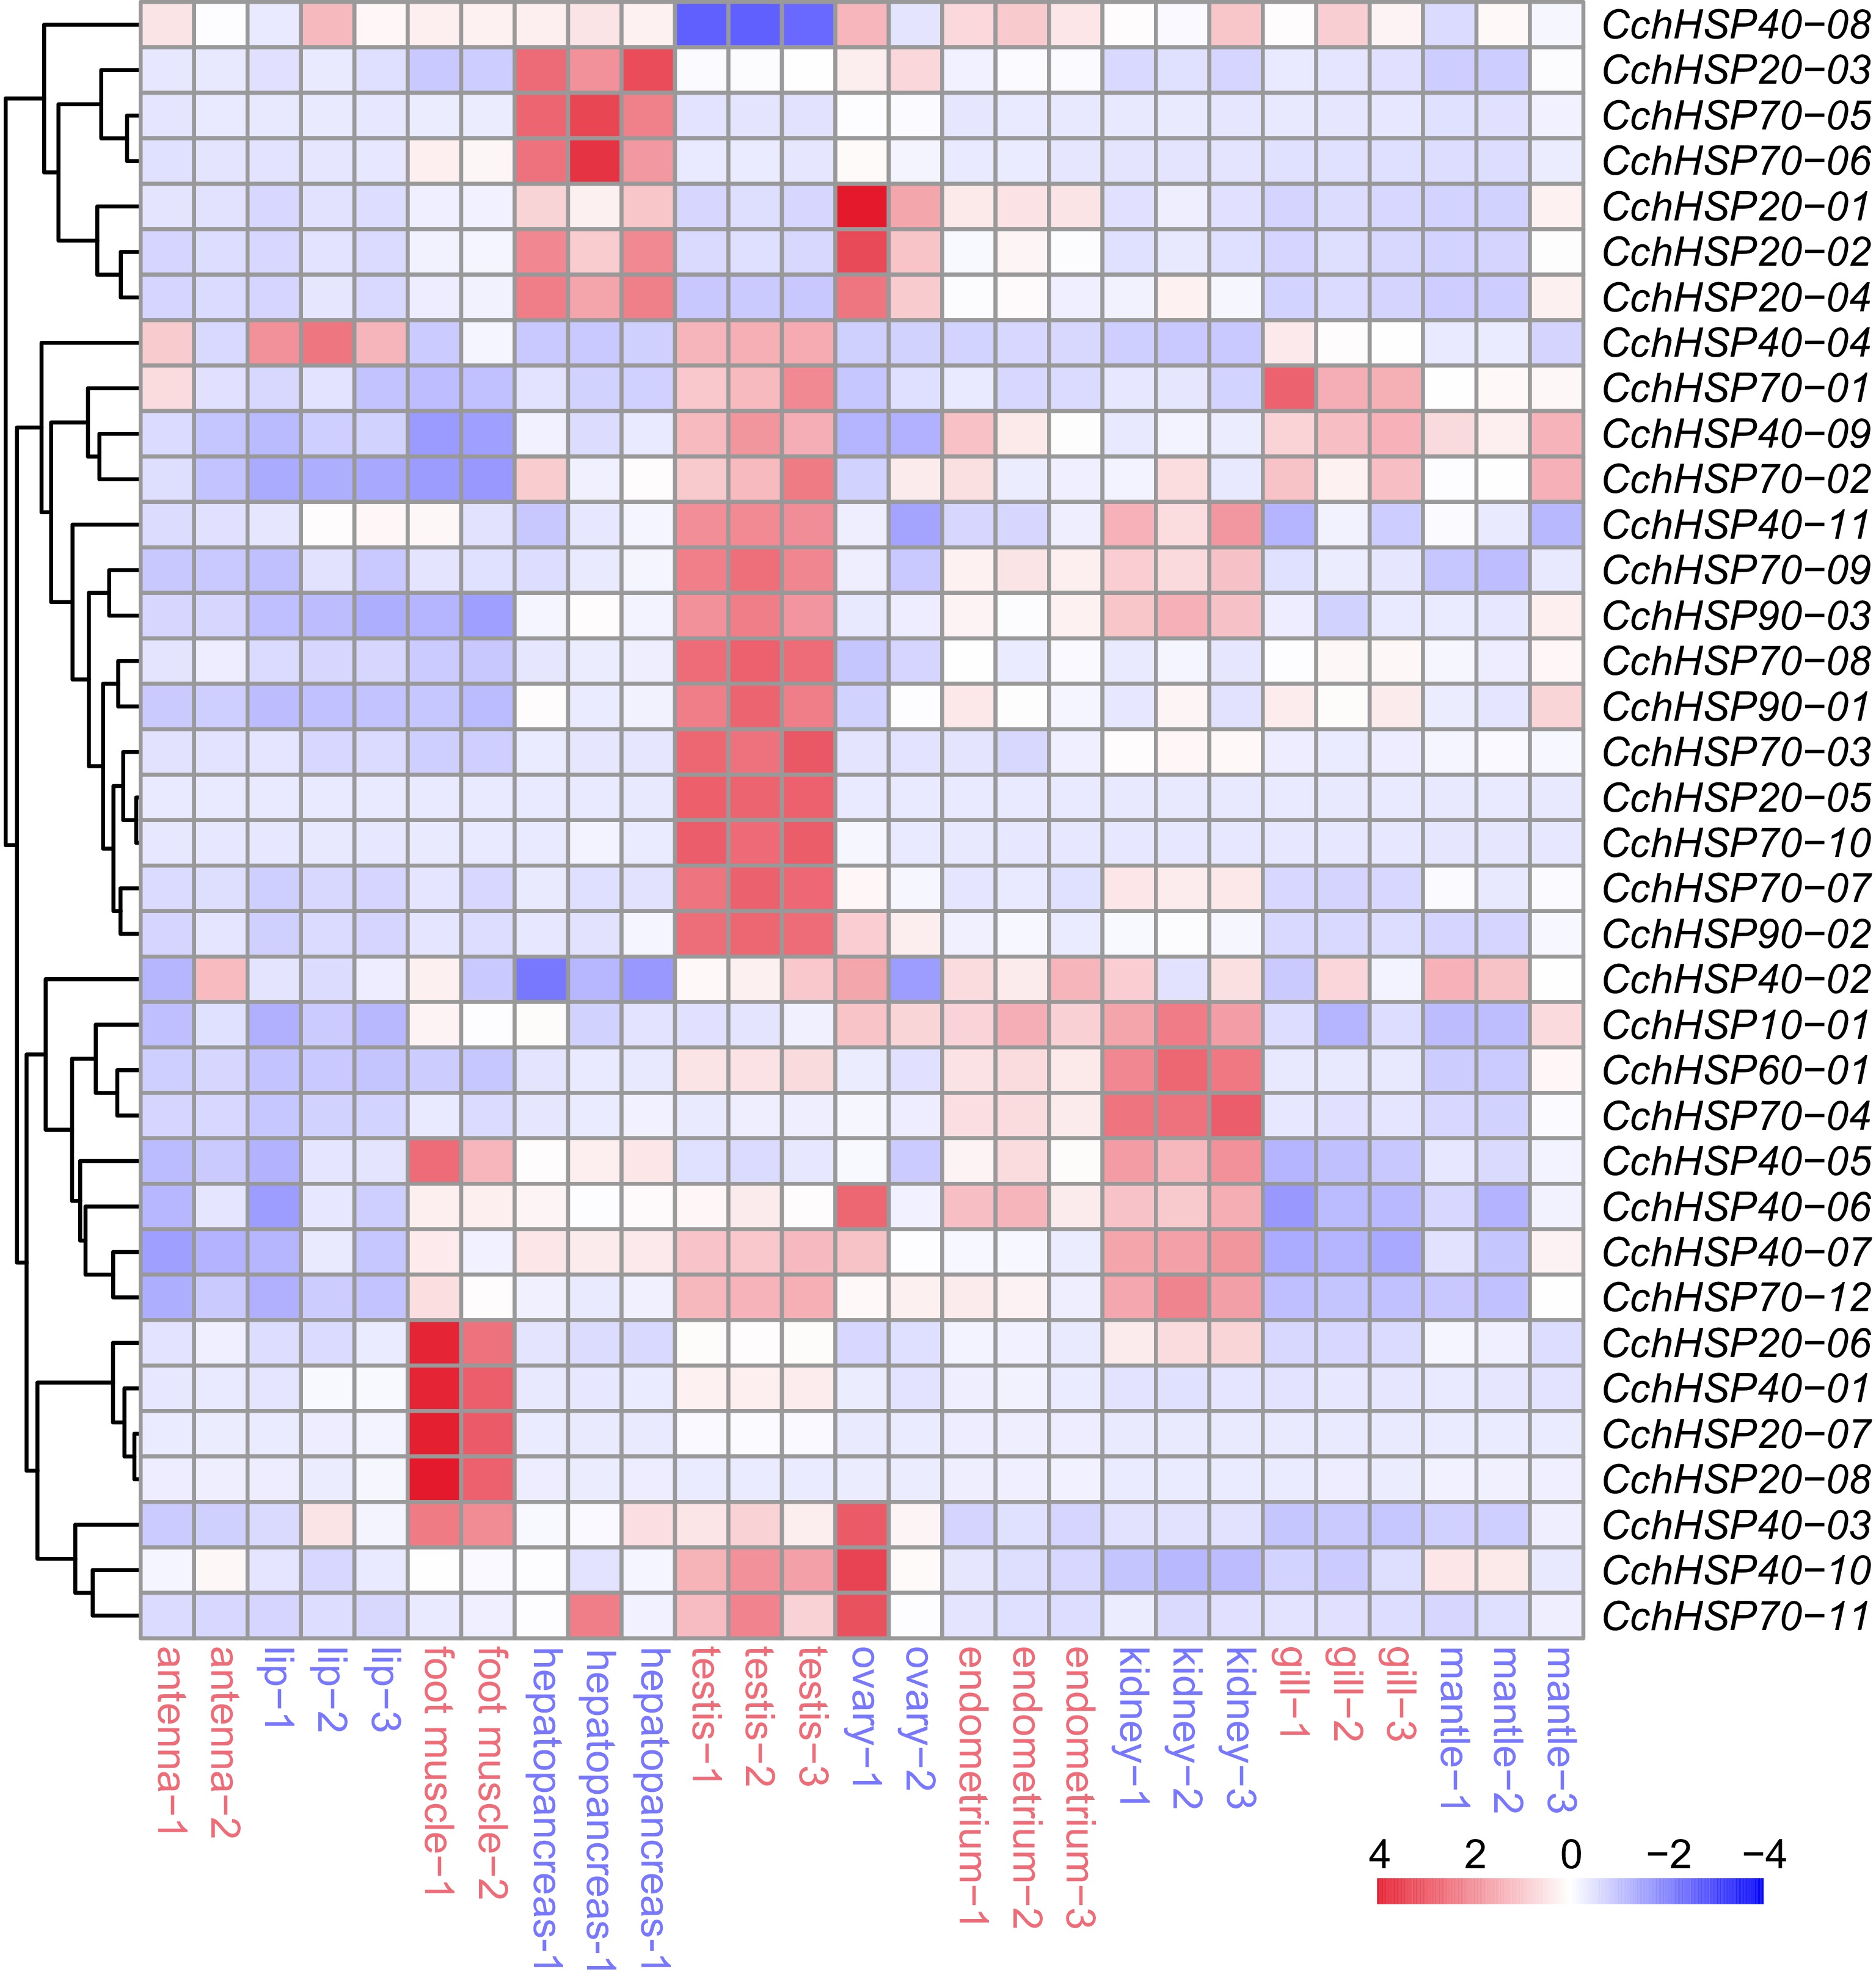
Figure 5.
The expression levels of CchHSPs in antennae, lip, foot muscle, testis, ovary, hepatopancreas, kidney, gill, endometrium, and mantle.
-
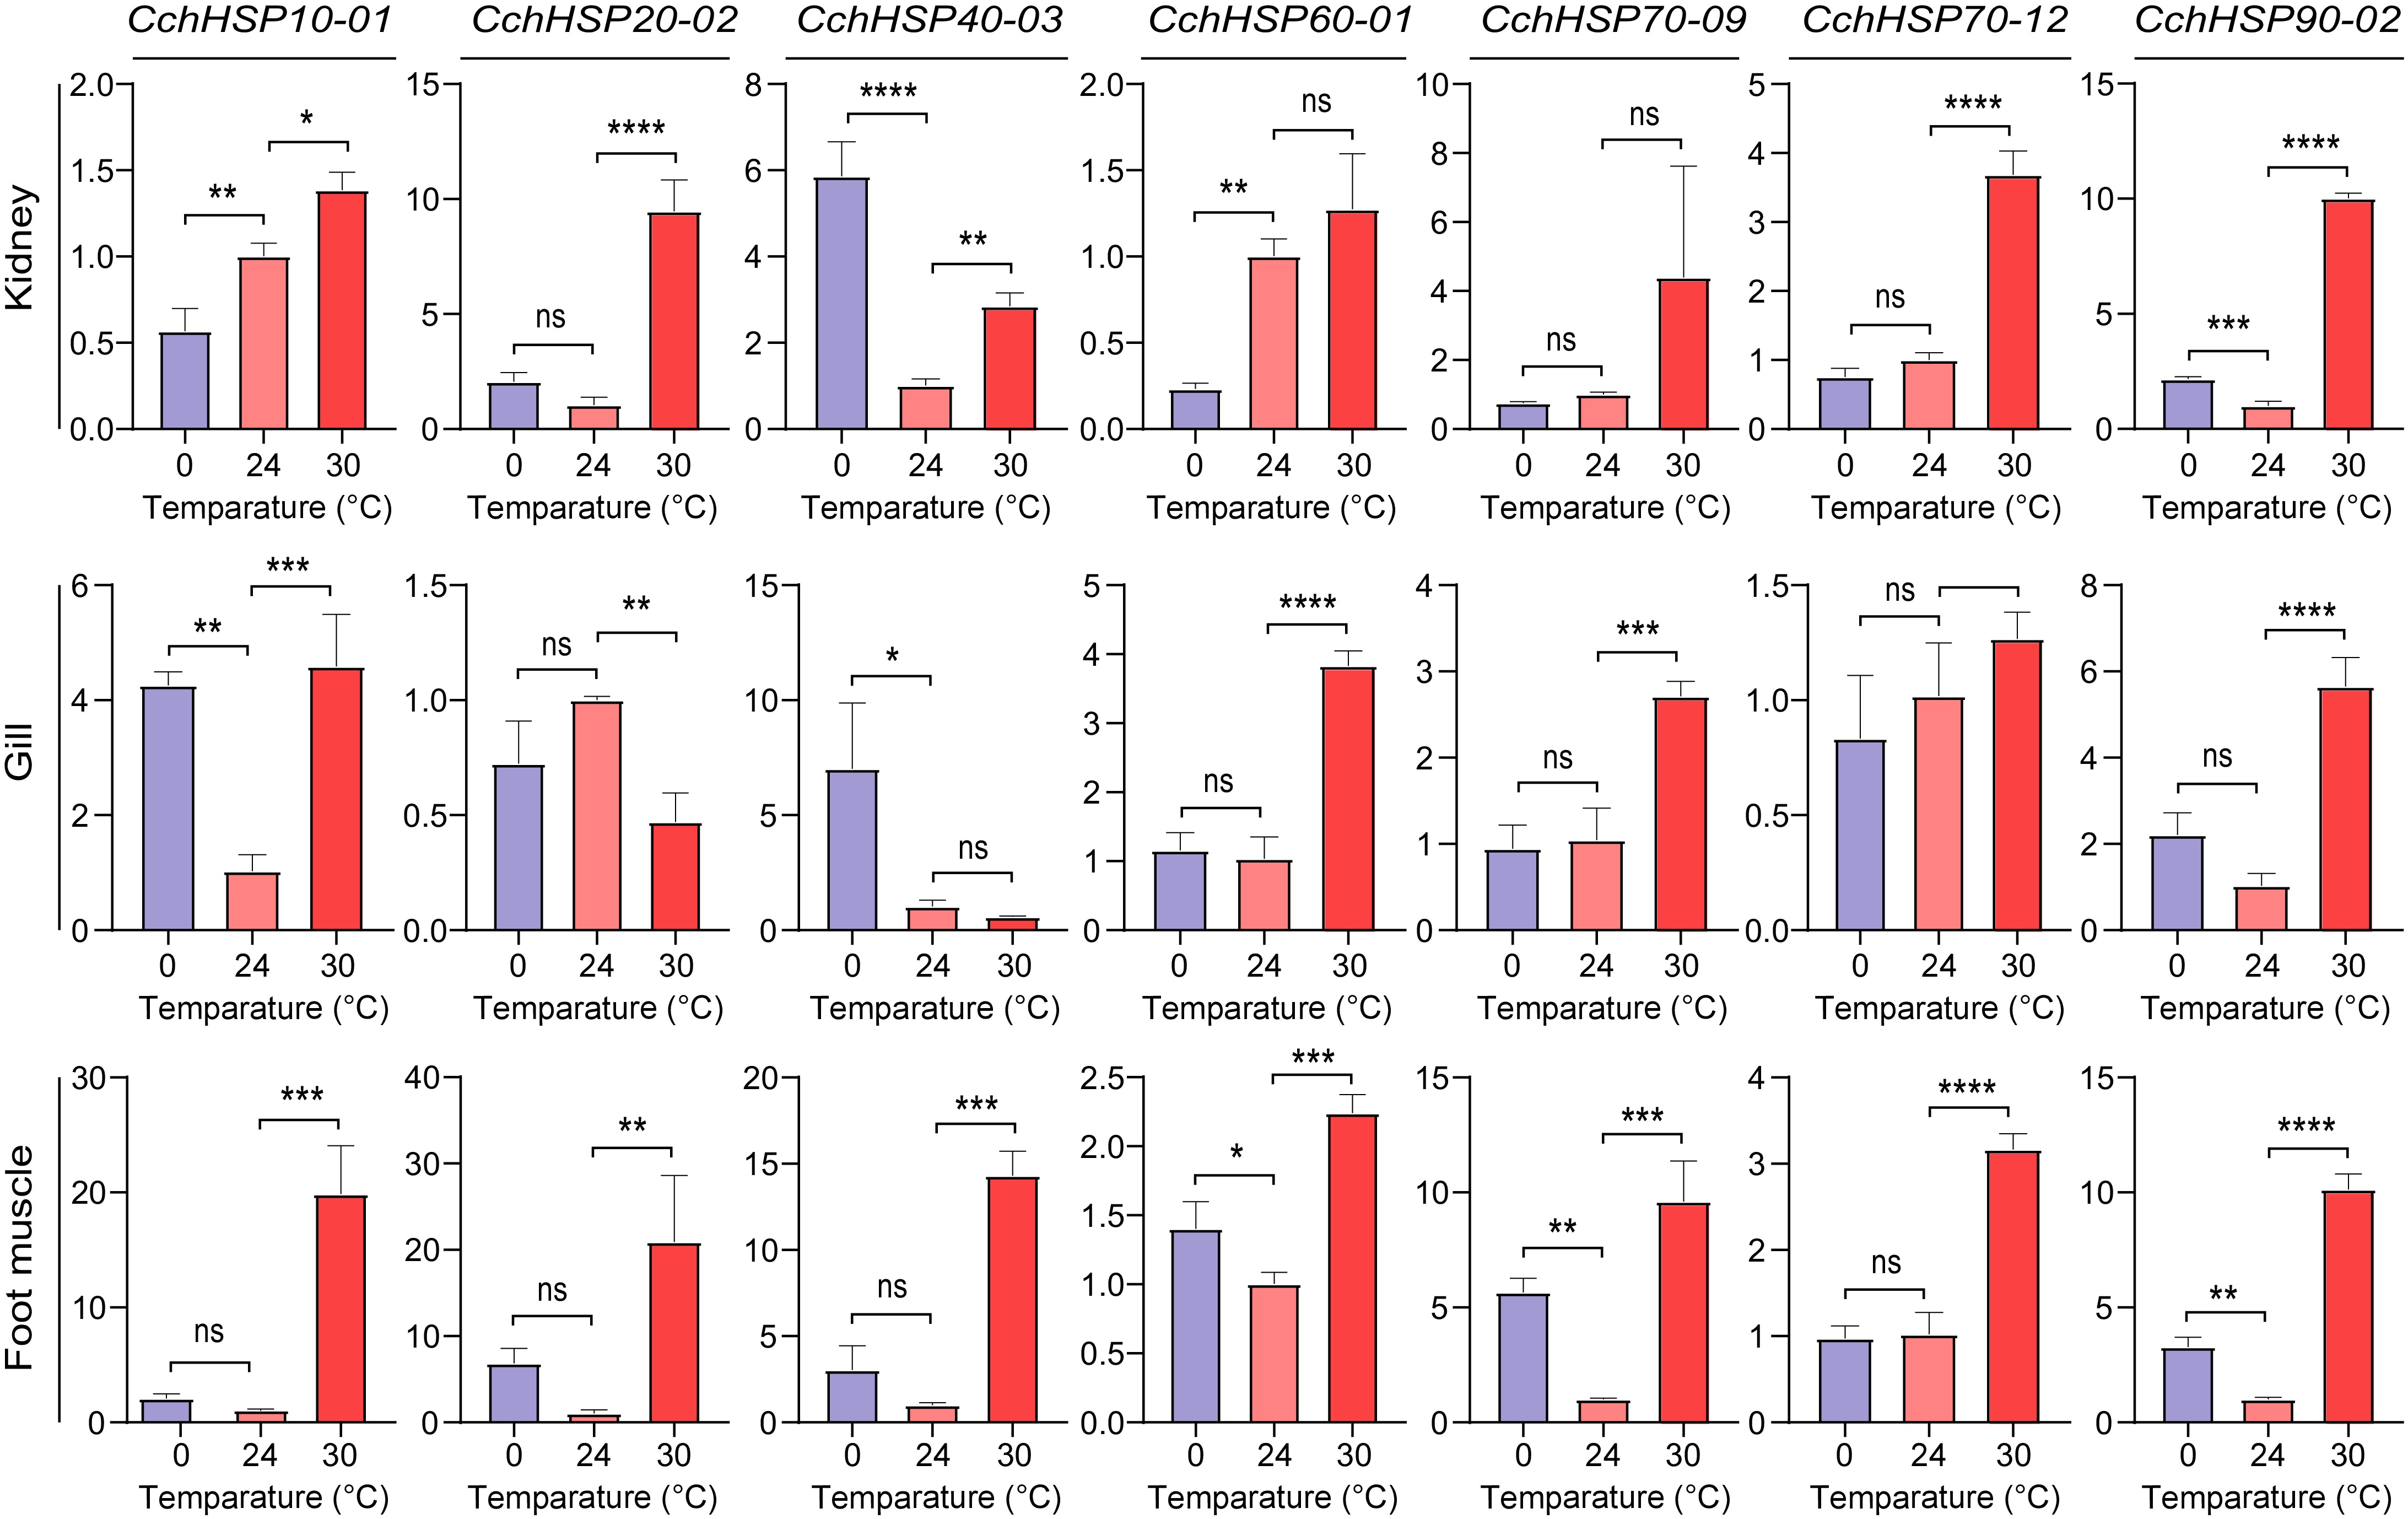
Figure 6.
Relative expression levels of CchHSPs in kidney, gill, and foot muscles under temperature stress. The horizontal axis is the temperature of temperature stress and the vertical axis is the relative expression level of genes.
-
Gene name Size
(aa)MW
(Da)pI Instability
indexAliphatic
indexGrand average of
hydropathicity (GRAVY)Chromosome
no.Subcellular
localizationCchHSP10-01 102 11,232.16 7.95 35.20 95.53 −0.110 Chr1 Cytoplasm CchHSP20-01 165 18,552.21 5.83 32.45 80.36 −0.445 Chr4 Cytoplasm CchHSP20-02 260 29,741.03 7.61 44.95 76.85 −0.596 Chr4 Cytoplasm CchHSP20-03 168 19,473.30 5.83 41.55 72.38 −0.667 Chr4 Cytoplasm CchHSP20-04 171 19,507.20 5.61 44.42 71.11 −0.629 Chr4 Cytoplasm CchHSP20-05 167 19,123.81 5.75 43.94 74.67 −0.656 Chr4 Cytoplasm CchHSP20-06 432 47,398.99 5.94 58.01 62.75 −0.694 Chr9 Nucleus CchHSP20-07 199 23,147.35 5.37 33.67 64.17 −0.658 Chr9 Cytoplasm CchHSP20-08 646 73,972.96 6.63 57.22 73.19 −0.784 Chr9 Nucleus CchHSP40-01 235 25,939.71 6.99 56.68 46.89 −0.697 Chr1 Nucleus CchHSP40-02 318 35,945.69 8.57 54.98 79.53 −0.823 Chr2 Nucleus CchHSP40-03 354 38,868.21 8.93 33.87 64.72 −0.631 Chr3 Cytoplasm CchHSP40-04 317 35,413.31 6.72 36.37 79.62 −0.494 Chr4 Cytoplasm CchHSP40-05 412 45,624.63 5.89 35.02 66.00 −0.662 Chr4 Nucleus CchHSP40-06 404 44,884.34 6.40 41.65 74.83 −0.591 Chr4 Nucleus CchHSP40-07 493 53,964.07 8.95 44.23 70.43 −0.484 Chr6 Mitochondrion CchHSP40-08 368 42,963.14 8.74 62.88 64.16 −0.986 Chr7 Nucleus CchHSP40-09 356 40,248.48 5.47 41.35 72.19 −0.619 Chr7 Cytoplasmic CchHSP40-10 339 40,677.82 9.21 52.62 80.24 −0.696 Chr9 Nucleus CchHSP40-11 220 24,065.09 5.46 46.26 62.59 −0.540 Chr9 Extracellular space CchHSP60-01 573 61,096.40 5.69 28.52 98.05 −0.093 Chr1 Mitochondrion CchHSP70-01 296 32,945.25 4.82 21.95 84.63 −0.626 Chr1 Endoplasmic reticulum CchHSP70-02 659 72,885.36 5.02 29.26 86.07 −0.494 Chr1 Endoplasmic reticulum CchHSP70-03 431 47,342.62 5.97 30.02 105.36 0.060 Chr1 Cytoplasm CchHSP70-04 657 71,936.88 6.63 36.74 82.68 −0.461 Chr1 Mitochondrion CchHSP70-05 640 70,385.24 5.70 36.86 78.81 −0.499 Chr2 Cytoplasm CchHSP70-06 640 70,440.41 5.86 37.46 78.81 −0.499 Chr2 Cytoplasm CchHSP70-07 518 55,978.35 6.18 38.34 89.34 −0.141 Chr3 Cytoplasm CchHSP70-08 1,102 124,693.00 5.20 37.68 72.29 −0.854 Chr5 Nucleus CchHSP70-09 855 95,997.61 5.24 44.11 70.95 −0.635 Chr6 Cytoplasm CchHSP70-10 637 70,158.17 5.77 33.55 79.62 −0.496 Chr7 Cytoplasm CchHSP70-11 637 70,158.21 5.77 33.39 79.92 −0.491 Chr7 Cytoplasm CchHSP70-12 649 71,456.75 5.55 37.75 79.52 −0.479 Chr8 Cytoplasm CchHSP90-01 792 90,870.62 4.91 36.57 81.96 −0.630 Chr3 Endoplasmic reticulum CchHSP90-02 730 83,874.10 4.93 42.35 79.07 −0.686 Chr6 Cytoplasm CchHSP90-03 730 83,274.87 6.40 42.29 88.59 −0.409 Chr6 Cytoplasm MW, molecular weight; pI, isoelectric point. Table 1.
Characteristics summary of HSP genes in C. chinensis.
-
Gene name Sequence length Alpha helix (Hh) Extended strand (Ee) Random coil (Cc) CchHSP10-01 102 28/27.45% 28/27.45% 46/45.10% CchHSP20-01 165 32/19.39% 31/18.79% 102/61.82% CchHSP20-02 260 45/17.31% 58/22.31% 157/60.38% CchHSP20-03 168 19/11.31% 41/24.40% 108/64.29% CchHSP20-04 171 17/9.94% 45/26.32% 109/63.74% CchHSP20-05 167 39/23.35% 32/19.16% 96/57.49% CchHSP20-06 432 92/21.30% 60/13.89% 280/64.81% CchHSP20-07 199 42/21.11% 32/16.08% 125/62.81% CchHSP20-08 646 204/31.58% 131/20.28% 311/48.14% CchHSP40-01 235 71/30.21% 41/17.45% 123/52.34% CchHSP40-02 318 166/52.20% 36/11.32% 116/36.48% CchHSP40-03 354 85/24.01% 73/20.62% 196/55.37% CchHSP40-04 317 70/22.08% 72/22.71% 175/55.21% CchHSP40-05 412 75/18.20% 90/21.84% 247/59.95% CchHSP40-06 404 108/26.73% 77/19.06% 219/54.21% CchHSP40-07 493 114/23.12% 96/19.47% 283/57.40% CchHSP40-08 368 137/37.23% 40/10.87% 191/51.90% CchHSP40-09 356 111/31.18% 44/12.36% 201/56.46% CchHSP40-10 339 148/43.66% 72/21.24% 119/35.10% CchHSP40-11 220 46/20.91% 37/16.82% 137/62.27% CchHSP60-01 573 298/52.01% 70/12.22% 205/35.78% CchHSP70-01 296 100/33.78% 58/19.59% 138/46.62% CchHSP70-02 659 237/35.96% 128/19.42% 294/44.61% CchHSP70-03 431 190/44.08% 73/16.94% 168/38.98% CchHSP70-04 657 294/44.75% 101/15.37% 262/39.88% CchHSP70-05 640 254/39.69% 118/18.44% 268/41.88% CchHSP70-06 640 254/39.69% 117/18.28% 269/42.03% CchHSP70-07 518 210/40.54% 84/16.22% 224/43.24% CchHSP70-08 1102 534/48.46% 133/12.07% 435/39.47% CchHSP70-09 855 346/40.47% 105/12.28% 404/47.25% CchHSP70-10 637 257/40.35% 114/17.90% 266/41.76% CchHSP70-11 637 255/40.03% 114/17.90% 268/42.07% CchHSP70-12 649 272/41.91% 104/16.02% 273/42.06% CchHSP90-01 792 395/49.87% 112/14.14% 285/35.98% CchHSP90-02 730 363/49.73% 91/12.47% 276/37.81% CchHSP90-03 611 279/45.66% 113/18.49% 219/35.84% Table 2.
Summary of two-dimensional structures of CchHSPs proteins.
Figures
(6)
Tables
(2)