-
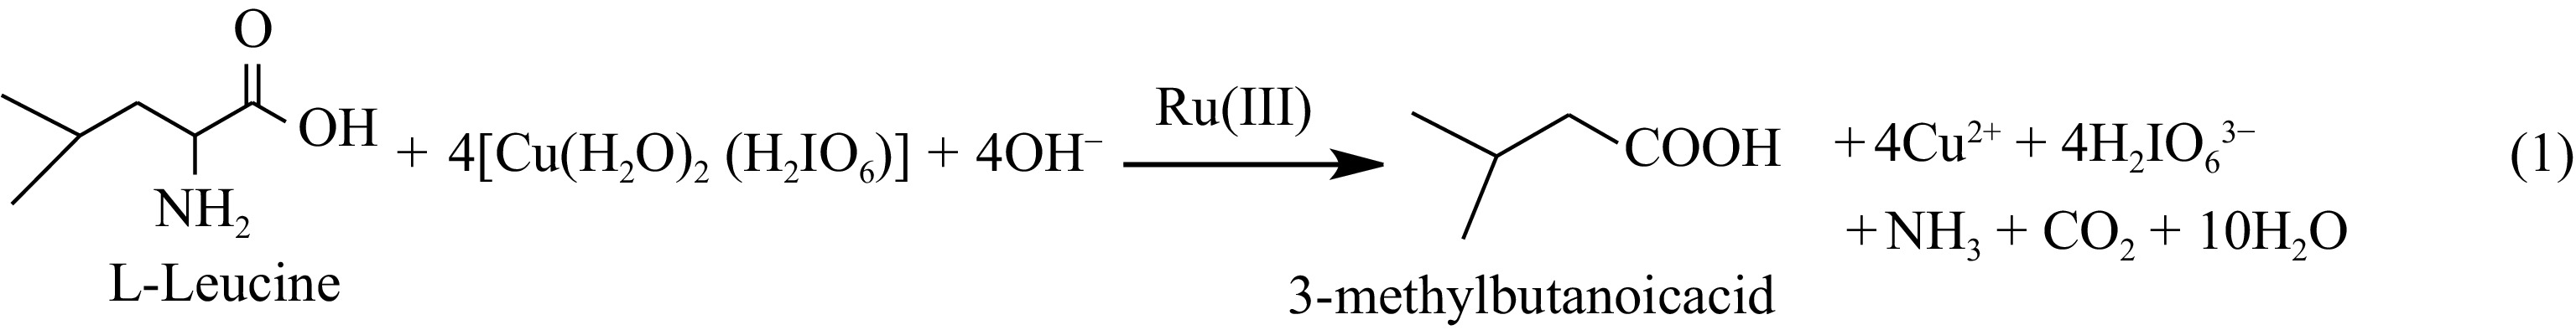
Figure 1.
Stoichiometry of the reaction between L-Leucine and DPC in basic medium.
-
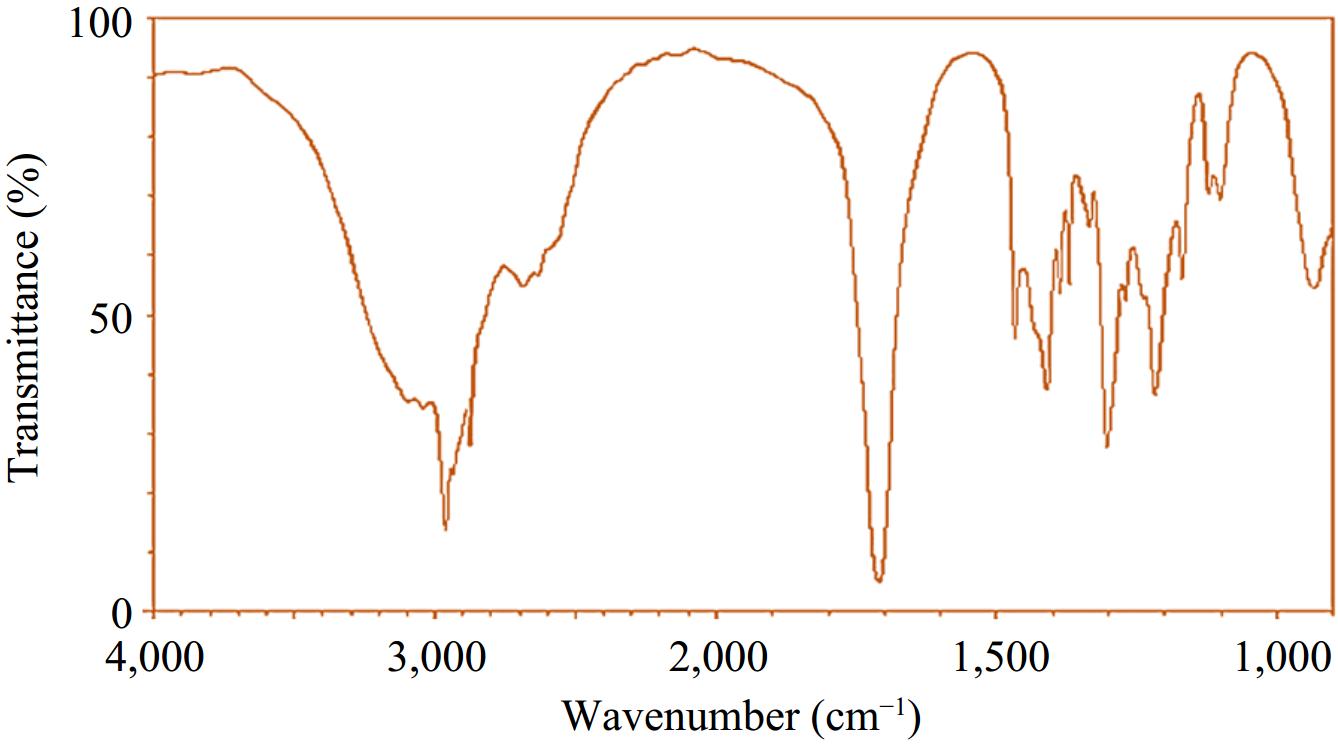
Figure 2.
FTIR spectrum of the ultimate product (3-methylbutanoic acid).
-
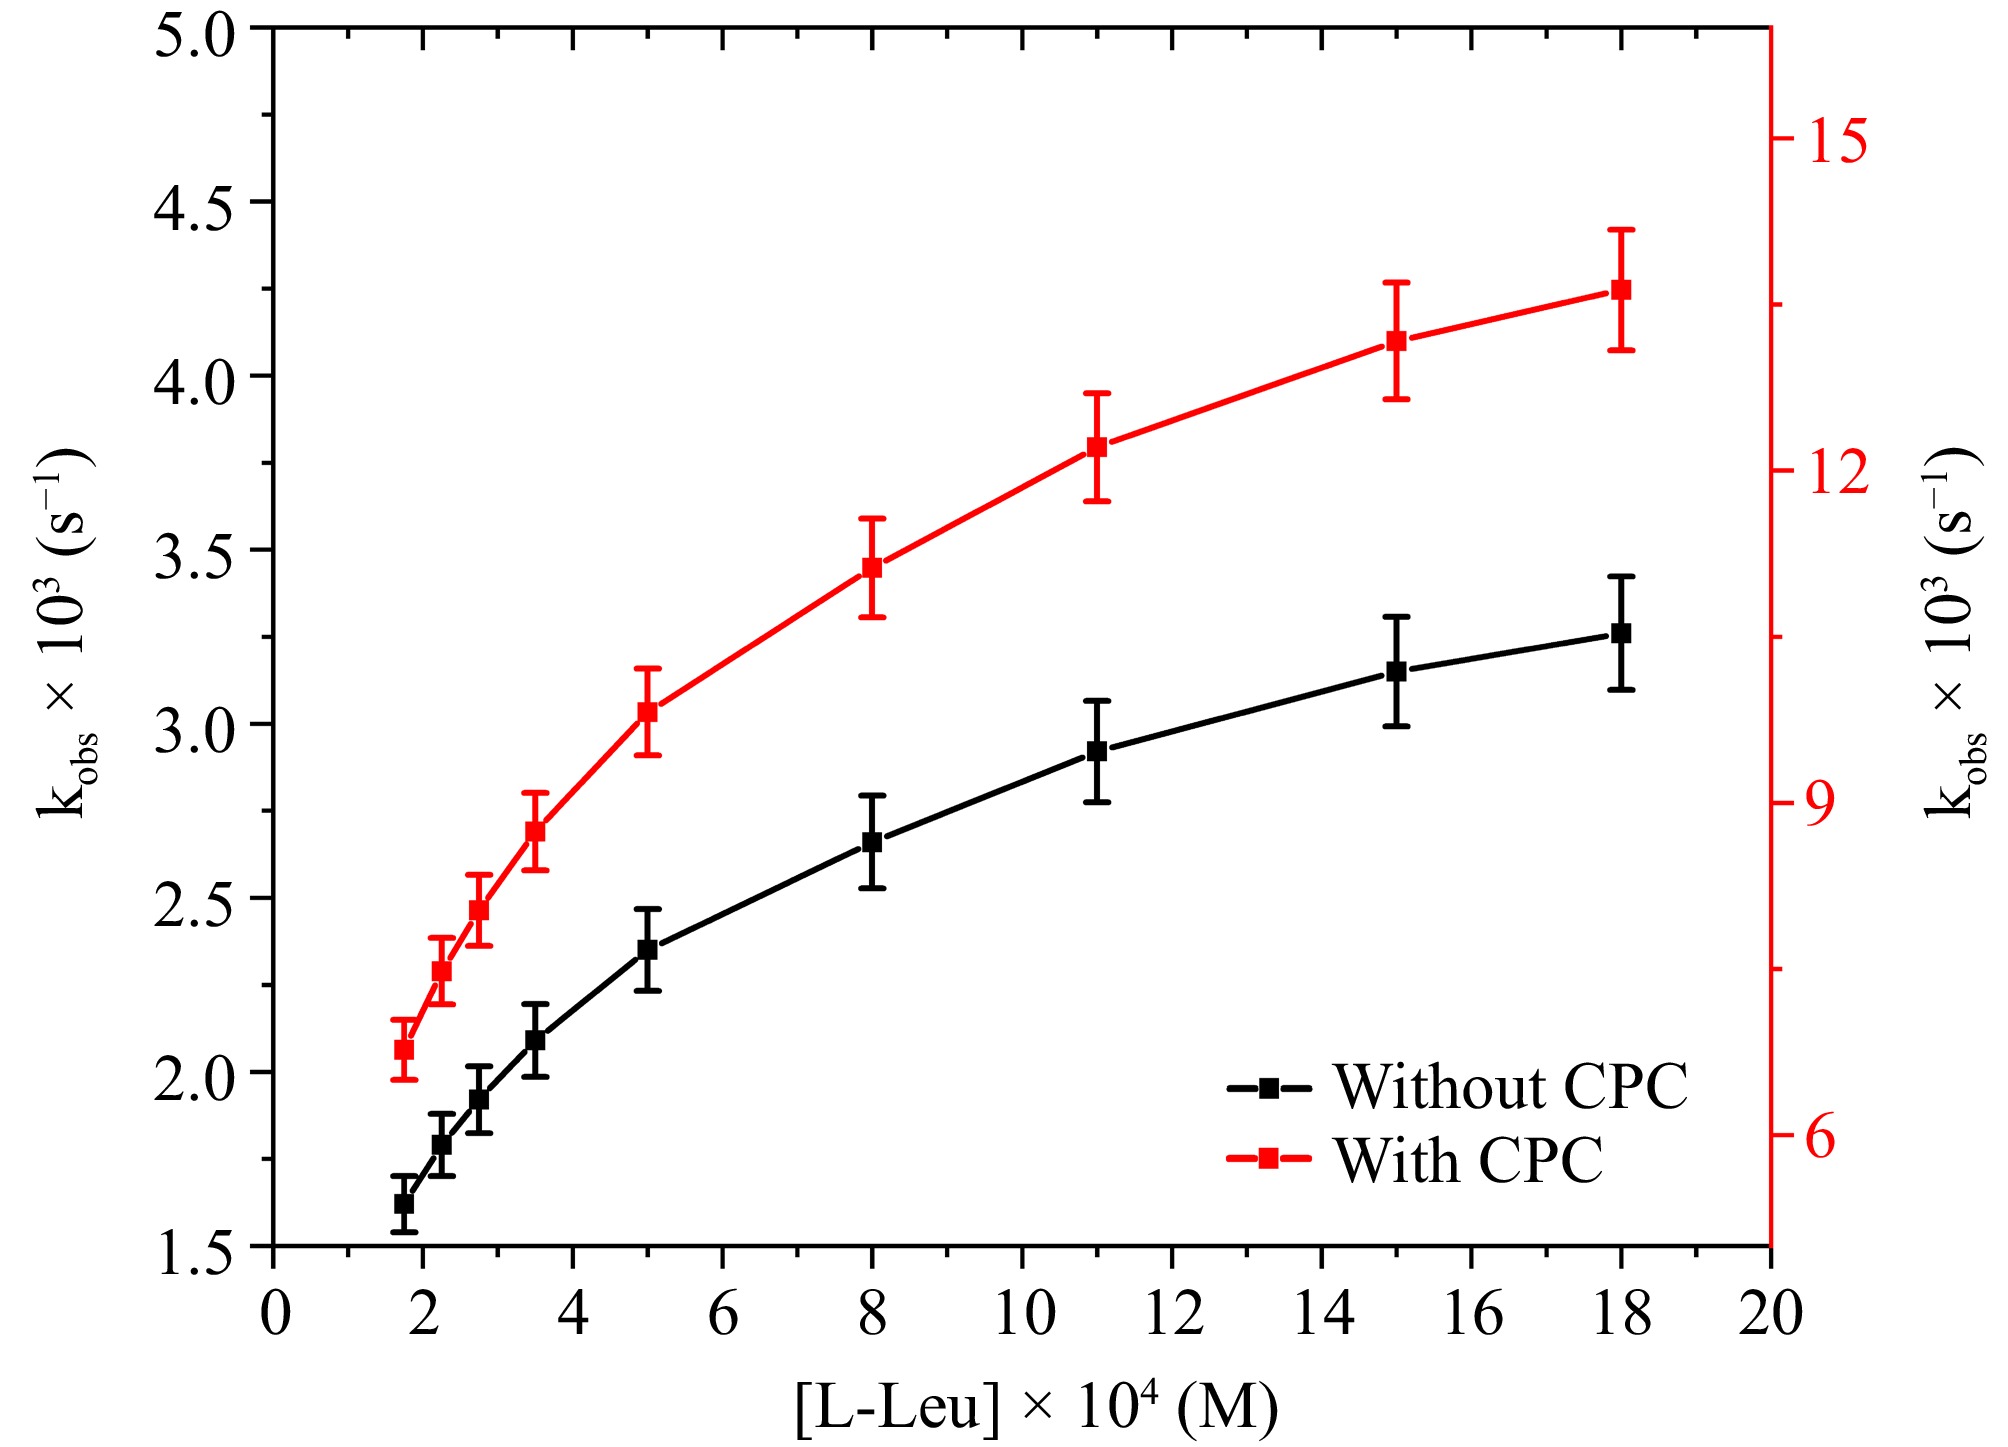
Figure 3.
The correlation between [L-leucine] and kobs at [DPC] = 1.75 × 10⁻⁵ M, [OH−] = 0.02 M, [Ru3+] = 2.5 × 10⁻⁶, I = 0.1 M (KNO3), Temp = 298 K, [IO4−] = 5.5 × 10⁻⁴ M, [CPC] = 6.0 × 10⁻³ M.
-
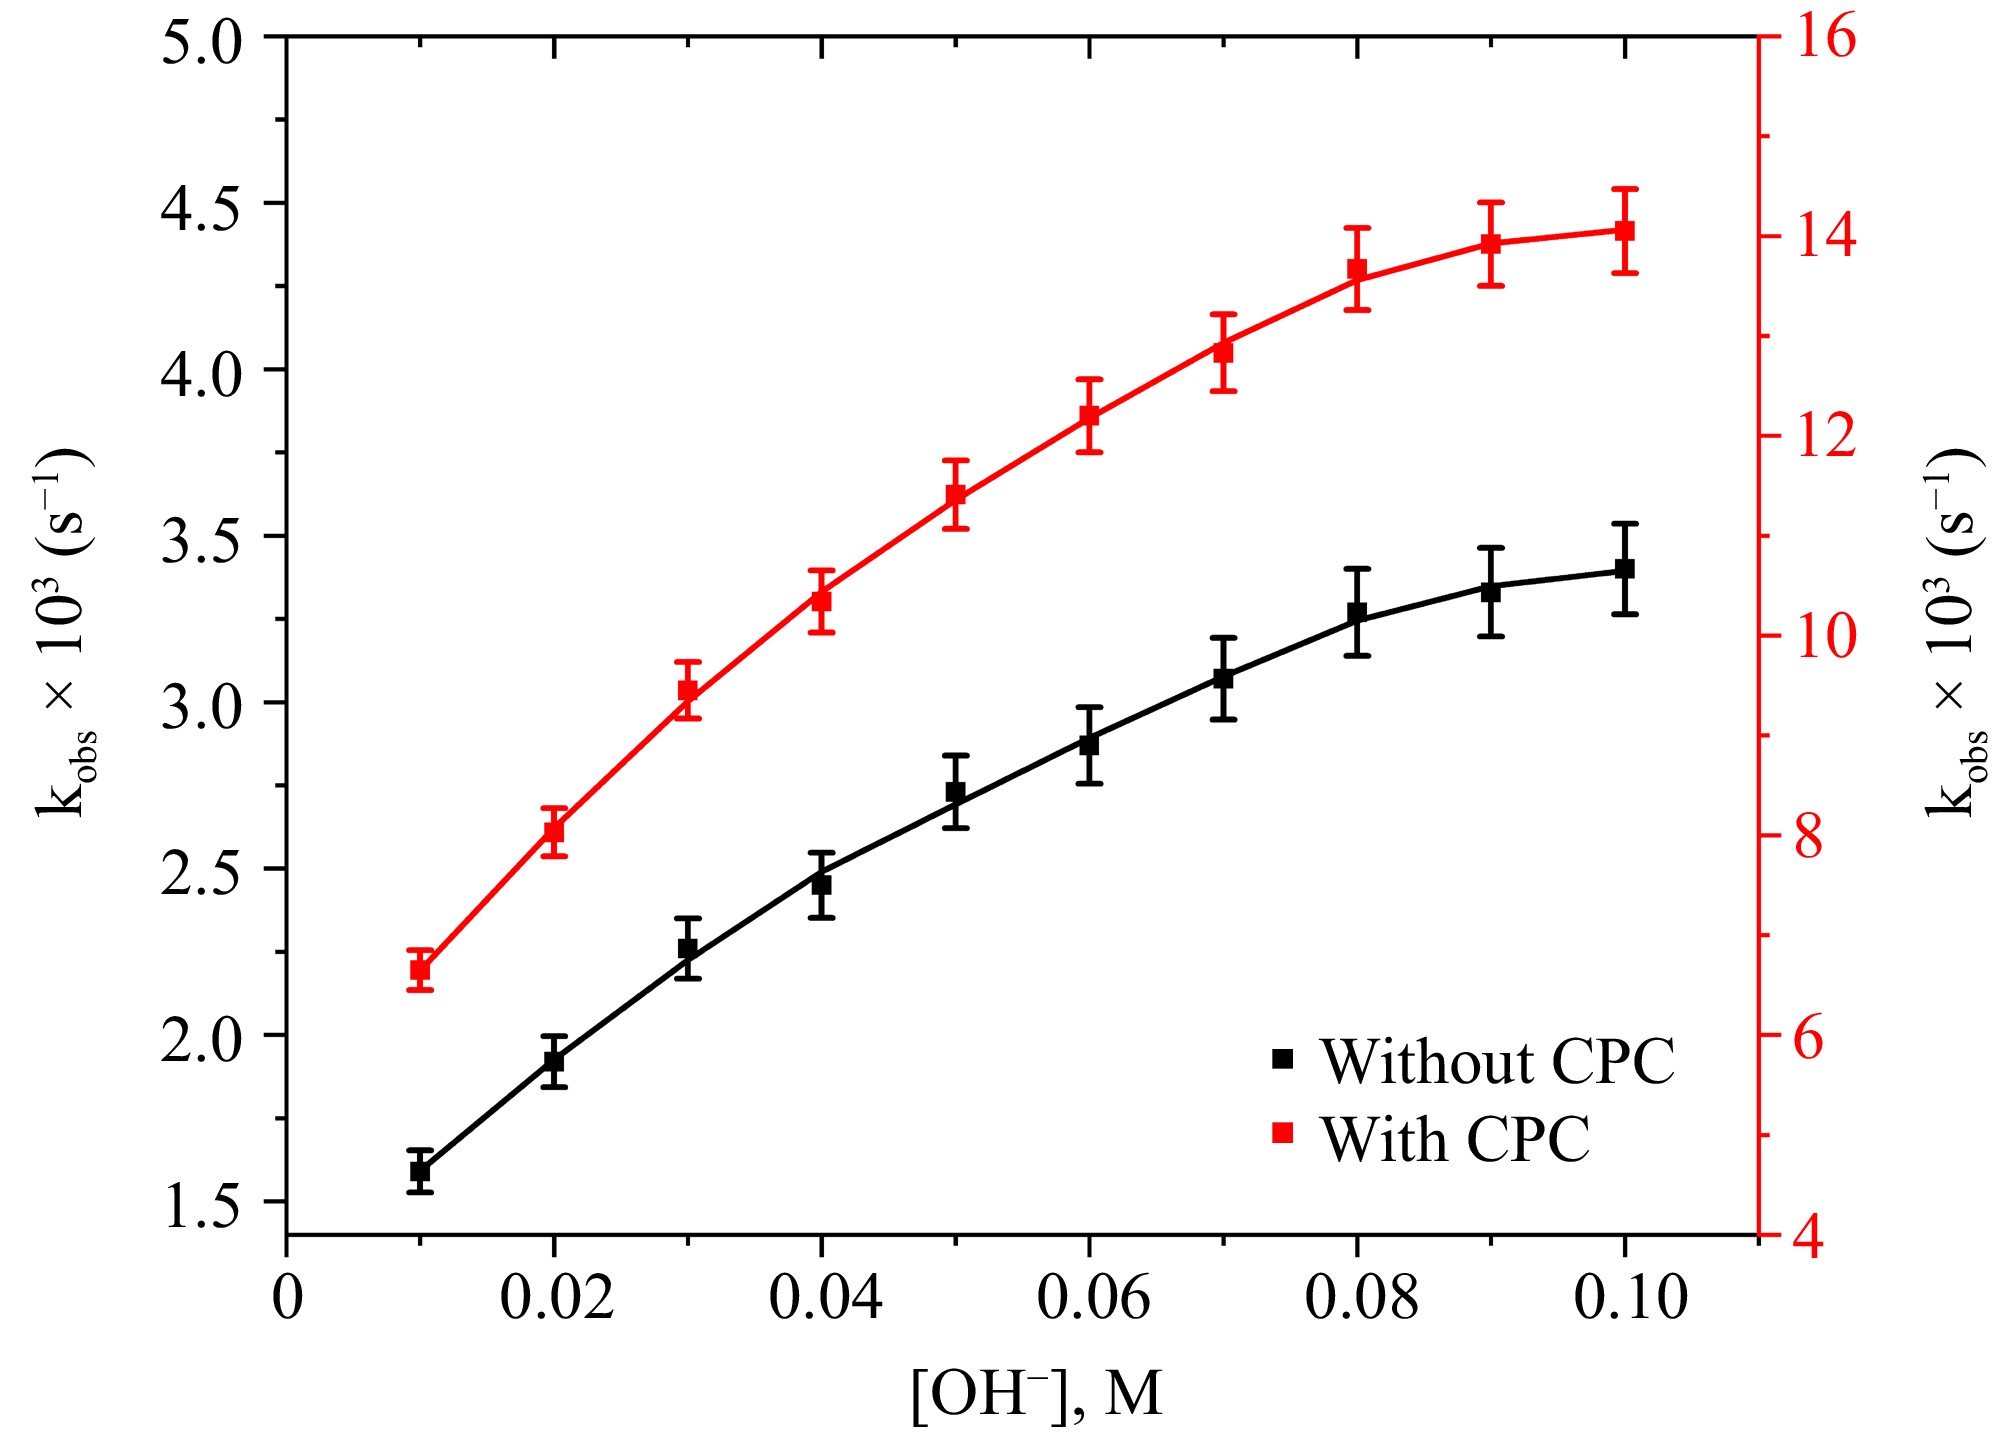
Figure 4.
The correlation between [OH−] and kobs at [DPC] = 1.75 × 10⁻⁵ M, [L-leucine] = 2.75 × 10⁻⁴ M, [Ru3+] = 2.5 × 10⁻⁶, I = 0.1 M (KNO3), Temp = 298 K, [IO4−] = 5.5 × 10⁻⁴ M, [CPC] = 6.0 × 10⁻³ M.
-
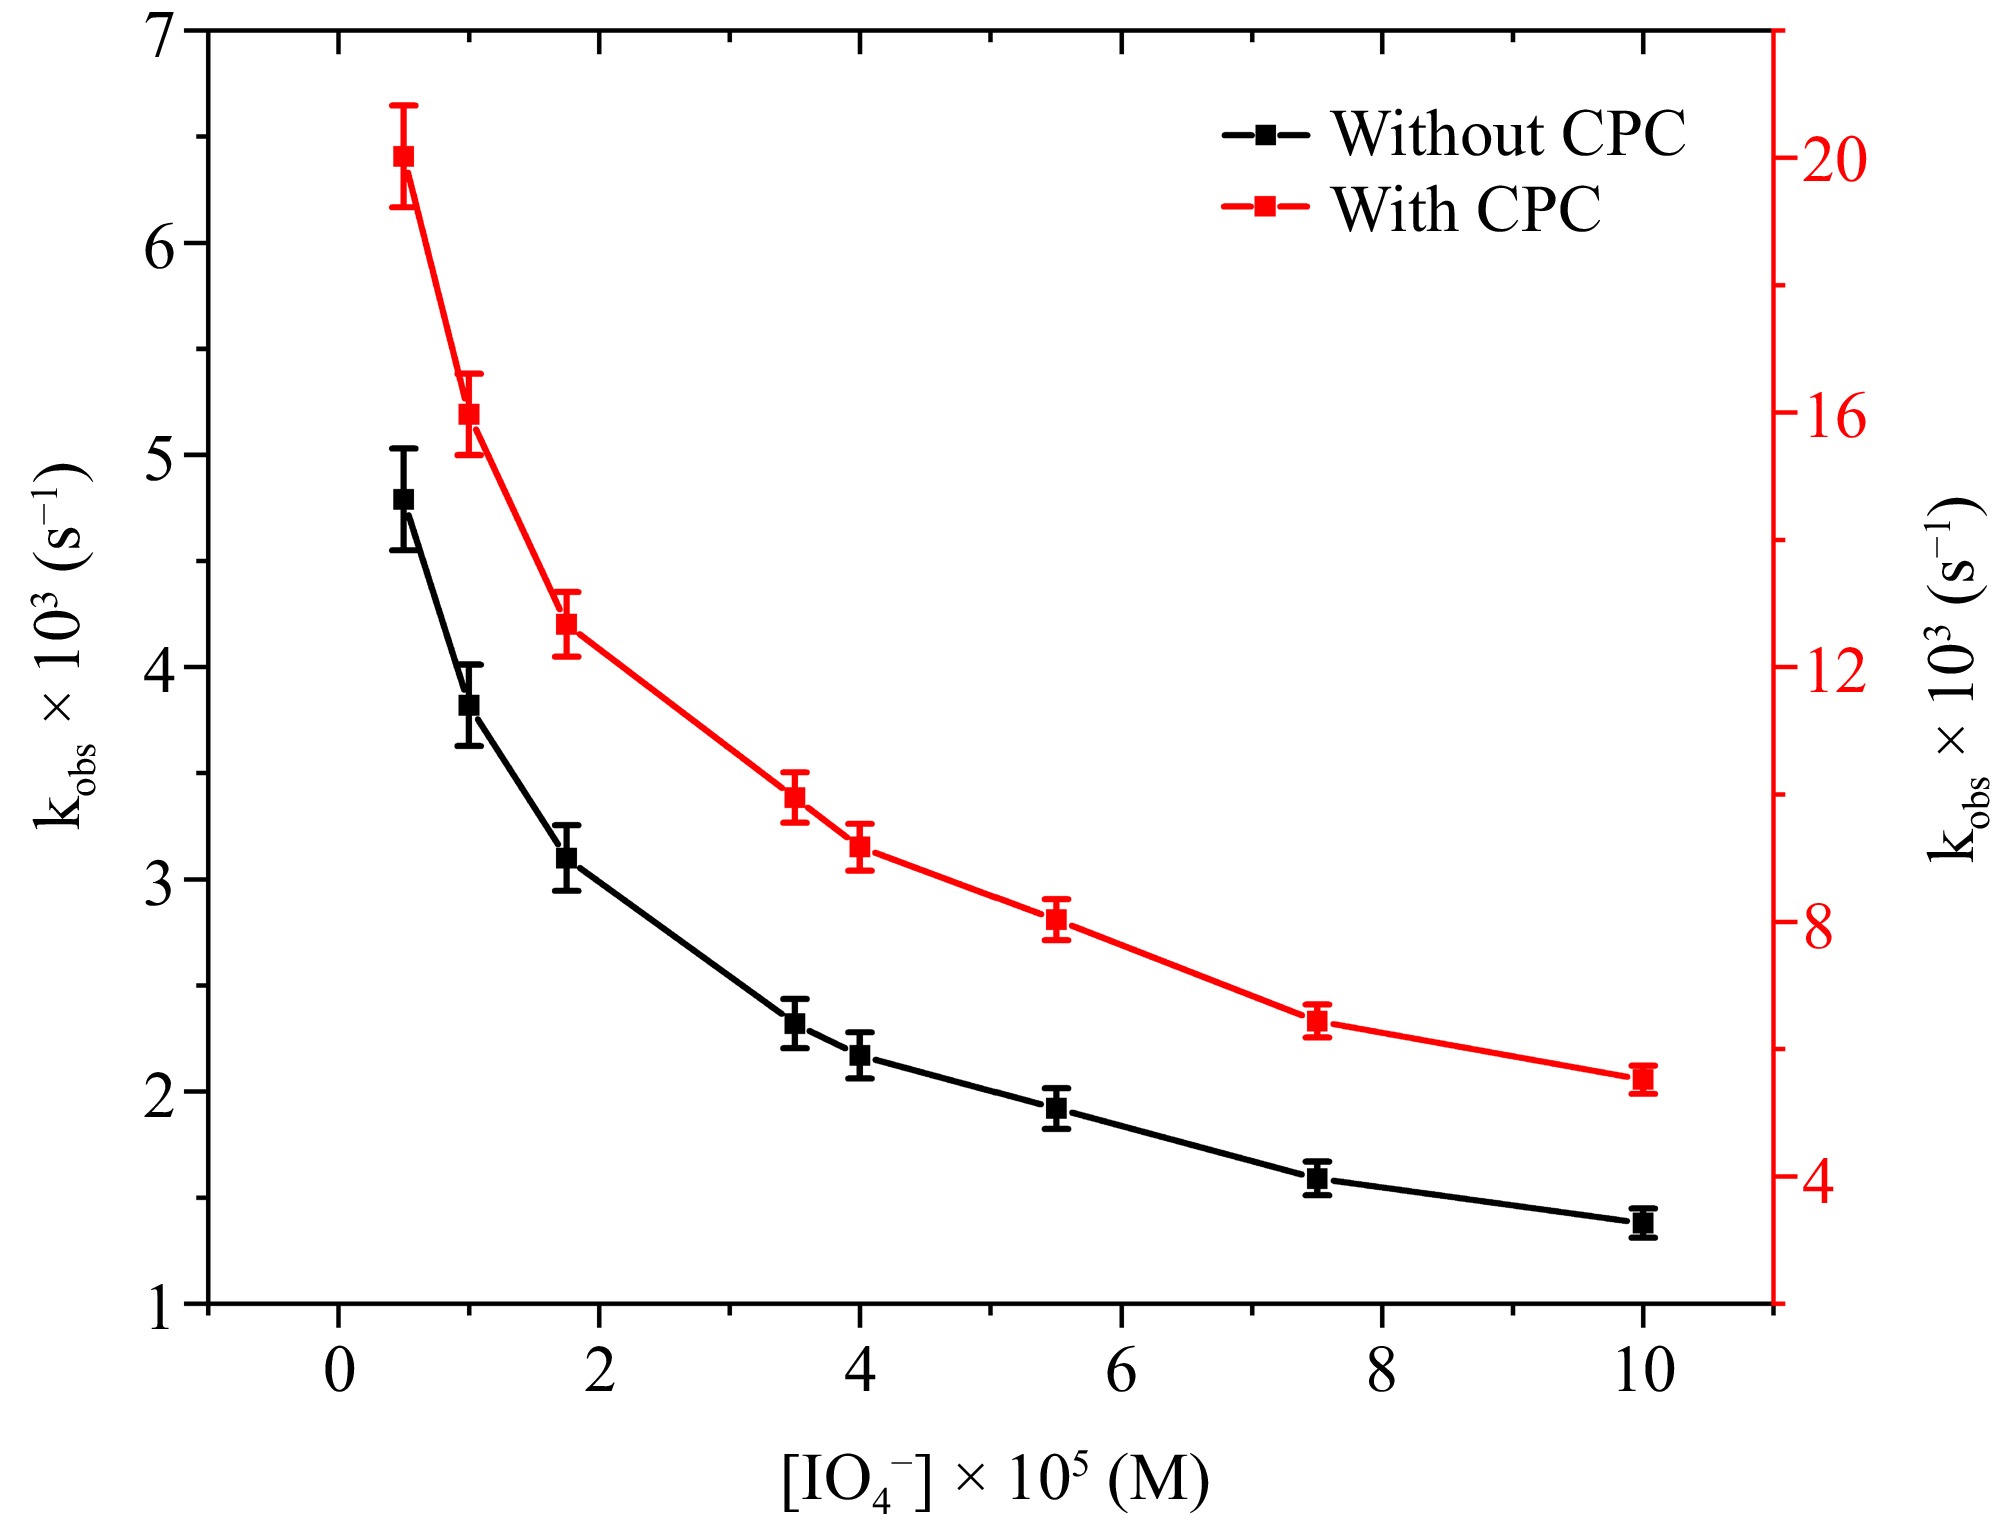
Figure 5.
The correlation between [IO4−] and kobs at [DPC] = 1.75 × 10⁻⁵ M, [L-leucine] = 2.75 × 10⁻⁴ M, [OH−] = 0.02 M, [Ru3+] = 2.5 × 10⁻⁶, I = 0.1 M (KNO3), Temp = 298 K, [CPC] = 6.0 × 10⁻³ M.
-
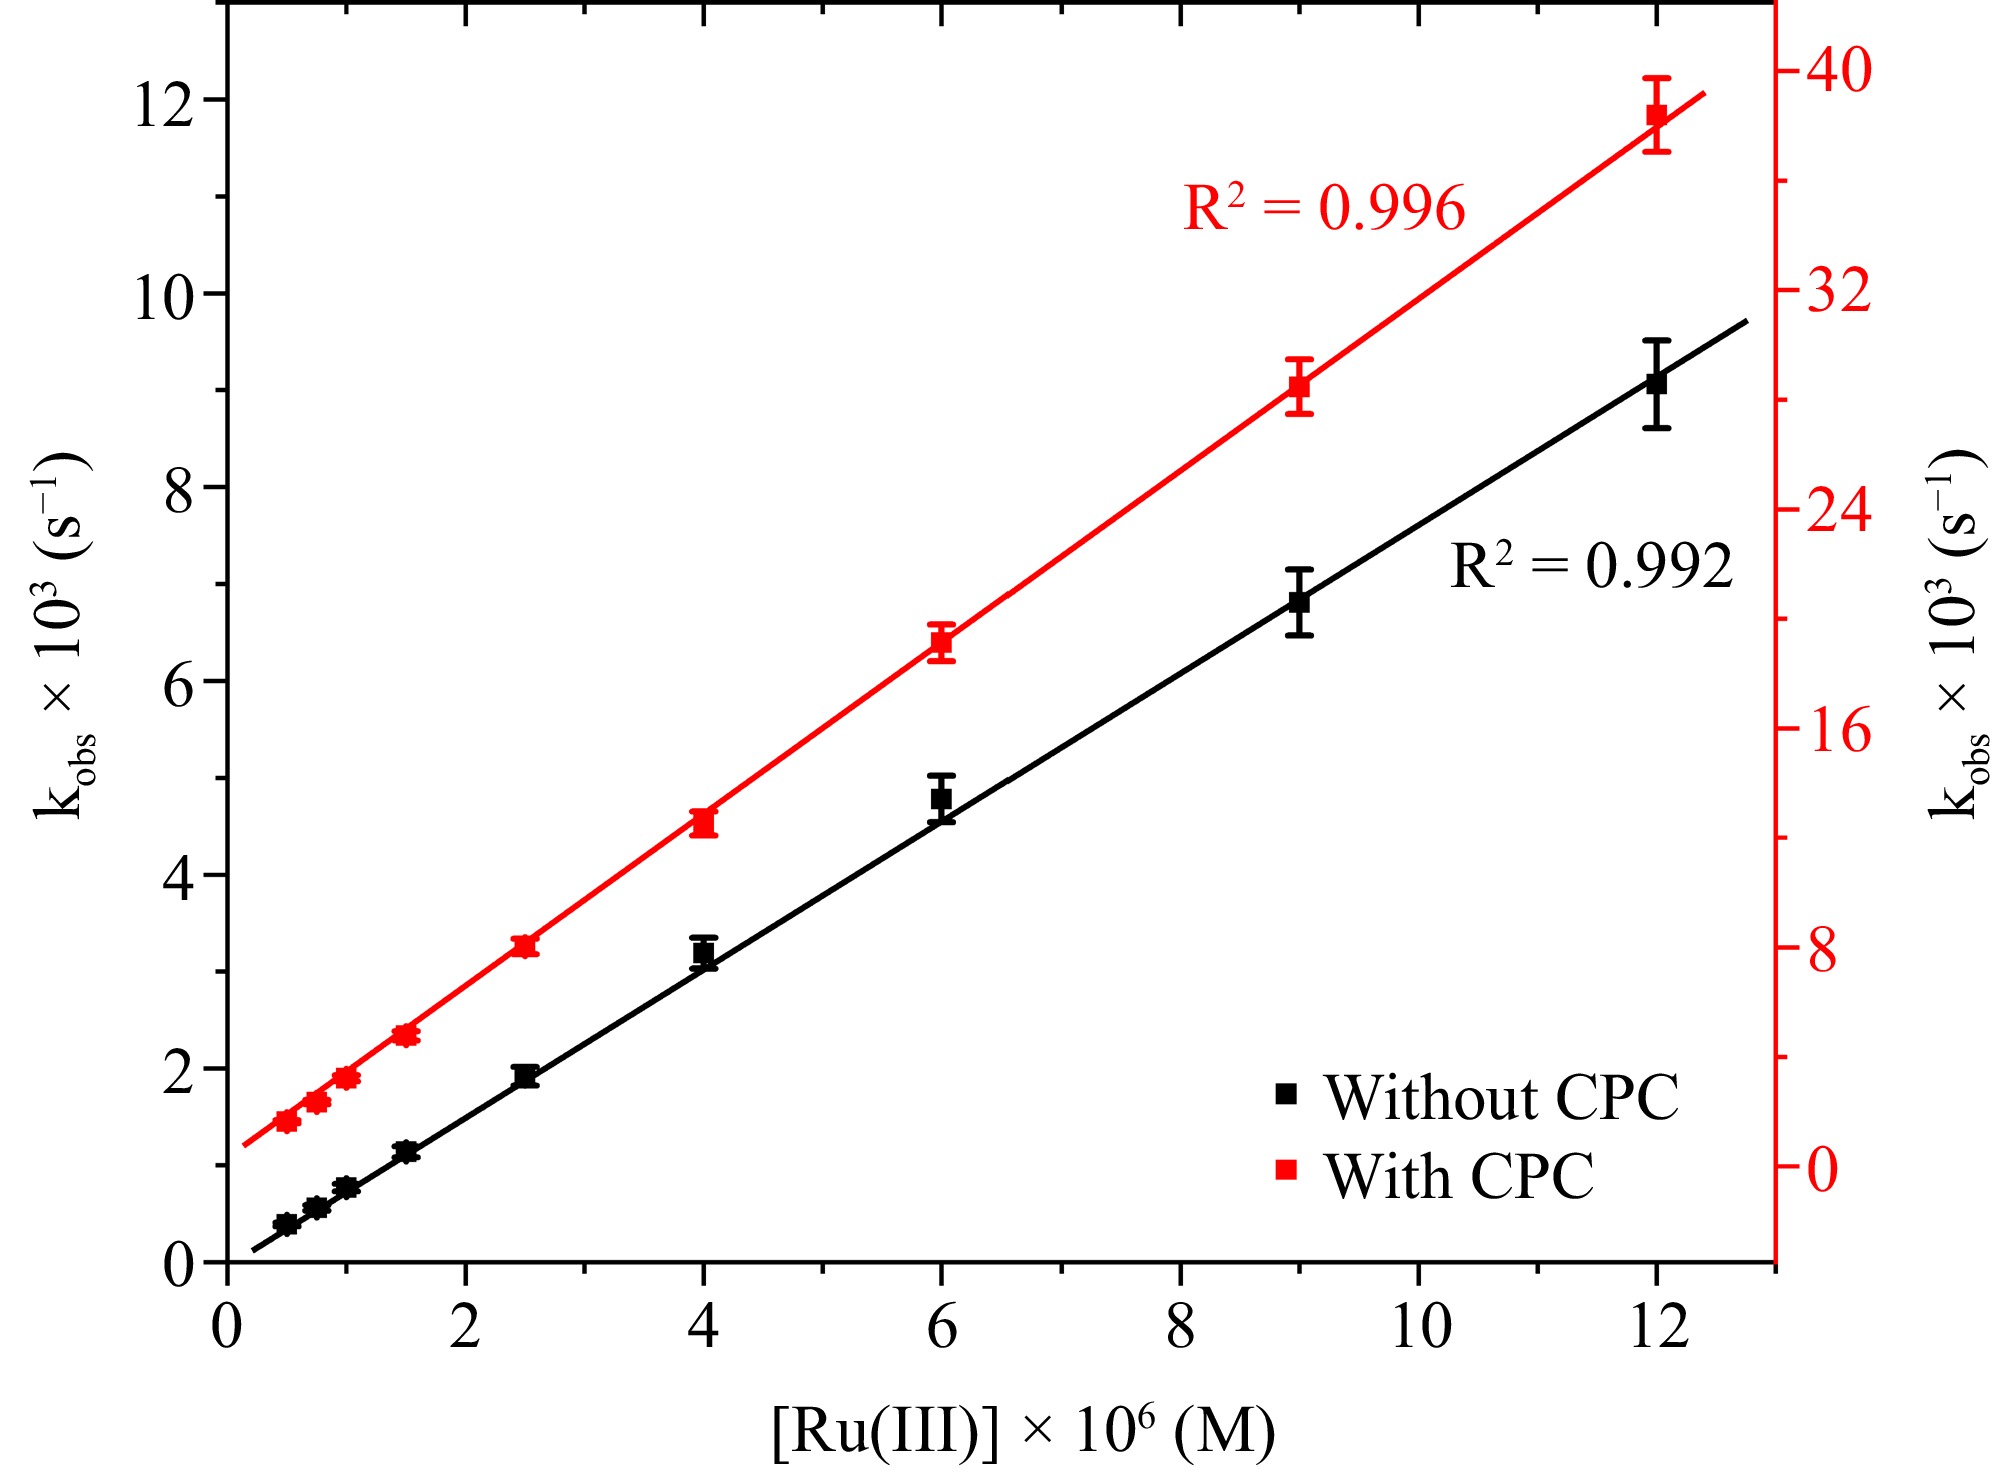
Figure 6.
The correlation between [Ru(III)] and kobs at [DPC] = 1.75 × 10⁻⁵ M, [L-leucine] = 2.75 × 10⁻⁴ M, [OH−] = 0.02 M, I = 0.1 M (KNO3), Temp = 298 K, [IO4−] = 5.5 × 10⁻⁴ M, [CPC] = 6.0 × 10⁻³ M.
-
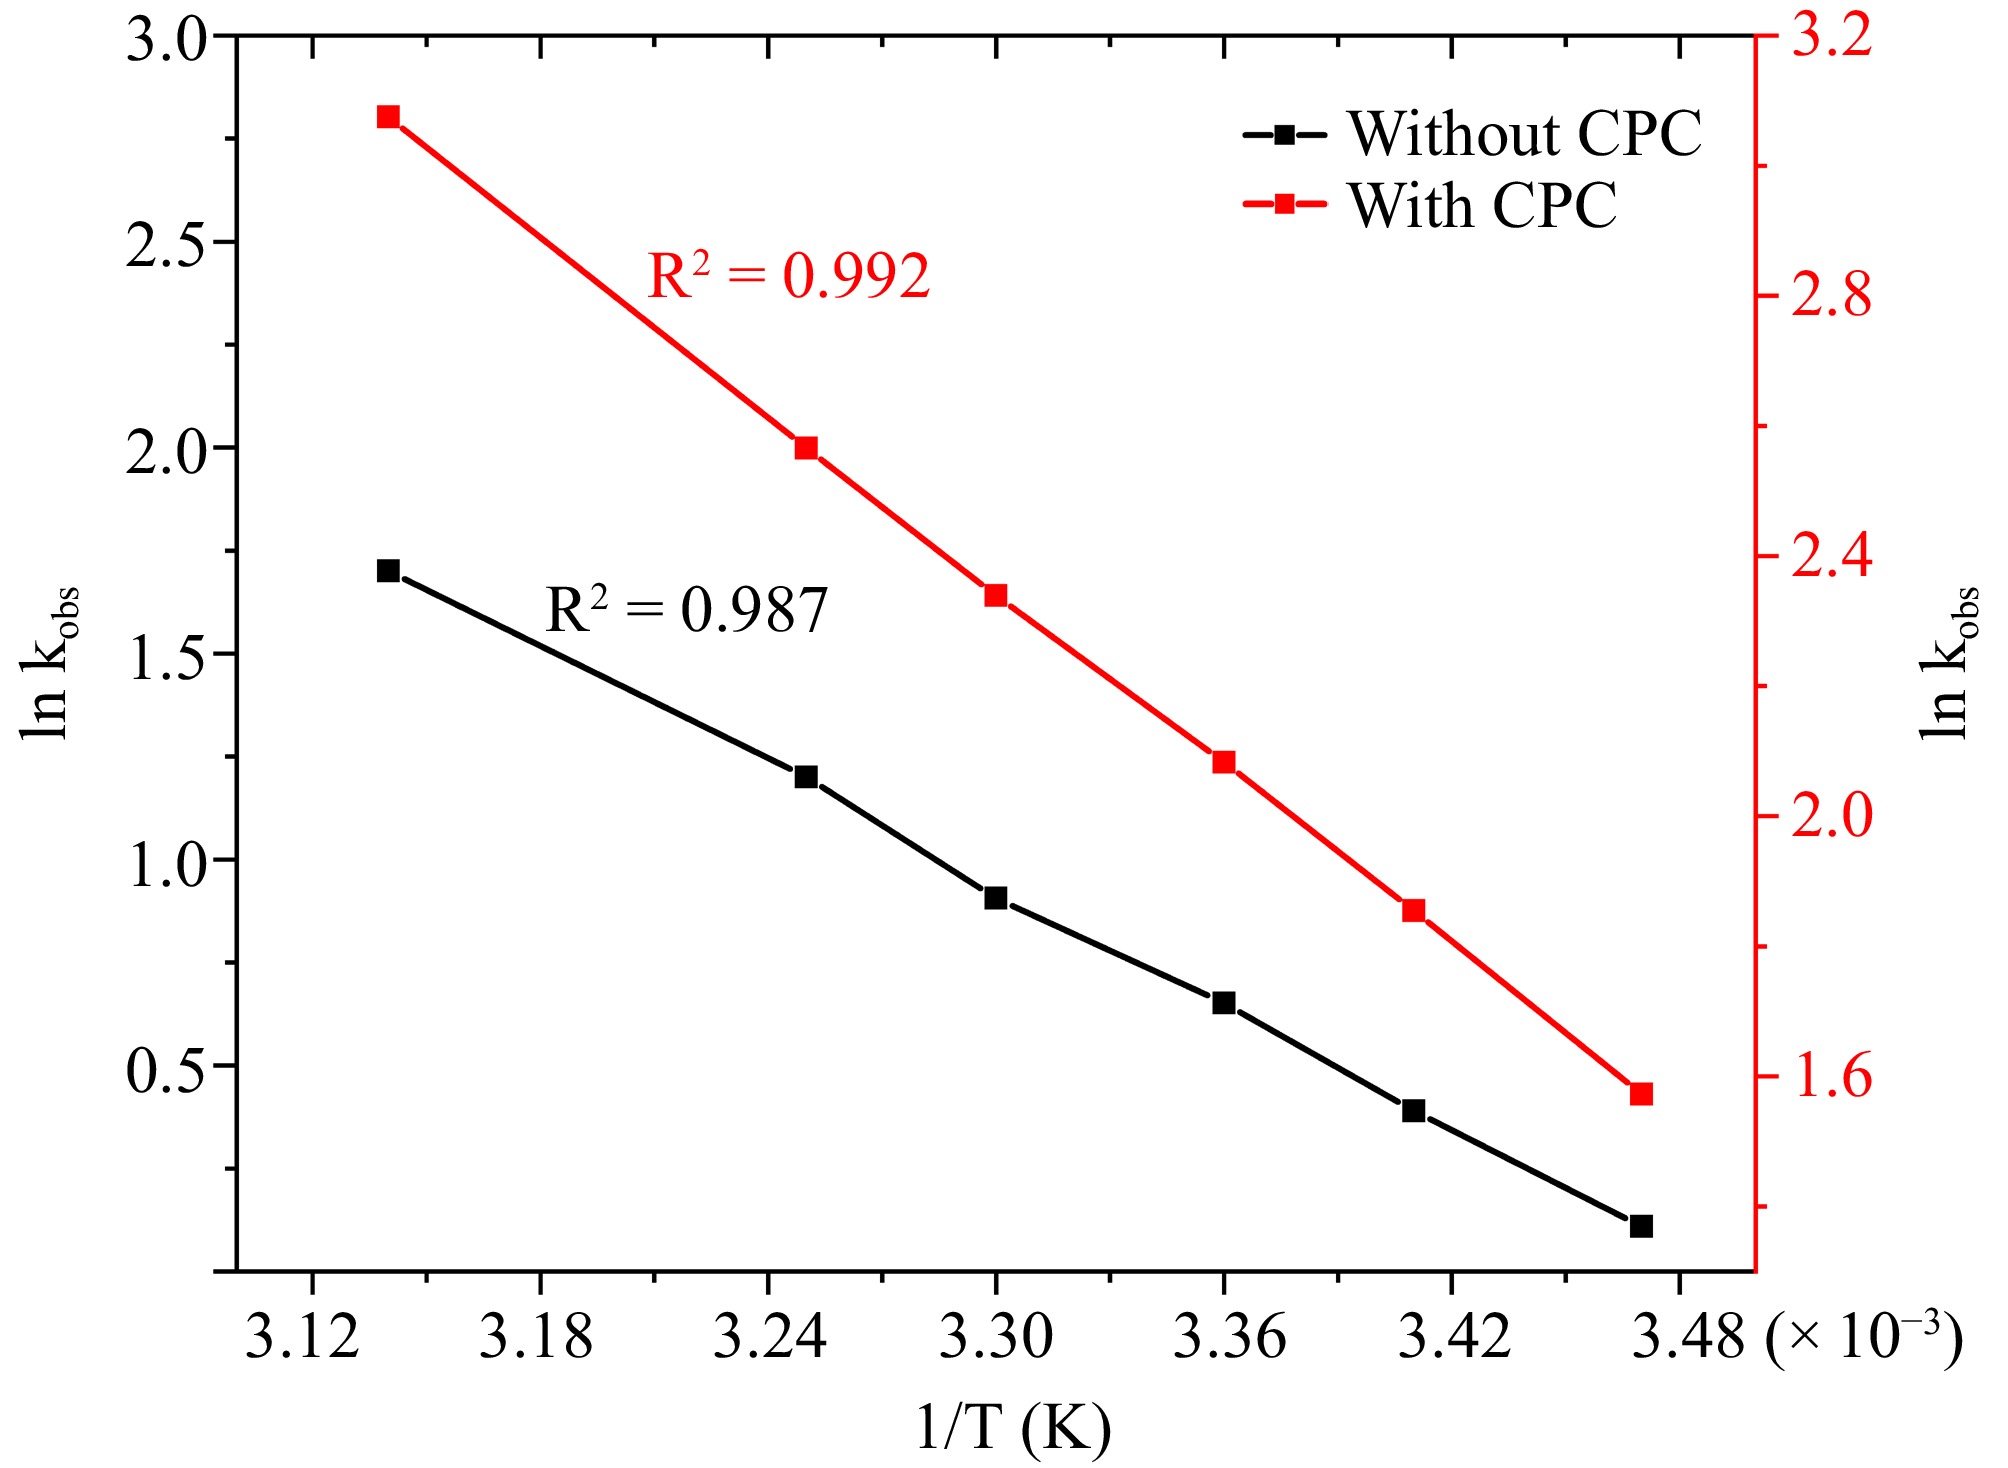
Figure 7.
The correlation between temperature and kobs at [DPC] = 1.75 × 10⁻⁵ M, [L-leucine] = 2.75 × 10⁻⁴ M, [OH−] = 0.02 M, [Ru3+] = 2.5 × 10⁻⁶, I = 0.1 M (KNO3), [IO4−] = 5.5 × 10⁻⁴ M, [CPC] = 6.0 × 10⁻³ M.
-
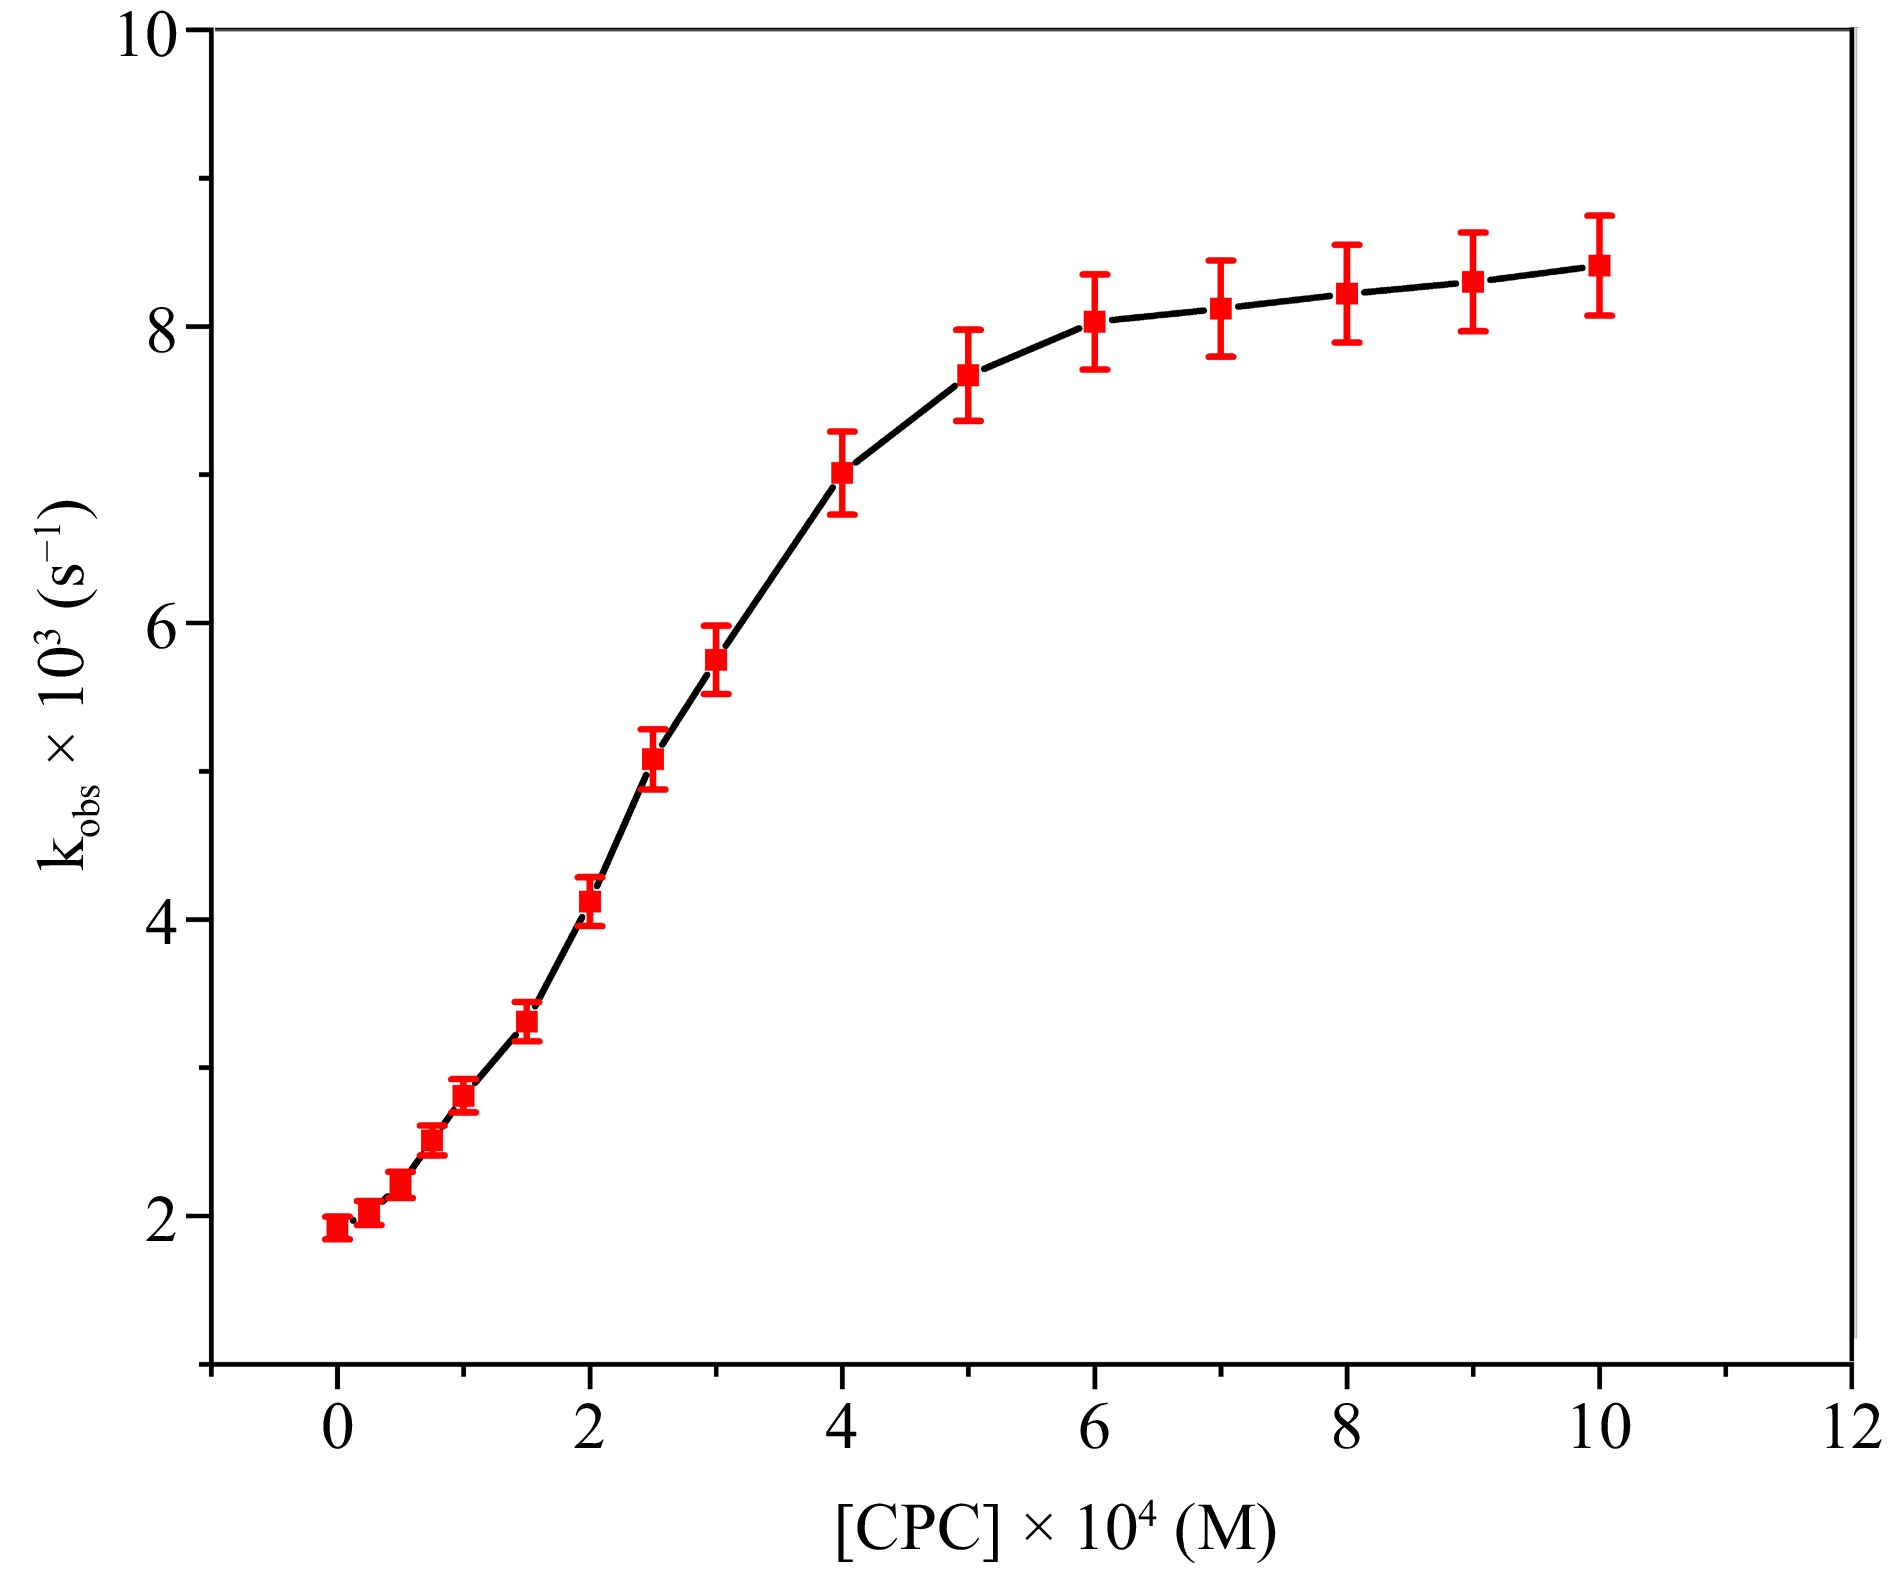
Figure 8.
The correlation between [CPC] and kobs at [DPC] = 1.75 × 10⁻⁵ M, [L-leucine] = 2.75 × 10⁻⁴ M, [OH−] = 0.02 M, [Ru3+] = 2.5 × 10⁻⁶, I = 0.1 M (KNO3), Temp = 298 K, [IO4−] = 5.5 × 10⁻⁴ M.
-
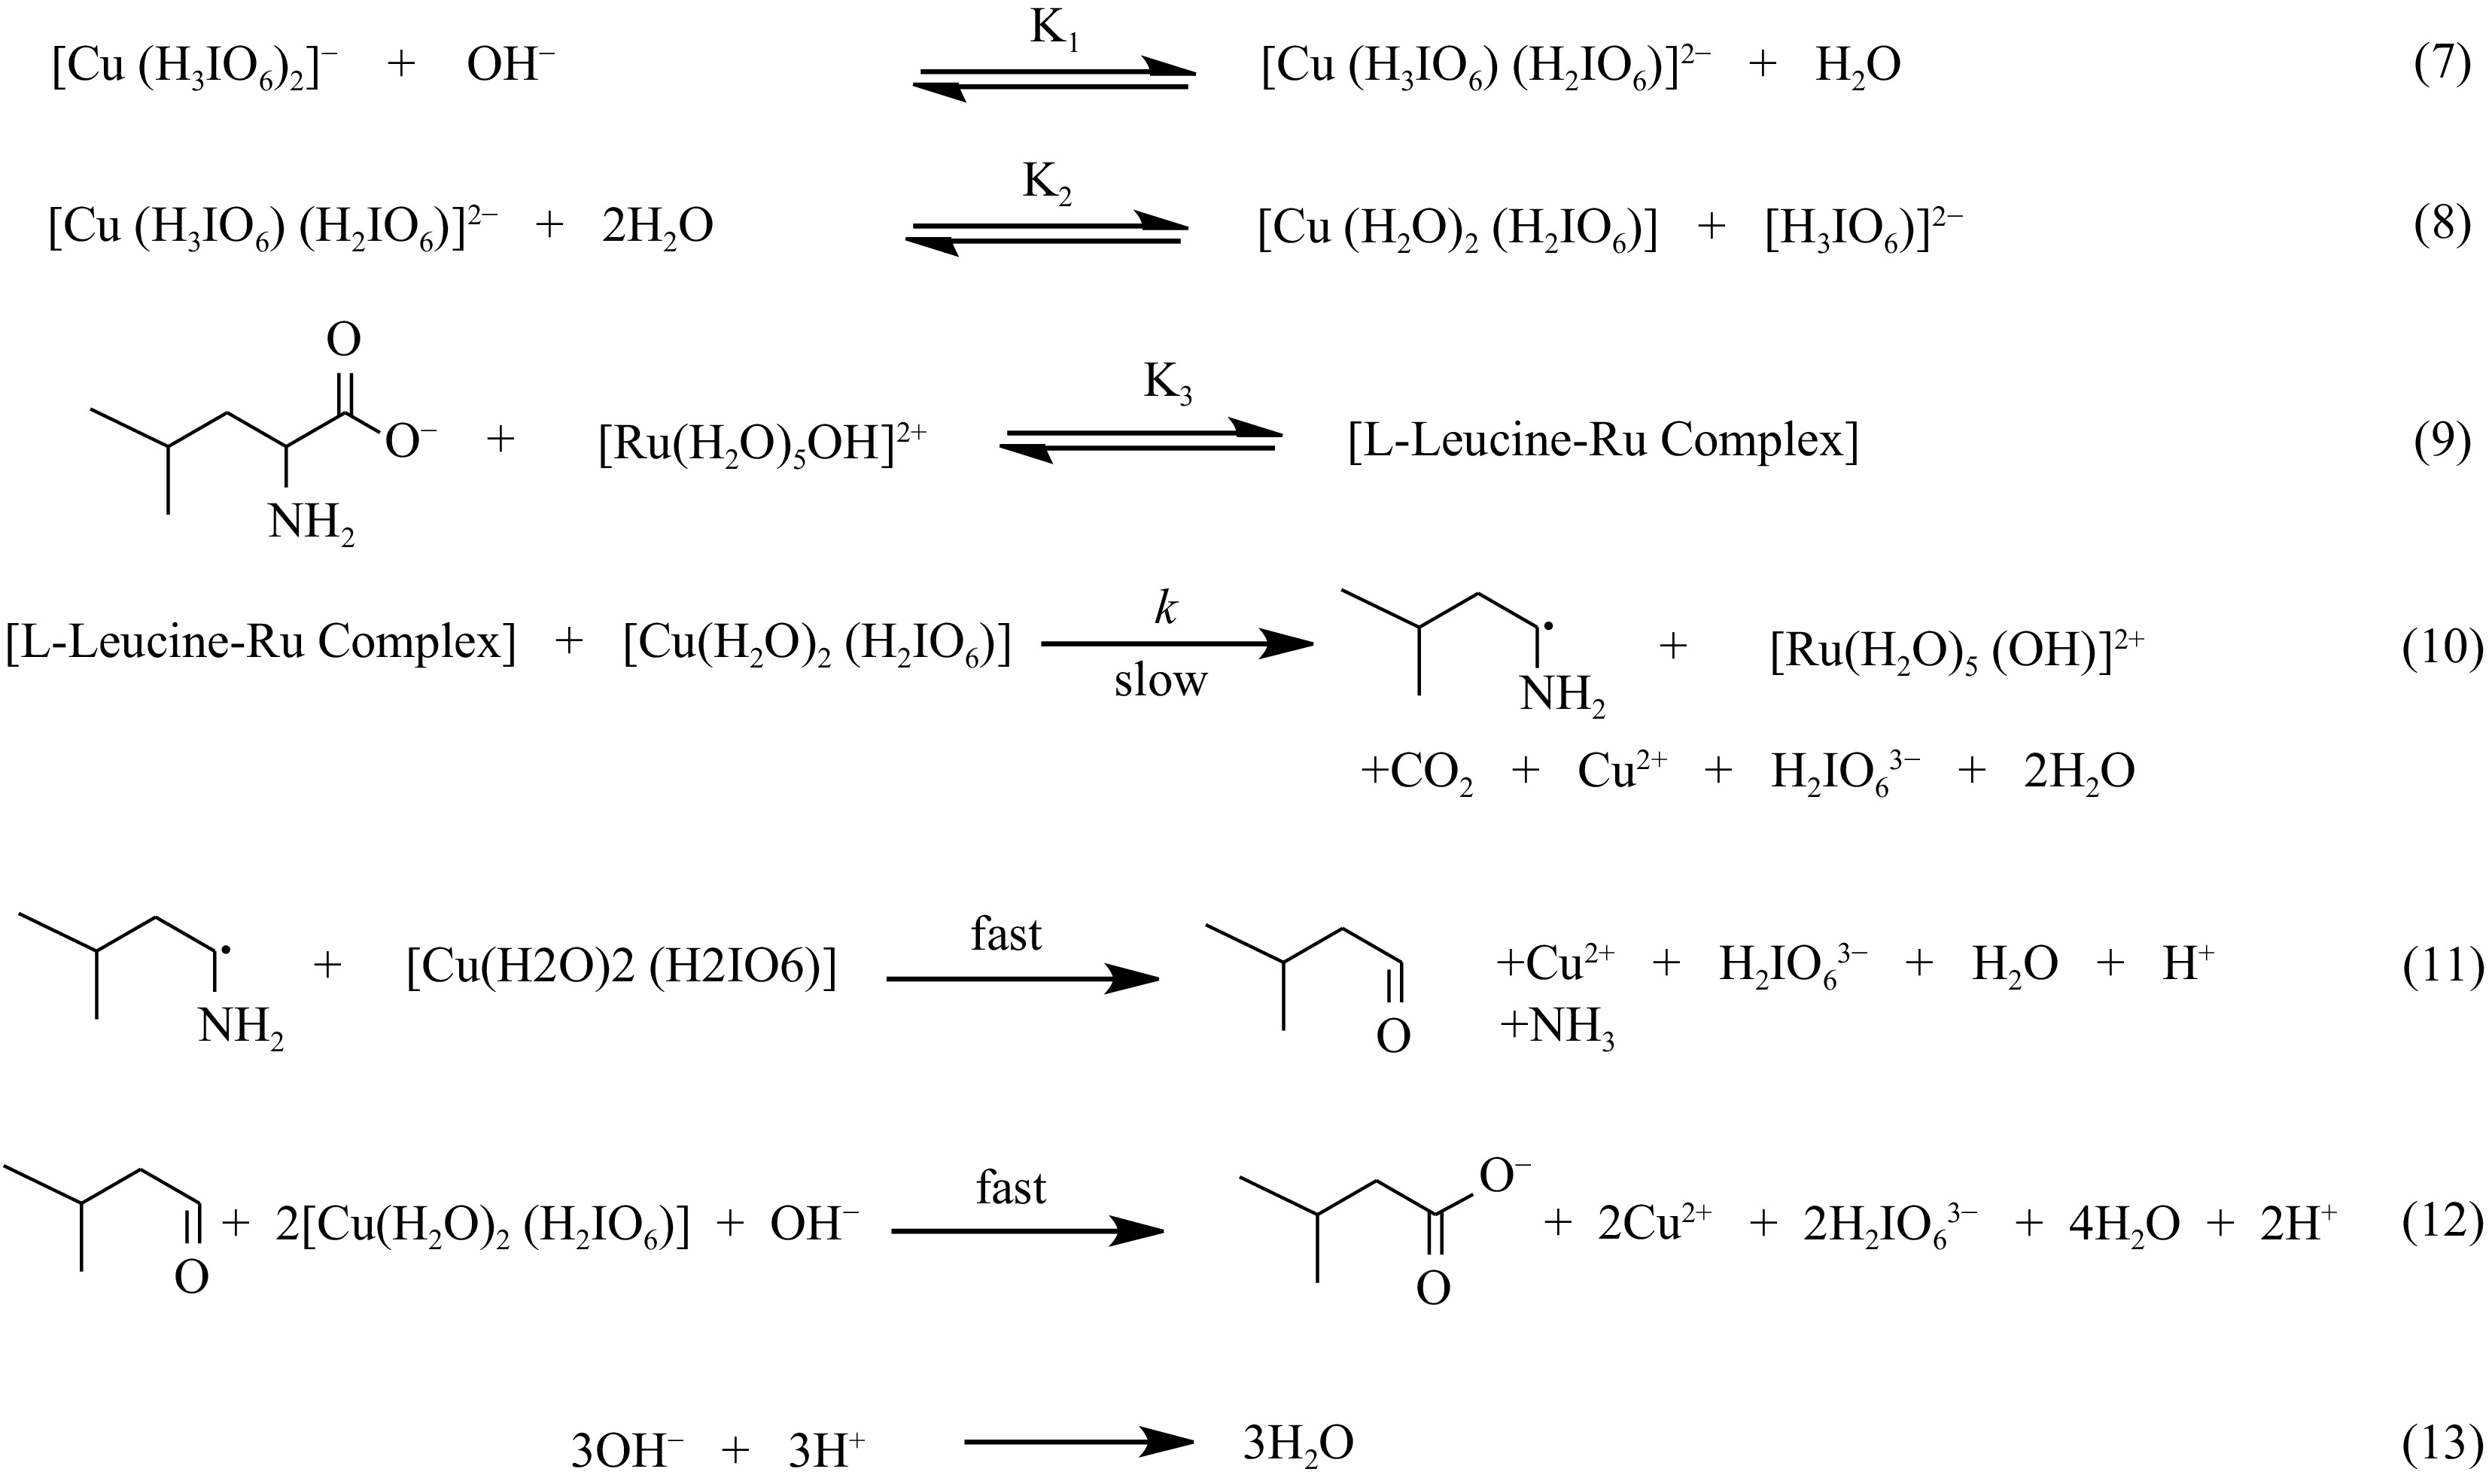
Figure 9.
Mechanism of Ru(III) facilitated oxidation of L-leucine by DPC.
-
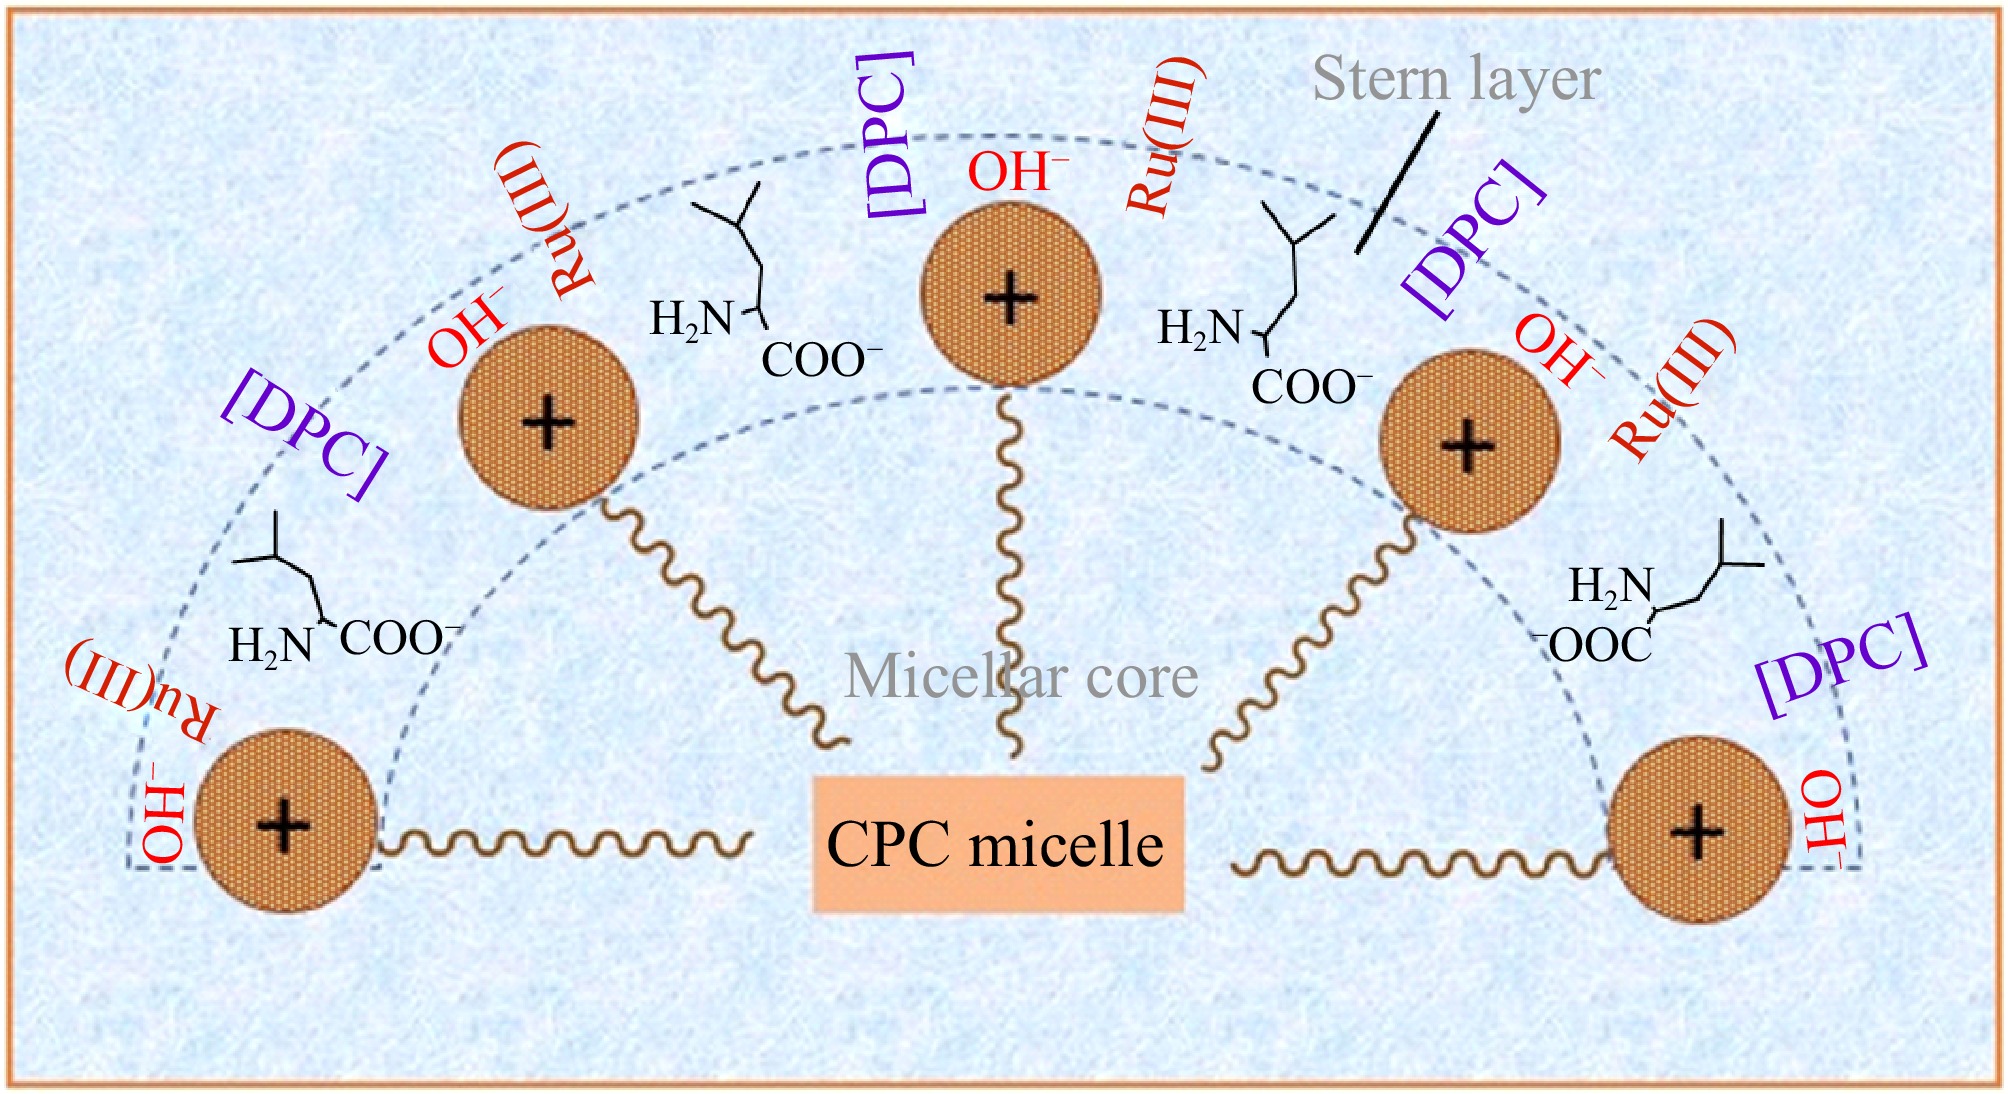
Figure 10.
Conceptual illustration of Ru(III) mediated L-leucine Oxidation by DPC in CPC micellar medium.
-
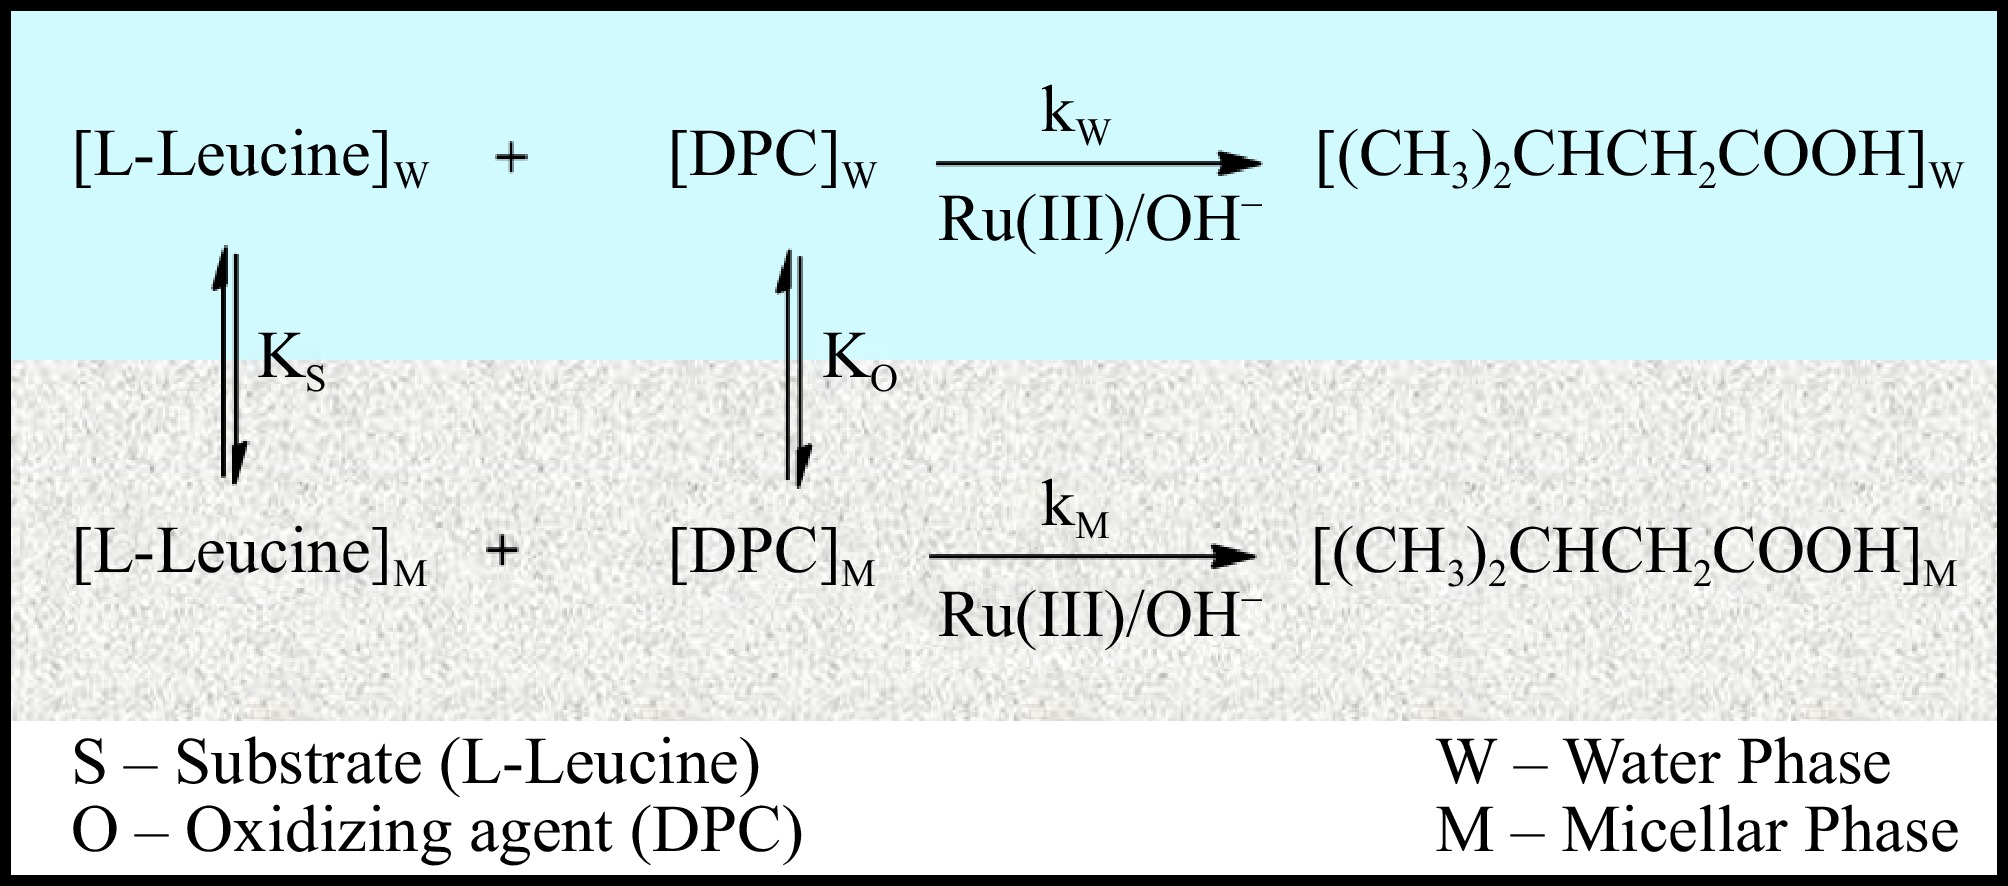
Figure 11.
Pseudophase model for the Ru(III) mediated L-leucine Oxidation by DPC in CPC micellar medium.
-
[DPC] × 105 (M) kobs × 103 (s−1) (without CPC) kobs × 103 (s−1) (with CPC) 1.75 1.92 ± 0.06 8.03 ± 0.16 3.0 1.98 ± 0.09 8.09 ± 0.19 6.0 2.01 ± 0.05 7.95 ± 0.21 9.0 1.96 ± 0.07 8.11 ± 0.11 12.0 1.86 ± 0.08 7.92 ± 0.16 15.0 1.89 ± 0.06 8.13 ± 0.18 17.5 1.95 ± 0.04 8.07 ± 0.14 Table 1.
Effect of variation of [DPC] on rate constant (kobs) at [L-leucine] = 2.75 × 10⁻⁴ M, [OH−] = 0.02 M, [Ru3+] = 2.5 × 10⁻⁶, I = 0.1 M (KNO3), Temp = 298 K, [IO4−] = 5.5 × 10⁻⁴ M, [CPC] = 6.0 × 10⁻³ M.
-
I (KNO3), M kobs × 103, s−1
(without CPC)kobs × 103, s−1
(with CPC)0.05 2.01 ± 0.09 8.07 ± 0.14 0.10 1.92 ± 0.06 8.03 ± 0.16 0.20 1.98 ± 0.04 8.00 ± 0.19 0.30 1.97 ± 0.10 7.97 ± 0.20 0.40 1.86 ± 0.08 7.94 ± 0.21 0.50 1.93 ± 0.07 8.03 ± 0.12 Table 2.
Effect of variation of [Electrolyte] on rate constant (kobs) at [DPC] = 1.75 × 10⁻⁵ M, [L-leucine] = 2.75 × 10⁻⁴ M, [OH−] = 0.02 M, [Ru3+] = 2.5 × 10⁻⁶, Temp = 298 K, [IO4−] = 5.5 × 10⁻⁴ M, [CPC] = 6.0 × 10⁻³ M.
Figures
(11)
Tables
(2)