-
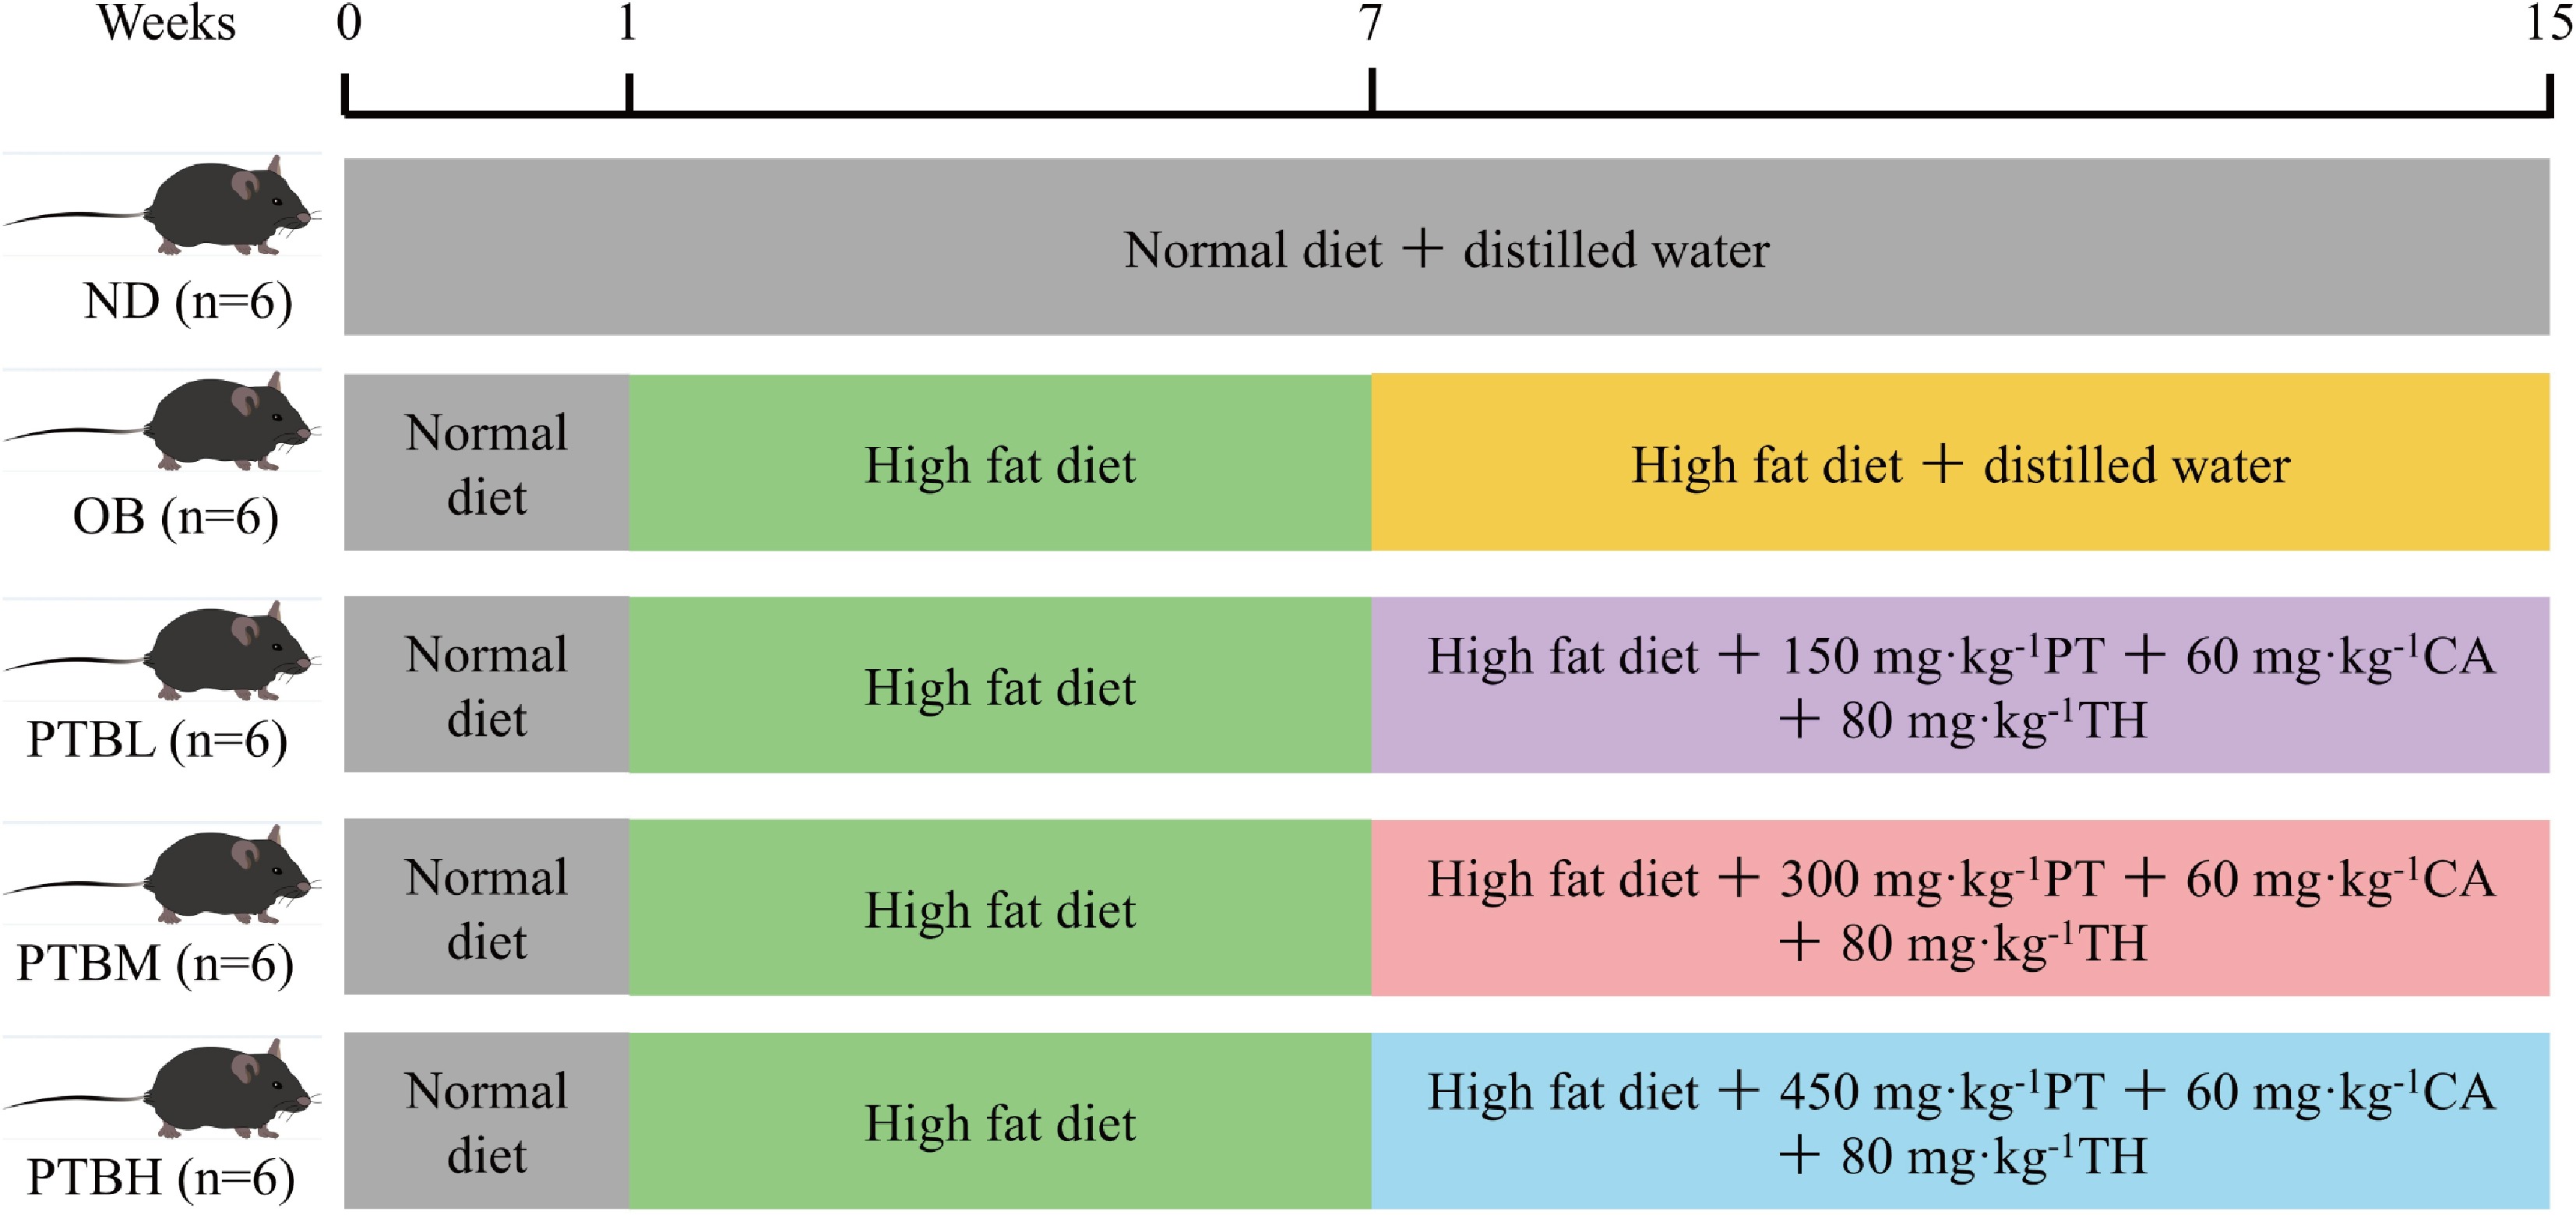
Figure 1.
Mouse experimental grouping diagram. ND group, normal diet group; OB group, obesity model group; PTBL group, low-dose Pu-erh tea solid beverage intervention group; PTBM group, middle dose of Pu-erh tea solid beverage intervention group; PTBH group, high-dose Pu-erh tea solid beverage intervention group; PT, Pu-erh tea extract; CA, green tea catechin; TH, theanine; n = 6.
-
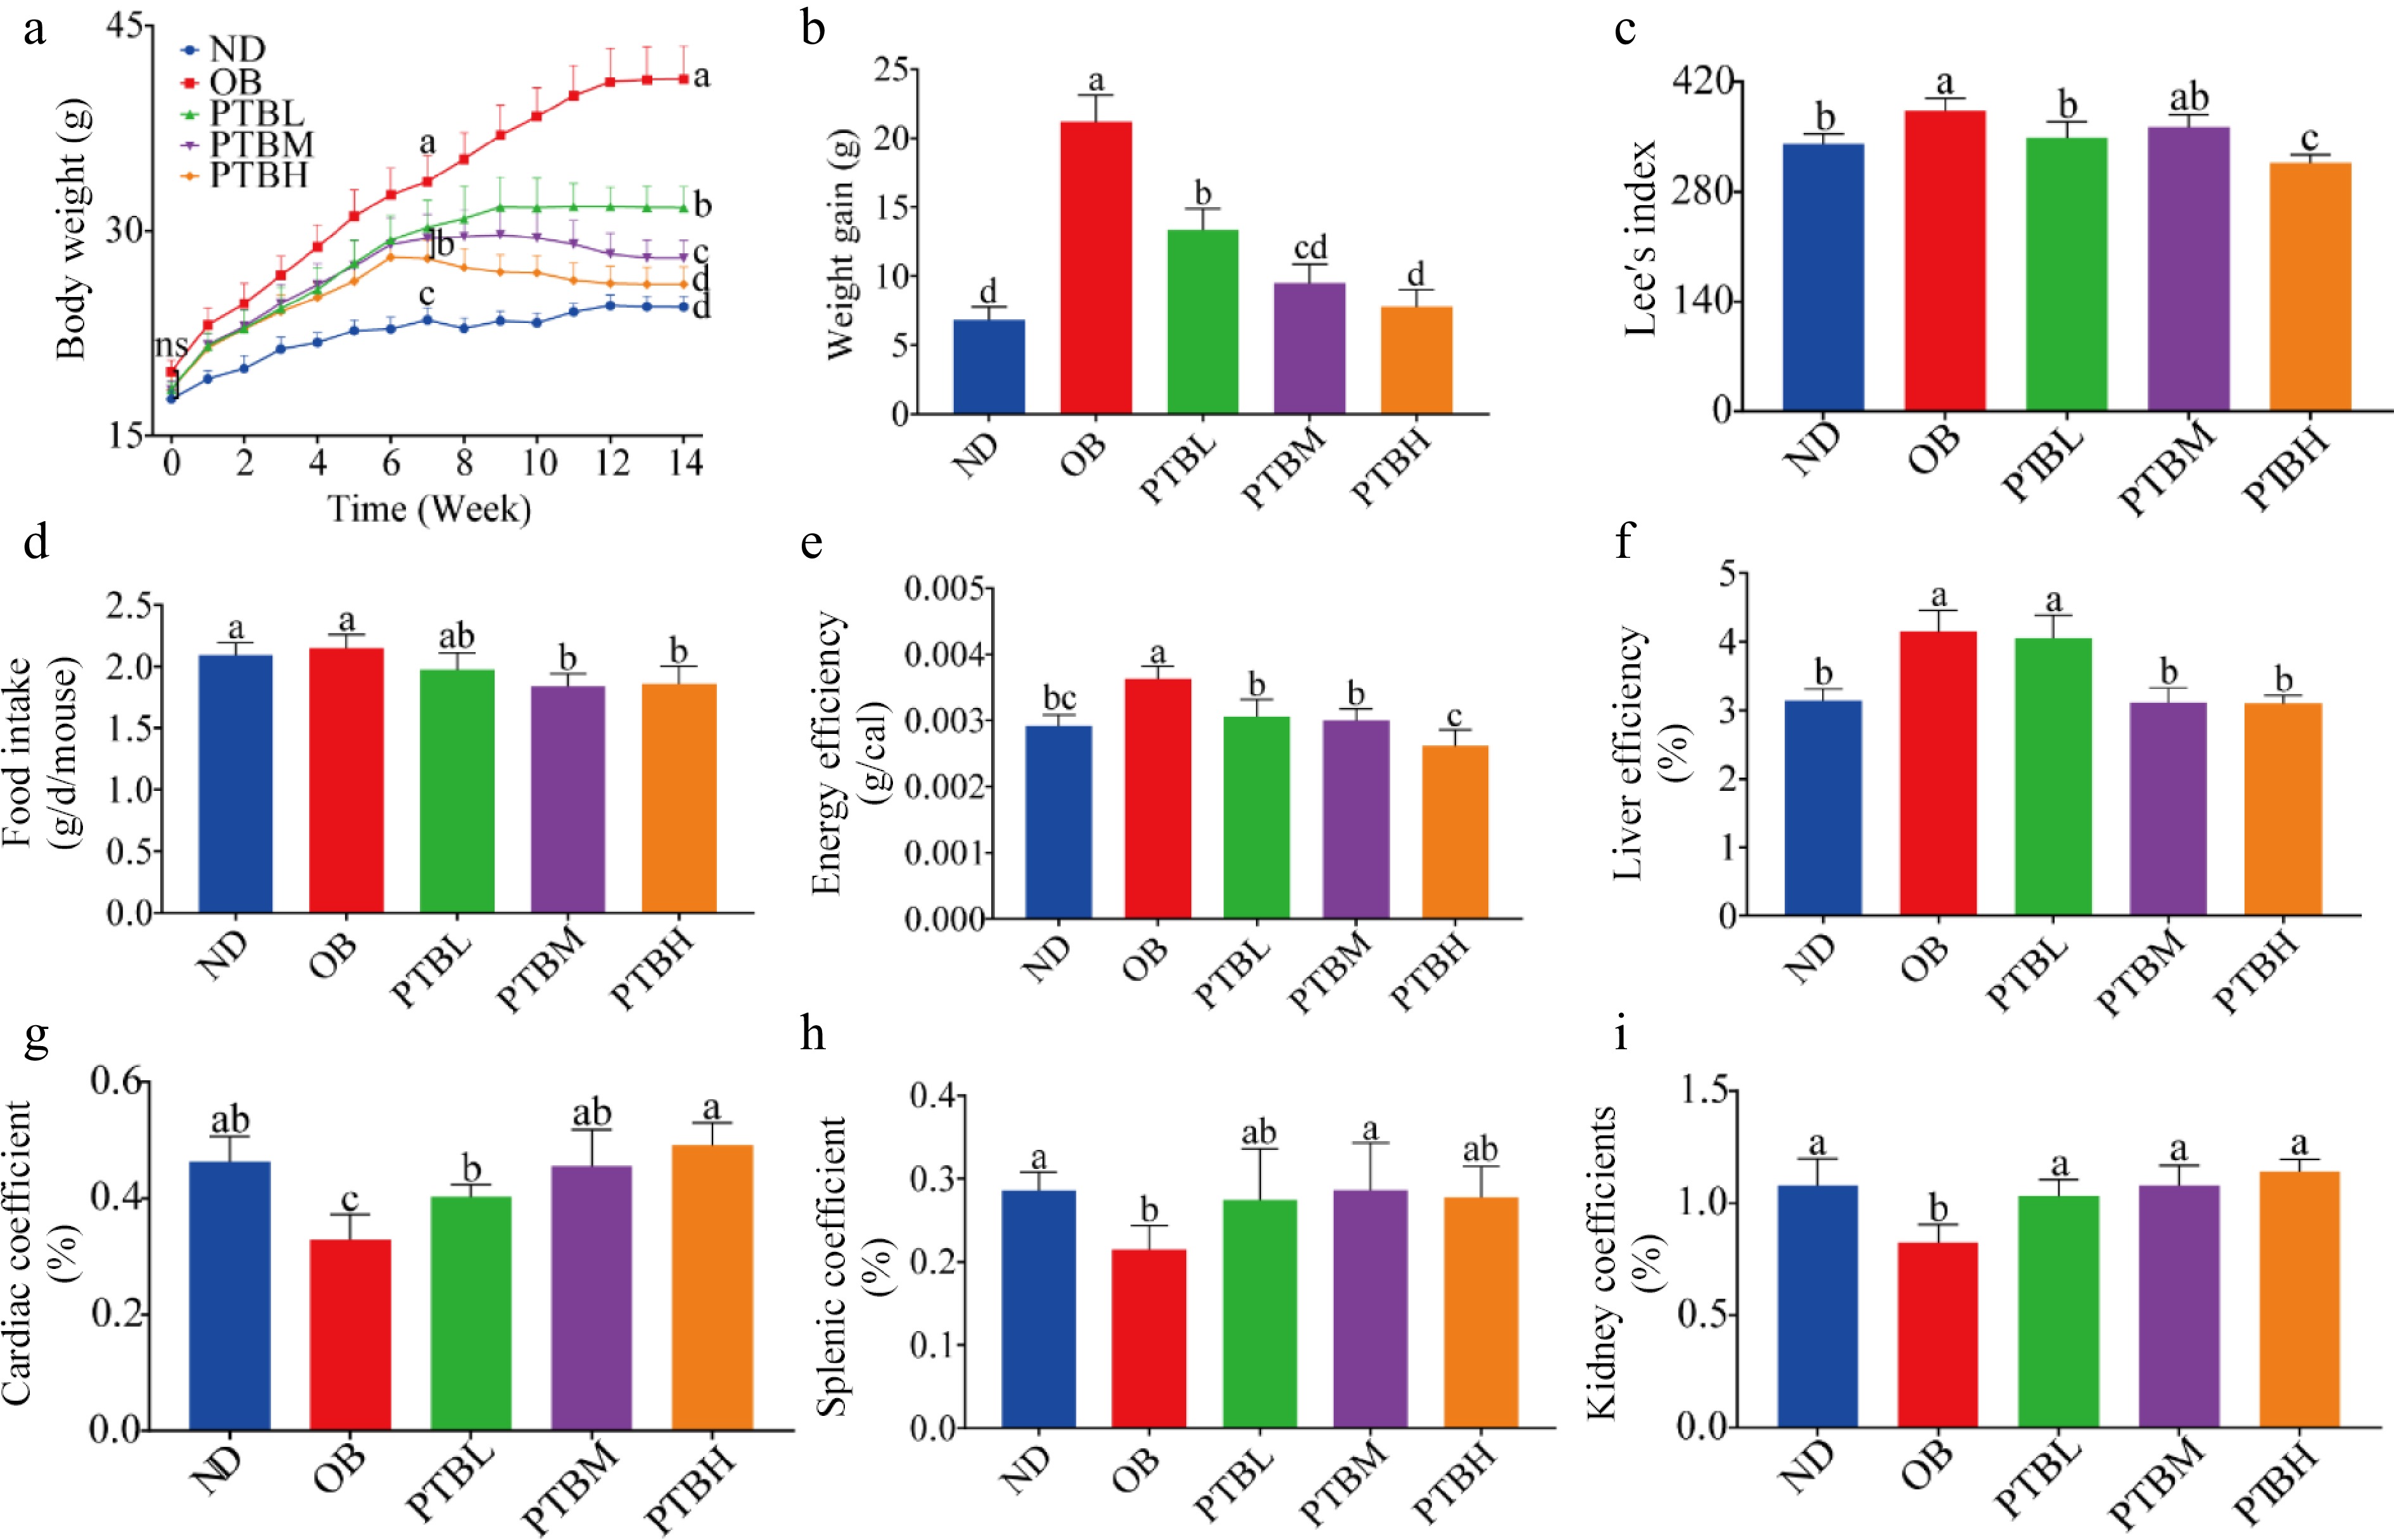
Figure 2.
Effects of PTB on body weight, food intake, and organ index of high-fat diet mice. ND group, normal diet group; OB group, obesity model group; PTBL group, low-dose Pu-erh tea solid beverage intervention group; PTBM group, middle dose of Pu-erh tea solid beverage intervention group; PTBH group, high-dose Pu-erh tea solid beverage intervention group. (a) Changes in body weight of mice; (b) Weight gain of mice; (c) Lee's index; (d) Food intake; (e) Energy efficiency; (f) Liver coefficient; (g) Cardiac coefficient; (h) Spleen coefficient; (i) Kidney coefficient.
-
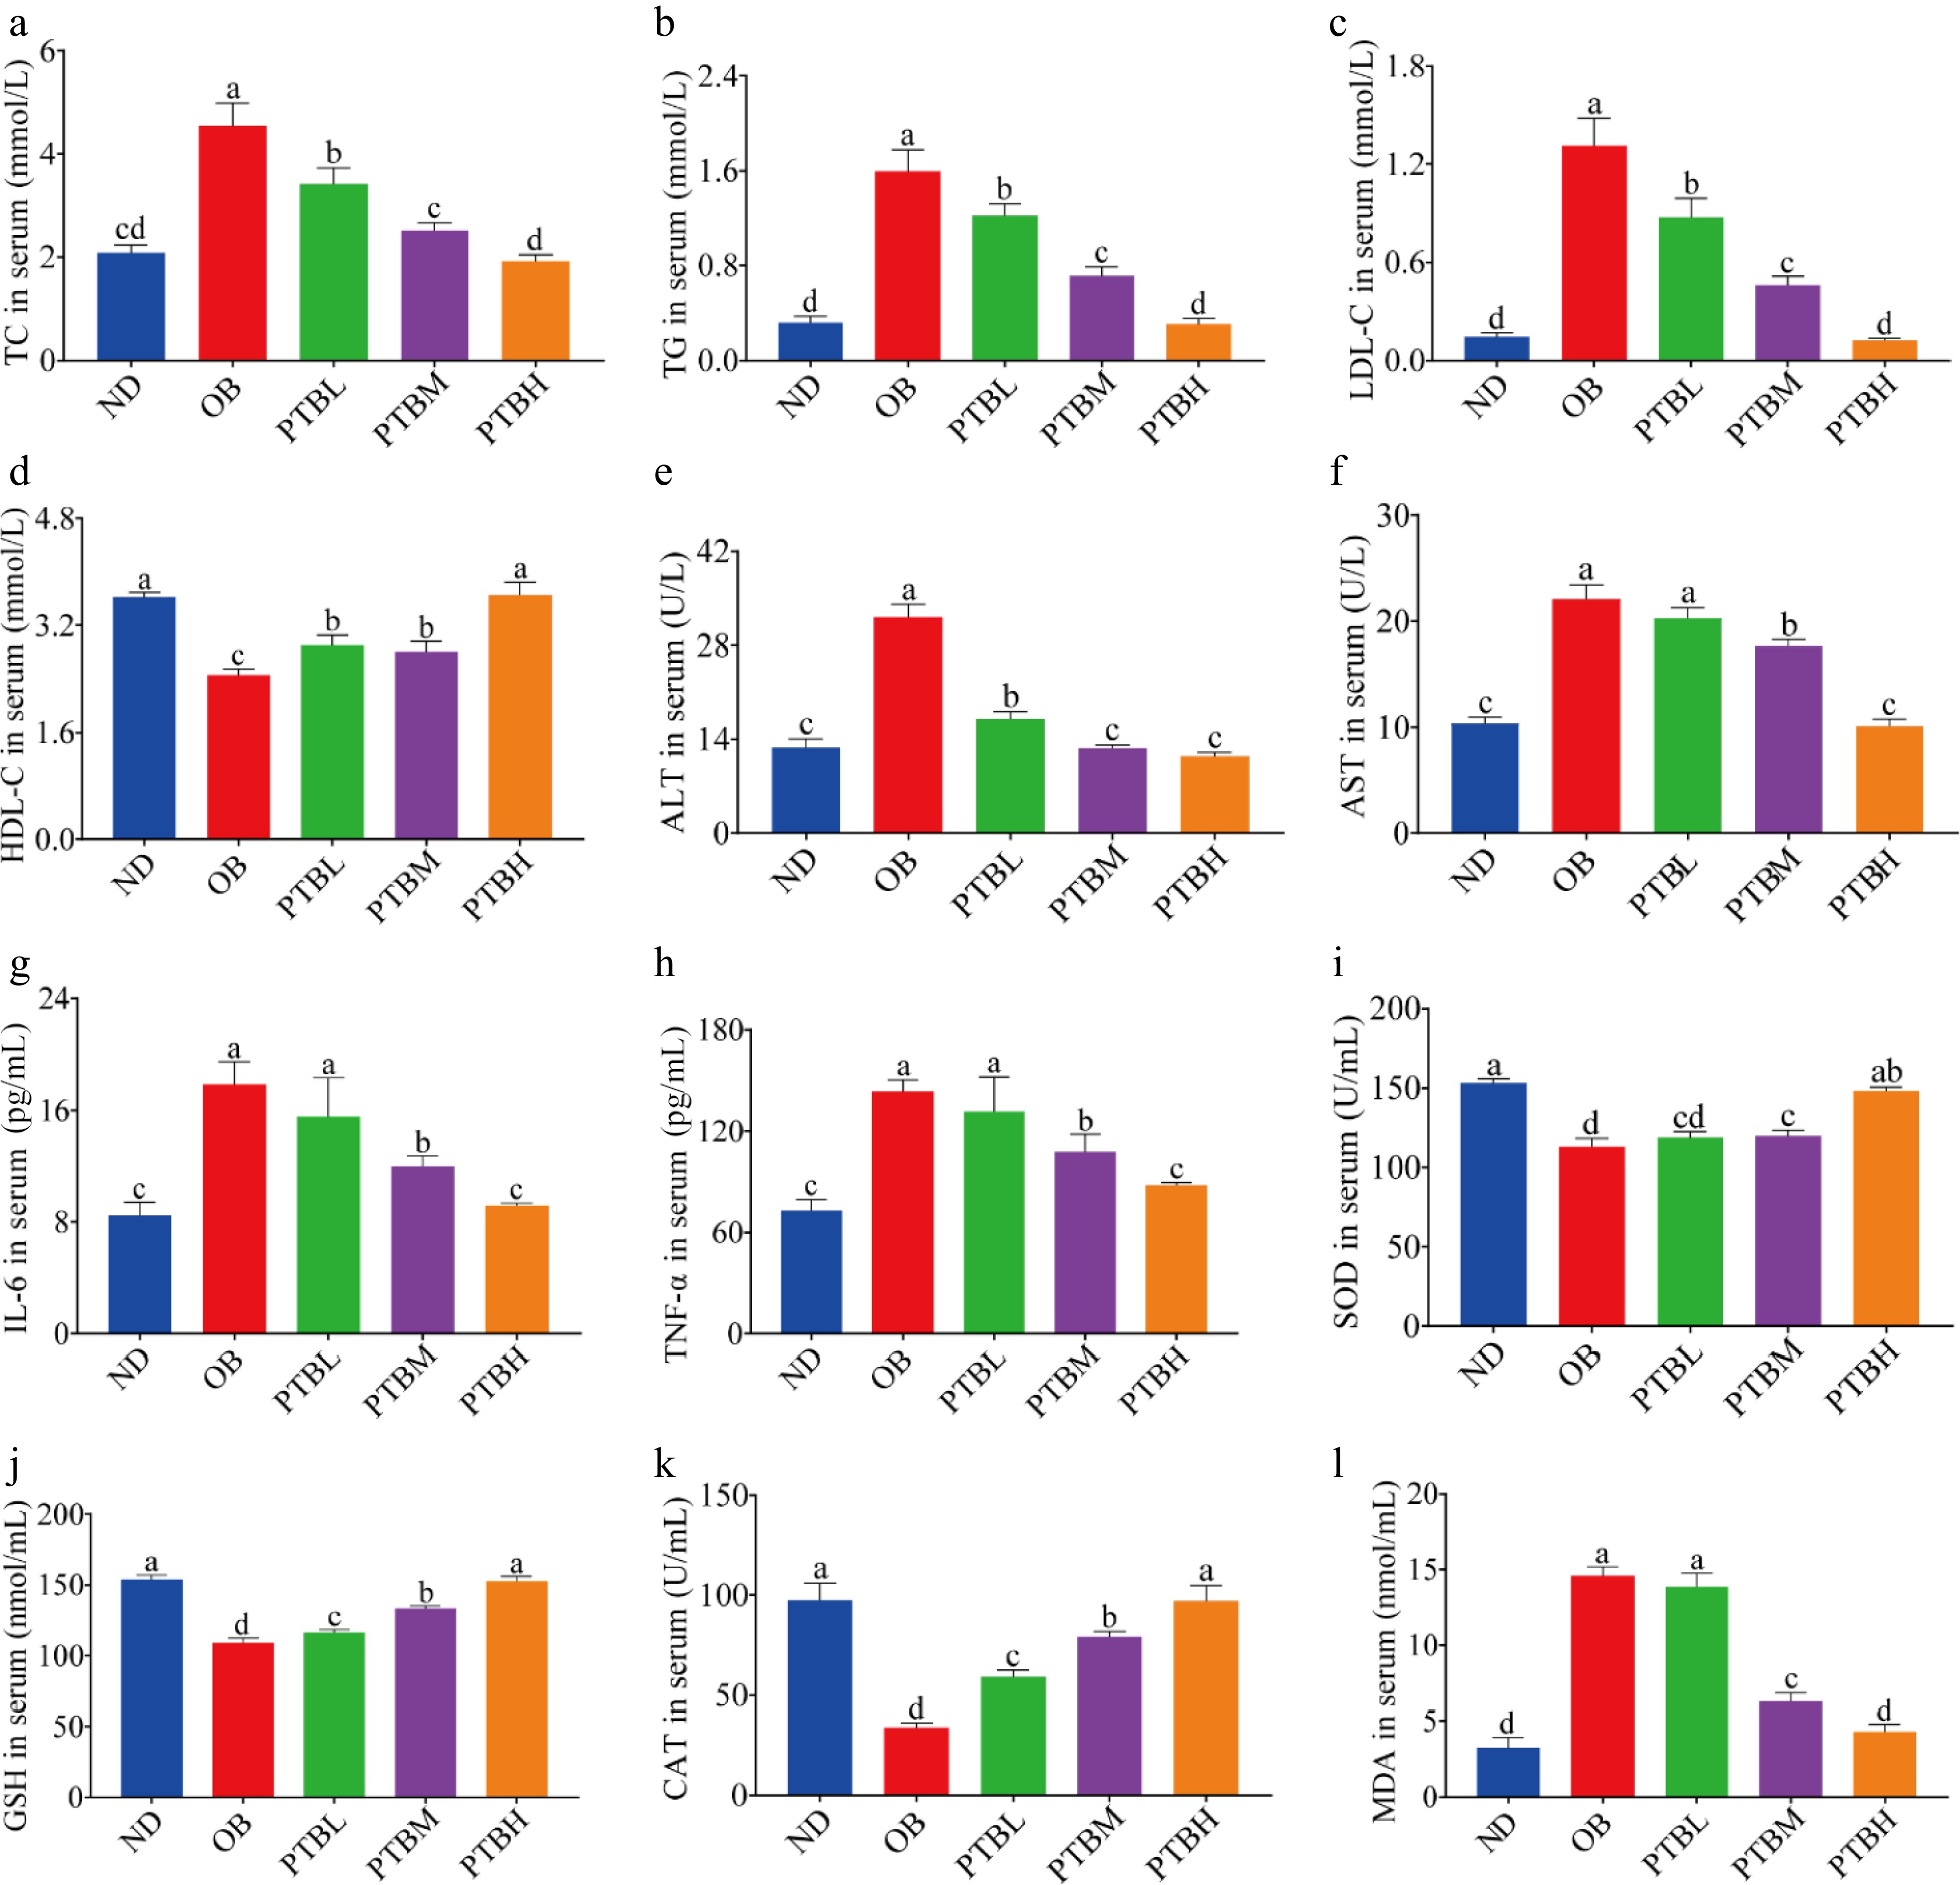
Figure 3.
Effects of PTB on serum biochemical indexes in mice fed with a high-fat diet. ND group, normal diet group; OB group, obesity model group; PTBL group, low-dose Pu-erh tea solid beverage intervention group; PTBM group, middle dose of Pu-erh tea solid beverage intervention group; PTBH group, high-dose Pu-erh tea solid beverage intervention group. TC, total cholesterol; TG, triglyceride; LDL-C, low-density lipoprotein cholesterol; HDL-C, high-density lipoprotein cholesterol; ALT, alanine aminotransferase; AST, aspartate aminotransferase; GSH, glutathione; MDA, malondialdehyde; SOD, superoxide dismutase; CAT, catalase. (a)−(d) the level of TC, TG, LDL-C, HDL-C in serum; (e), (f) serum ALT, AST activity; (g), (h) the level of IL-6 and TNF-α in serum; (i)−(l) Serum SOD, GSH, CAT, MDA concentrations.
-
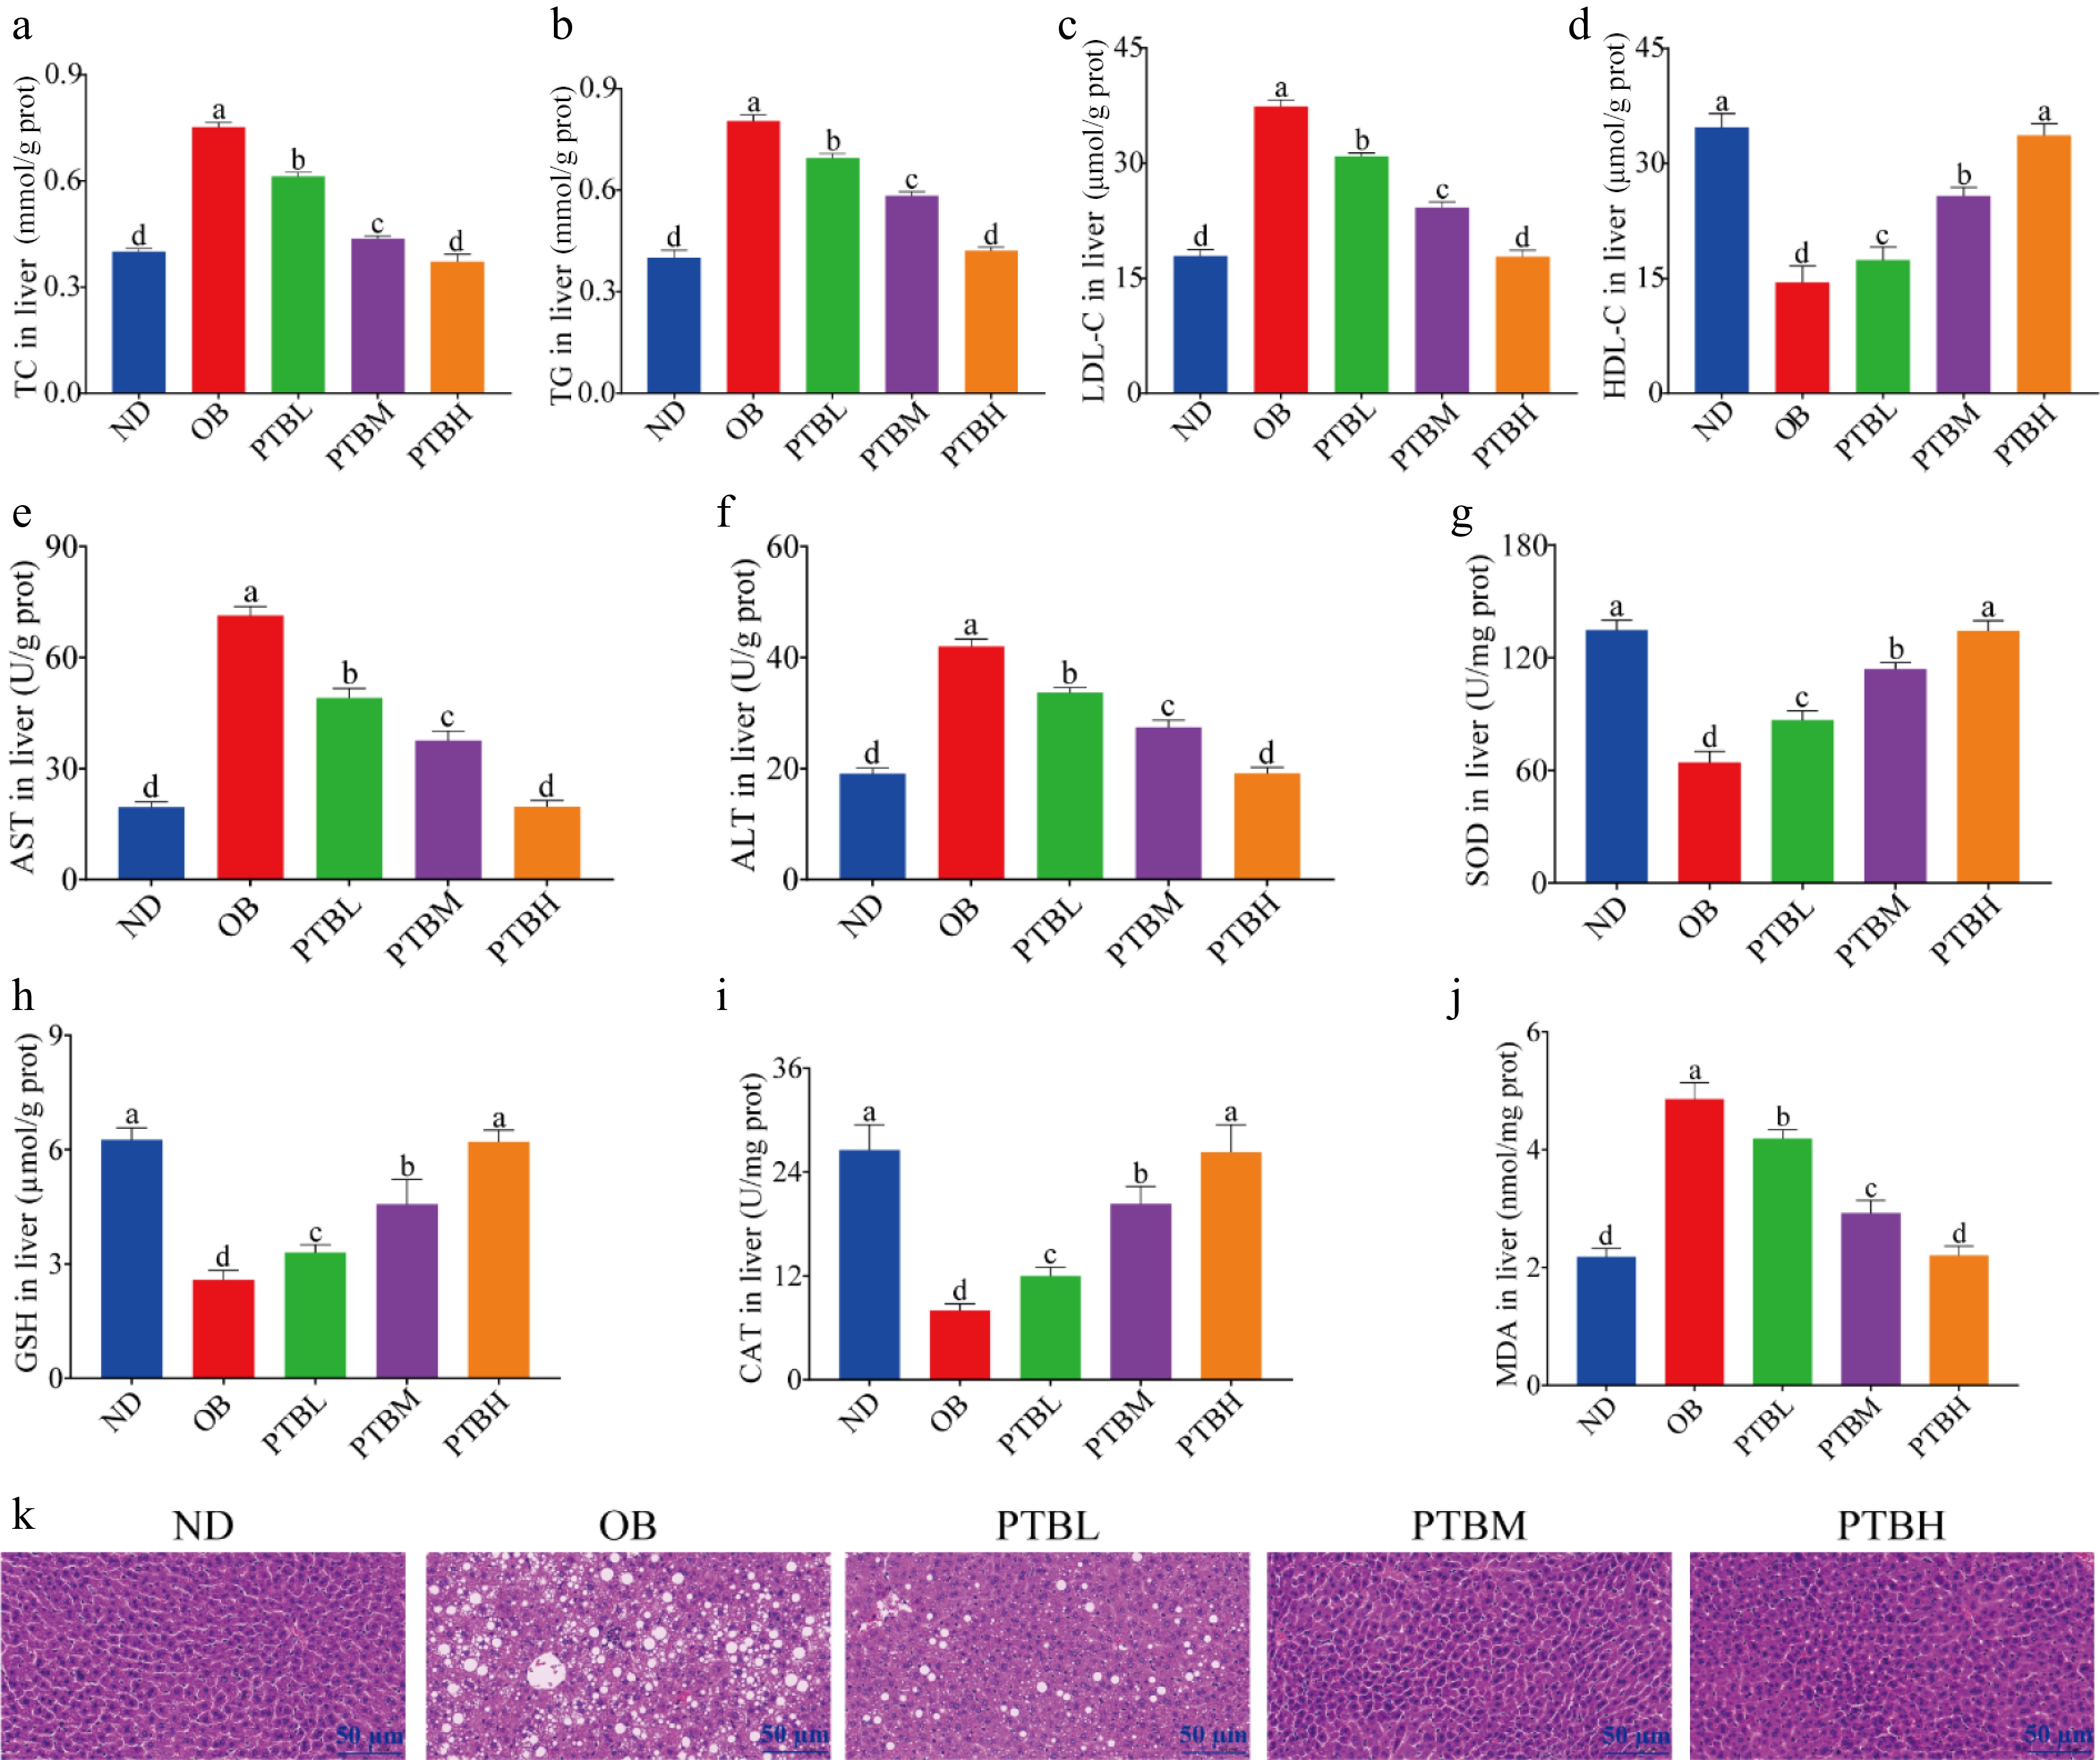
Figure 4.
Effects of PTB on liver morphology, lipid level, and oxidative stress in mice fed a high-fat diet. ND group, normal diet group; OB group, obesity model group; PTBL group, low-dose Pu-erh tea solid beverage intervention group; PTBM group, middle dose of Pu-erh tea solid beverage intervention group; PTBH group, high-dose Pu-erh tea solid beverage intervention group. TC, total cholesterol; TG, triglyceride; LDL-C, low-density lipoprotein cholesterol; HDL-C, high-density lipoprotein cholesterol; ALT, alanine aminotransferase; AST, aspartate aminotransferase; GSH, glutathione; MDA, malondialdehyde; SOD, superoxide dismutase; CAT, catalase. (a)−(d) Liver TC, TG, LDL-C, HDL-C concentration; (e), (f) the activity of ALT and AST in the liver; (g)−(j) the concentration of SOD, GSH, CAT, MDA in the liver; (k) Liver H&E staining sections (scale bar = 50 μm).
-
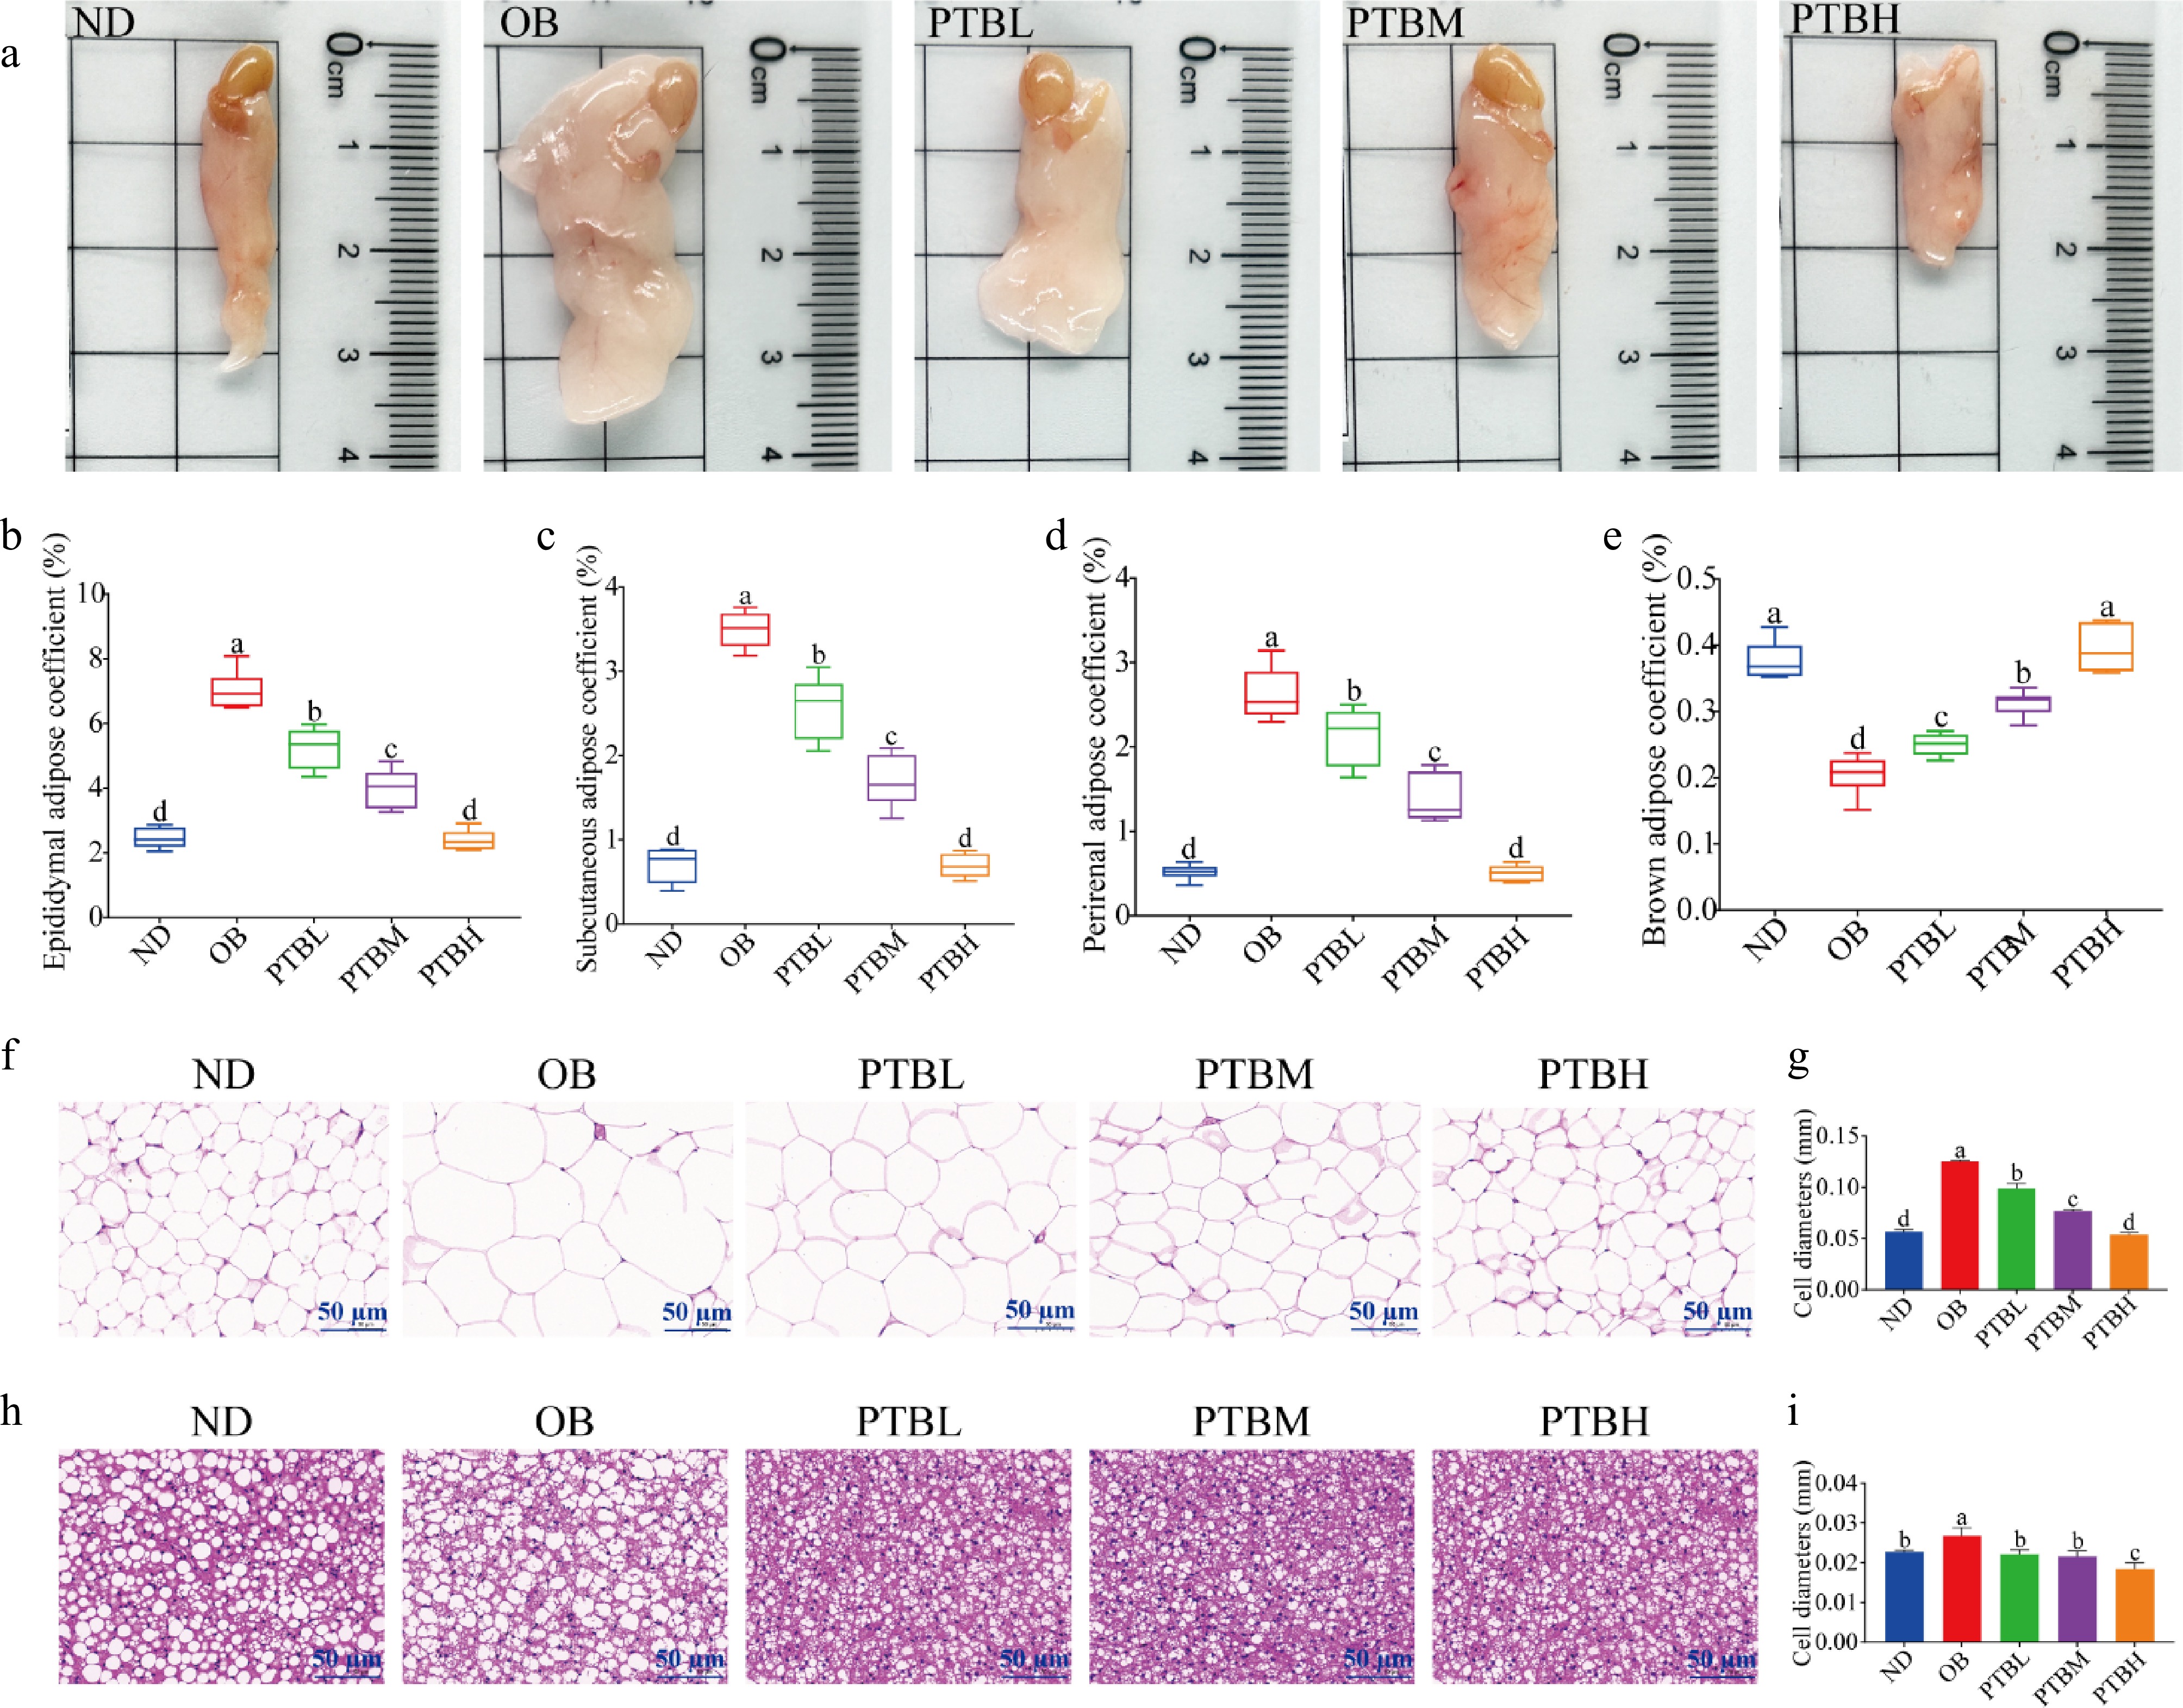
Figure 5.
Effects of PTB on adipose tissue morphology, fat weight, and adipocyte size in high-fat diet mice. ND group, normal diet group; OB group, obesity model group; PTBL group, low-dose Pu-erh tea solid beverage intervention group; PTBM group, middle dose of Pu-erh tea solid beverage intervention group; PTBH group, high-dose Pu-erh tea solid beverage intervention group. (a) Photos of epididymal fat in mice; (b) Epididymal fat coefficient; (c) Groin fat coefficient; (d) Perirenal fat coefficient; (e) Brown fat coefficient; (f) H&E staining sections of epididymal adipose tissue (scale bar = 50 μm); (g) Epididymal adipocyte diameter; (h) H&E staining sections of brown adipose tissue (scale bar = 50 μm); (i) Brown adipocyte diameter.
-
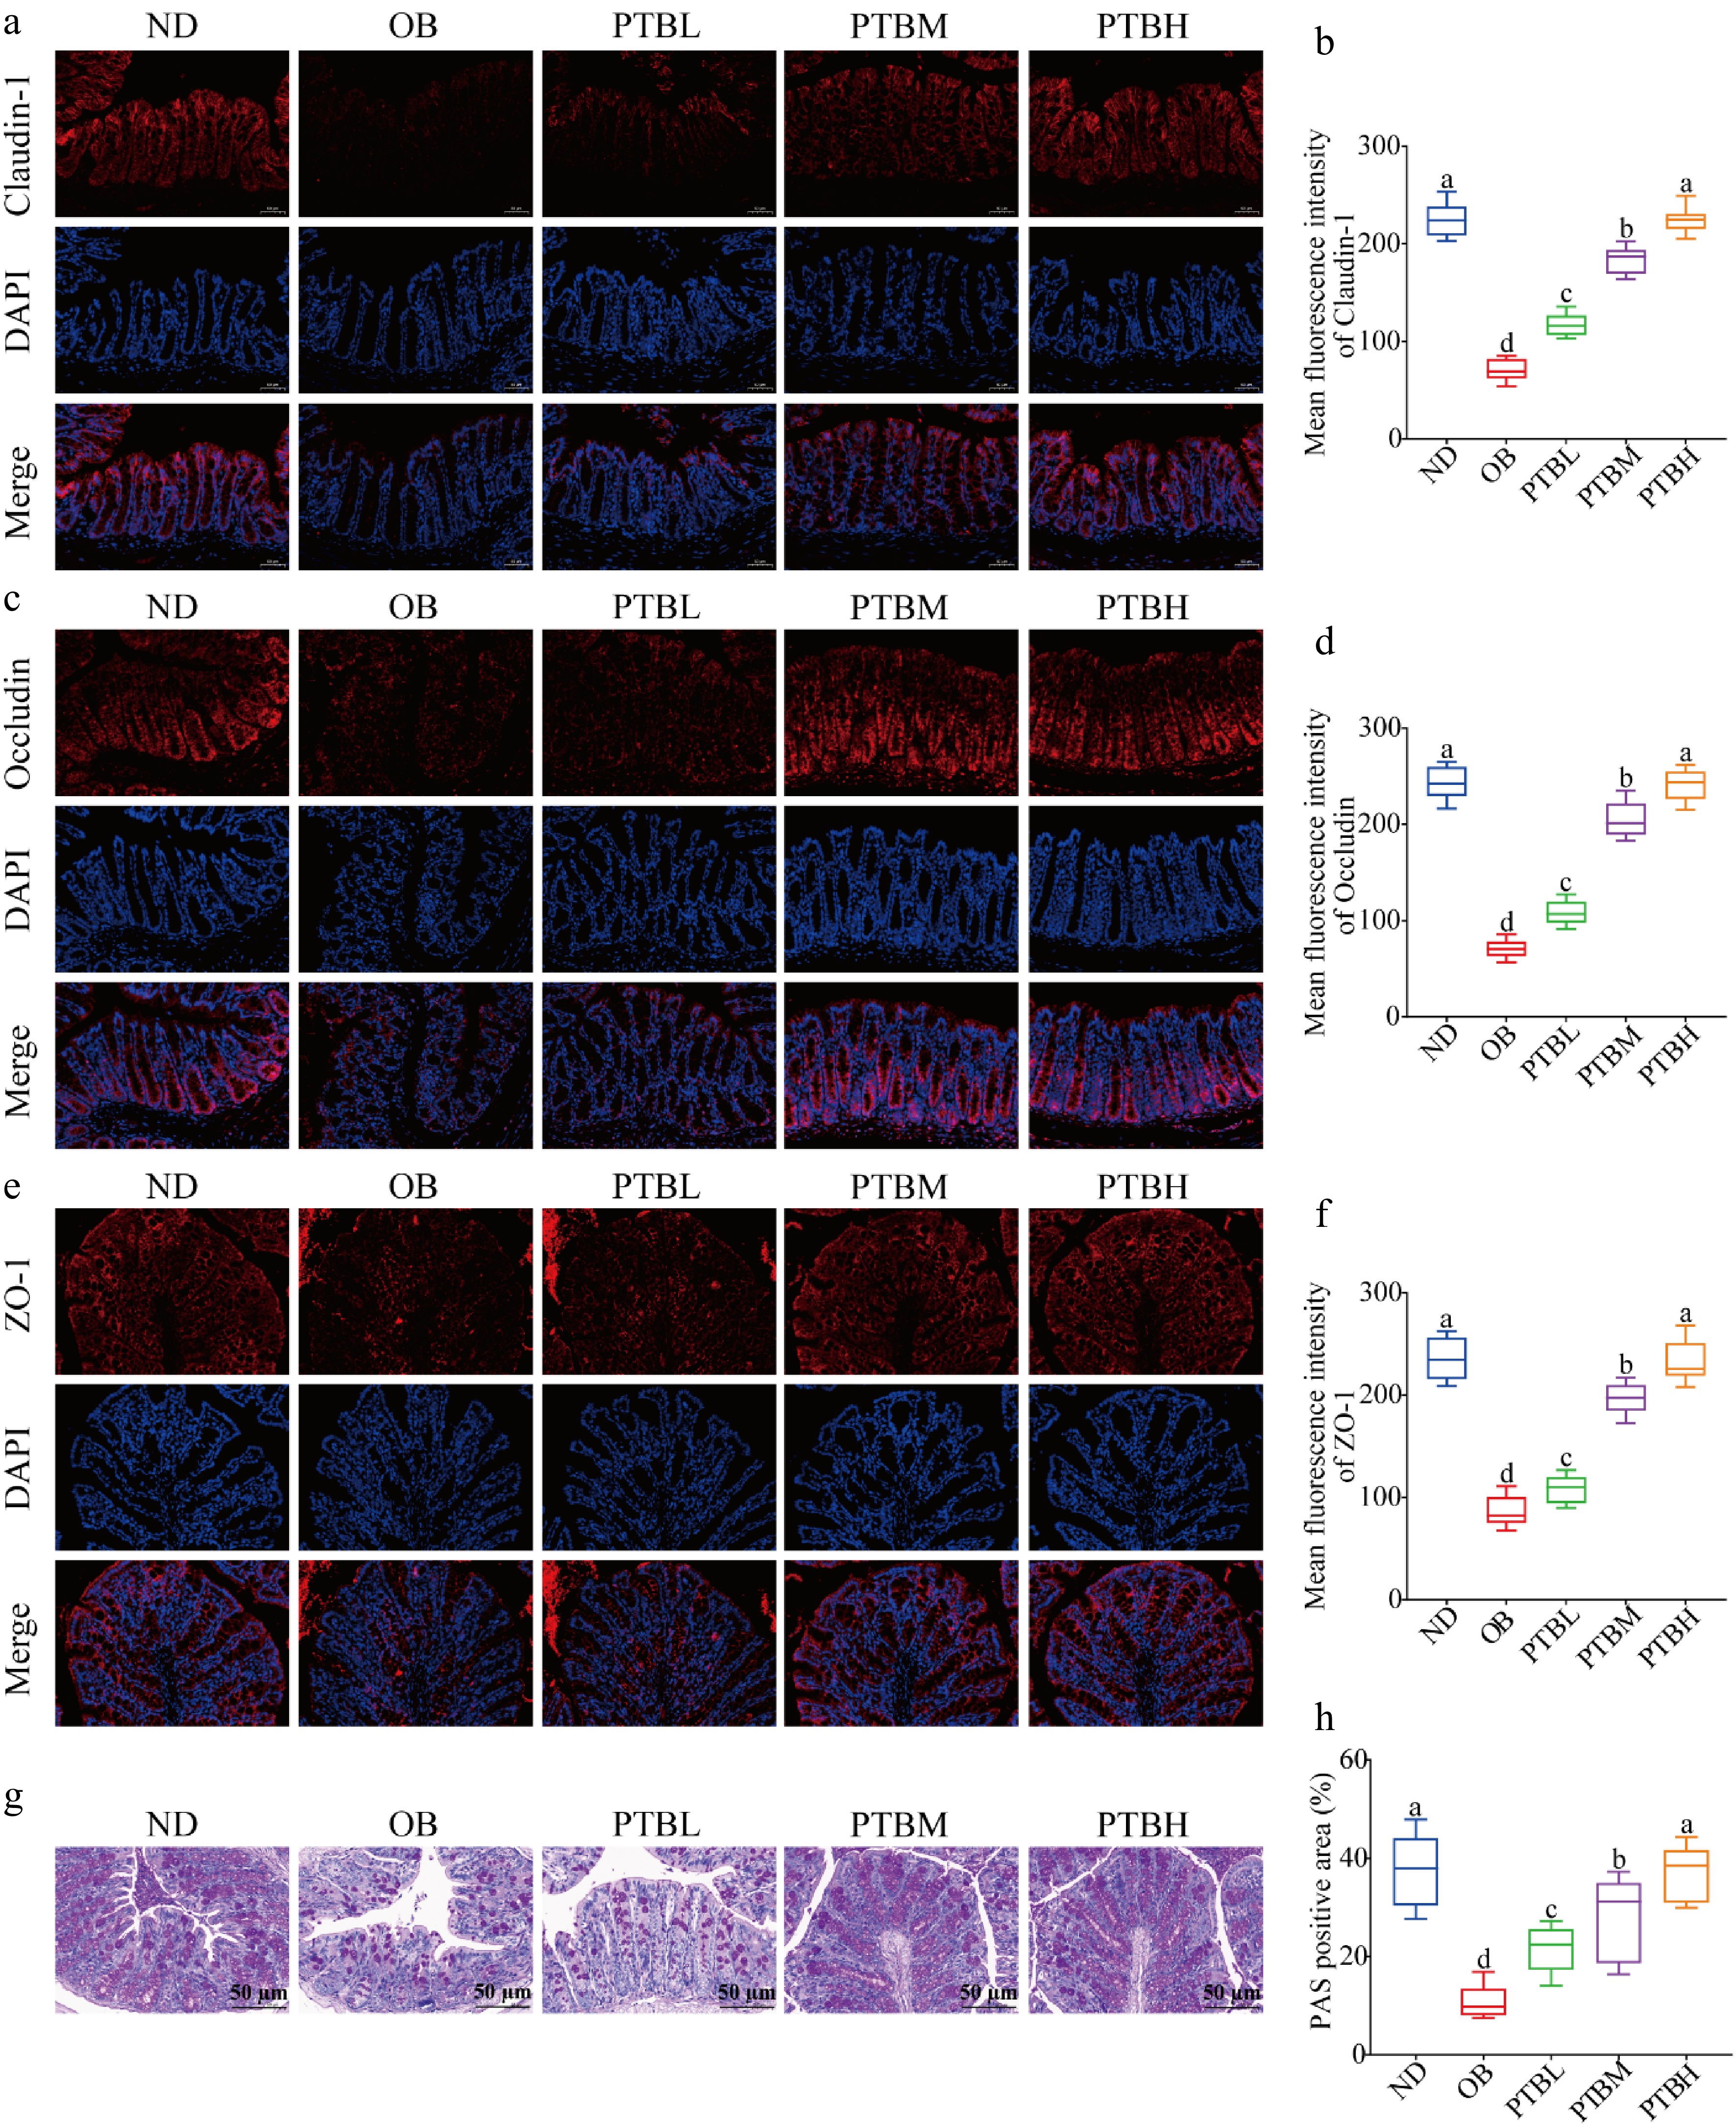
Figure 6.
Effects of PTB on colon injury and intestinal barrier function in mice fed with a high-fat diet. Claudin-1, occludin, and ZO-1 immunofluorescence staining results and average fluorescence intensity (scale bar = 50 μm) in colon tissue of (a)−(f) mice; (g) PAS staining results of colon tissue (scale bar = 50 μm); (h) PAS-positive staining area. ND group, normal diet group; OB group, obesity model group; PTBL group, low-dose Pu-erh tea solid beverage intervention group; PTBM group, middle dose of Pu-erh tea solid beverage intervention group; PTBH group, high-dose Pu-erh tea solid beverage intervention group.
-
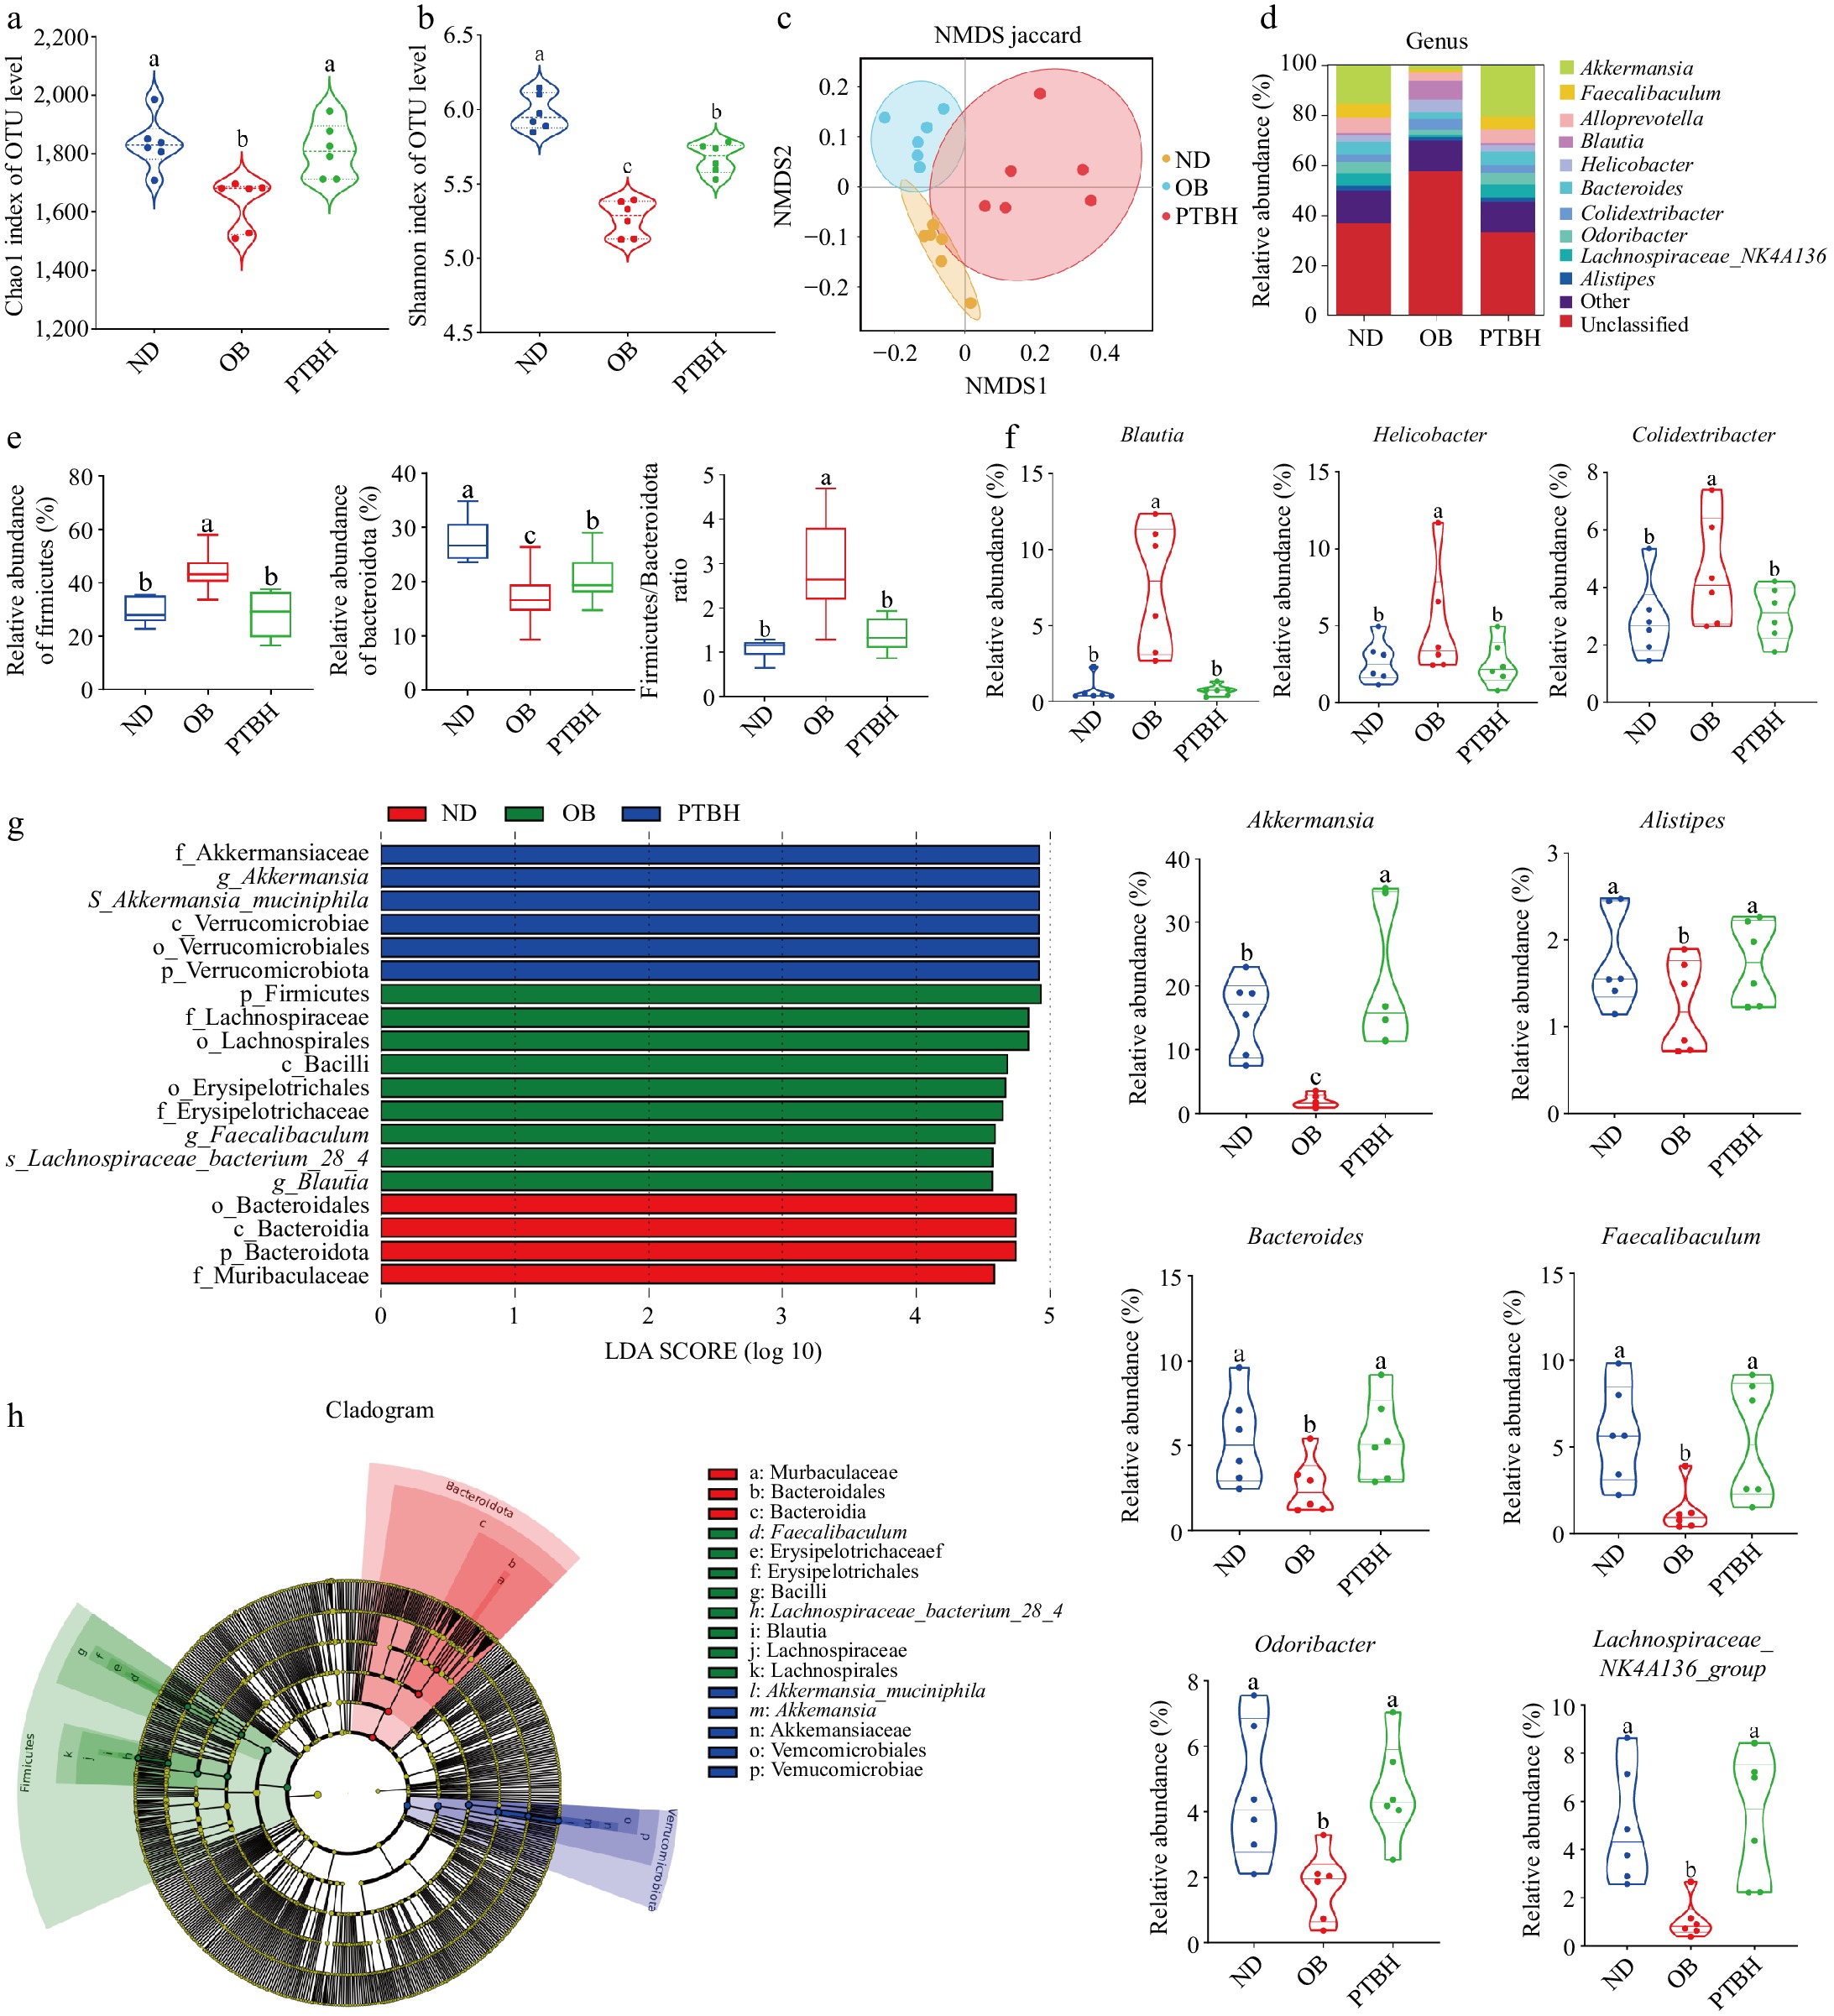
Figure 7.
The regulatory effect of PTB on intestinal flora in high-fat diet mice. (a) Chao1 index; (b) Shannon index; (c) Non-metric multidimensional scale (NMDS) score plot; (d) Species composition distribution map at genus level; (e) The abundance and ratio of Firmicutes and Bacteroidetes; (f) Represents the relative abundance of the genus; (g) LDA score of LEfSe analysis; (h) Phylogenetic tree of LEfSe analysis. ND group, normal diet group; OB group, obesity model group; PTBH group, high-dose Pu-erh tea solid beverage intervention group.
-
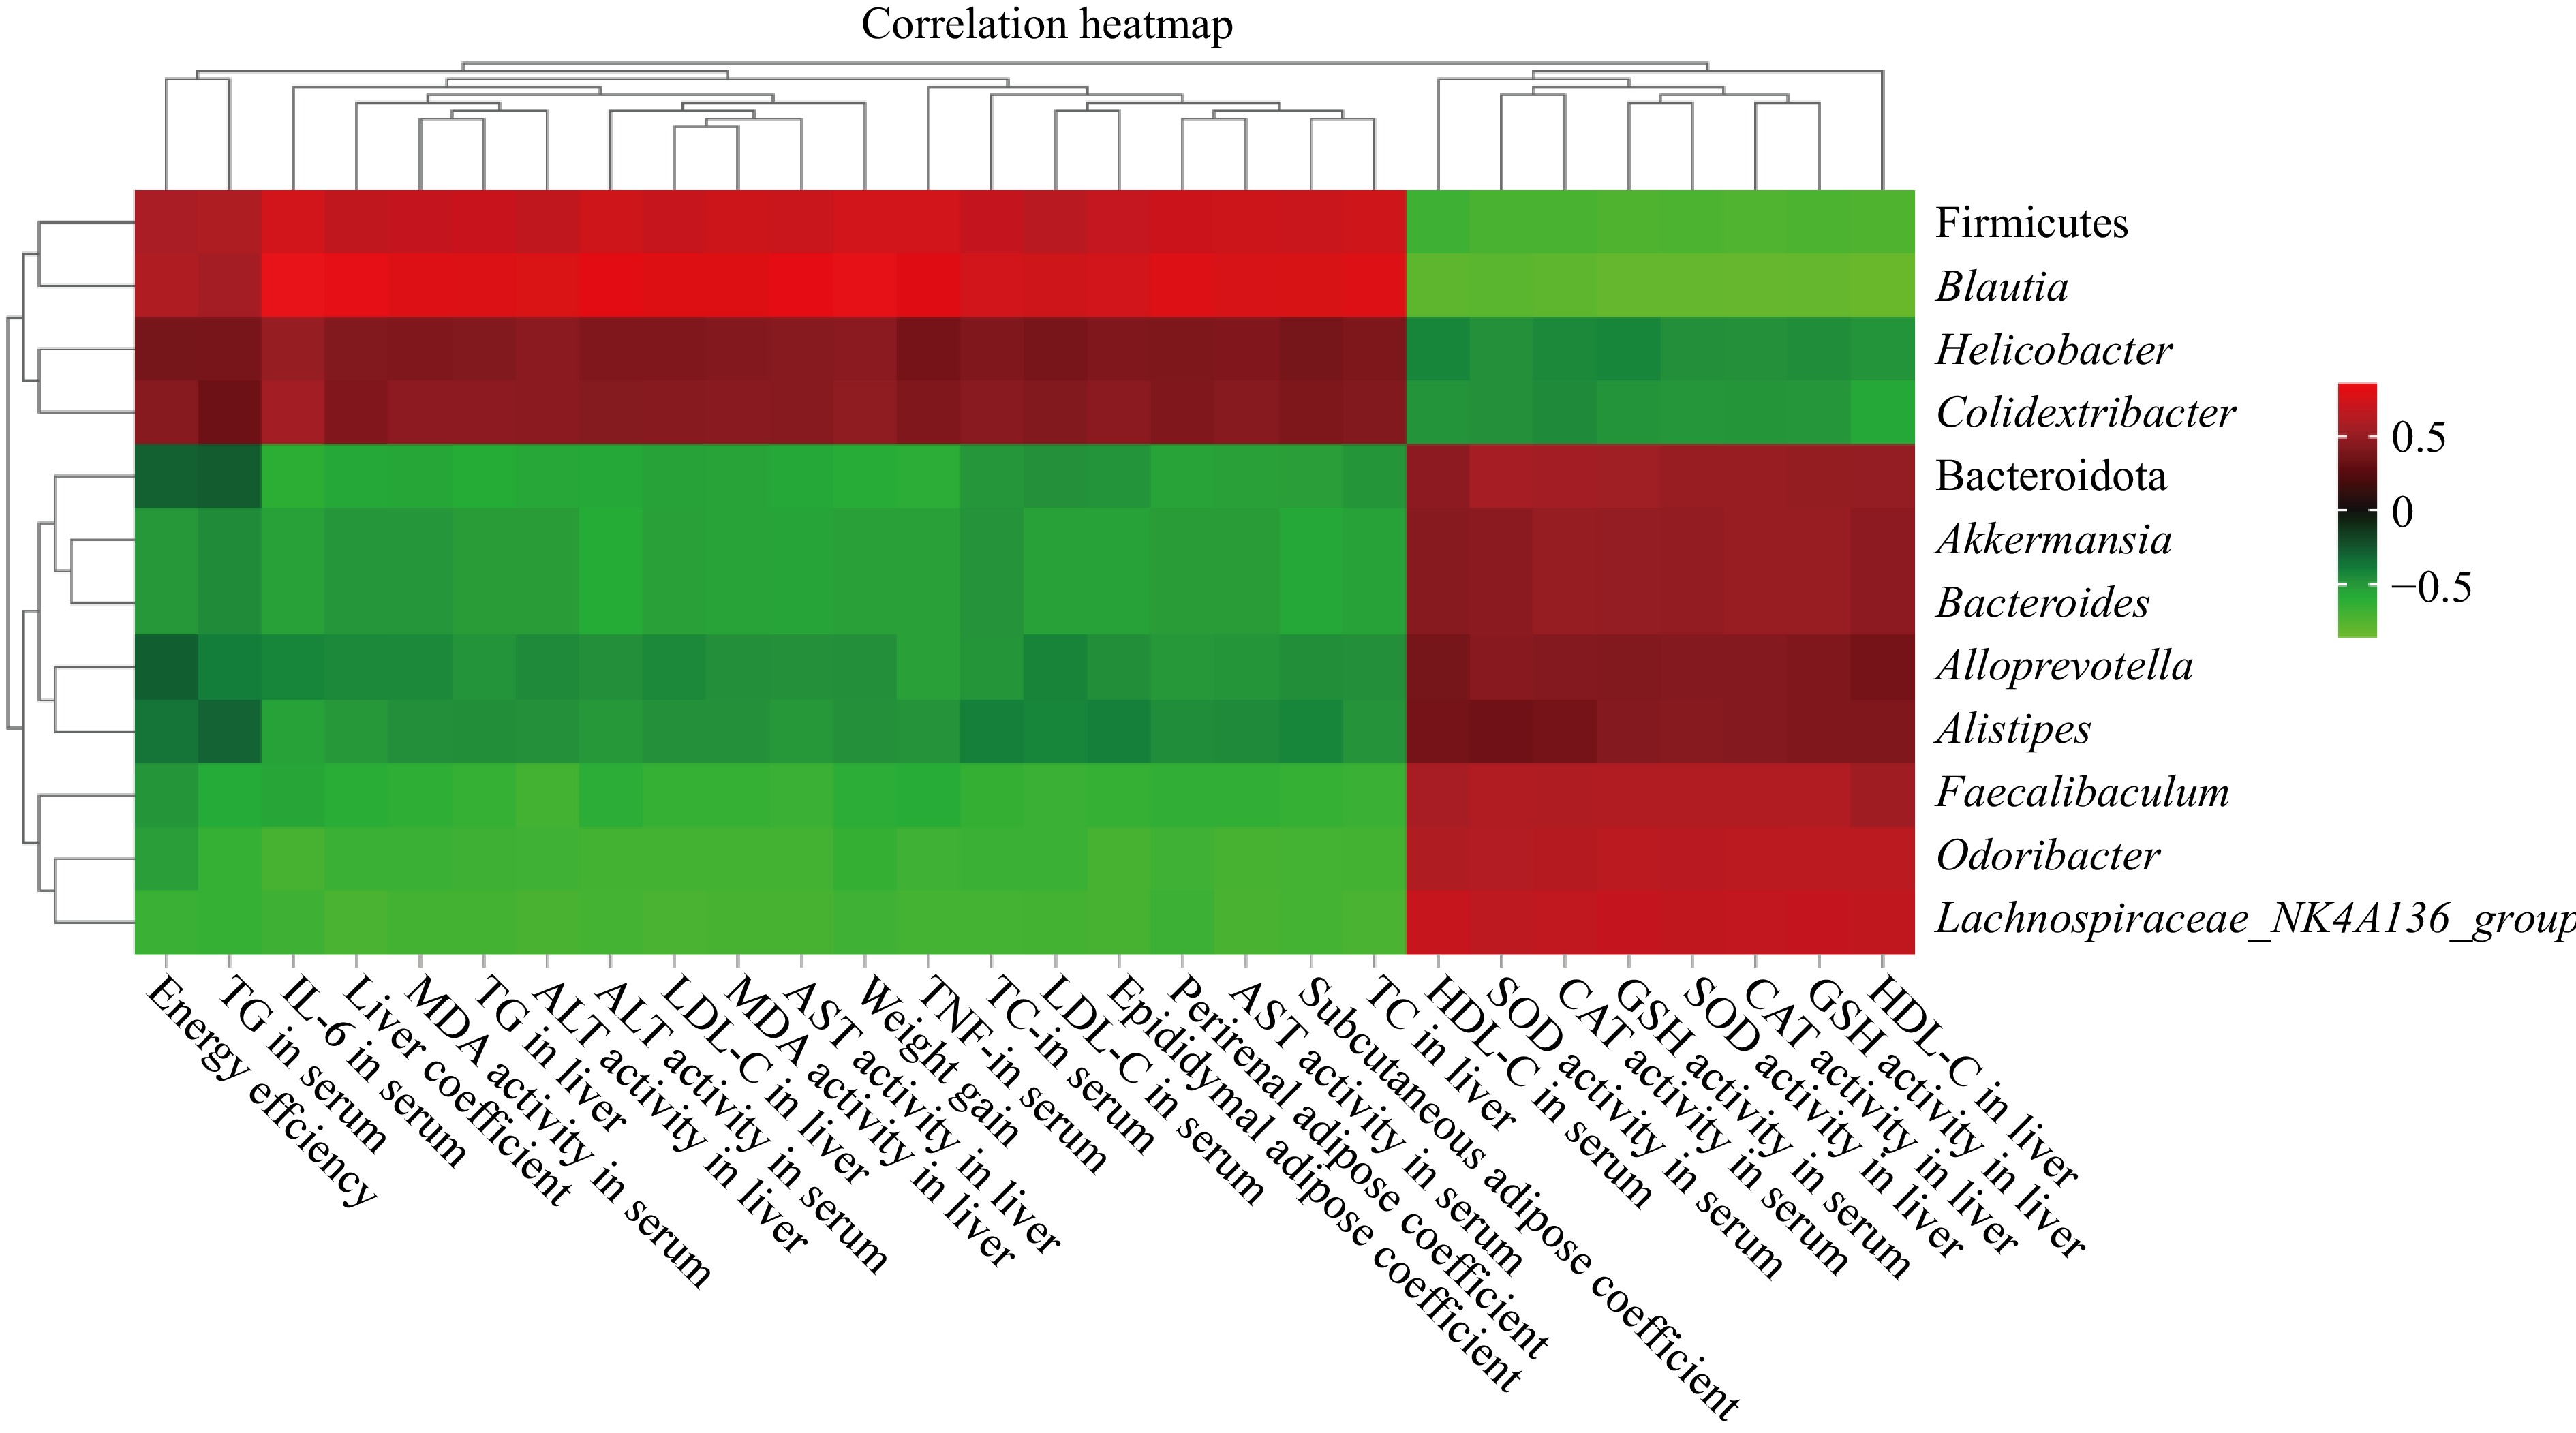
Figure 8.
Heatmap of correlation analysis between the abundance of dominant bacteria and obesity-related indicators.
Figures
(8)
Tables
(0)