-
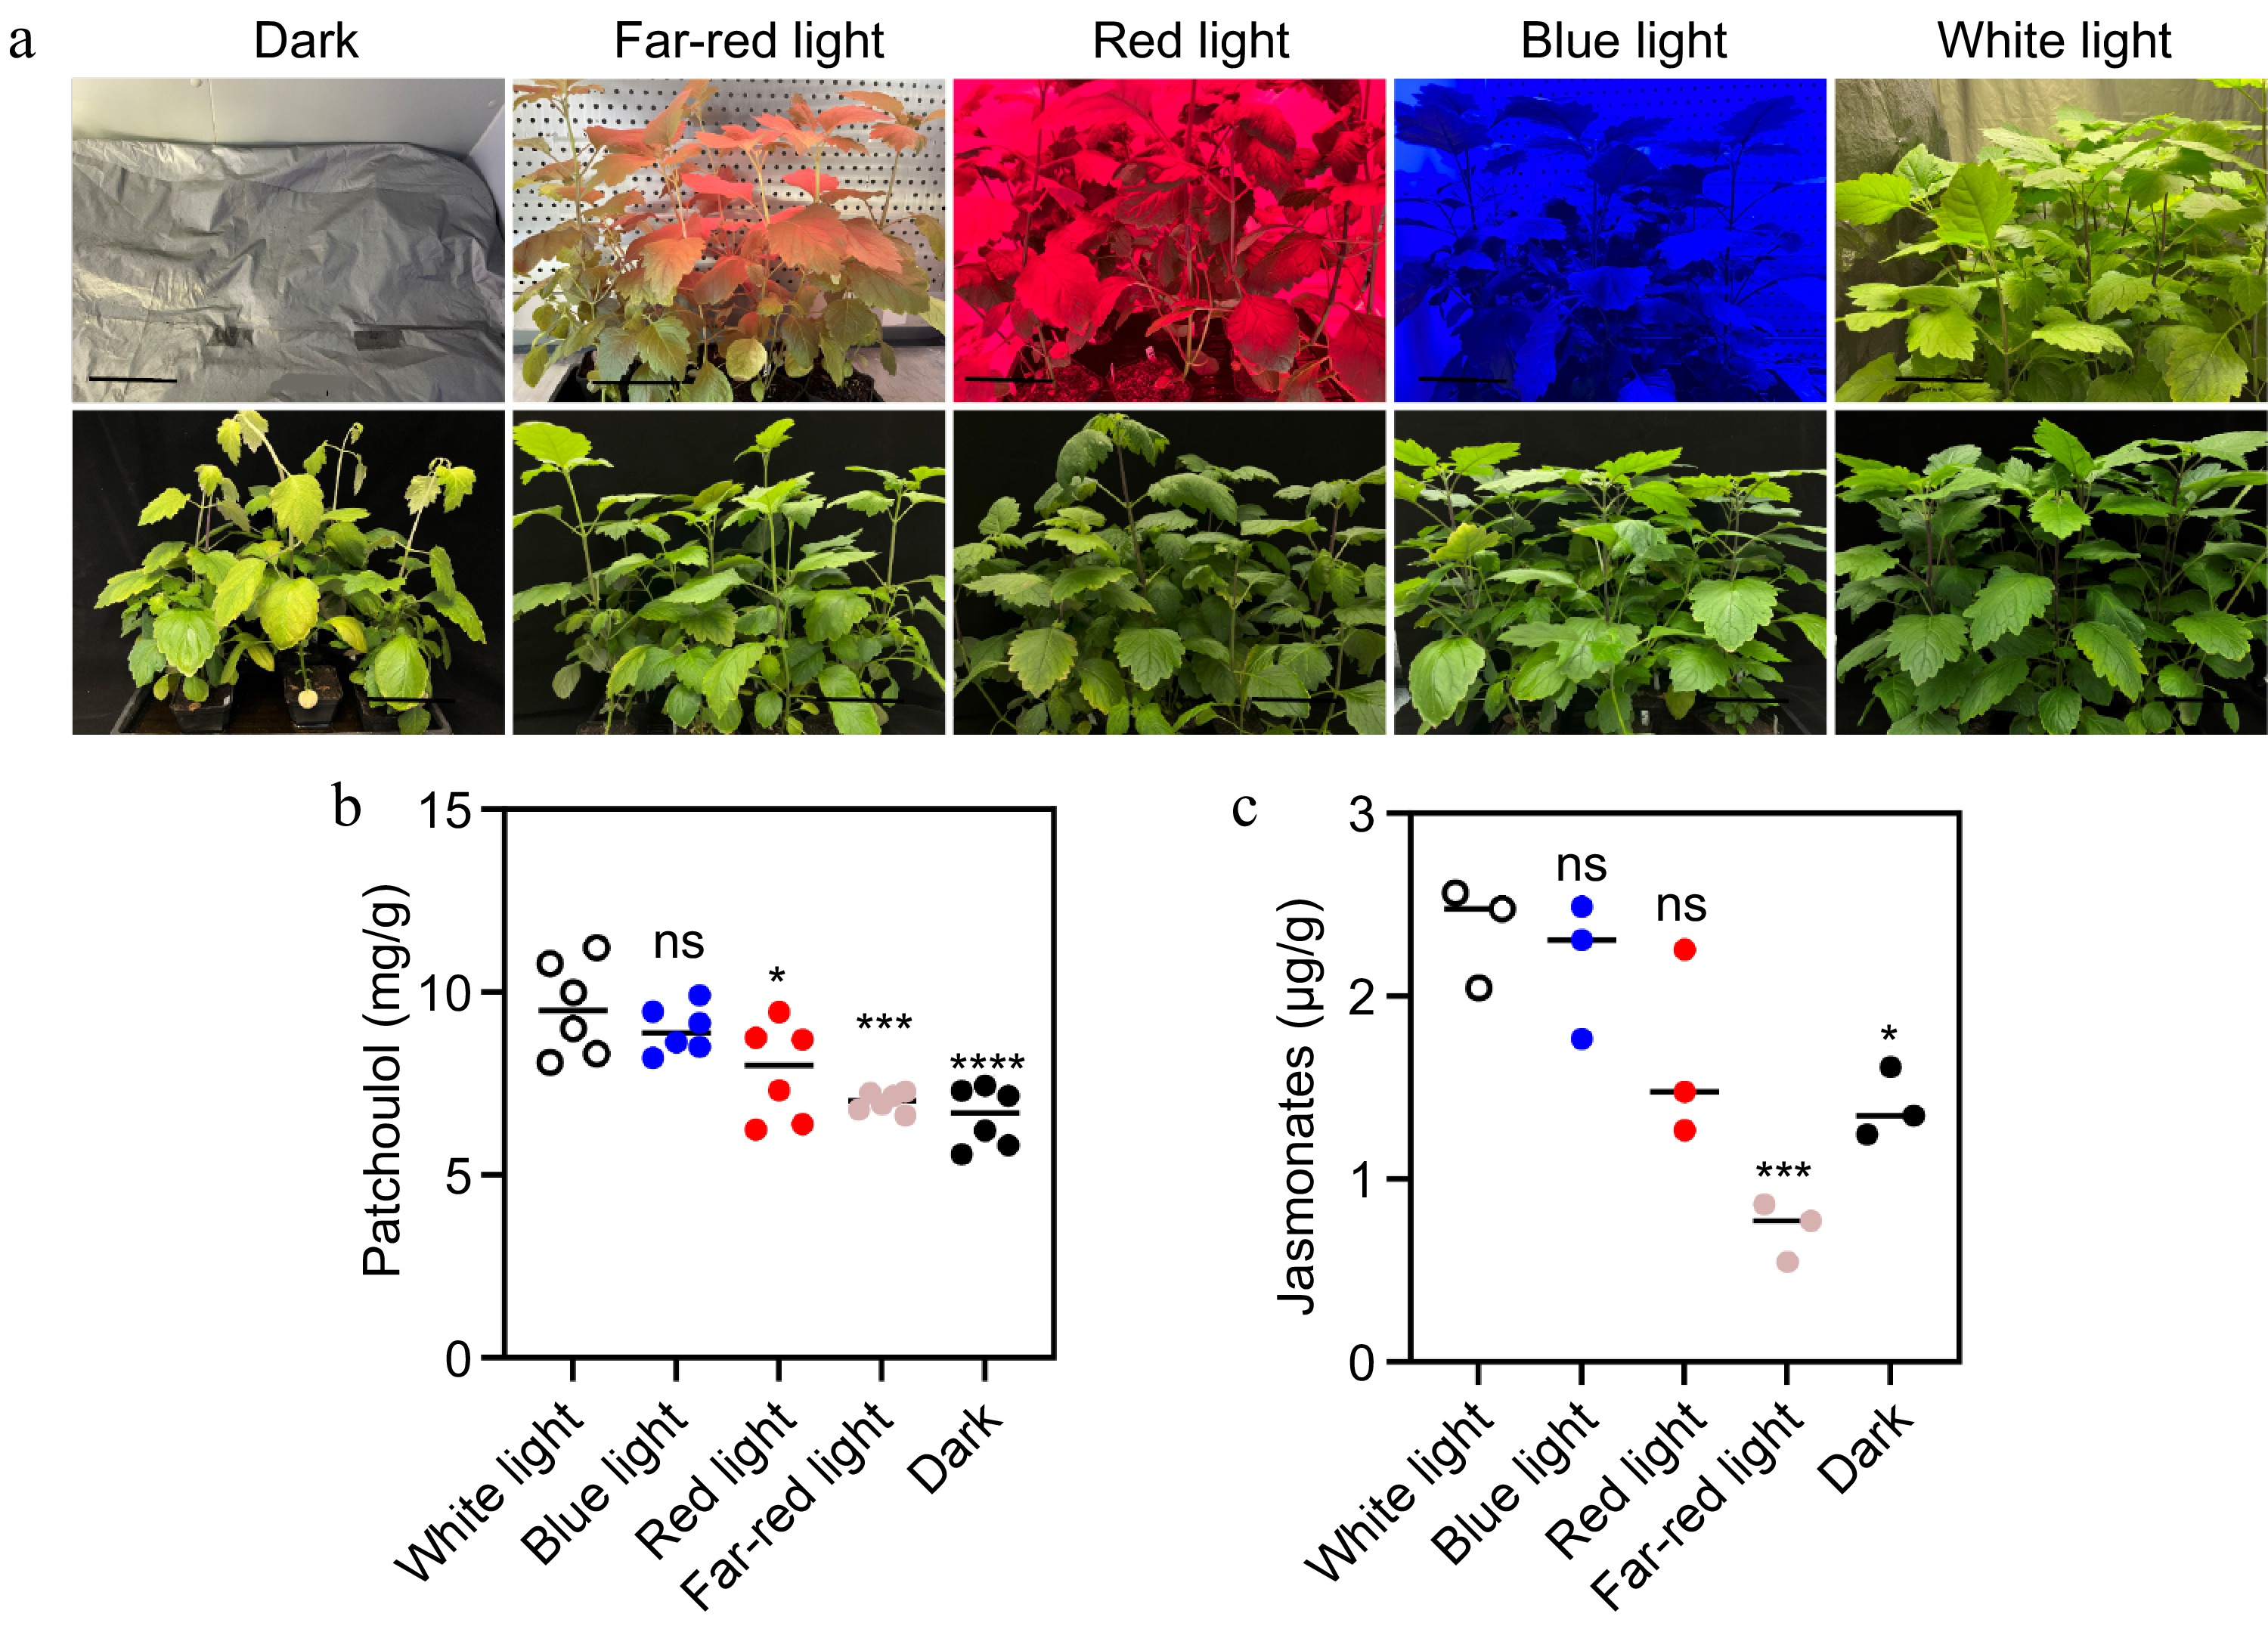
Figure 1.
Effect of light on patchoulol and JA accumulation. (a) Photographs of patchouli plants under different light conditions: dark, far-red light, red light, blue light, and white light. The top row shows the plants after two weeks of treatment. (b) Patchoulol accumulation across different light treatments. (c) JA levels under the same conditions. Black line length: 10 cm. * p < 0.05; ** p < 0.01; *** p < 0.001; ns, not significant. Student's t-test.
-
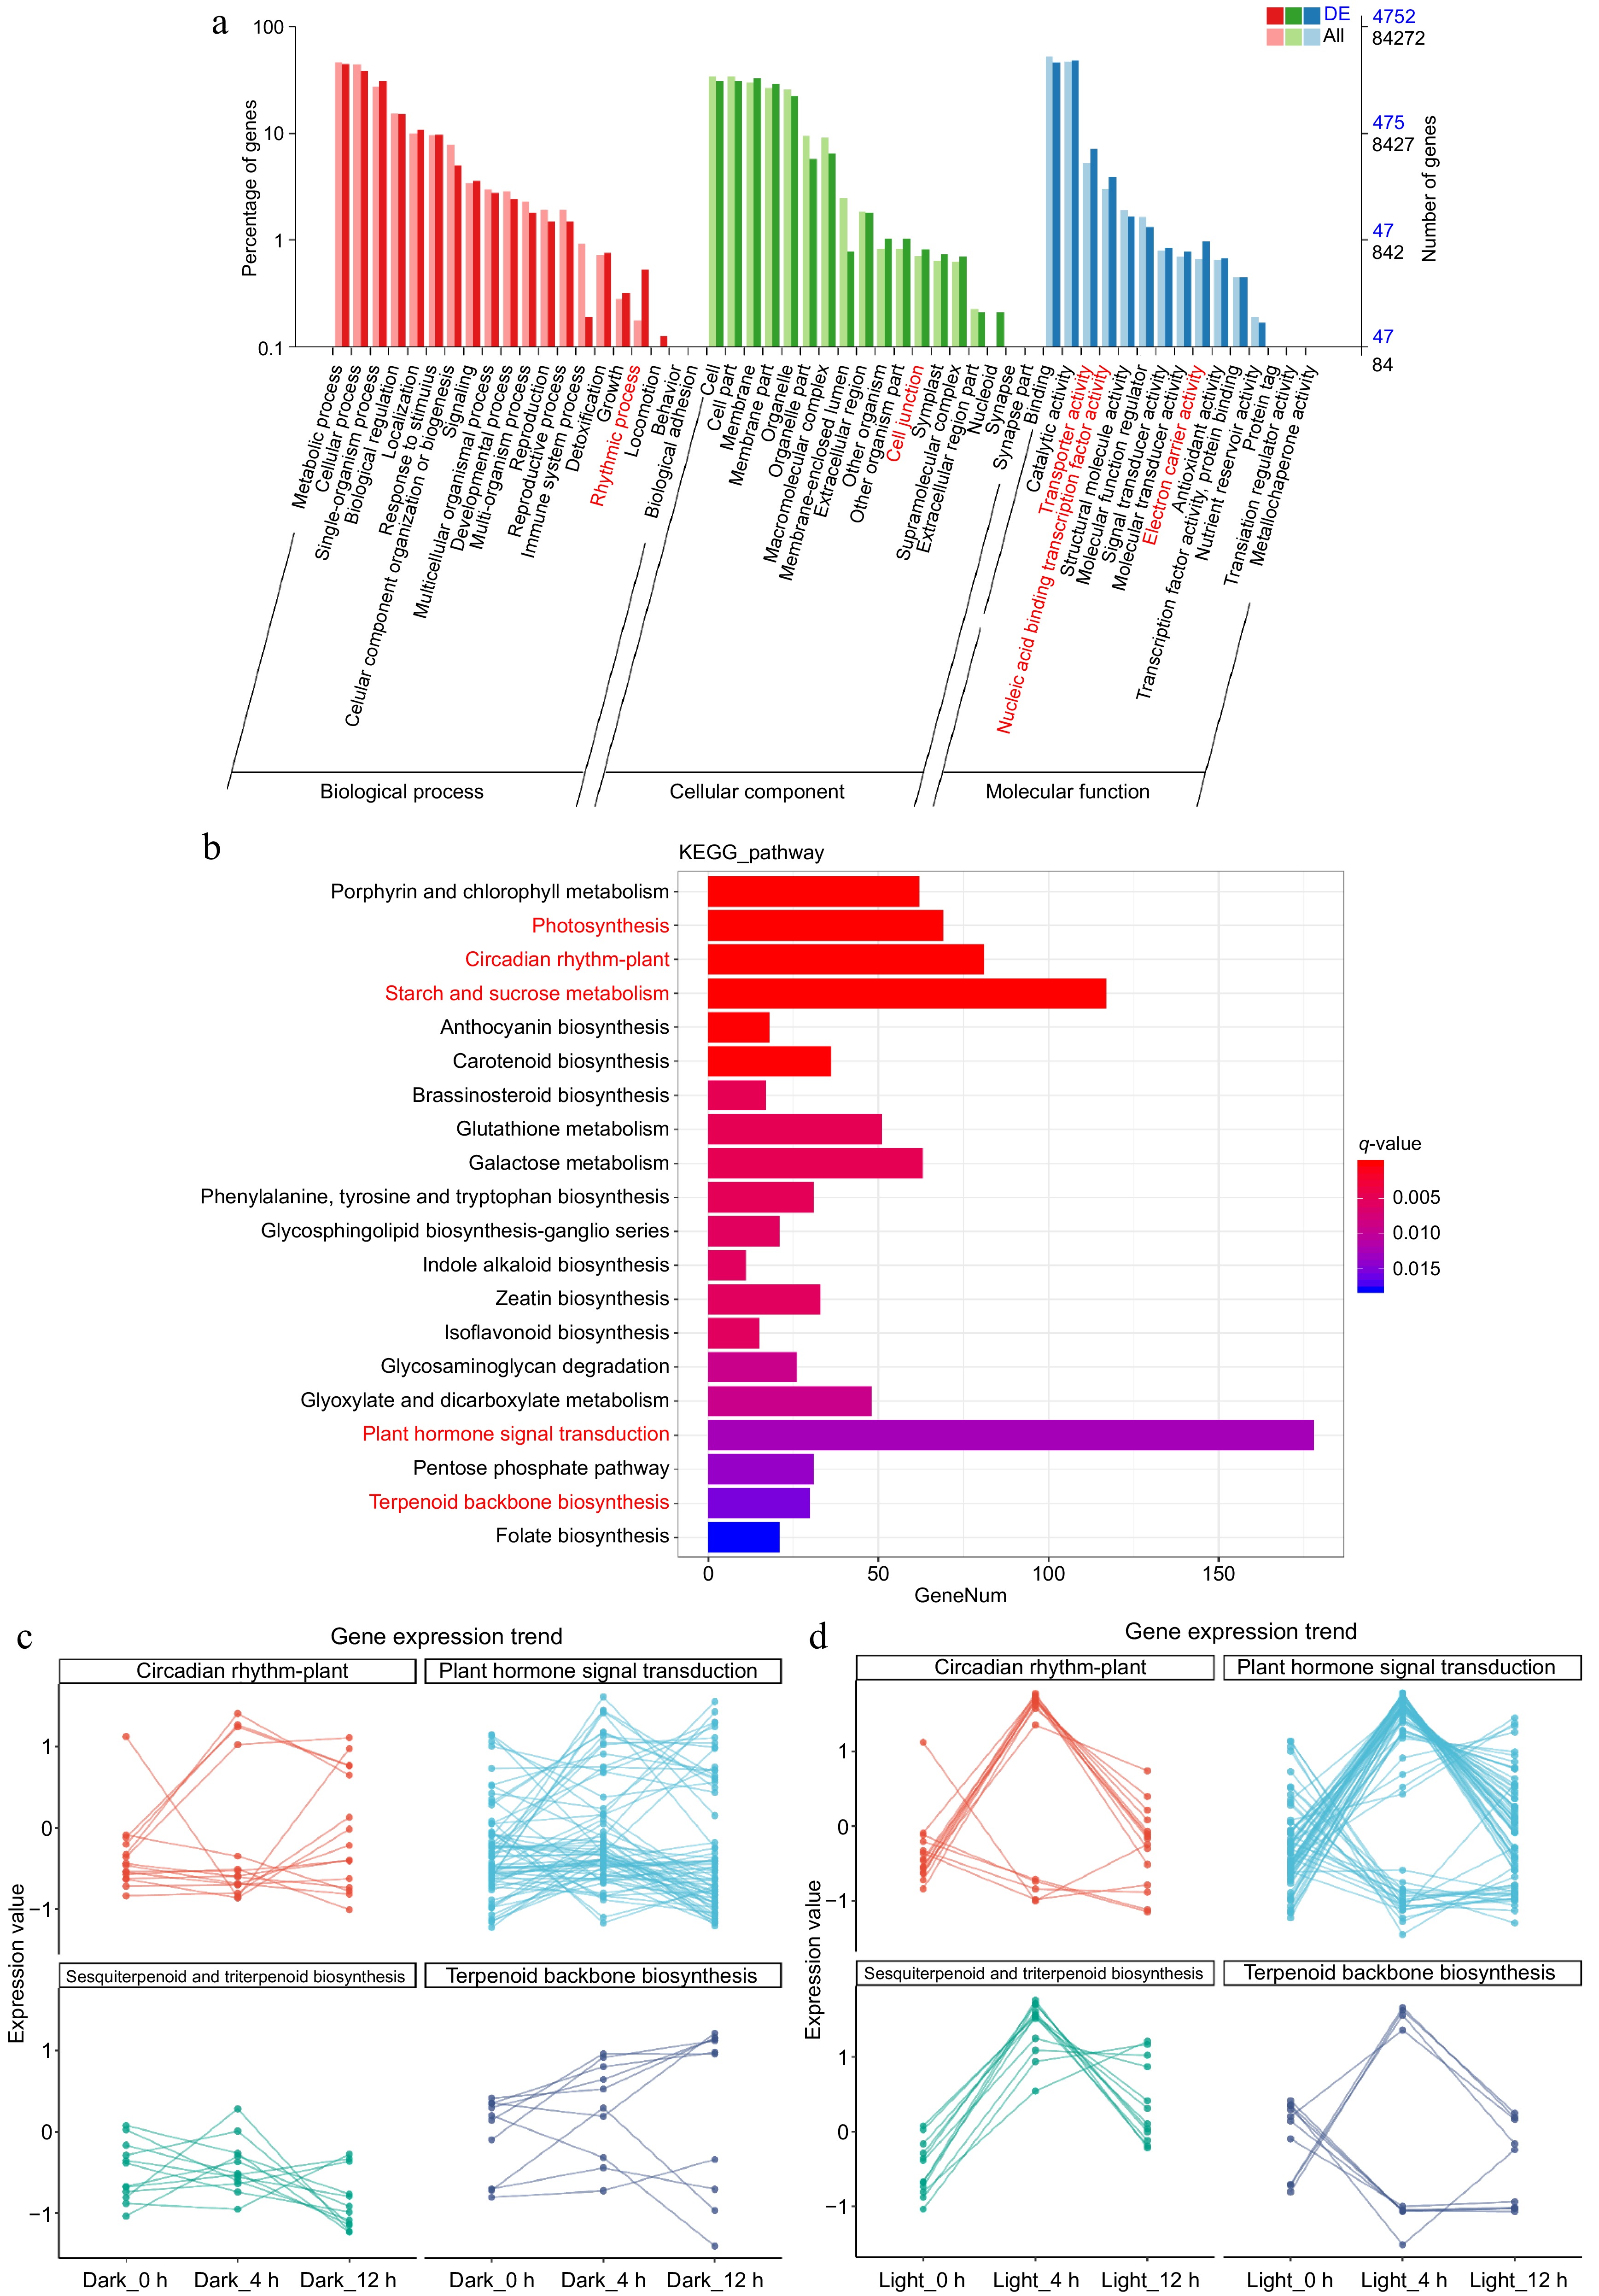
Figure 2.
Gene expression profile and function enrichment statistics of patchouli under dark and light conditions. (a) The bar chart displays the percentage of genes associated with various Gene Ontology (GO) terms across three categories: biological process (red), cellular component (green), and molecular function (blue). Notably, second-level function terms that are significantly enriched are highlighted in red. (b) The histogram presents the results of KEGG pathway analysis, showing the number of genes involved in various metabolic pathways. Key pathways, such as 'Photosynthesis' and 'Circadian rhythm—plant', are marked in red, indicating their significant enrichment. (c) The line graphs depict the gene expression trends for selected pathways, including 'Plant hormone signal transduction', 'Circadian rhythm—plant', 'Sesquiterpenoid and triterpenoid biosynthesis', and 'Terpenoid backbone biosynthesis'. The expression values are plotted across different time points under dark and light conditions, illustrating the dynamic changes in gene expression in response to light exposure.
-
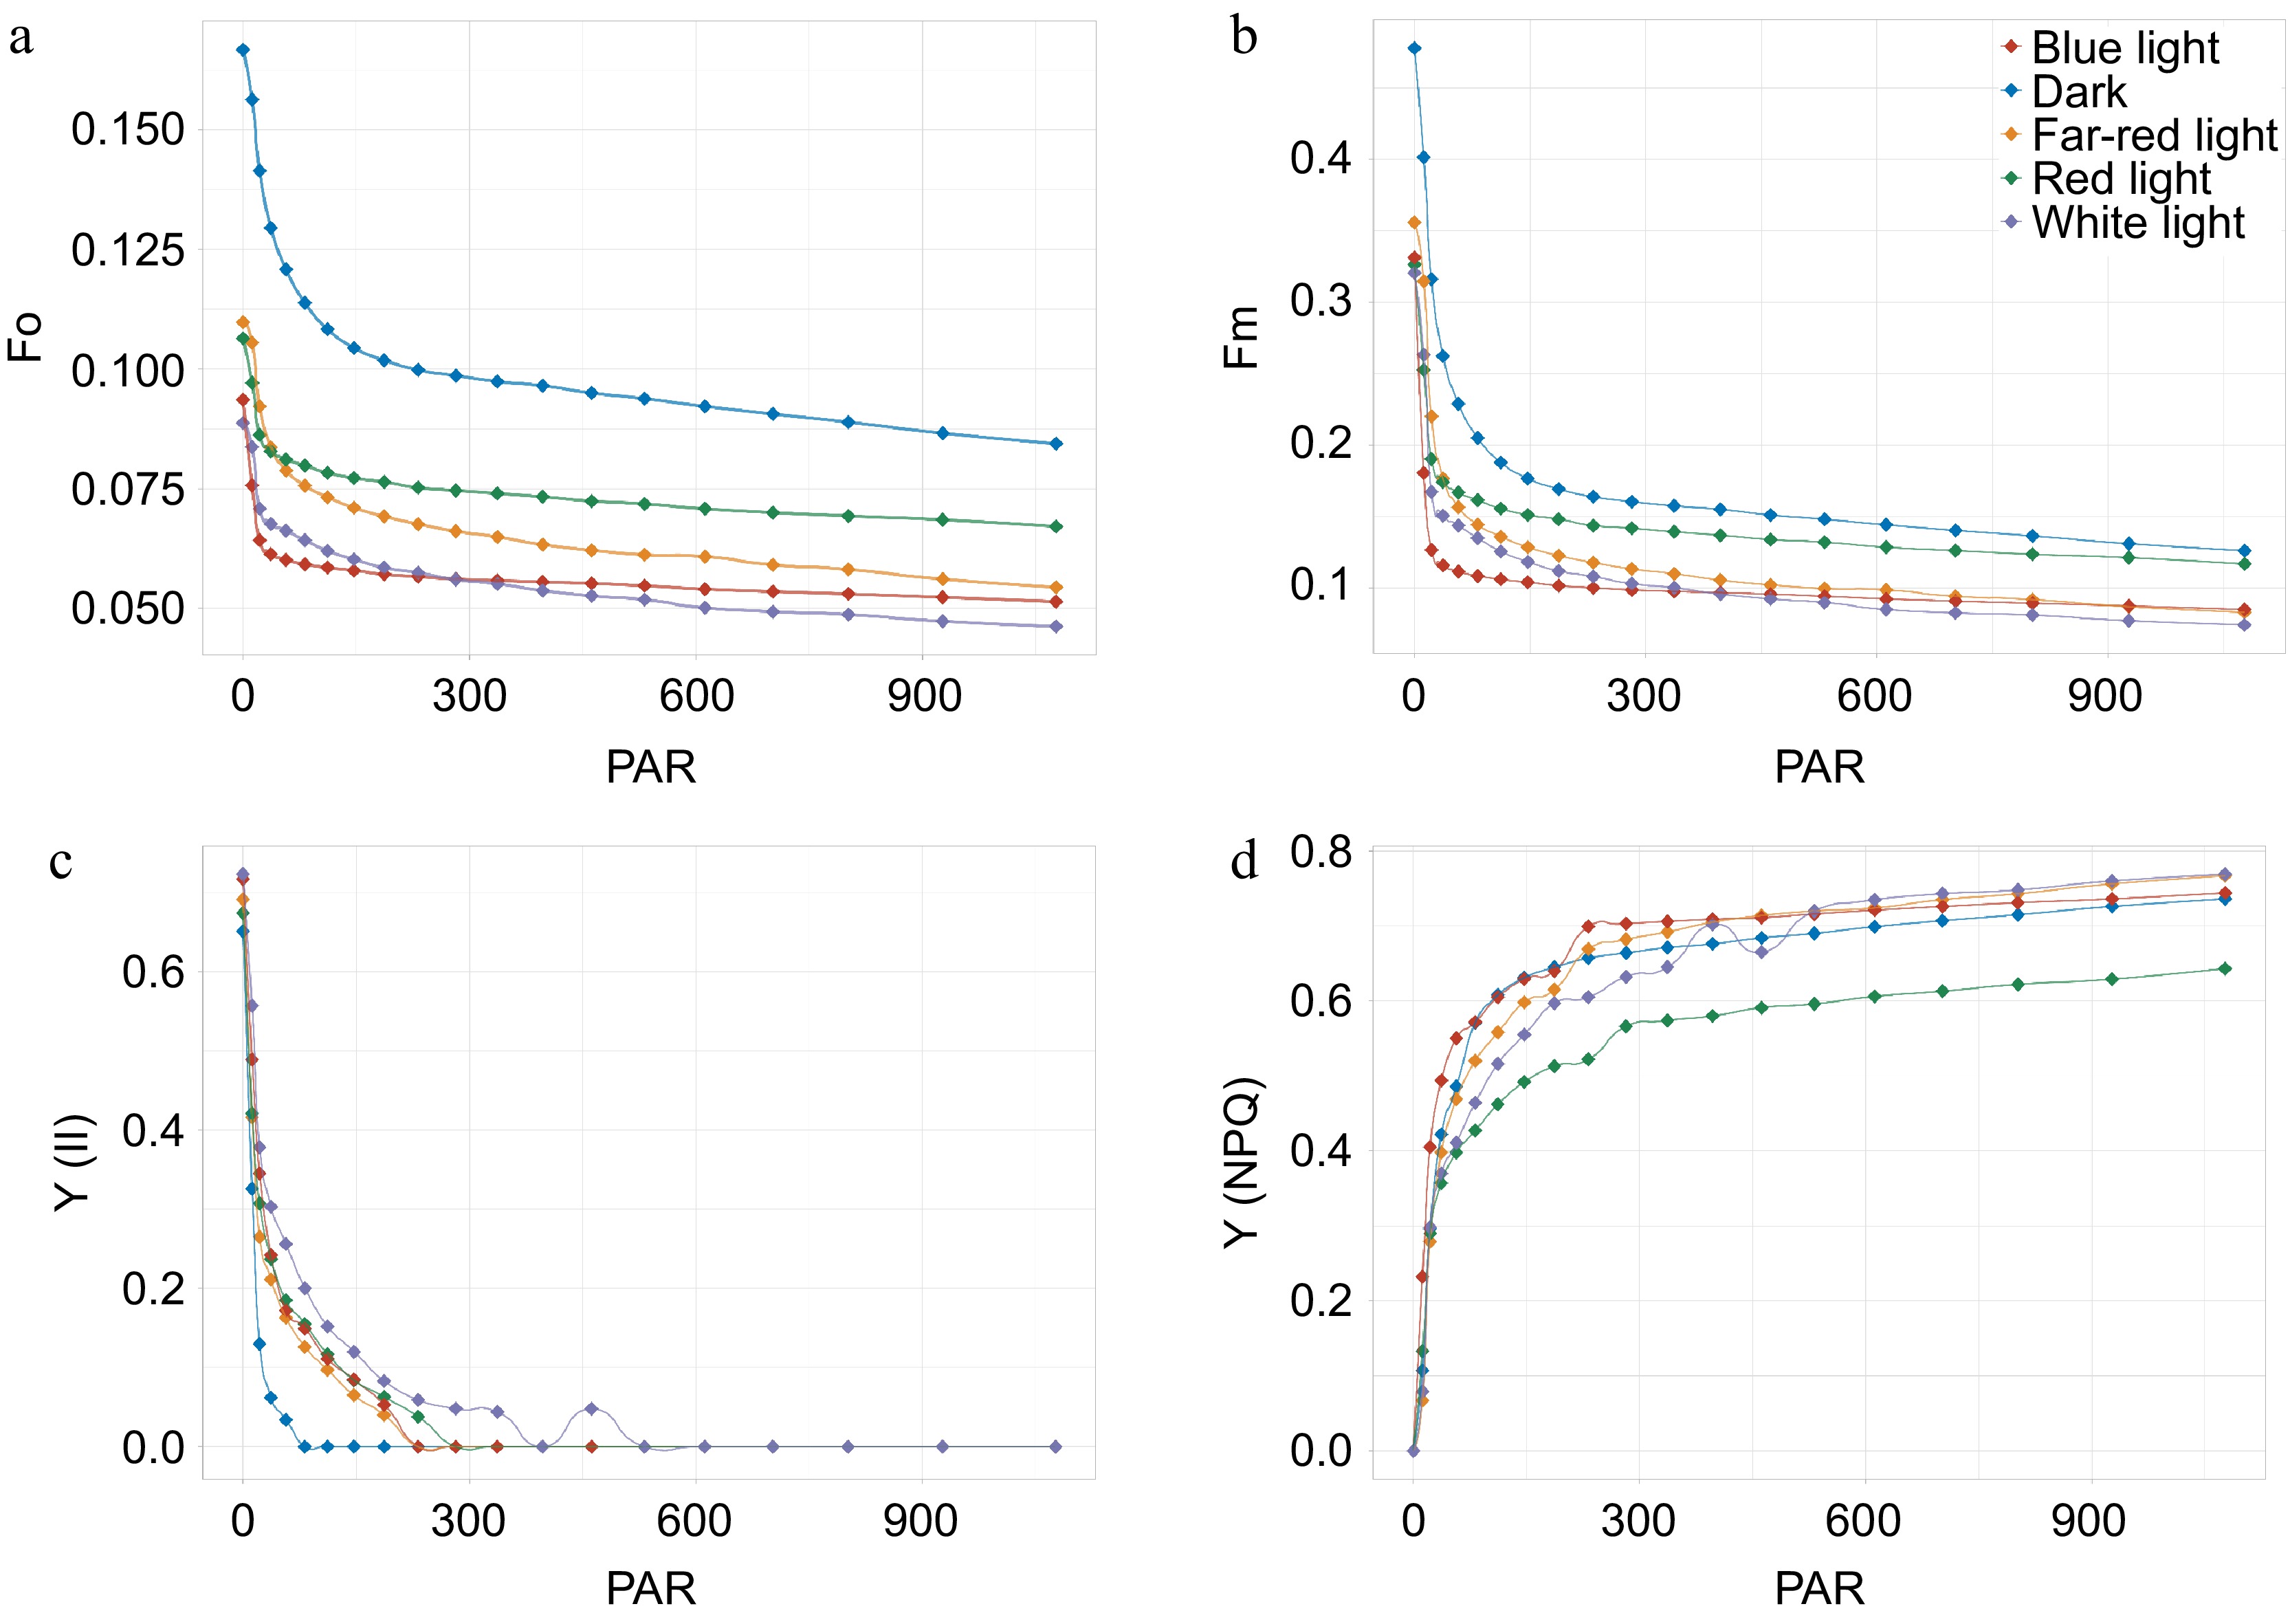
Figure 3.
Photosynthetic performance of patchouli plant in different light conditions. (a)−(d) Illustrate the light response curves for different photosynthetic parameters. F0, minimal fluorescence in the dark adaptation state; Fm, the maximum quantum yield of PS II photochemistry measured in the dark adaptation state; Y(II), PS II actual photosynthetic efficiency, effective quantum yield of photochemical energy conversion in PS II; Y(NPQ), Quantum yield of regulated non-photochemical quenching. X-axis refer to photosynthetically active radiation (PAR).
-
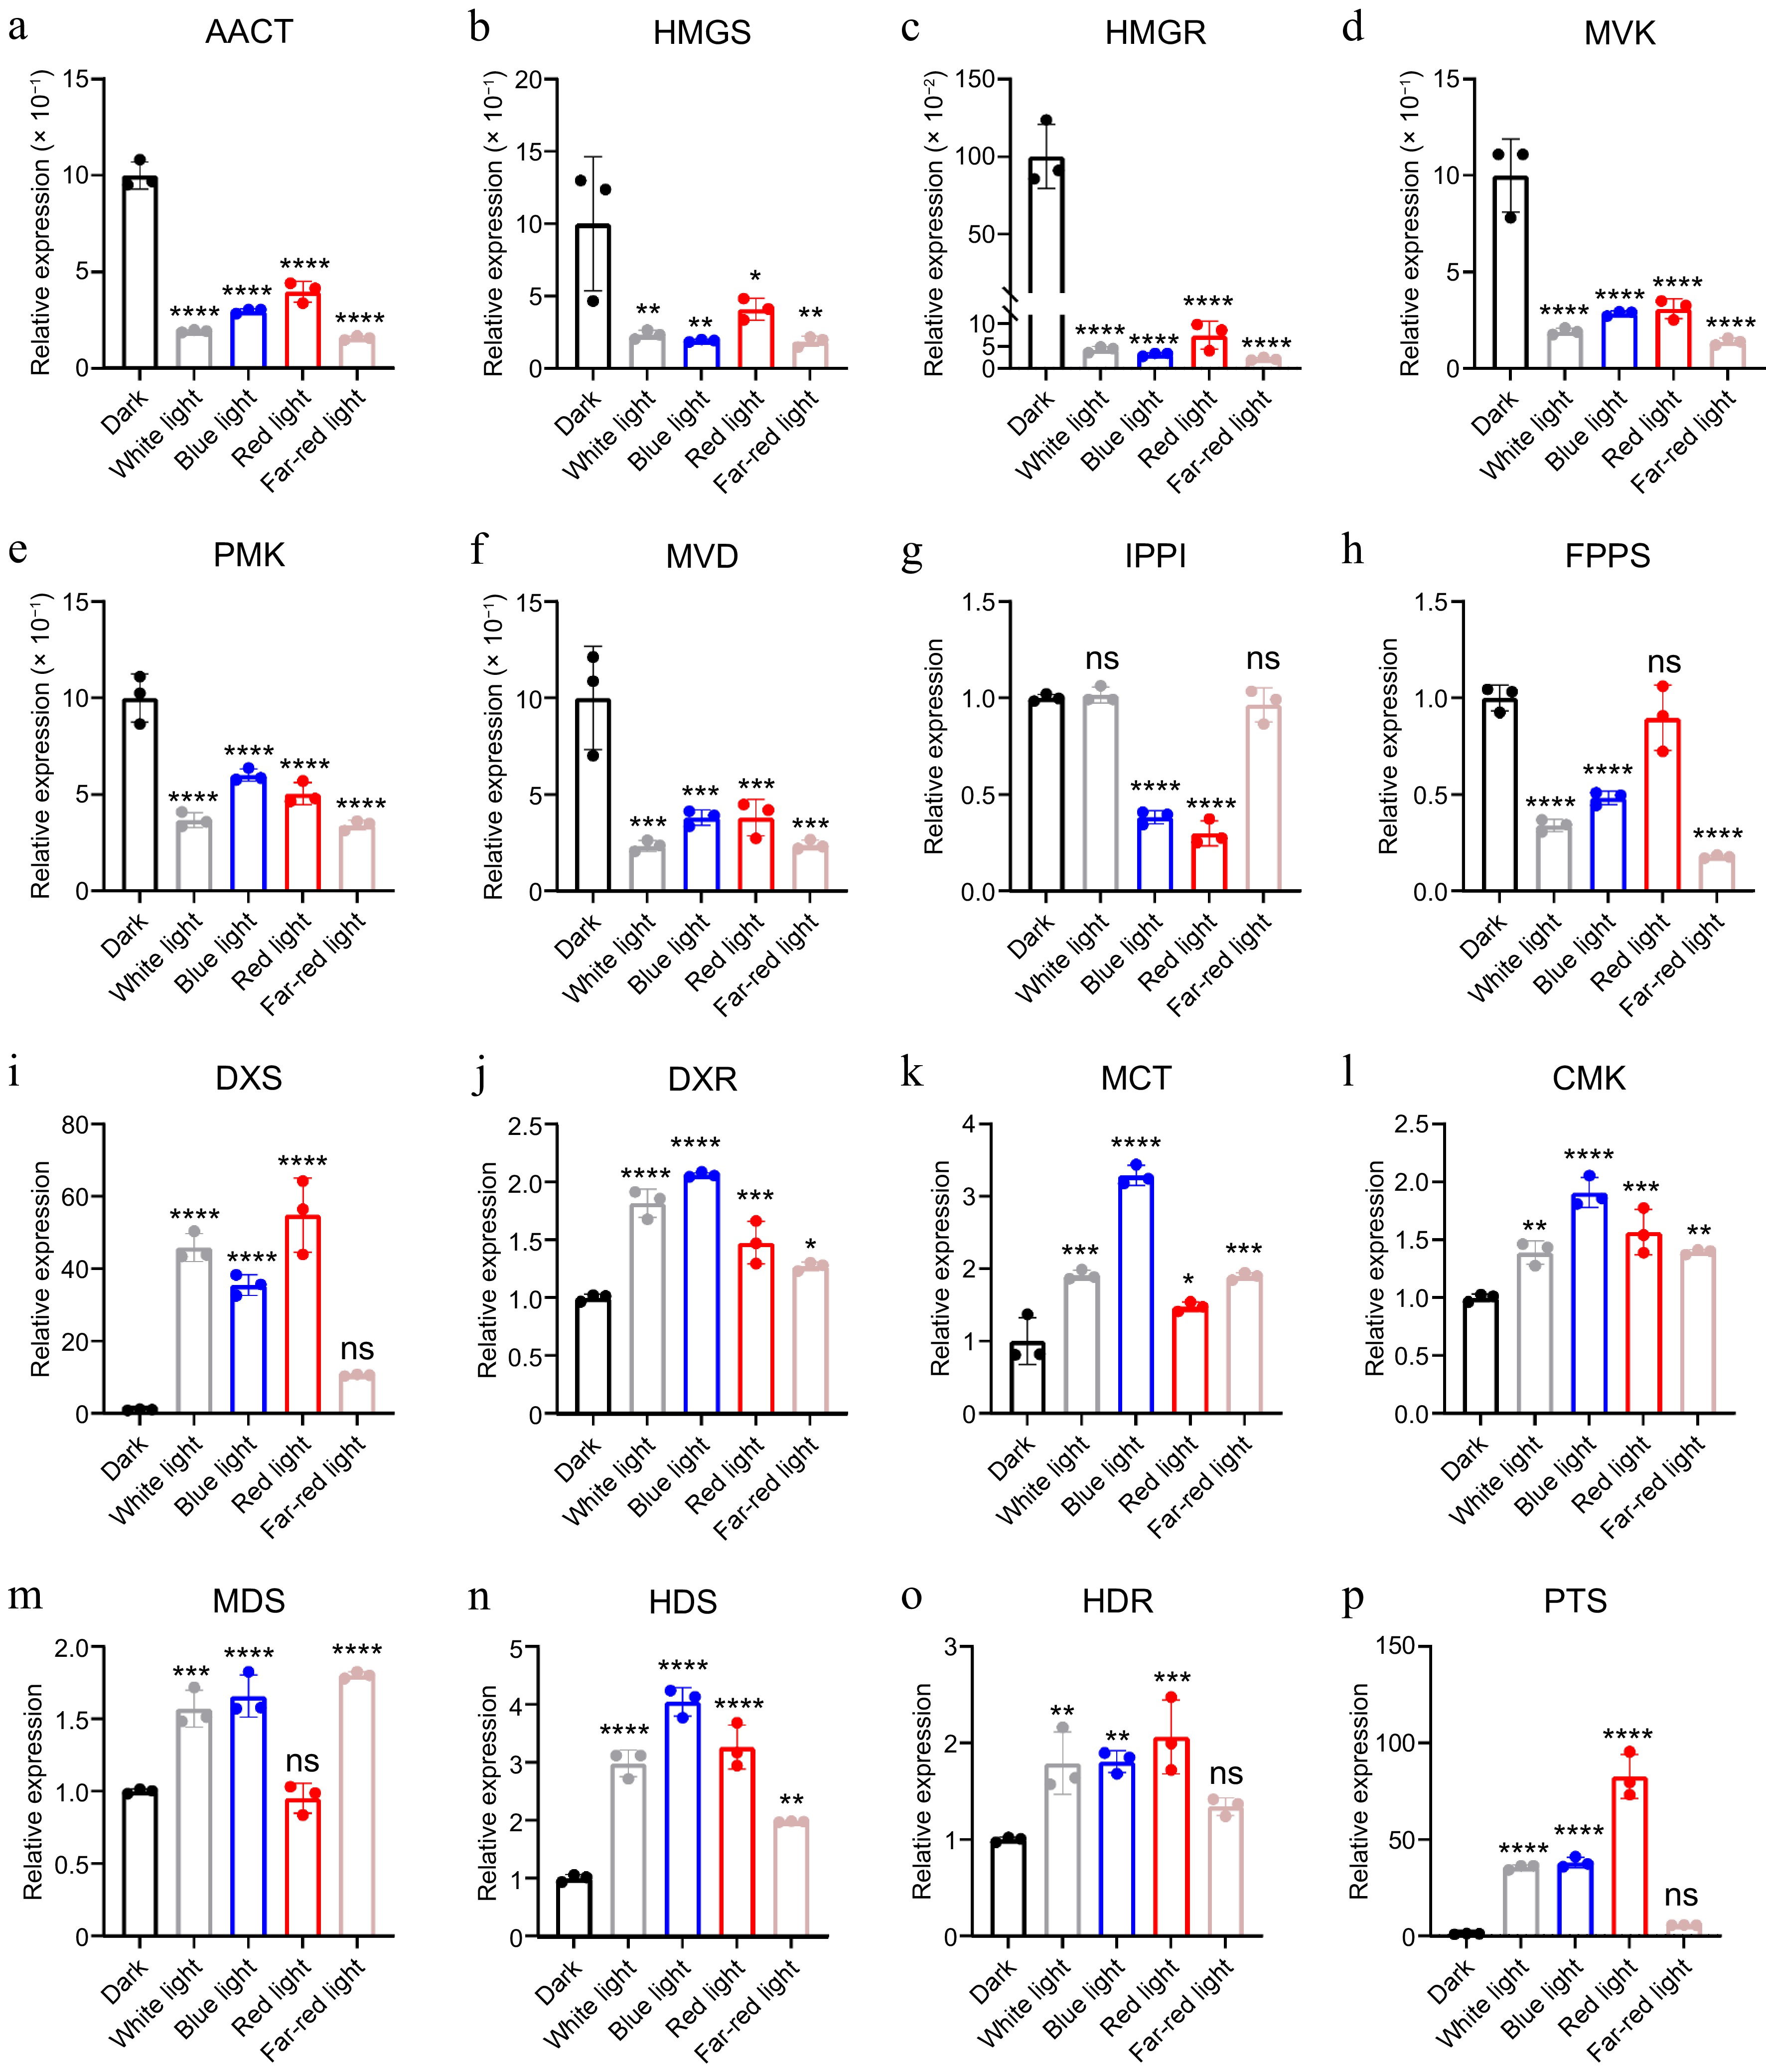
Figure 4.
Relative expression of enzyme genes in patchoulol biosynthesis. * p < 0.05; ** p < 0.01; *** p < 0.001; **** p < 0.0001; ns, not significant. Student's t-test.
-
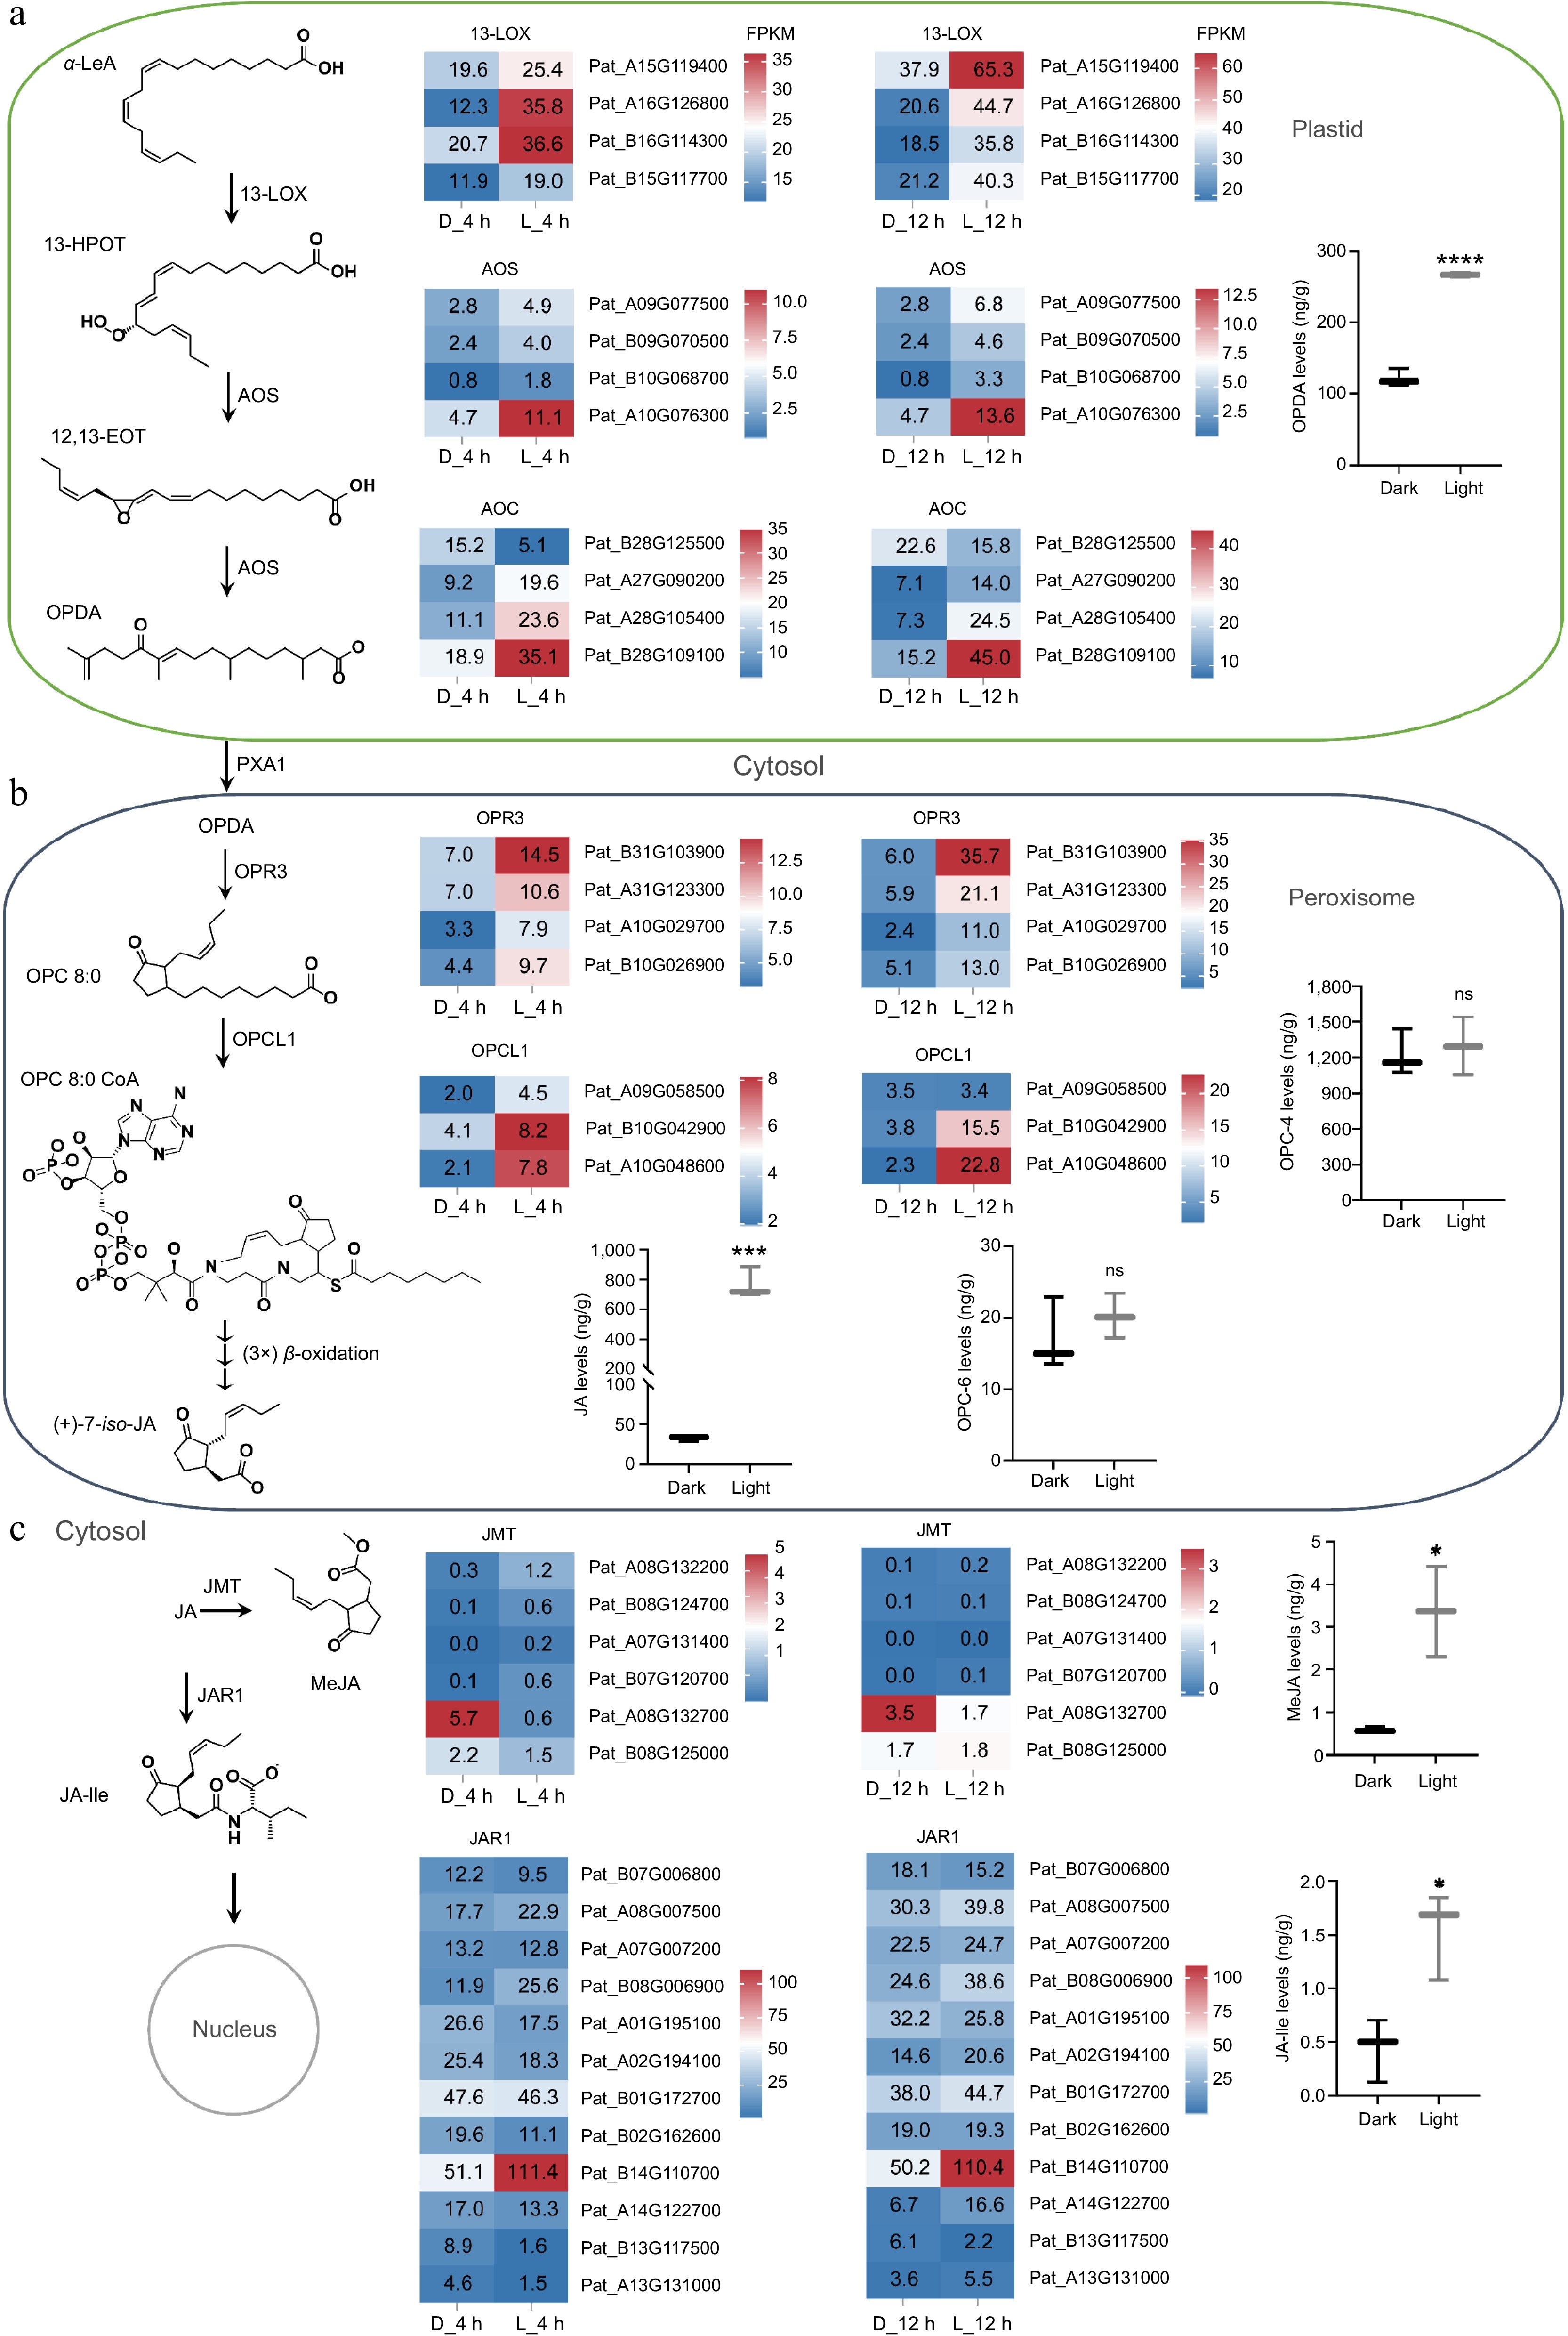
Figure 5.
Gene expression profiles and product accumulations in the jasmonates biosynthesis pathway. (a) Accumulation of OPDA and expression of related enzyme genes in plastids. (b) Accumulation levels of OPC-4 and OPC-6 and their synthetases gene expression in peroxisomes. (c) Accumulation levels of MeJA and JA-Ile and expressions of their synthetases in the cytosol. * p < 0.05; **** p < 0.0001; ns, not significant. Student's t-test.
-
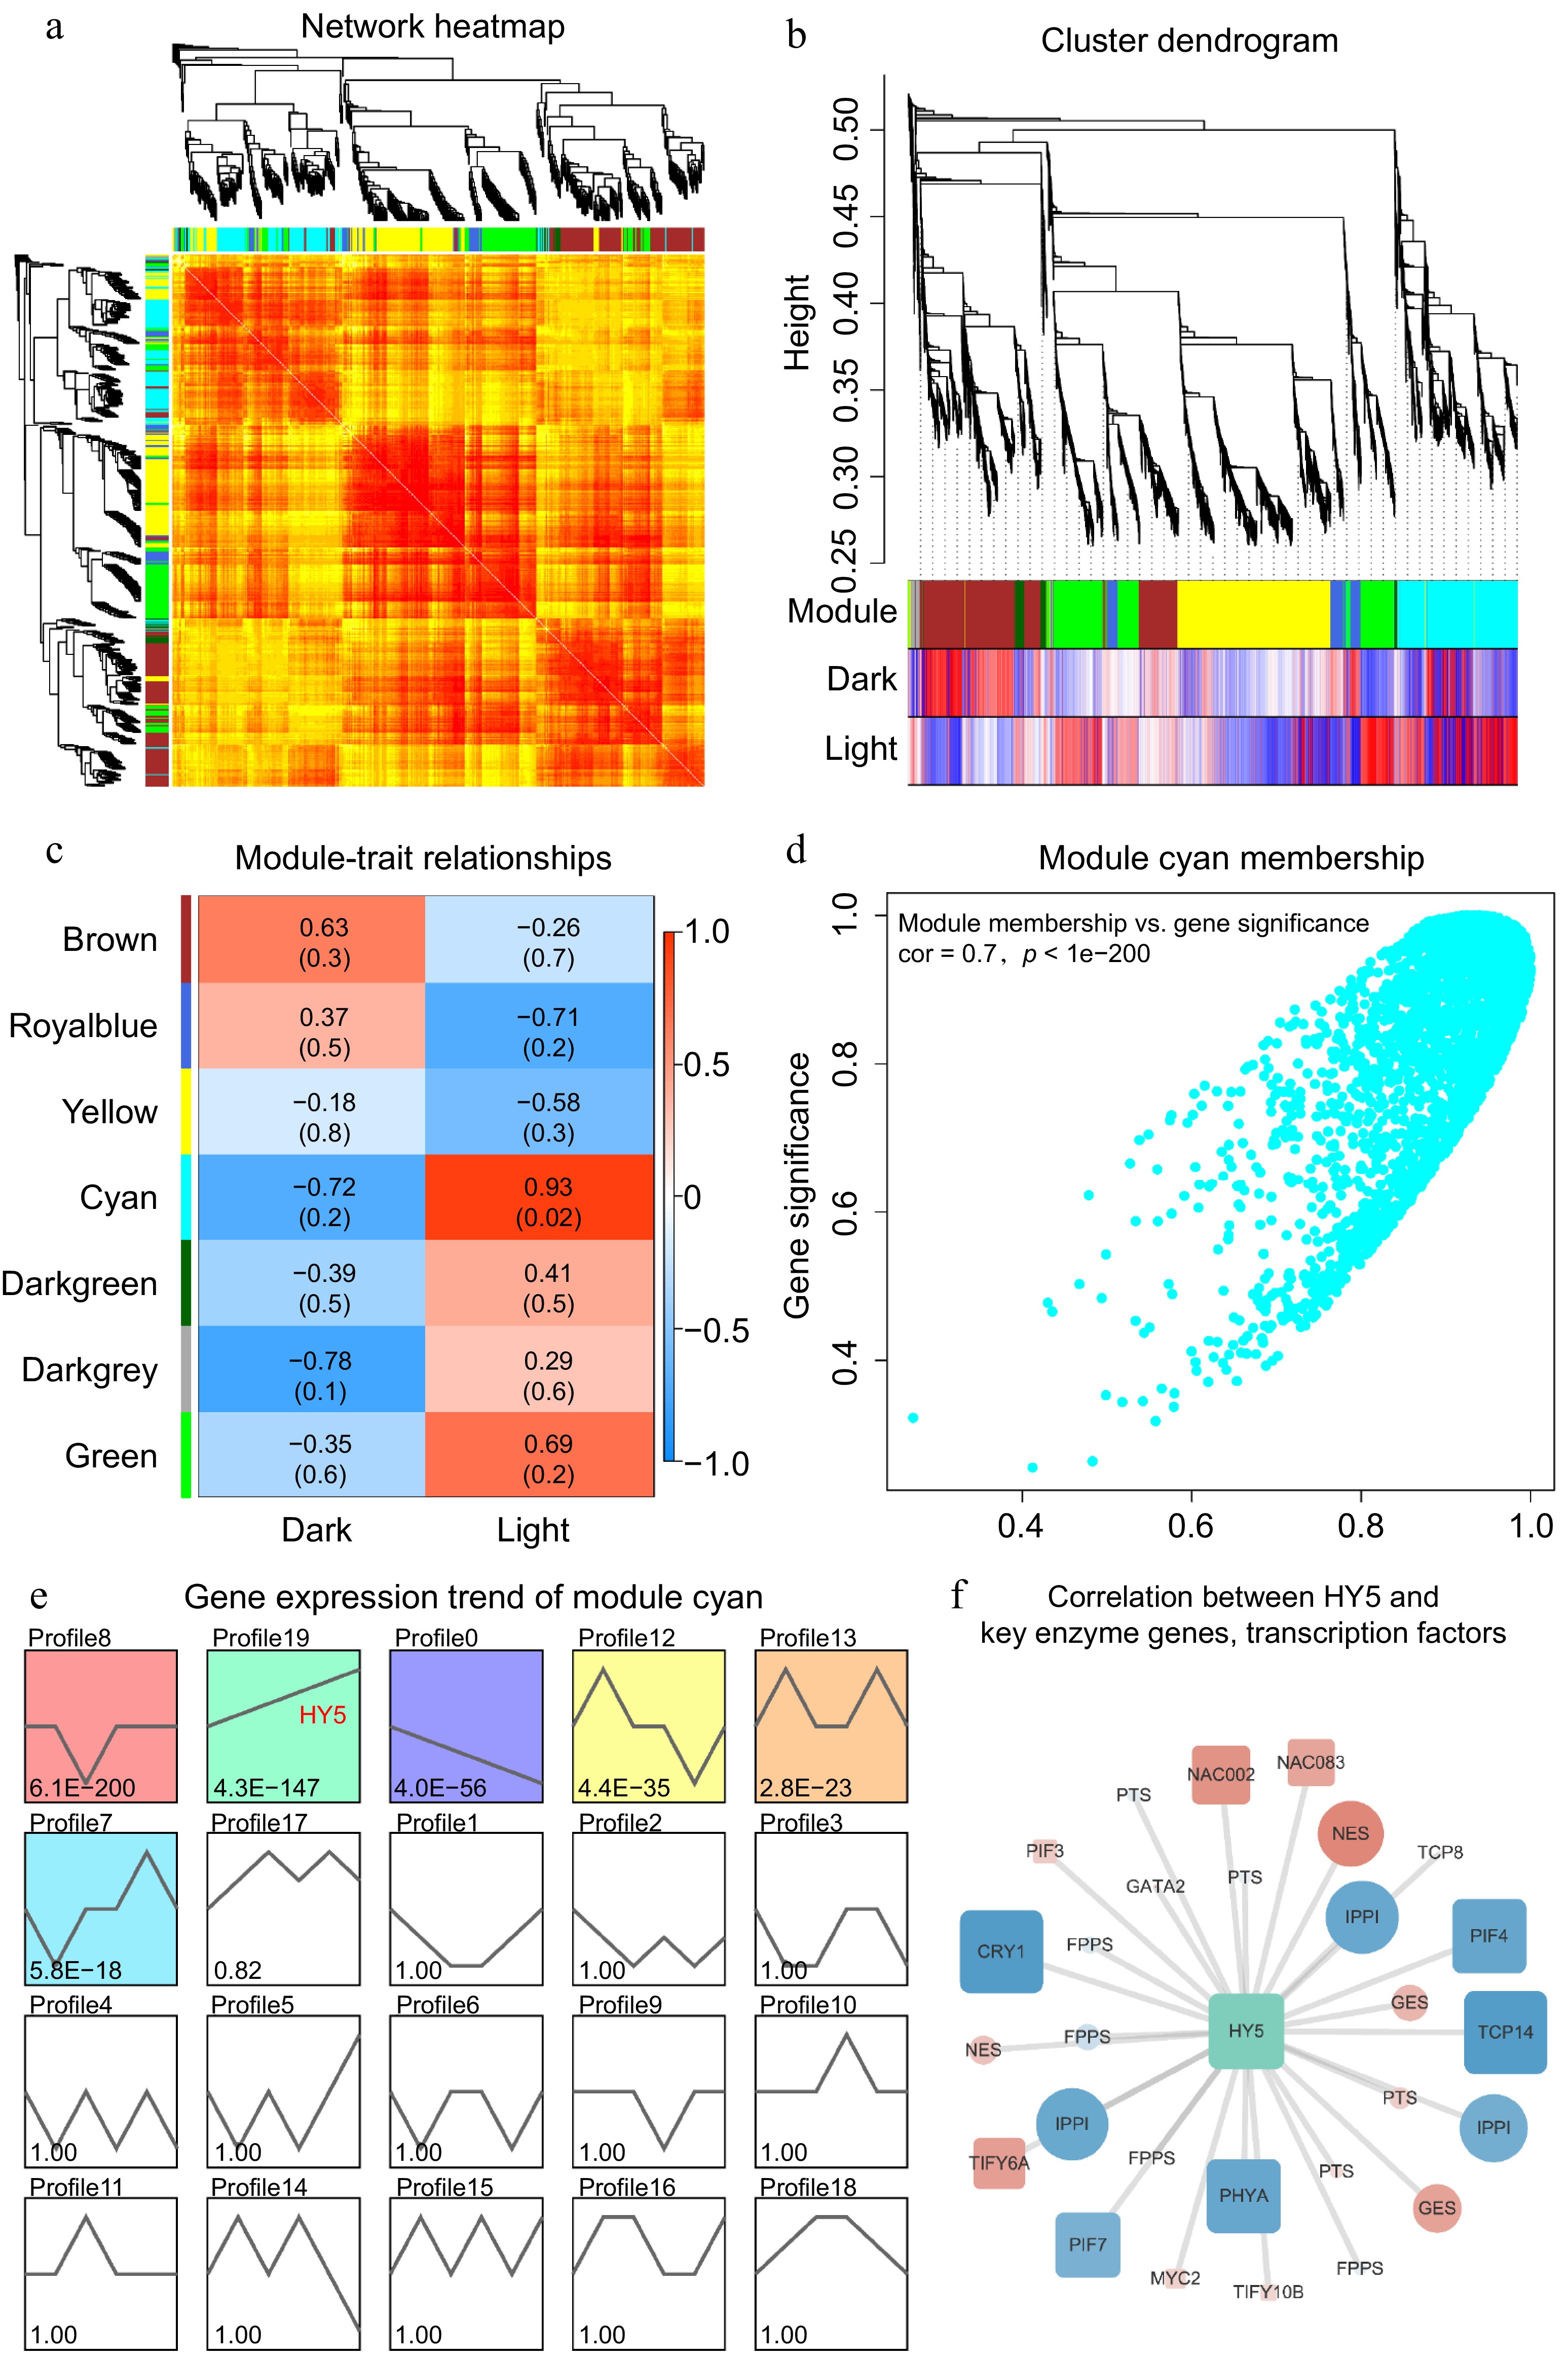
Figure 6.
(a) The network heatmap illustrates the gene expression profiles of samples from darkness and light groups; not all genes are displayed. Darker red shades indicate smaller dissimilarities between genes. Symmetrical phylogenetic clustering trees are shown on the left and top sides. (b) The clustering dendrogram provides a visual representation of the hierarchical clustering of genes, with a minimum height value of 0.25 and a minimum module size of 30. This dendrogram further emphasizes the separation of genes into dark and light groups. (c) The module-trait plot demonstrates the correlations between different gene modules and traits. The intensity of the colors indicates the strength of the correlation, with darker red representing stronger positive correlations and darker blue indicating stronger negative correlations. (d) The scatter plot reveals the relationship between module membership and gene significance for the cyan module. A higher correlation coefficient and smaller P value indicate that the module's gene members are more representative of the module's characteristics. (e) The gene expression trends of module cyan members are displayed, depicting various expression profiles. The smaller the P value in these profiles, the more reliable the trends are. Notably, the profile associated with HY5 is highlighted. (f) The correlation network illustrates the relationships between HY5 and key enzyme genes as well as transcription factors. Positive correlations are marked in red, while negative correlations are marked in blue. The size of the nodes reflects the strength of the correlation with HY5, providing insights into the regulatory network involved in patchoulol biosynthesis.
-
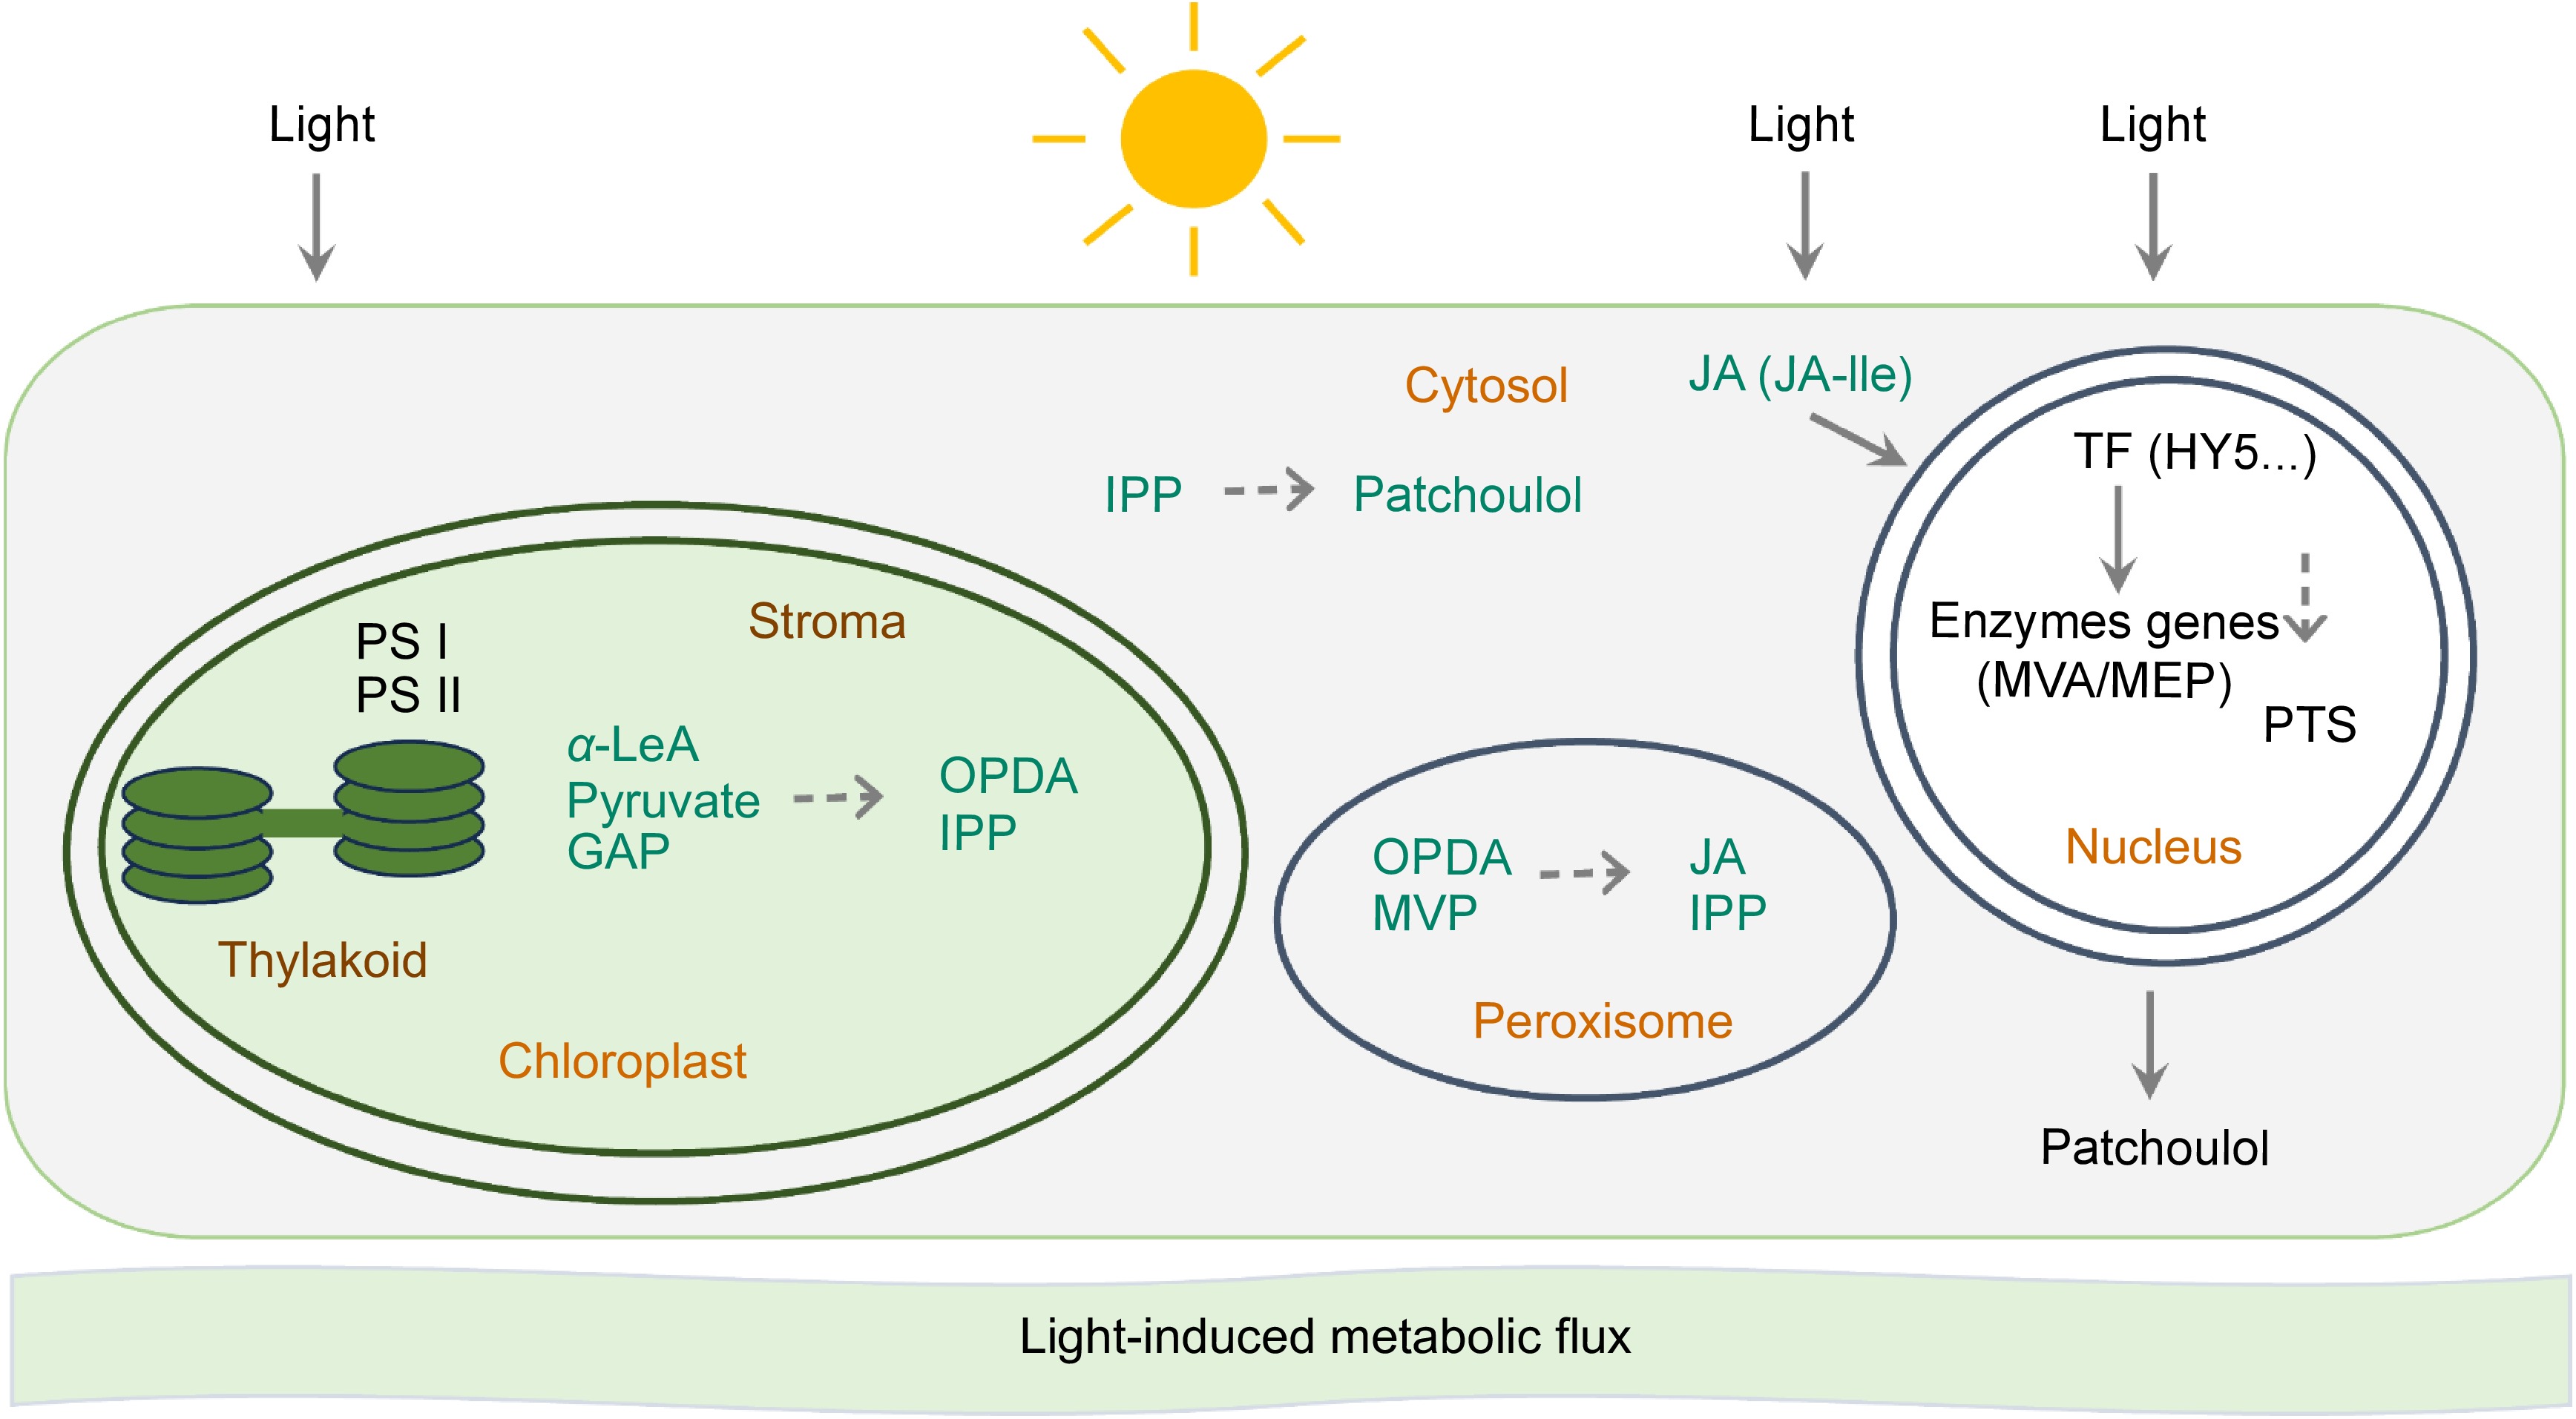
Figure 7.
Jasmonates regulate light-induced patchoulol biosynthesis in P. cablin. Light may initiate a multi-layered regulatory network in P. cablin. Chloroplast-MEP axis: light induces MEP pathway genes, enhancing IPP production; plastid transporters export precursors to cytosol for patchoulol synthesis. Photosynthetic coupling: PSI/II-generated redox signals activate MEP enzymes while diverting carbon flux from competing pathways. JA-mediated regulation: light-stimulated OPDA synthesis in chloroplasts triggers JA-Ile signaling, activating MYC2 transcription factors that upregulate PTS and MEP genes. Photoreceptor cascades: phytochrome/cryptochrome-HY5 modules directly activate terpenoid biosynthetic genes through G-box promoter elements.
Figures
(7)
Tables
(0)