-
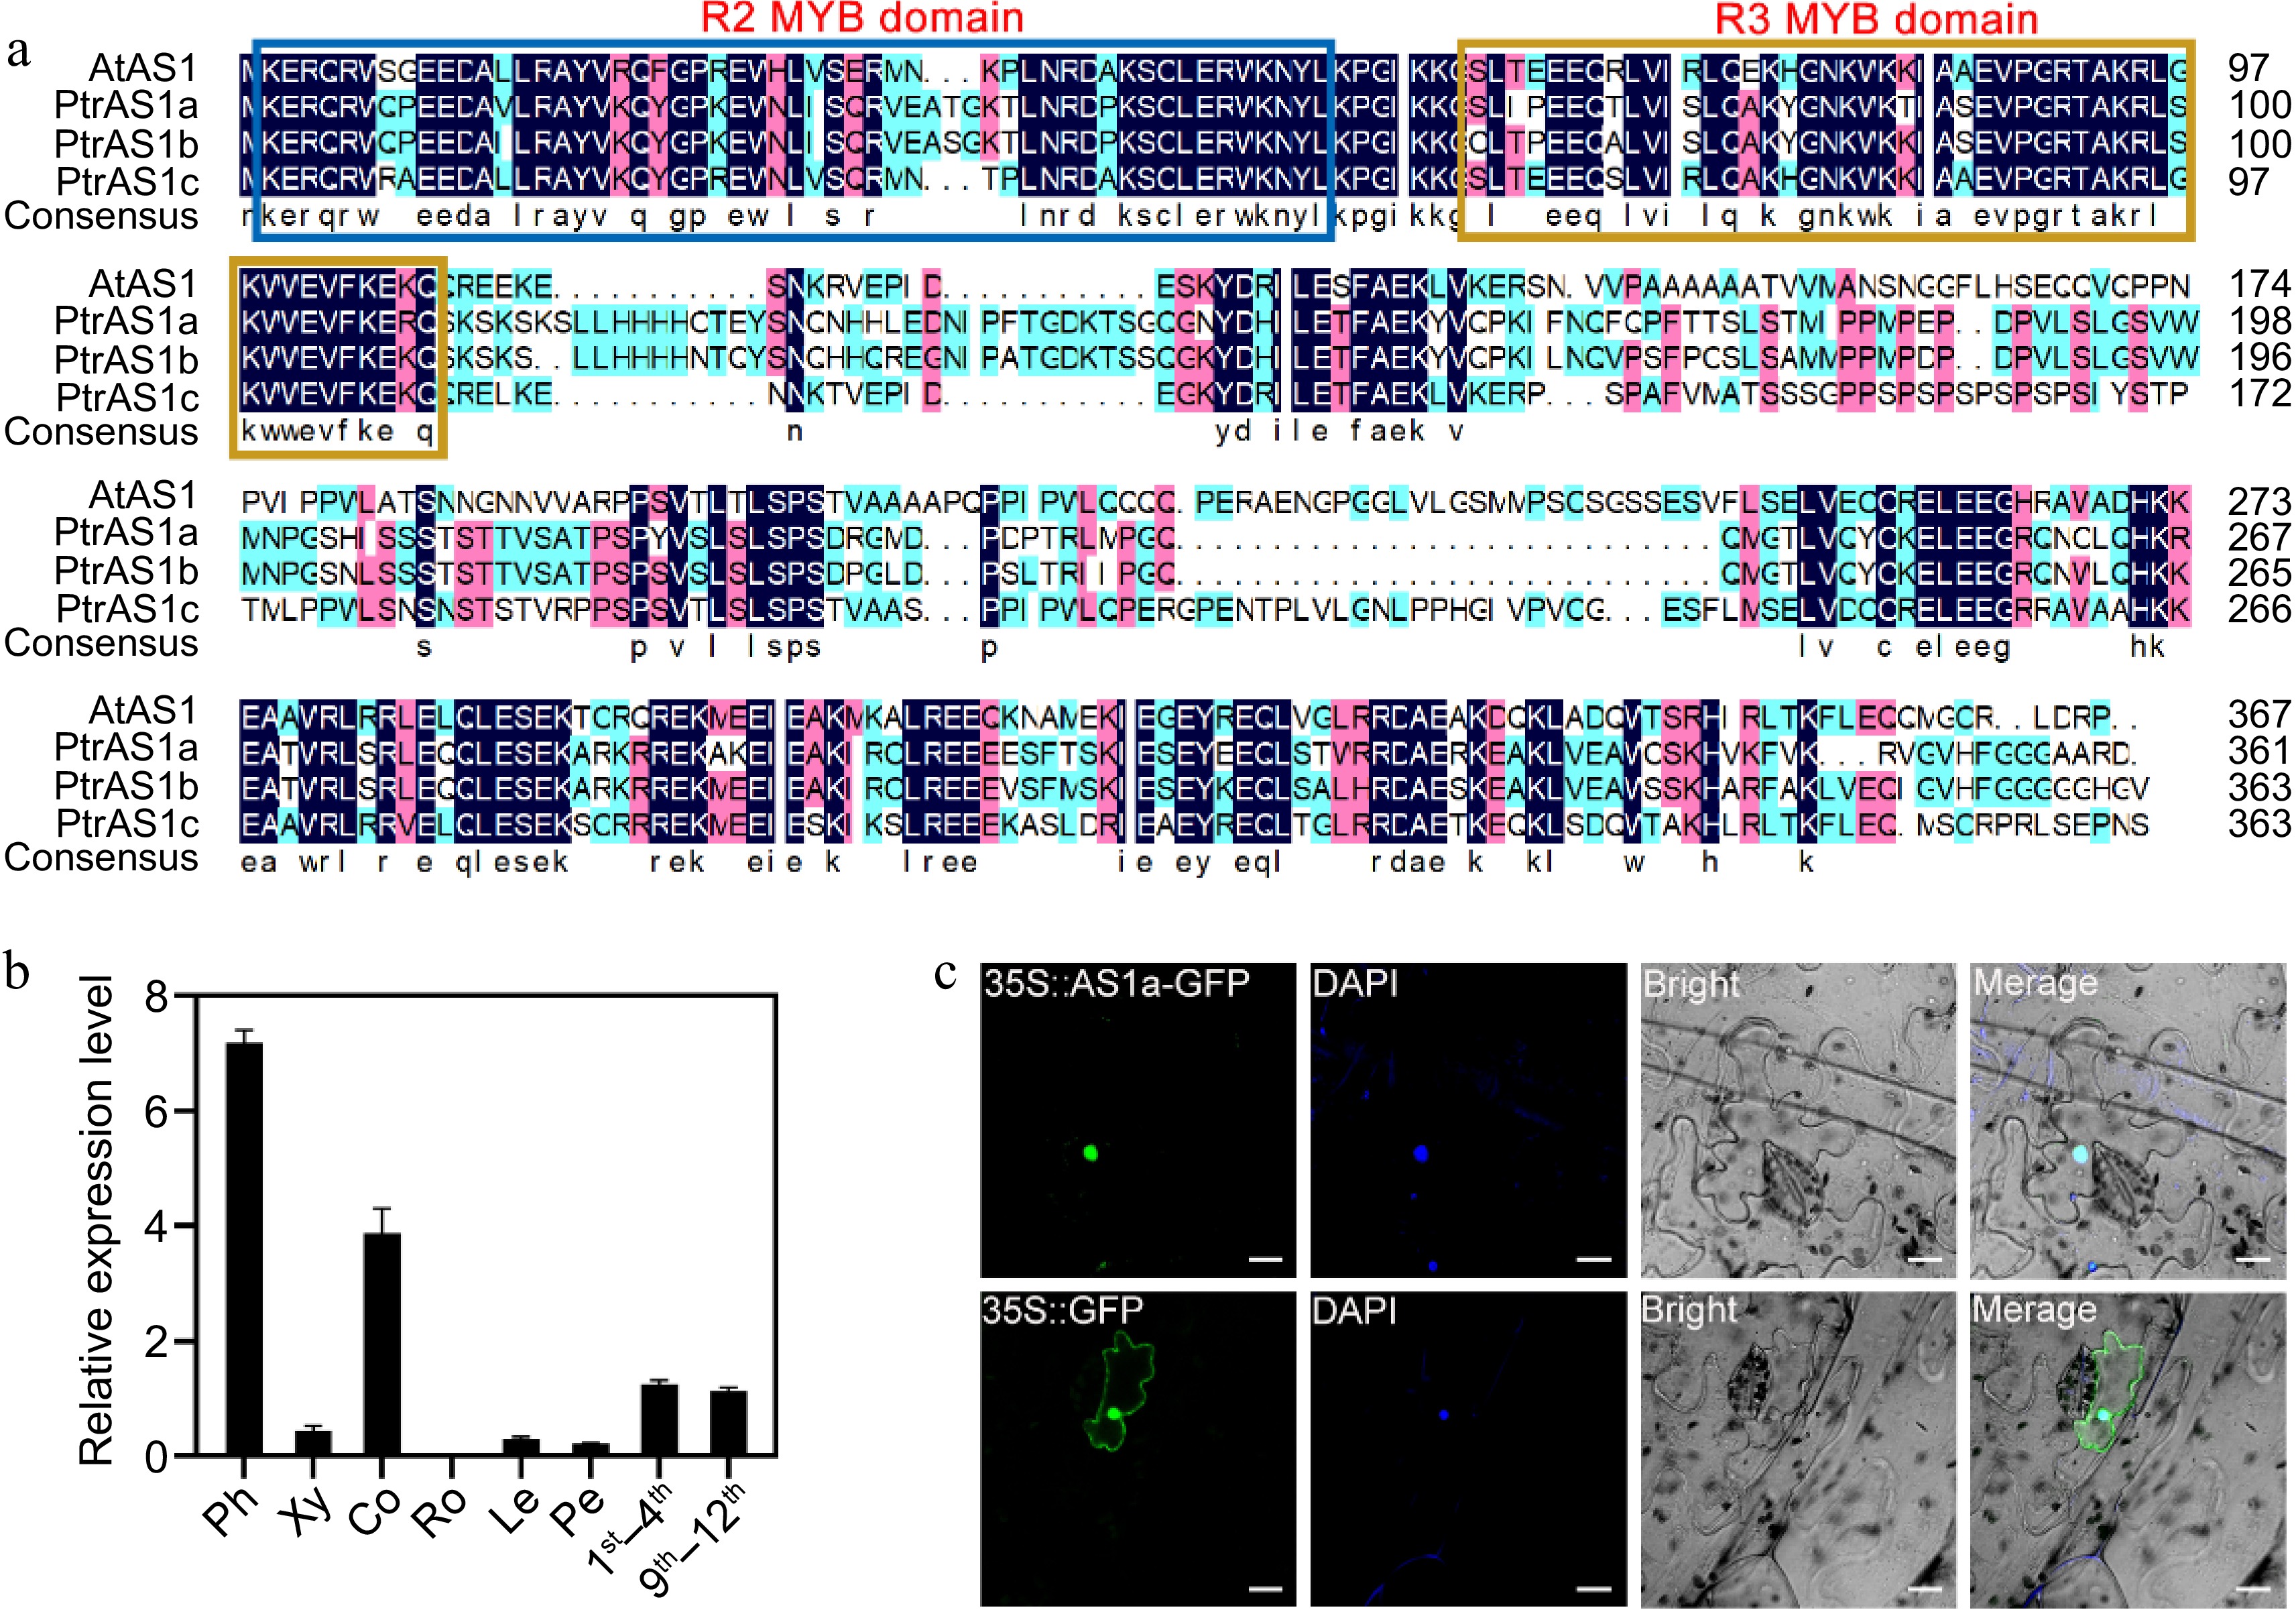
Figure 1.
Characterization of PagAS1a. (a) Multiple sequence alignment of Populus and Arabidopsis AS1 proteins. (b) PagAS1a expression levels in various tissues assayed by RT-qPCR. Ph, phloem; Xy, xylem; Co, cortex; Ro, root; Le, leaf; Pe, petiole; 1st−4th, first to fourth stem internodes; 9th−12th, ninth to twelfth stem internodes. (c) Subcellular localization of PagAS1a. The nucleus was confirmed by DAPI staining. Scale bar: 20 μm.
-
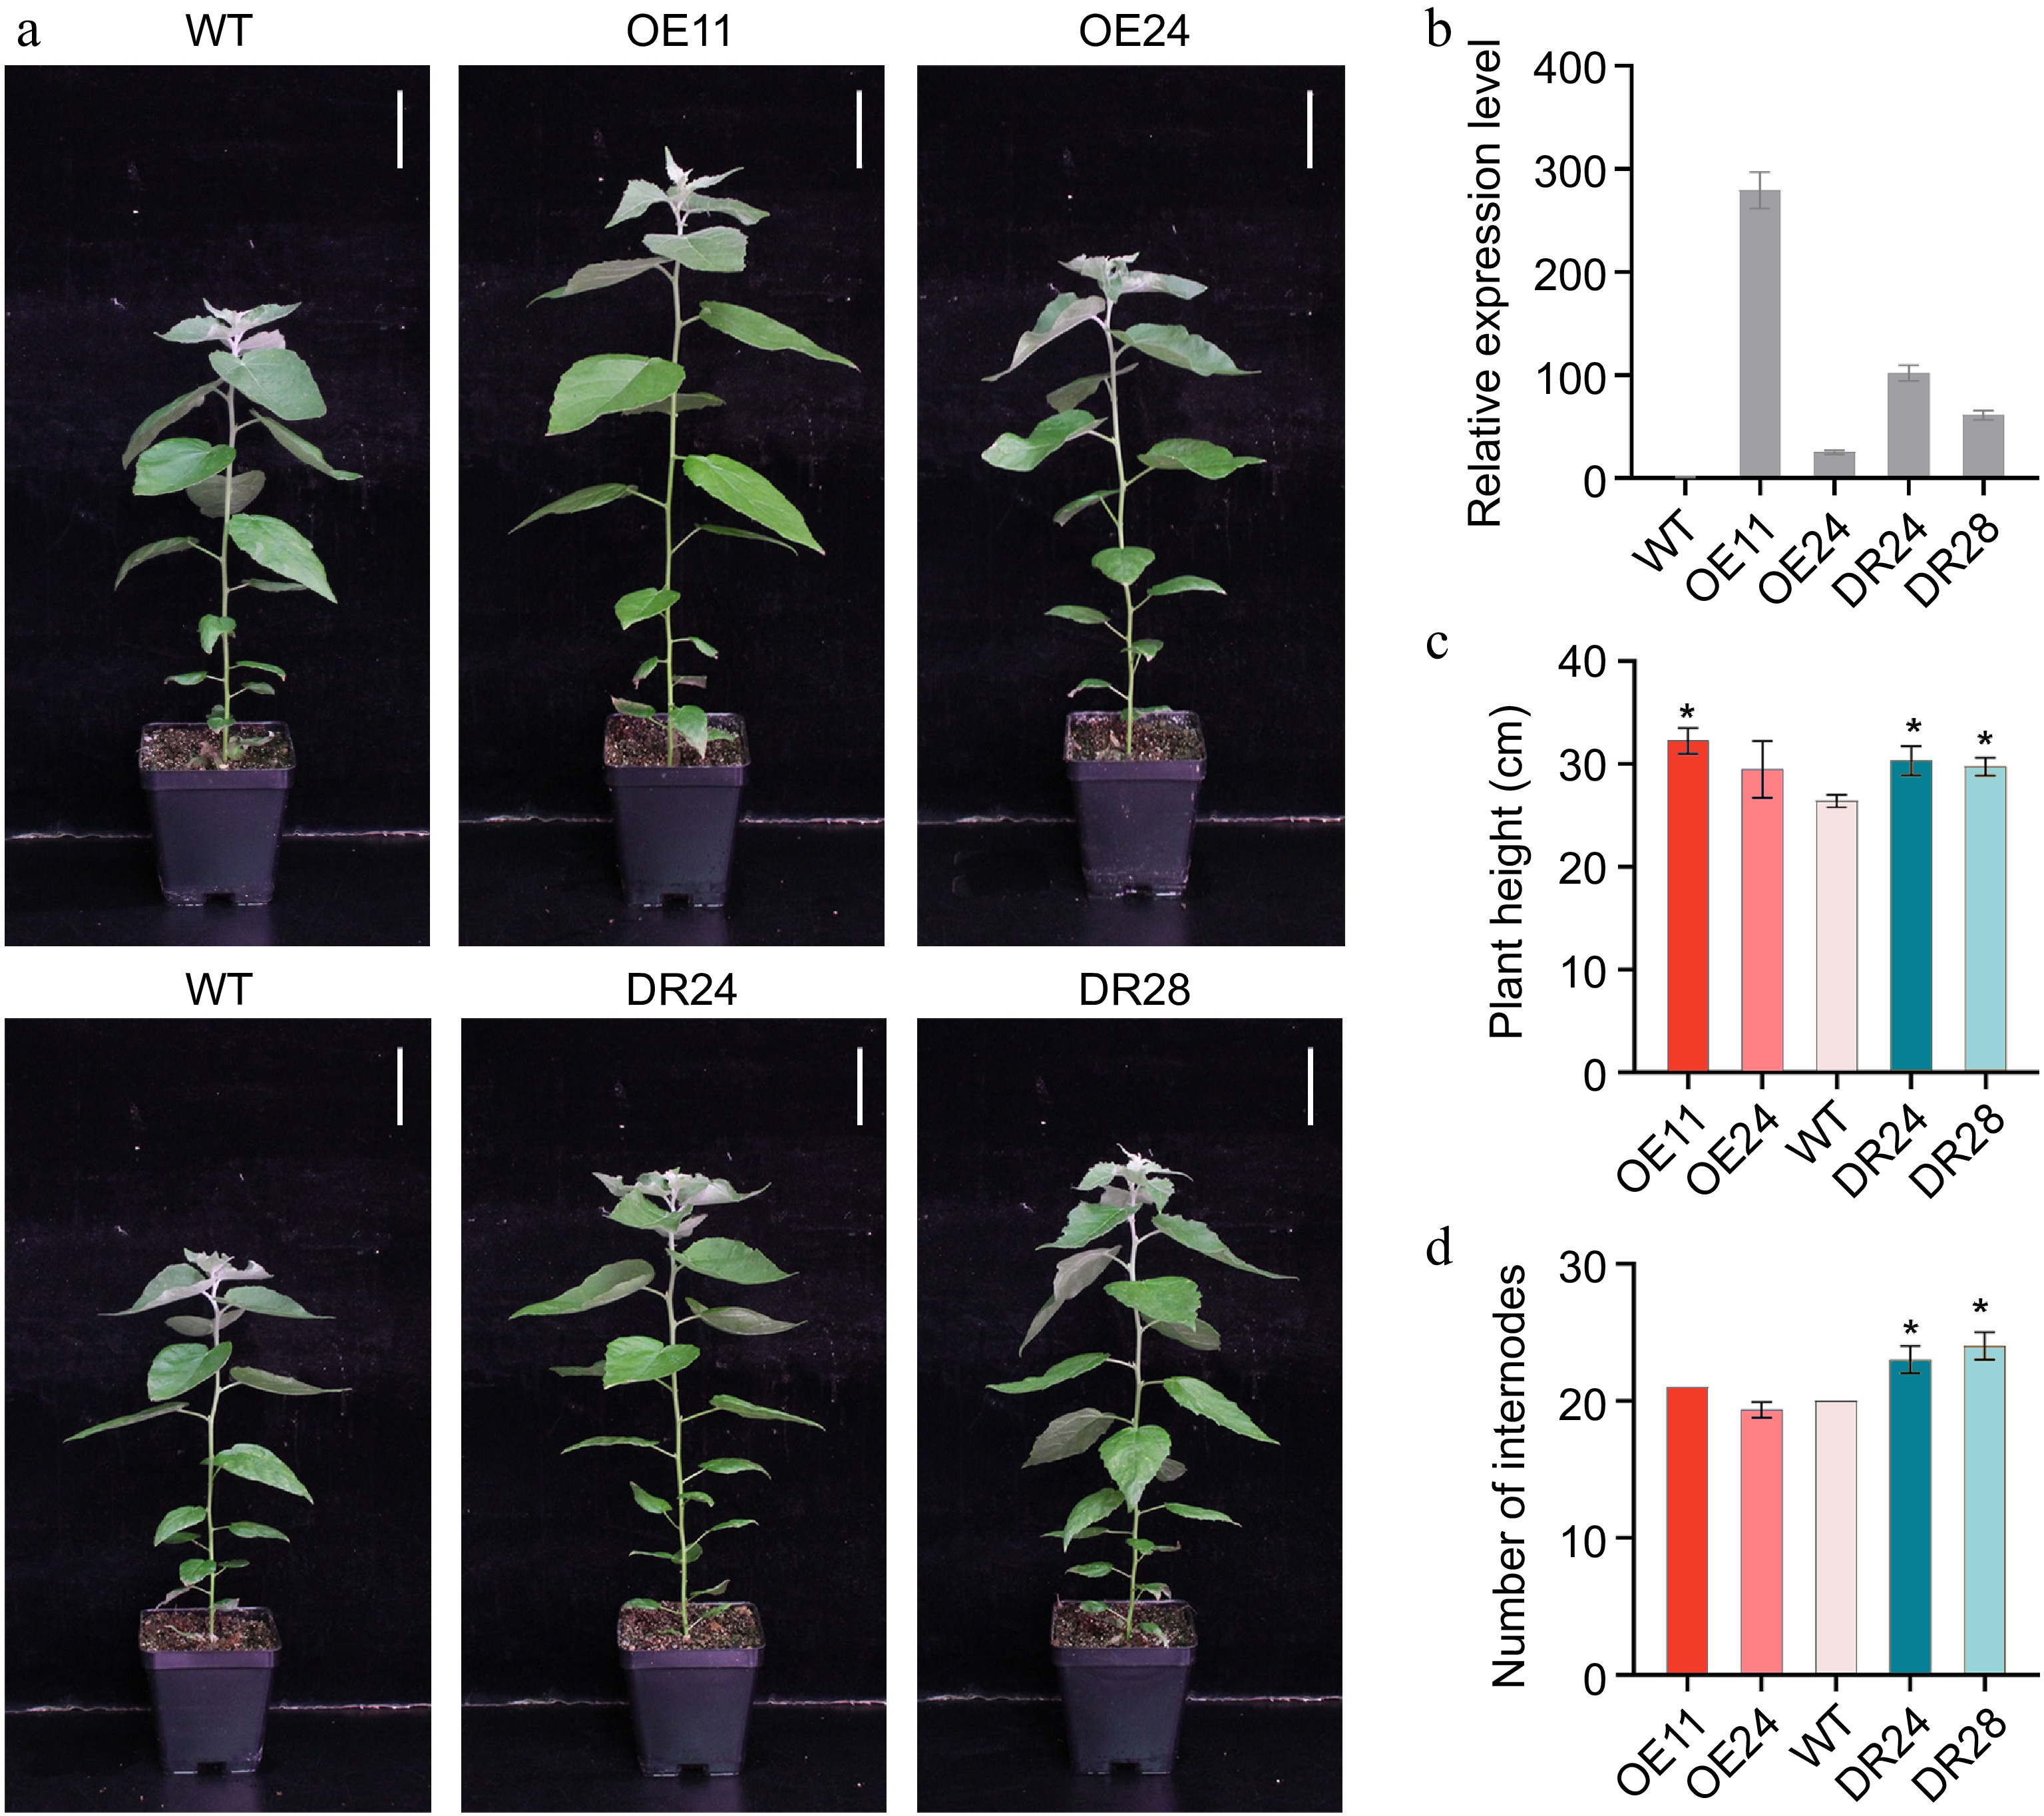
Figure 2.
Phenotype of PagAS1a overexpression and dominant repression transgenic plants. (a) Morphological phenotype of 2-month-old PagAS1a-OE transgenic plants (OE11, OE24) and PagAS1a-SRDX transgenic plants (DR24, DR28) compared with WT. Scale bar: 4 cm. (b) Expression levels of PagAS1a in PagAS1a-OE and PagAS1a-SRDX plants determined by RT-qPCR. (c) Plant height, and (d) number of internodes of transgenic lines and wild type (WT). Error bars represent SD. Asterisks indicate significant differences between WT and transgenic lines (Student's t-test): * p < 0.05.
-
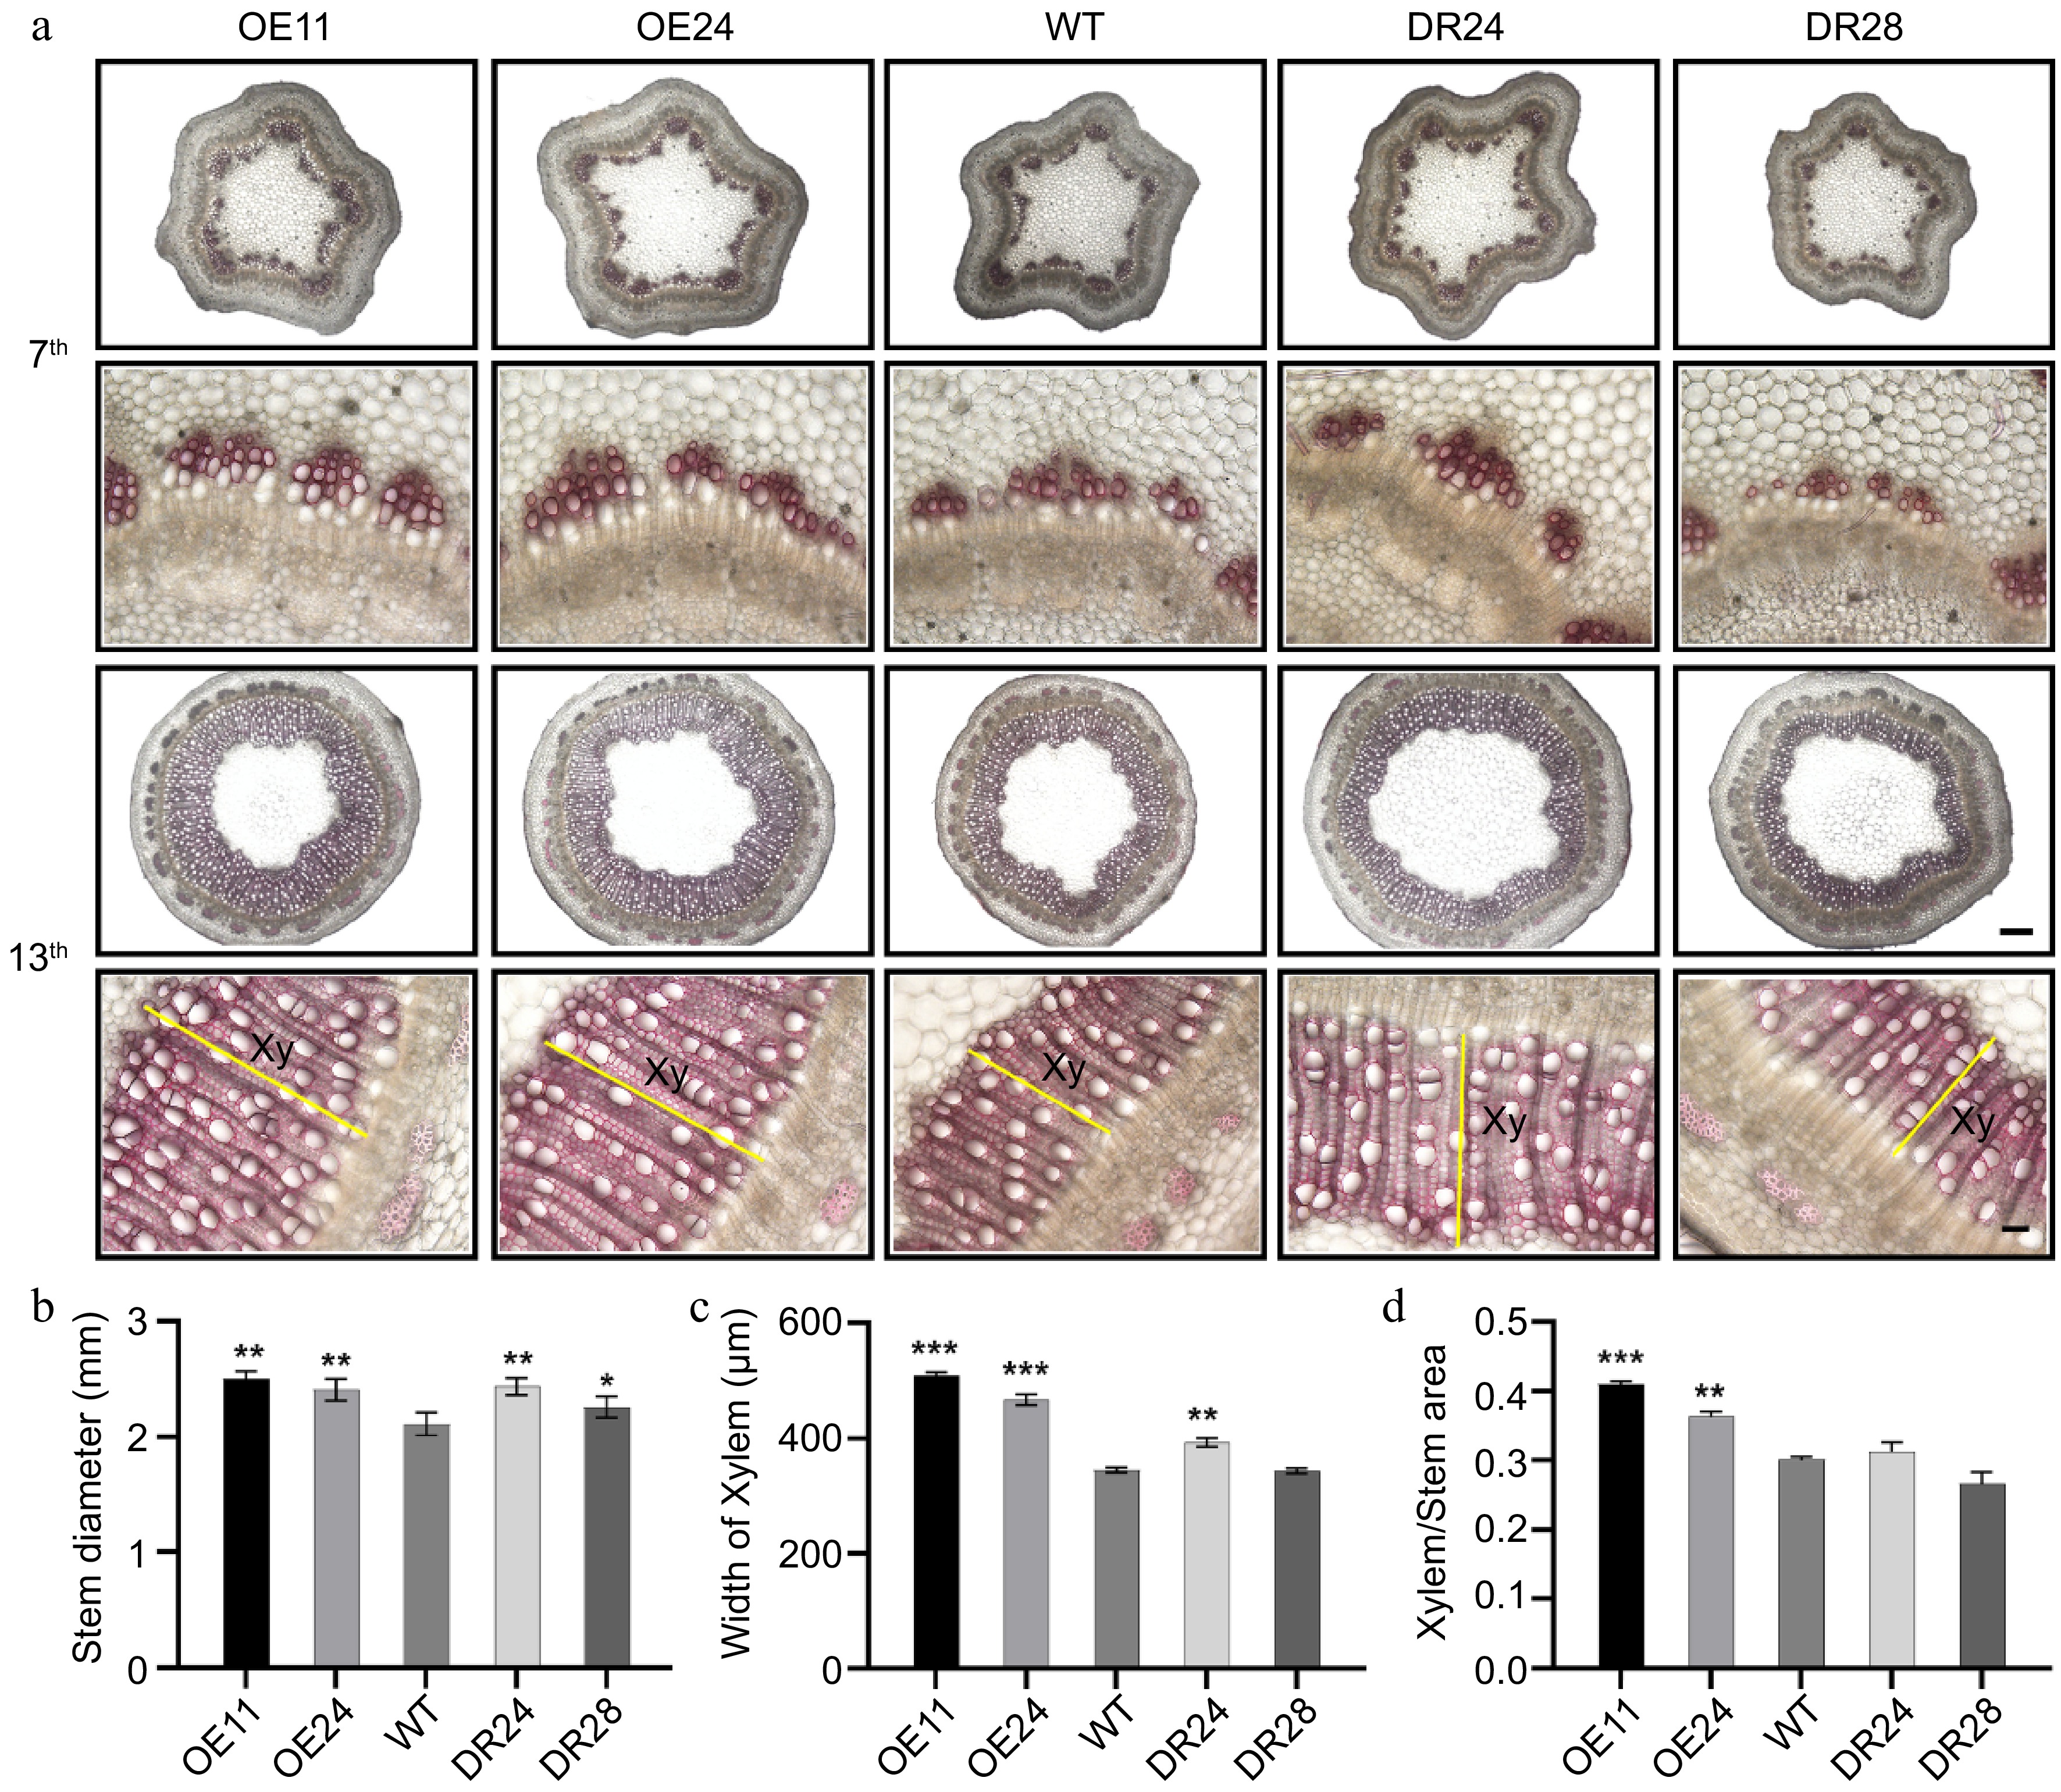
Figure 3.
Both PagAS1a overexpression and dominant repression plants promote xylem development. (a) Cross-section of the 7th and 13th stem internodes of WT, PagAS1a-OE, and PagAS1a-SRDX plants stained with 0.1% phloroglucinol solution, yellow lines label the secondary xylem (Xy) region. Scale bars: 300 μm for upper panels and 50 μm for lower panels. (b) Stem diameter of WT, PagAS1a-OE (OE11, OE24), and PagAS1a-SRDX (DR24, DR28) plants. Quantification of (c) xylem width, and (d) xylem area/stem cross-sectional area shown in (a). Data in (b)−(d) were collected from at least three individual plants for WT and transgenic lines. Asterisks indicate significant differences between WT and transgenic lines (Student's t-test: * p < 0.05; ** p < 0.01; *** p < 0.001.
-
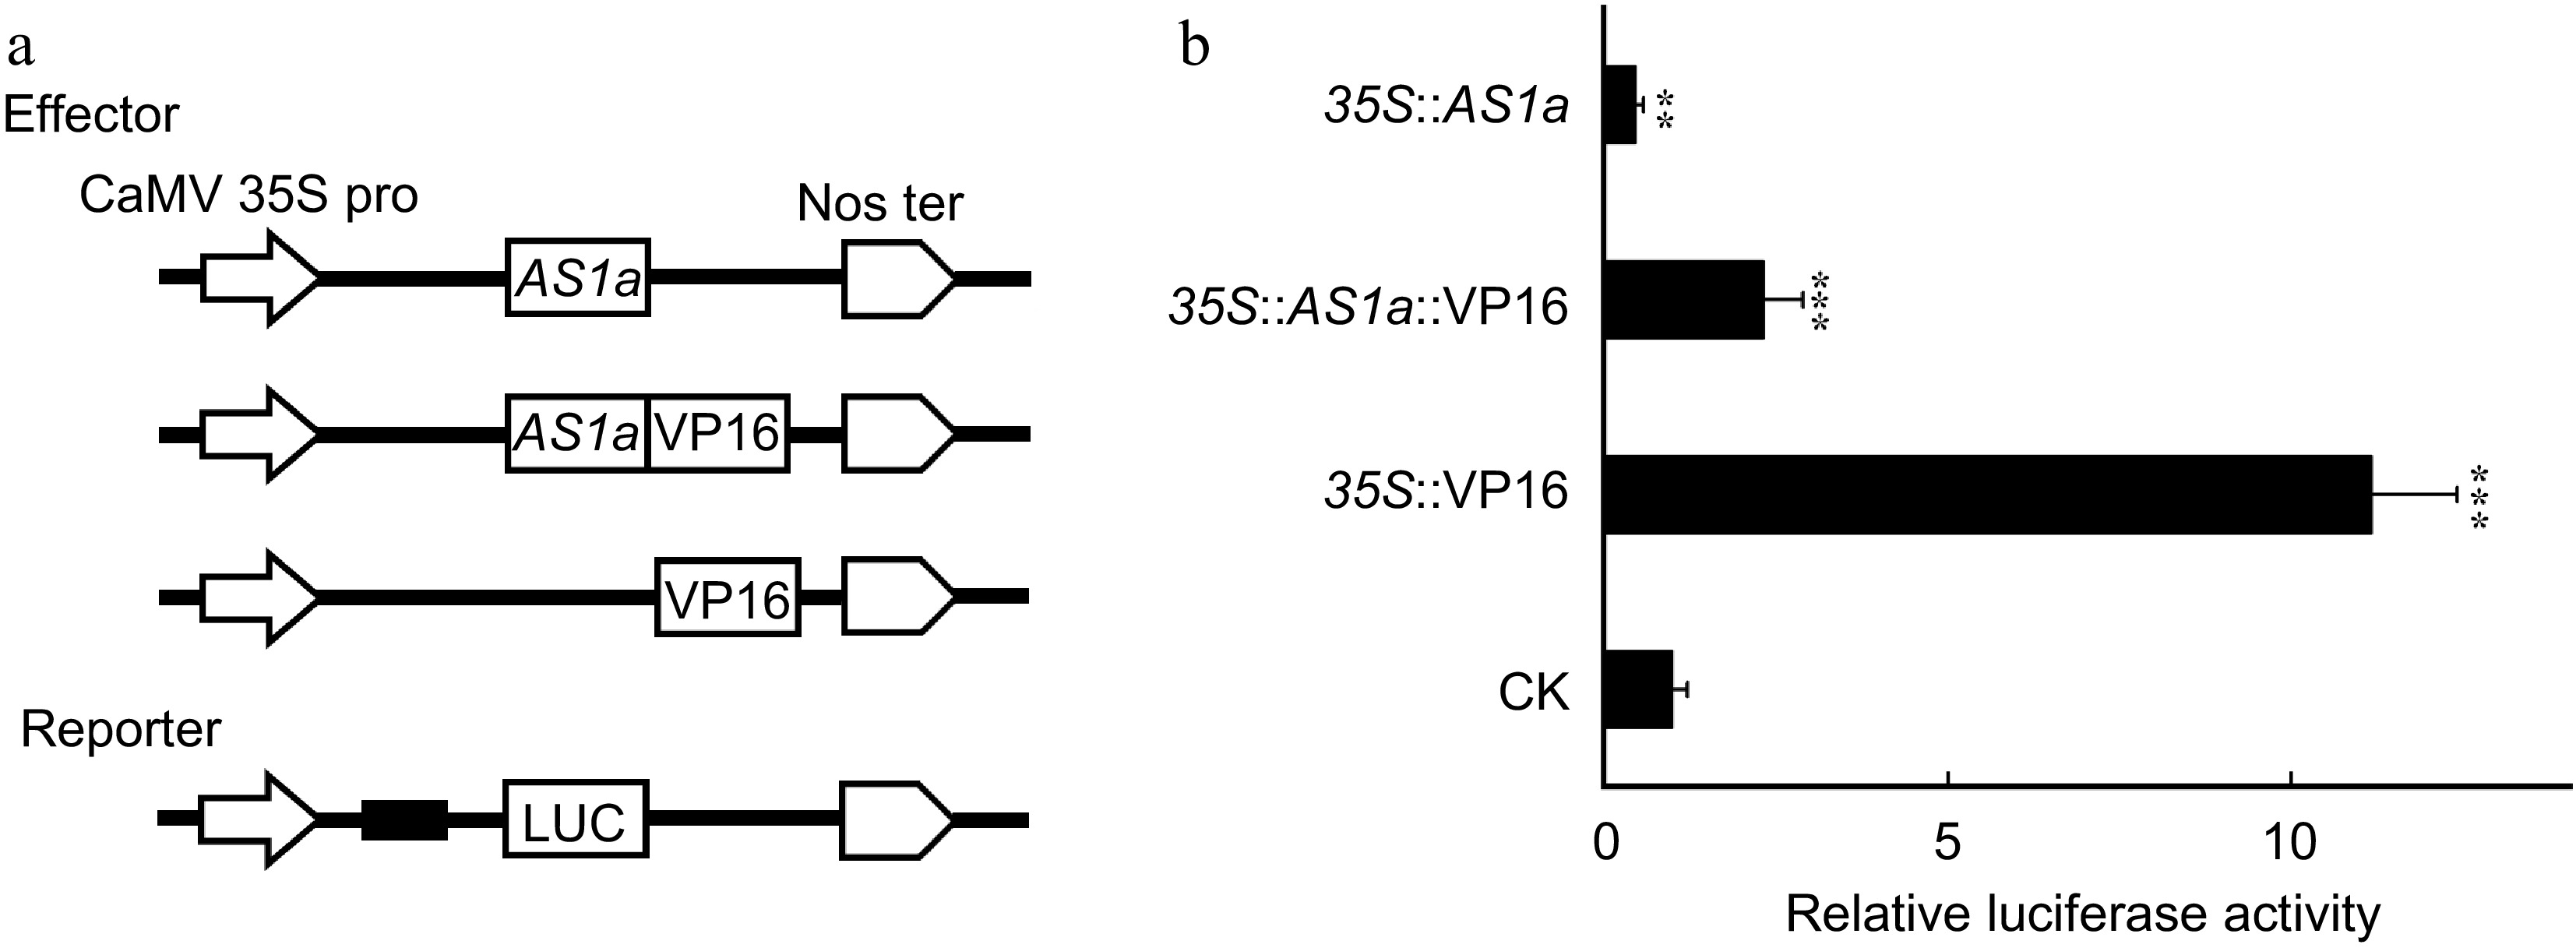
Figure 4.
PagAS1a is a transcriptional repressor. The PagAS1a construct driven by the CaMV 35S promoter was used as the effector. The relative luciferase activity was measured 48 h after injection. The value of the mock group injected with the reporter and corresponding empty effector construct was set to 1. Student's t-test was performed for significance with three biological replications (** p < 0.01; *** p < 0.001).
-
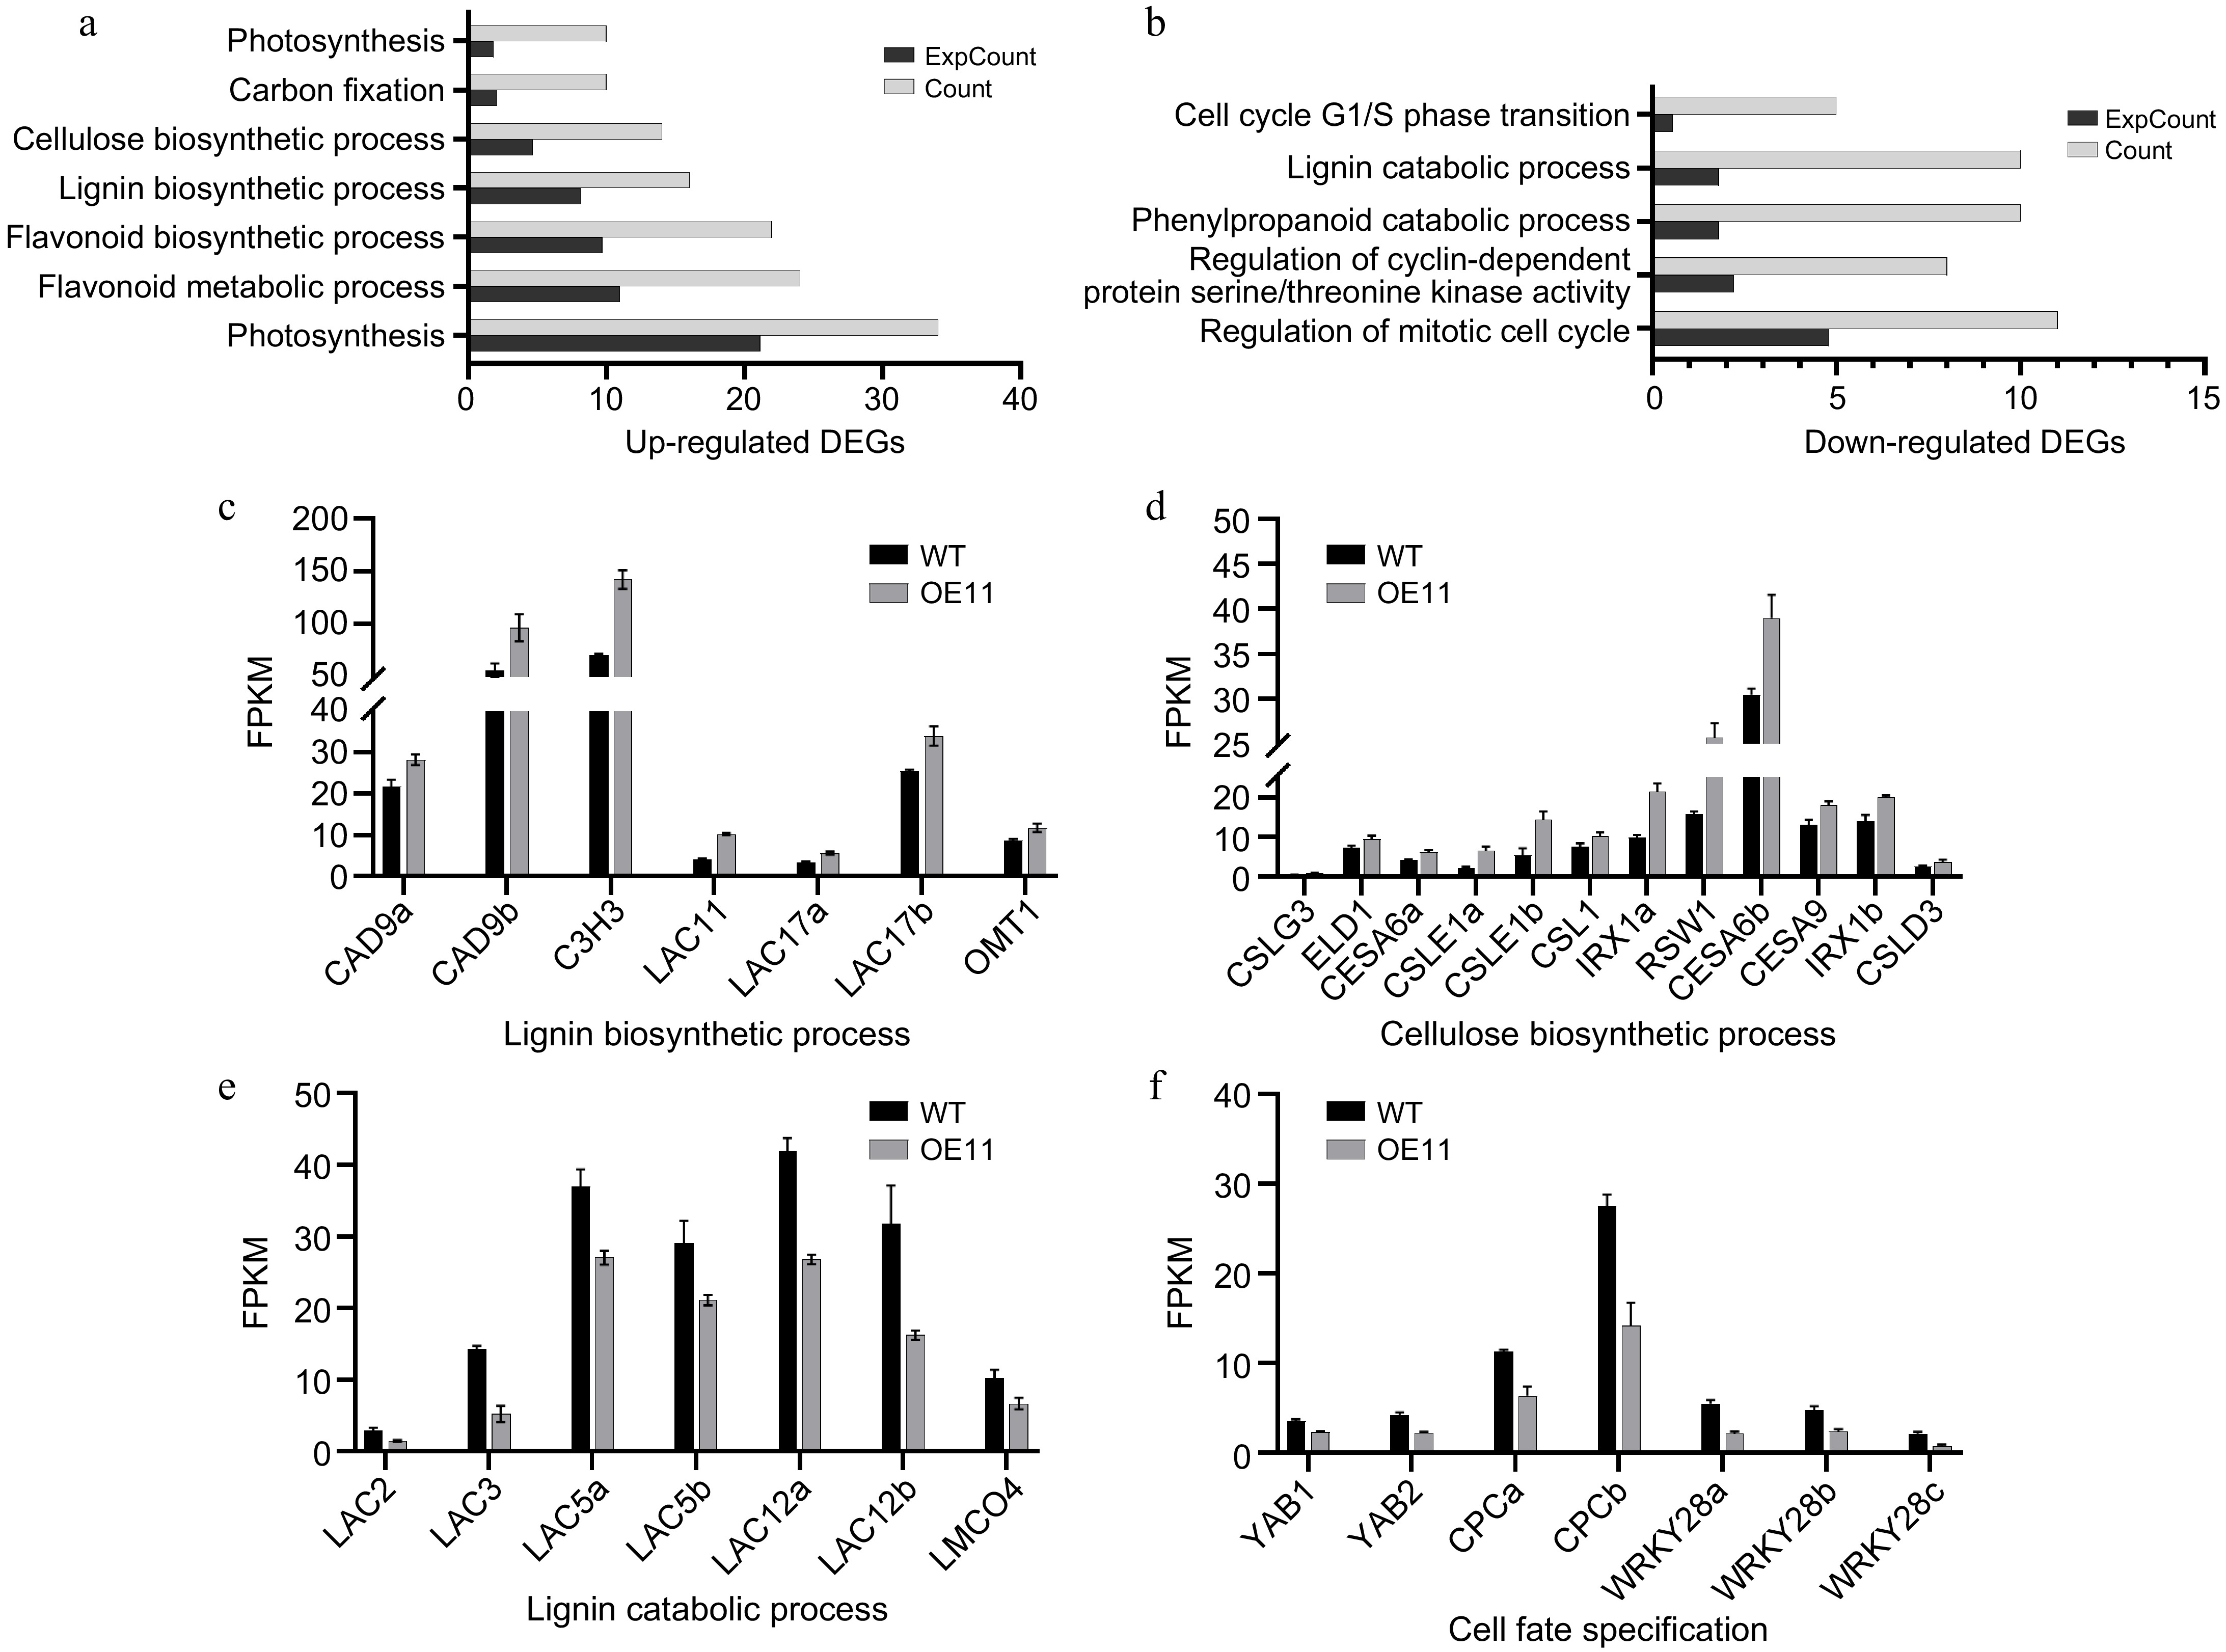
Figure 5.
Transcriptome analysis of PagAS1a overexpression plants. Significantly enriched GO categories in the (a) up-regulated, or (b) down-regulated DEGs in PagAS1a-OE transgenic plants (OE11). Expression of DEGs involved in (c) lignin biosynthetic process, (d) cellulose biosynthetic process, (e) lignin catabolic process, and (f) cell fate specification. The average fragments per kilobase of exon per million fragments mapped (FPKM) for each gene from RNA-seq experiments are shown.
-
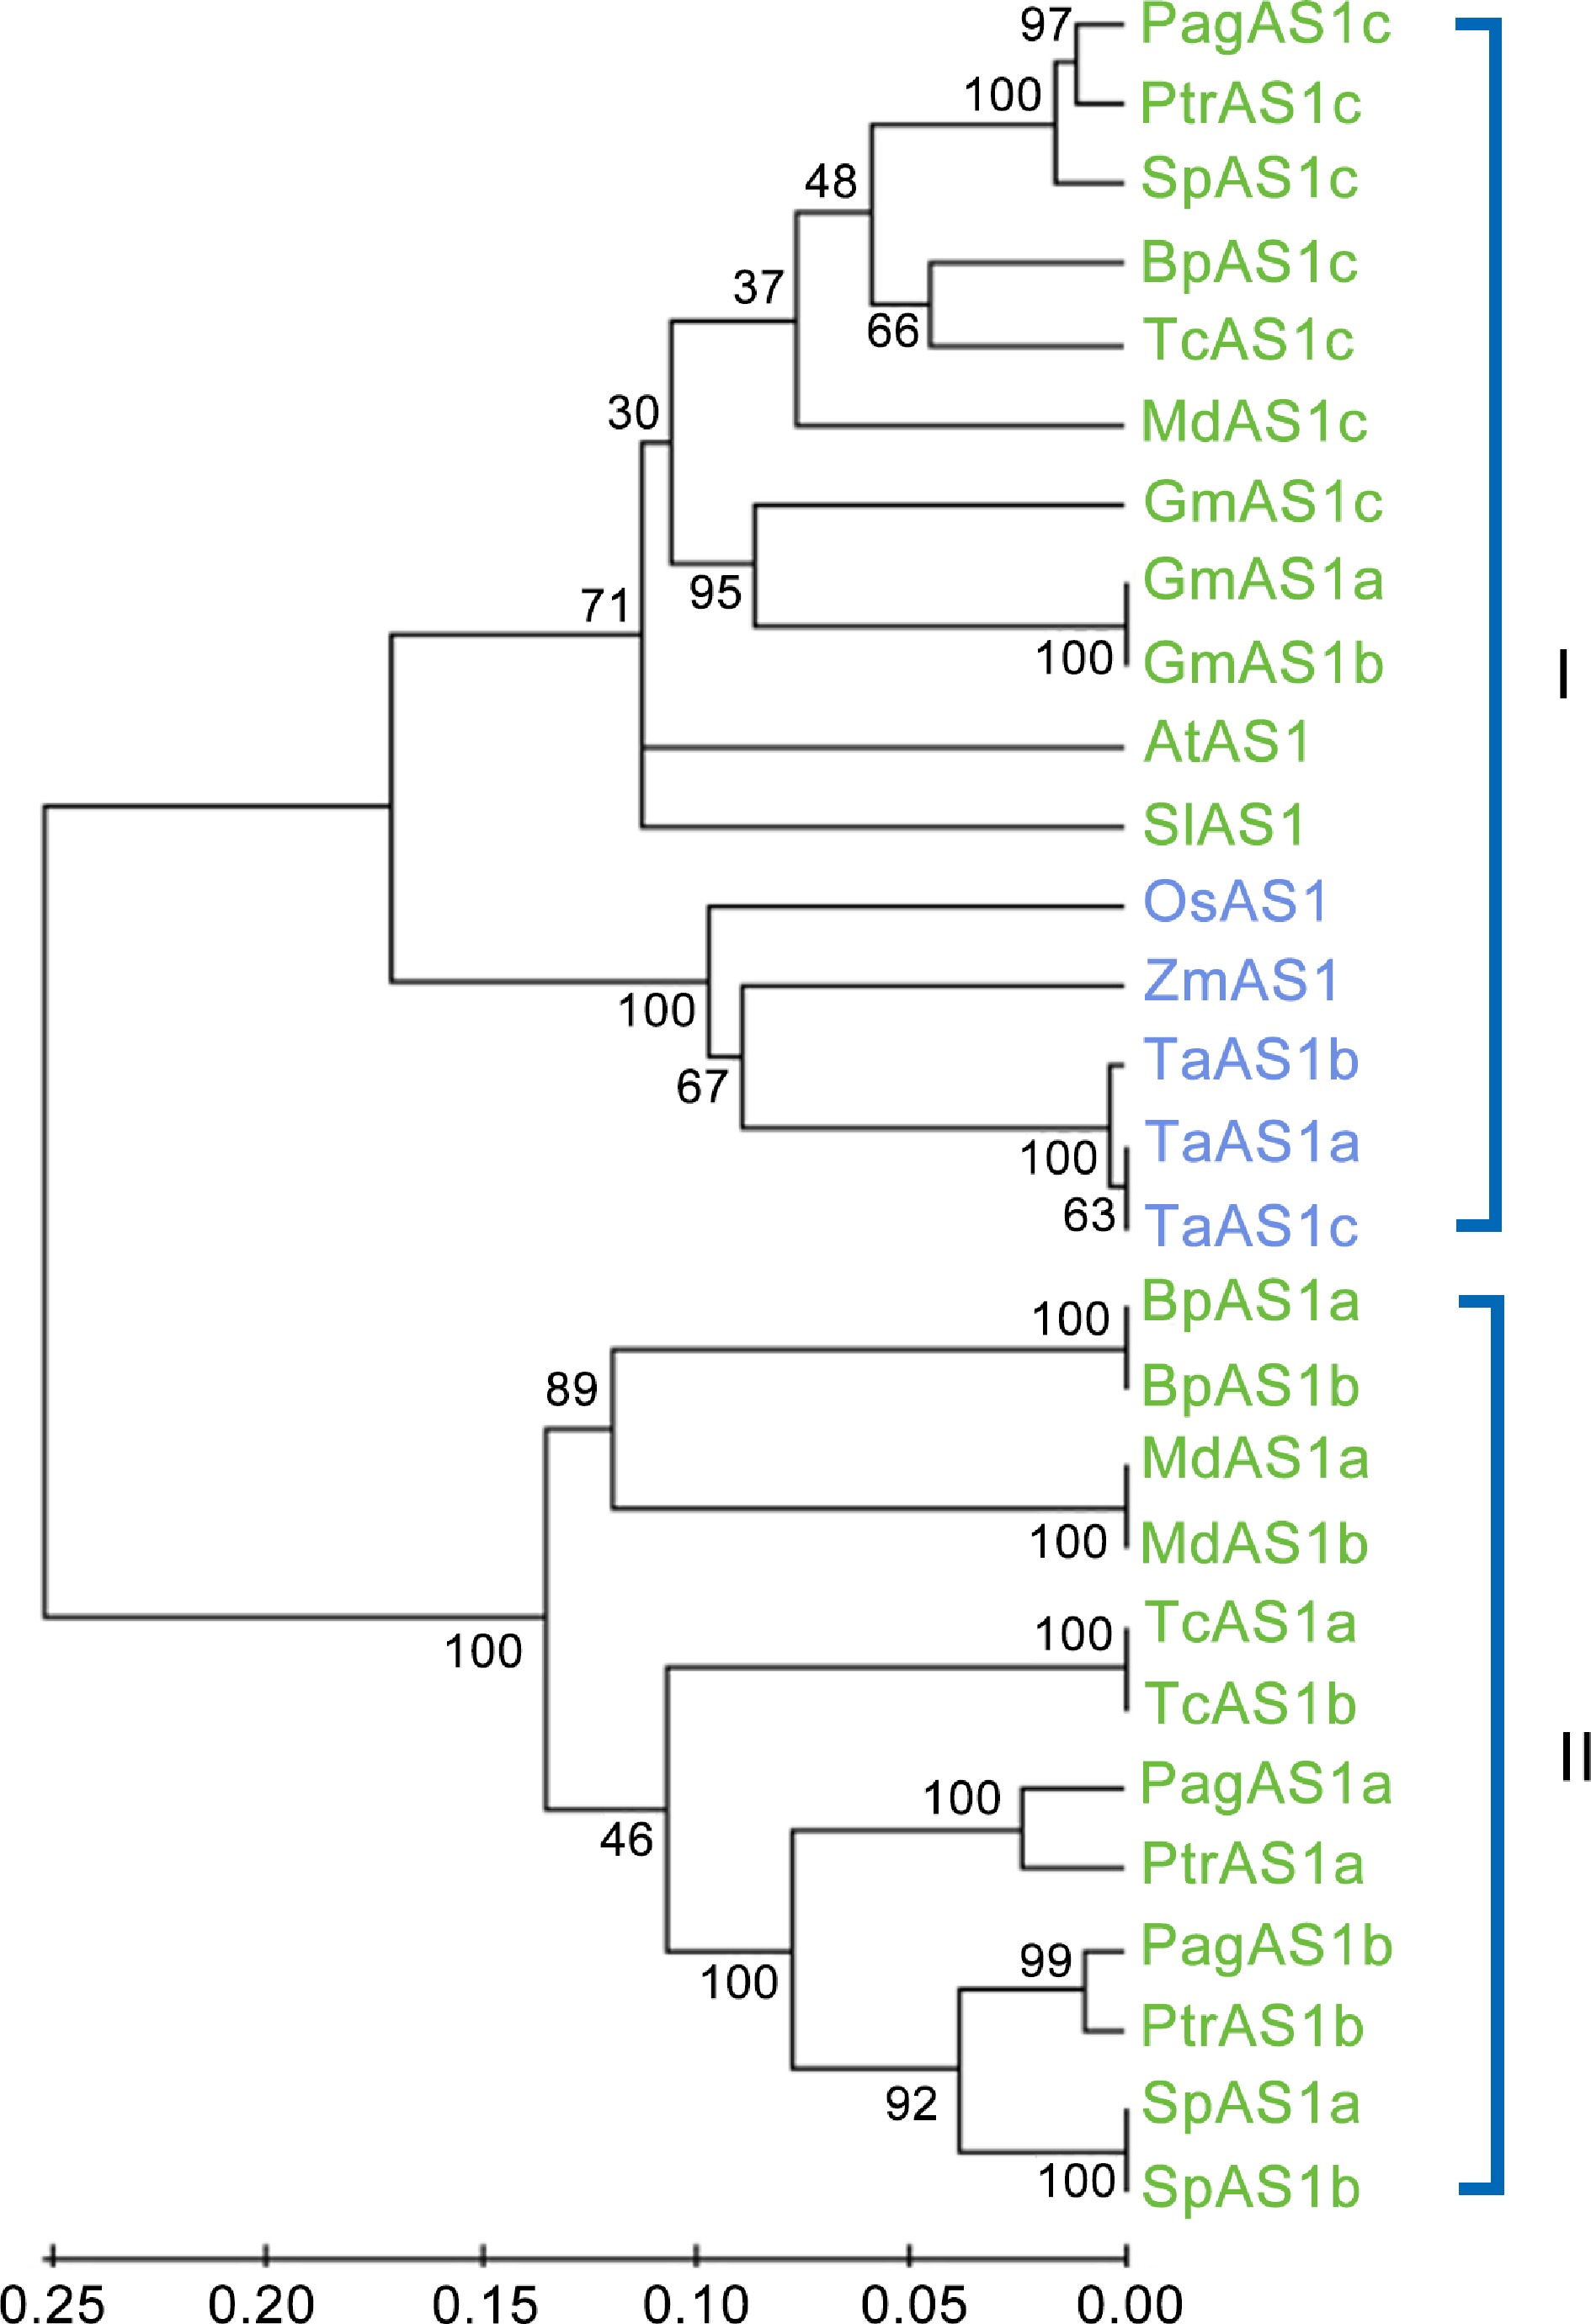
Figure 6.
Phylogenetic analysis of AS1 ortholog genes from 12 representative species. The neighbor-joining (NJ) tree was constructed based on the alignment of full-length protein sequences. MEGA 5.0 was used with 1,000 bootstrap replicates. Dicot species and monocot species are represented in green and blue fonts, respectively.
Figures
(6)
Tables
(0)