-
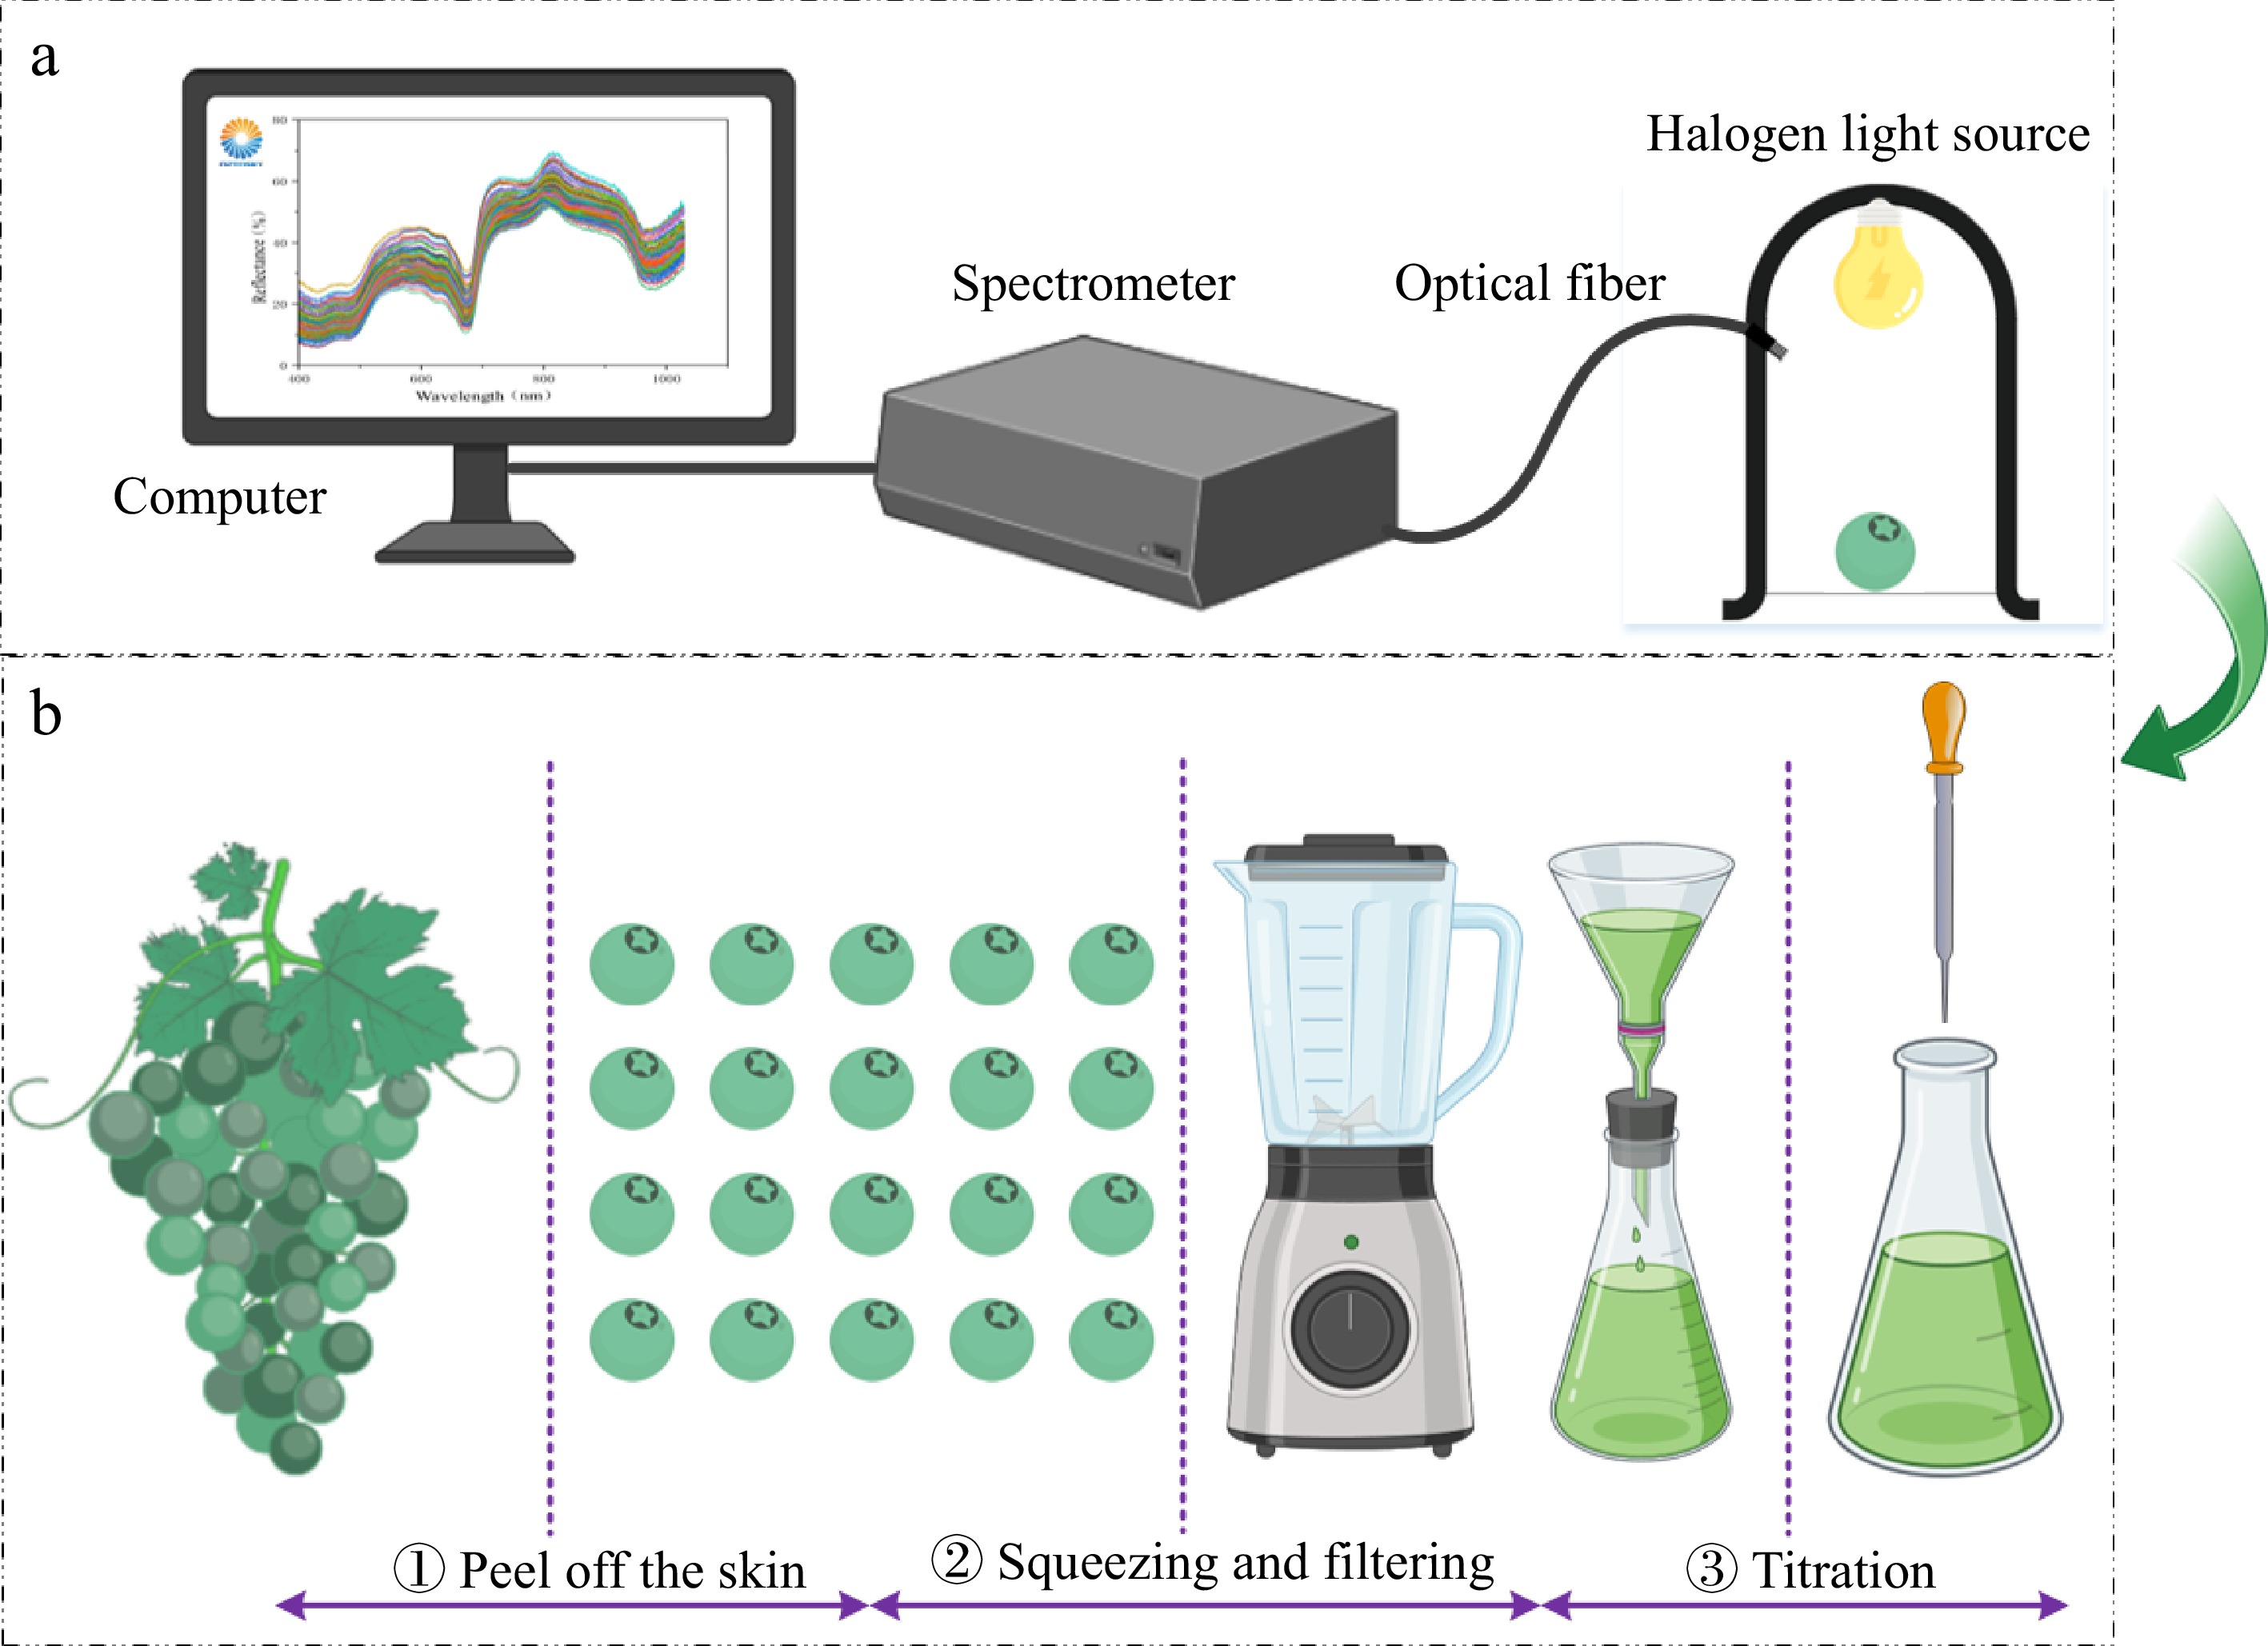
Figure 1.
Vis-NIR spectroscopy acquisition system and grape TA measurement (a) Spectral information collection (b) Determination of grape TA content.
-
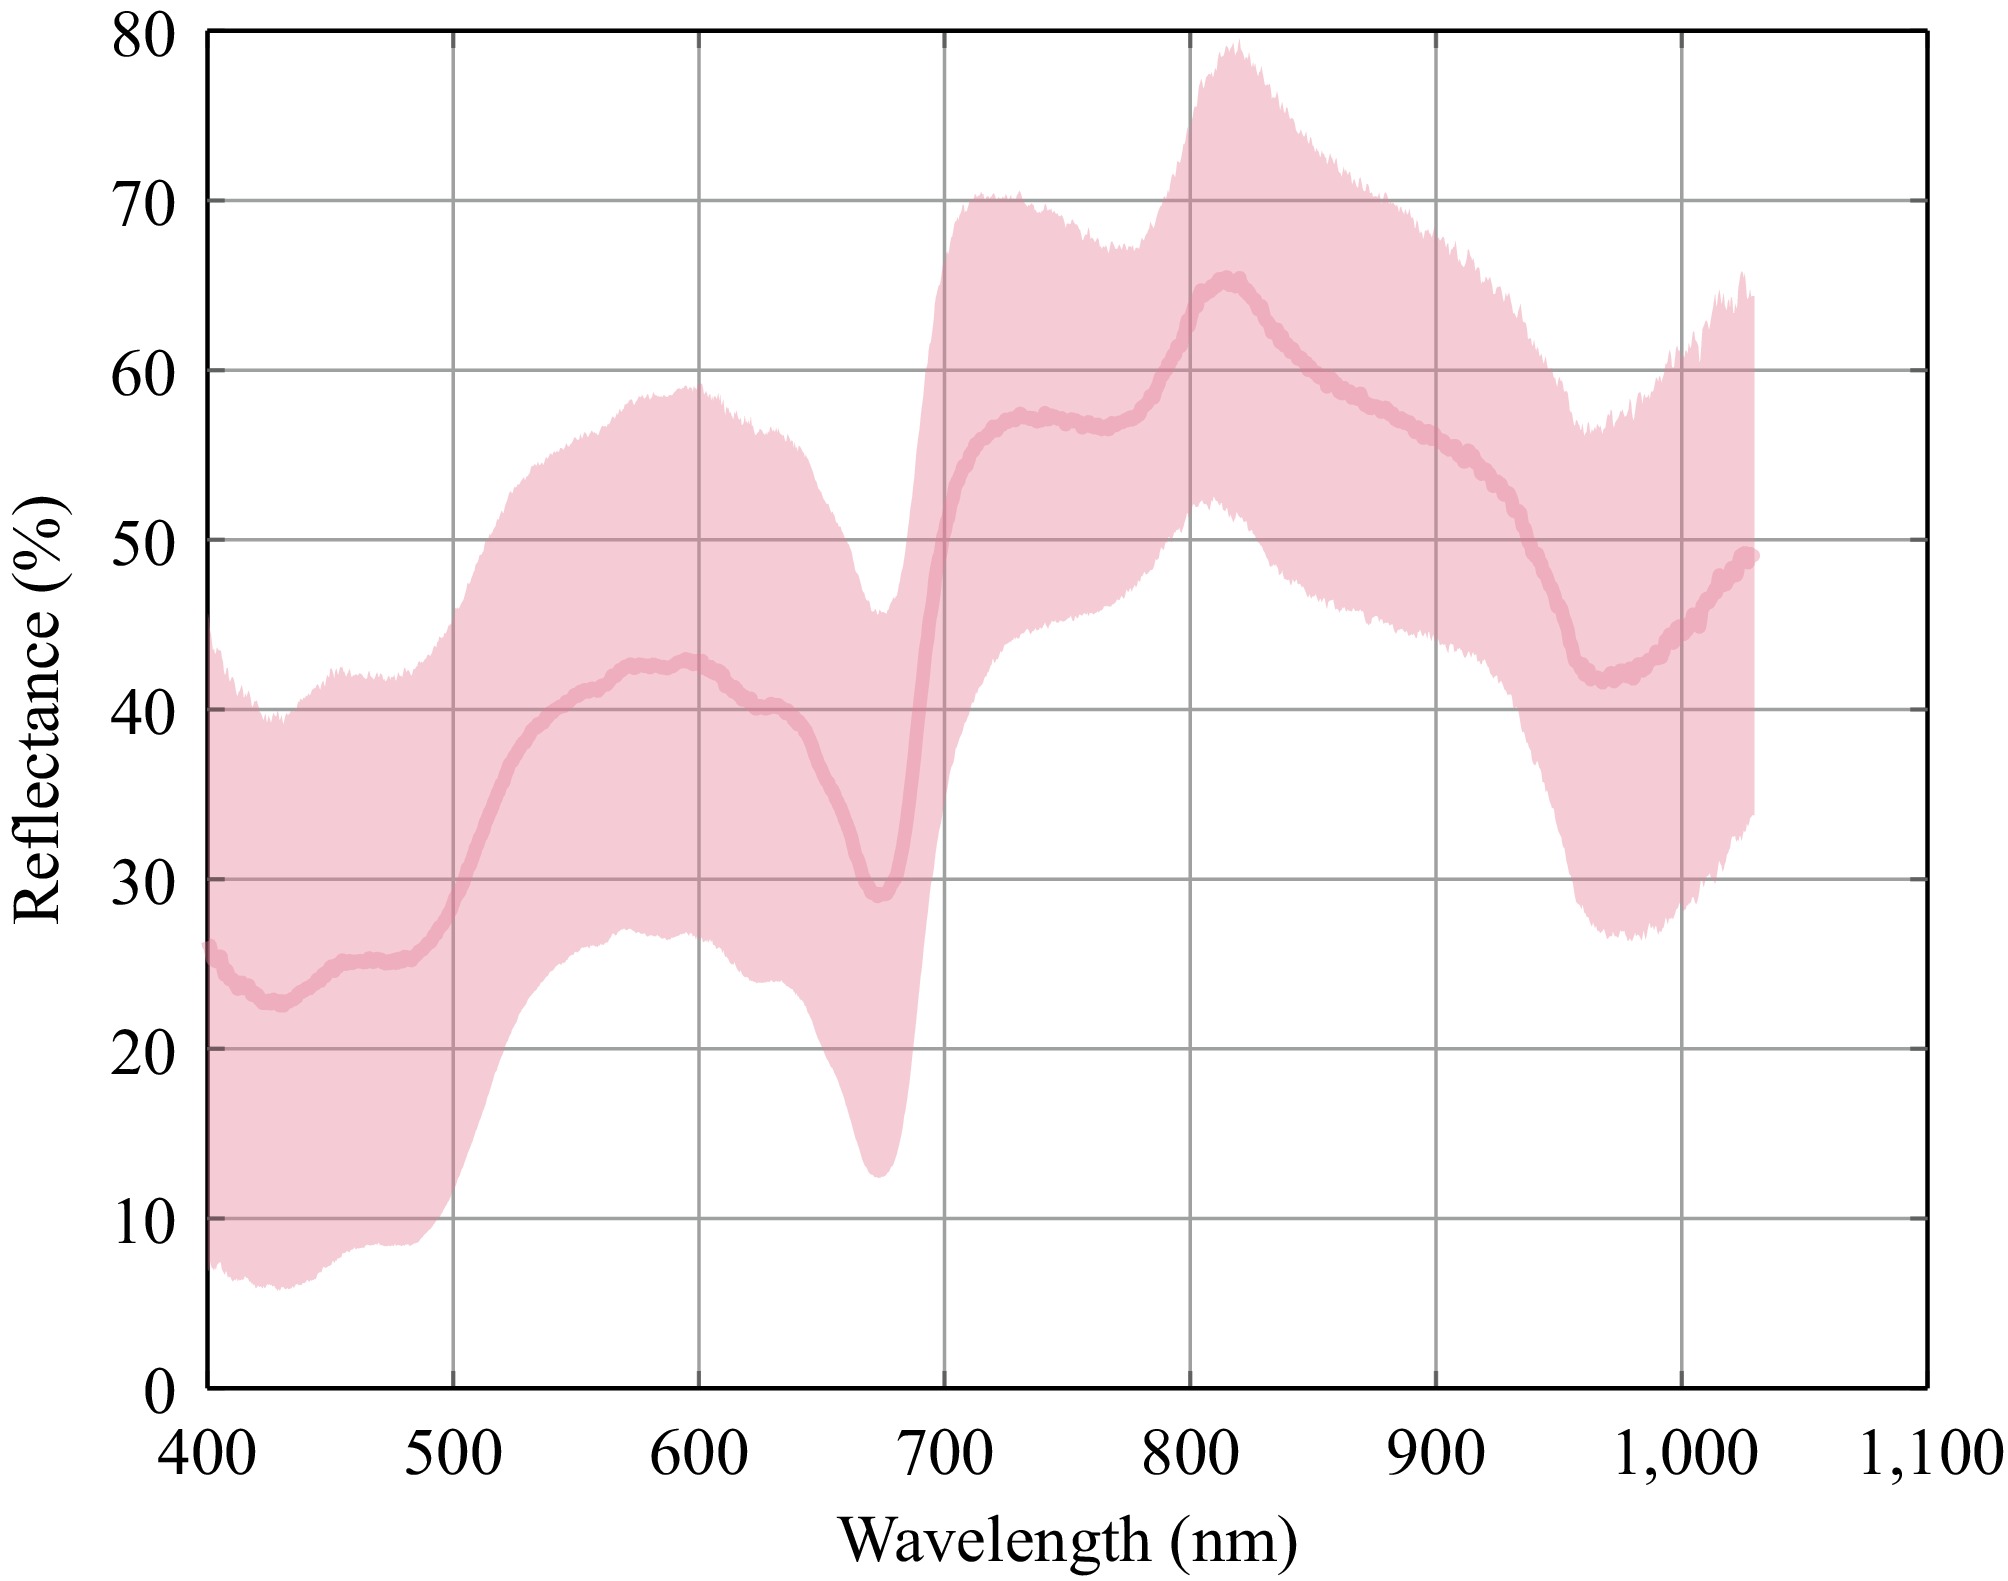
Figure 2.
Original spectral curves of grape TA.
-
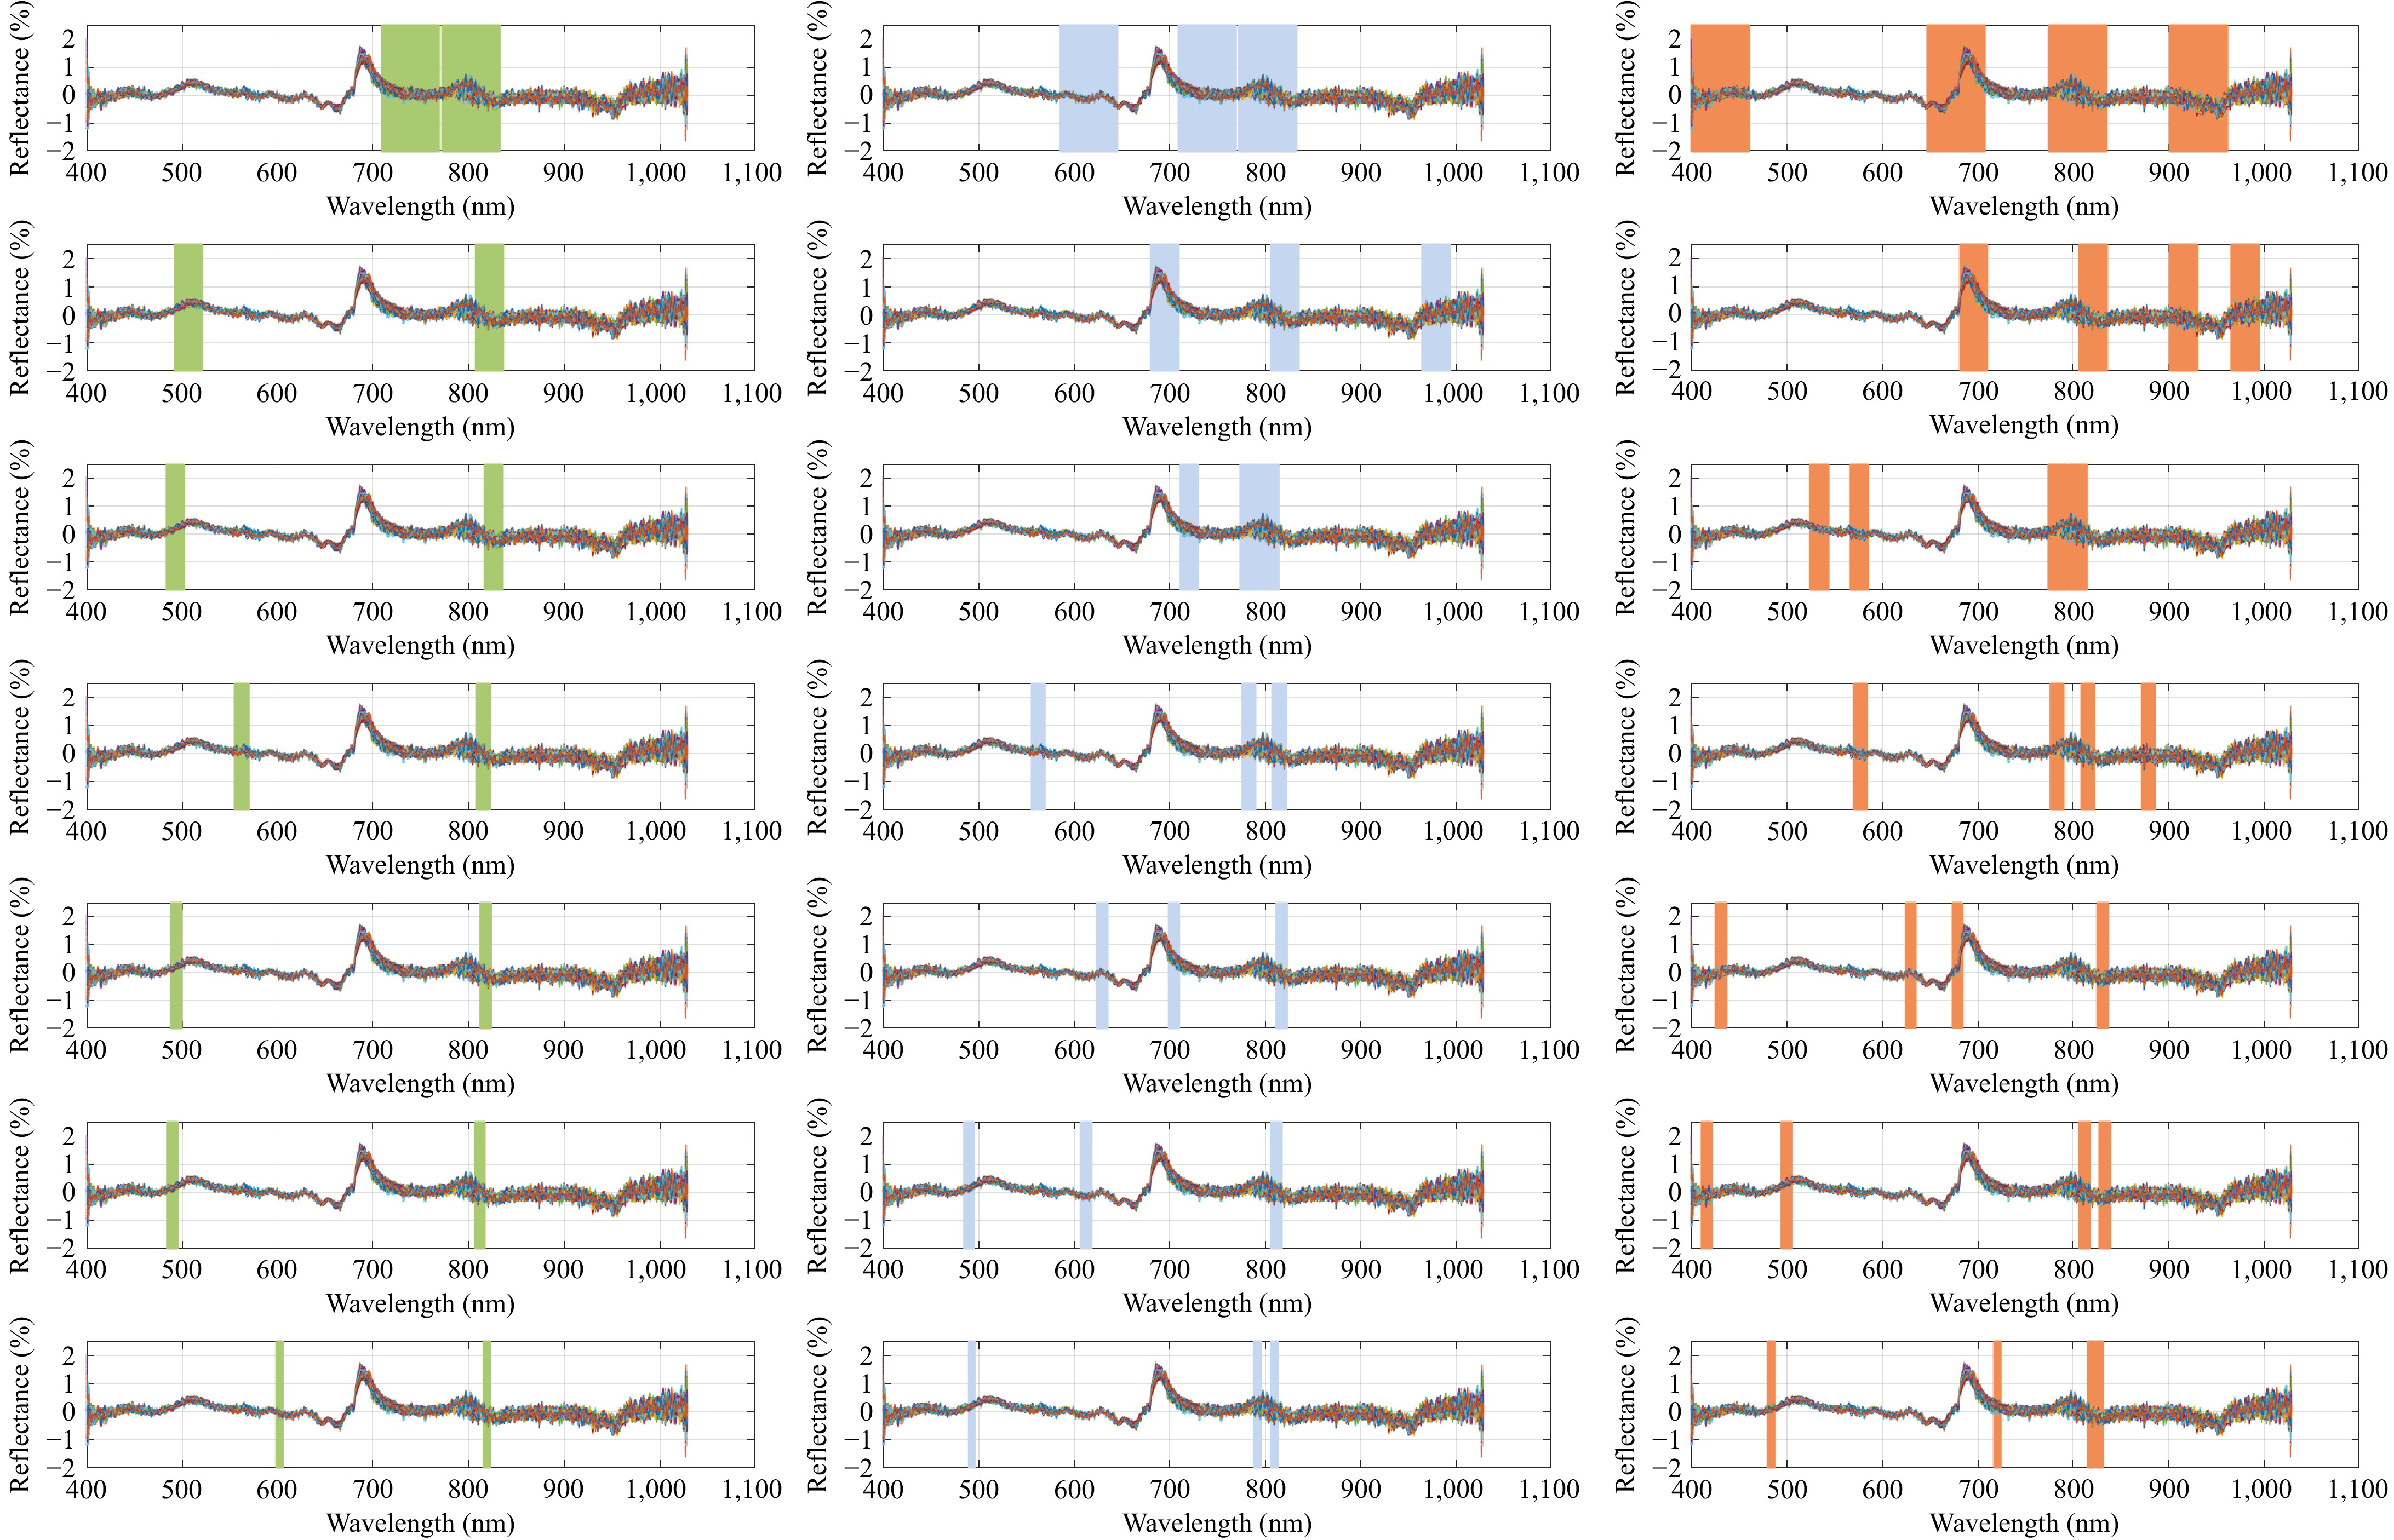
Figure 3.
The selected synergy intervals of FD + S-G processing spectral data. (a) Ten independent intervals and two candidate intervals. (b) Twenty independent intervals and two candidate intervals. (c) Thirty independent intervals and two candidate intervals. (d) Forty independent intervals and two candidate intervals. (e) Fifty independent intervals and two candidate intervals. (f) Sixty independent intervals and two candidate intervals. (g) Seventy independent intervals and two candidate intervals.(h) Ten independent intervals and three candidate intervals. (i) Twenty independent intervals and three candidate intervals. (j) Thirty independent intervals and three candidate intervals. (k) Forty independent intervals and three candidate intervals. (l) Fifty independent intervals and three candidate intervals. (m) Sixty independent intervals and three candidate intervals. (n) Seventy independent intervals and three candidate intervals. (o) Ten independent intervals and four candidate intervals. (p) Twenty independent intervals and four candidate intervals. (q) Thirty independent intervals and four candidate intervals. (r) Forty independent intervals and four candidate intervals. (s) Fifty independent intervals and four candidate intervals. (t) Sixty independent intervals and four candidate intervals. (u) Seventy independent intervals and four candidate intervals.
-
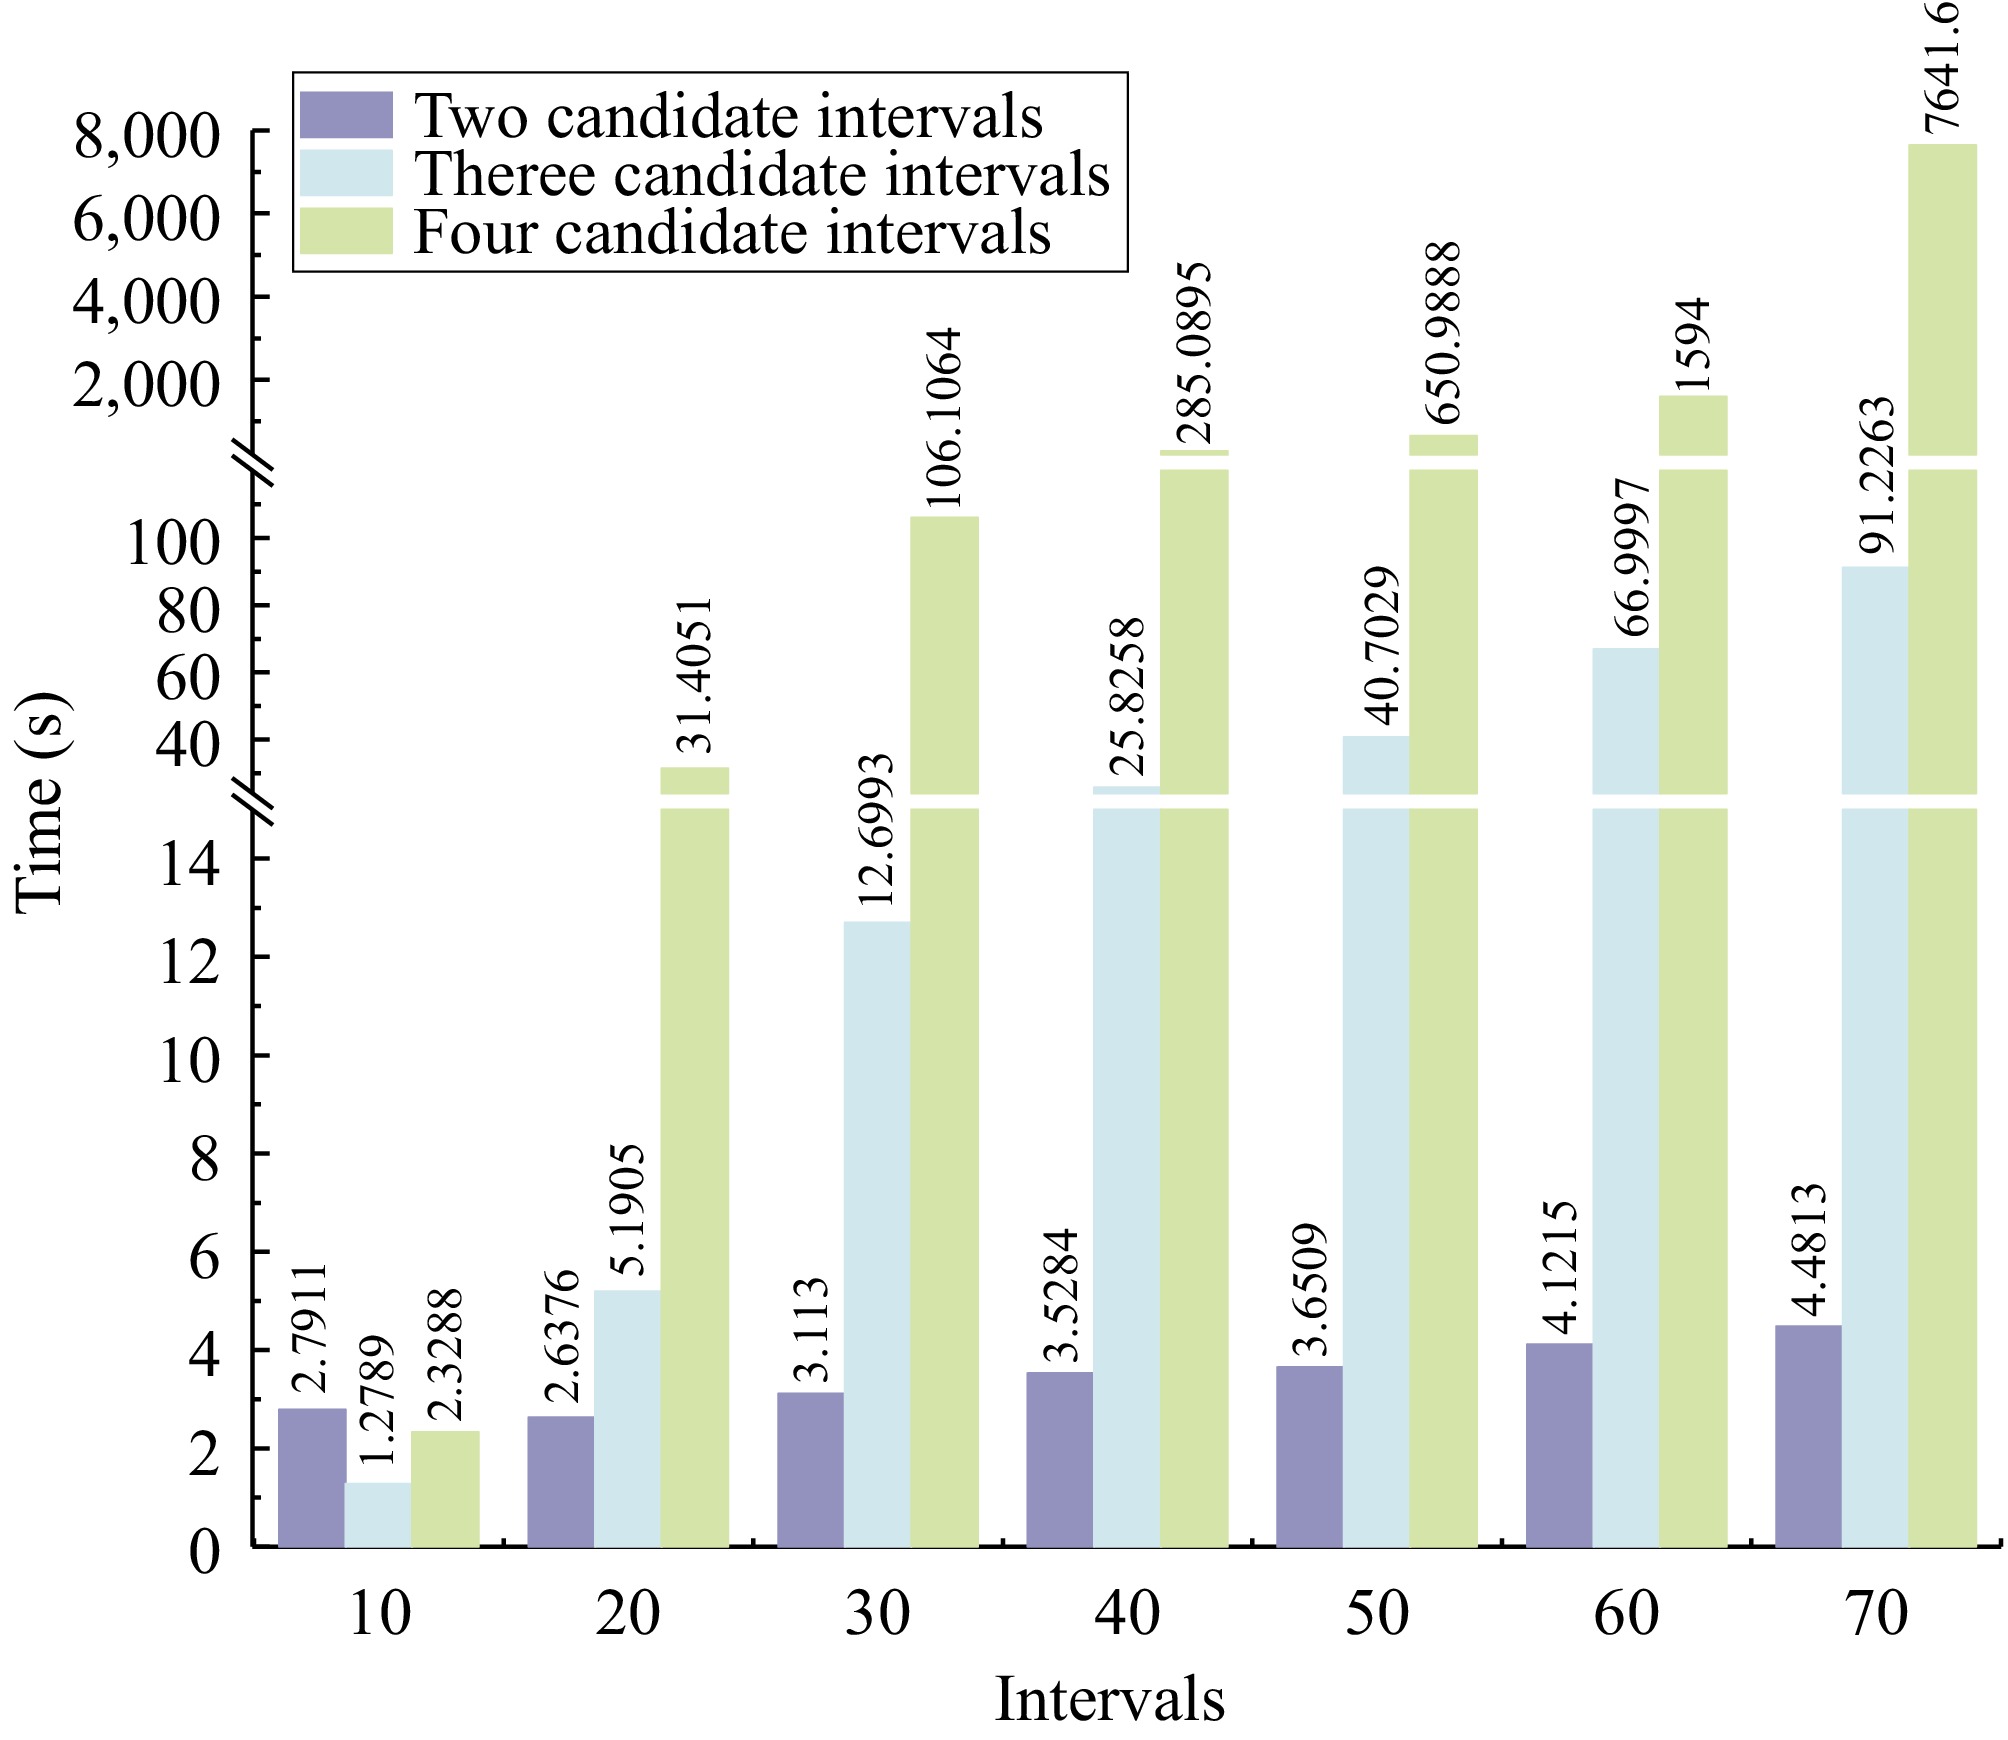
Figure 4.
Comparison of time consumption for screening synergy programs.
-
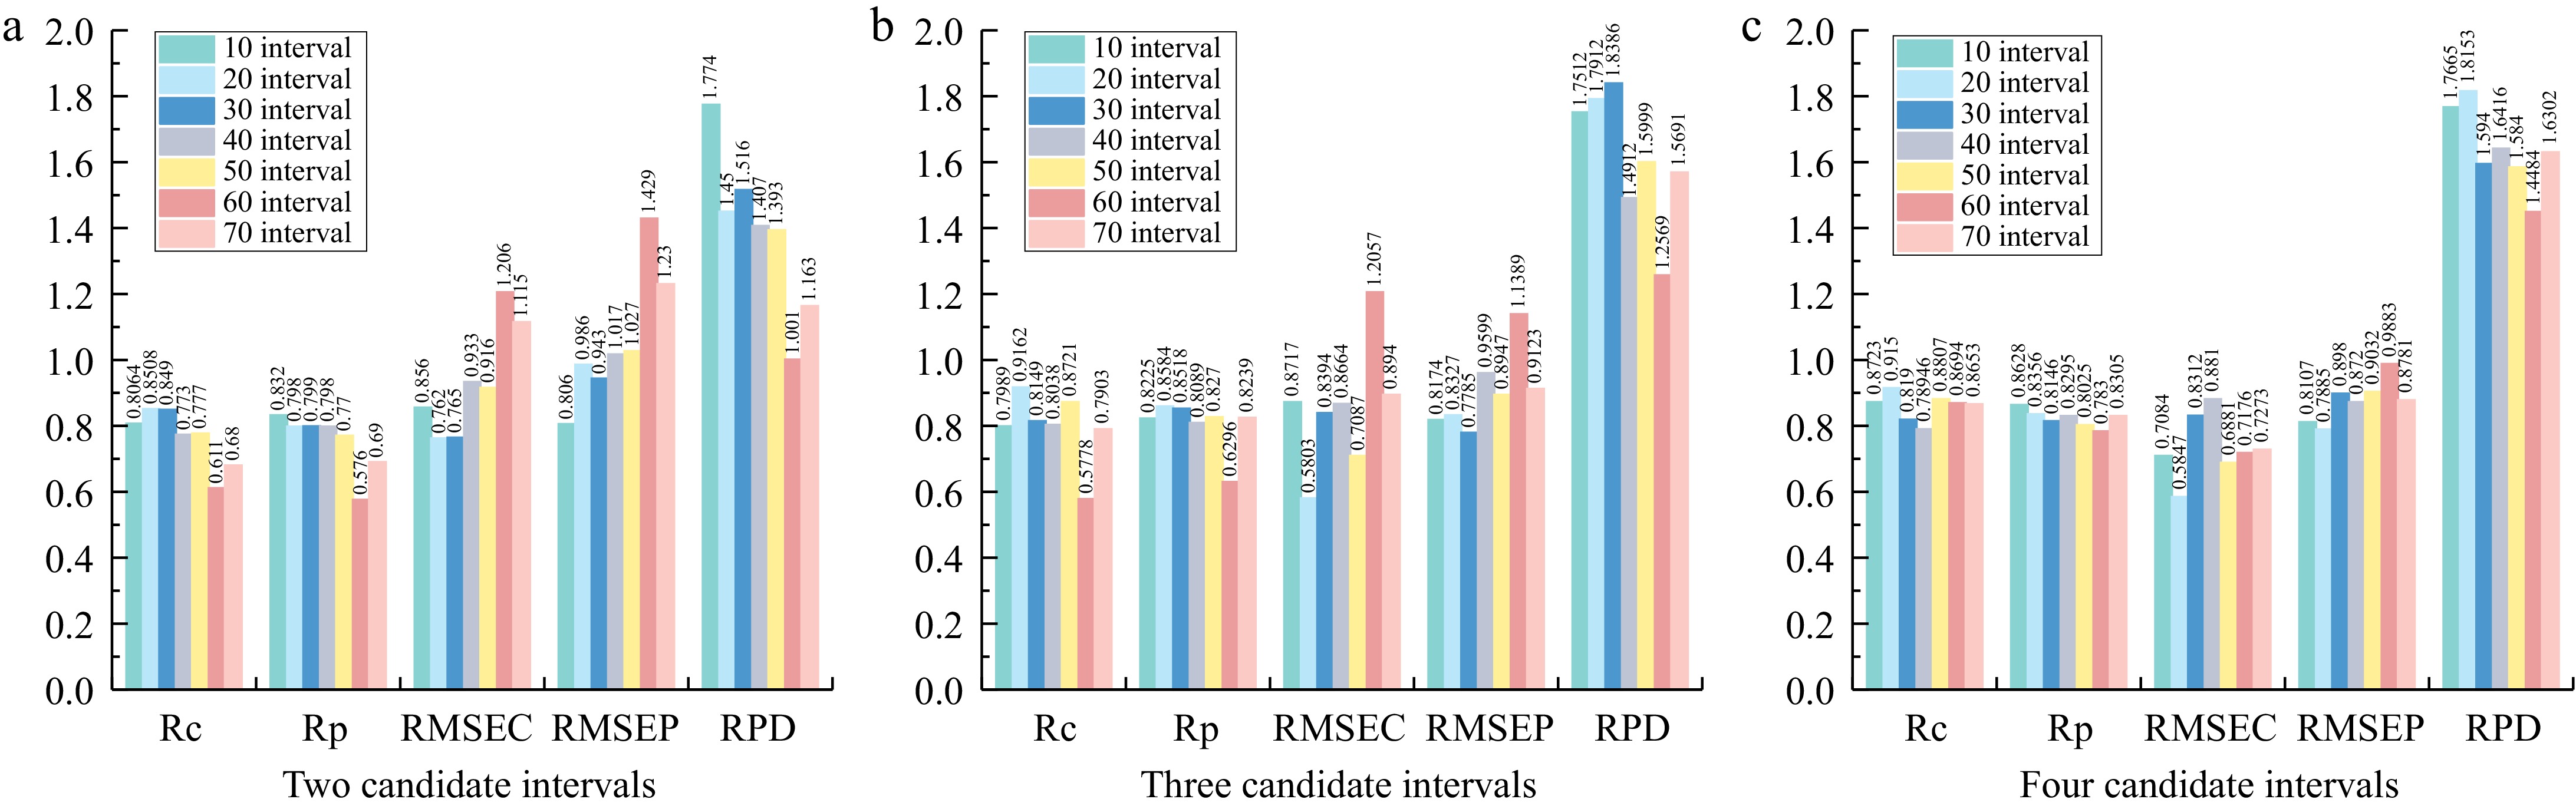
Figure 5.
Comparison of modeling results for different synergy intervals.
-
Subsets Sample number Range of TA (g/L) Mean
(g/L)Standard deviation (g/L) Calibration set 112 3.87−9.79 5.913 1.455 Prediction set 37 3.96−9.57 5.900 1.432 Overall samples 149 3.87−9.79 5.906 1.431 Table 1.
Reference measurement of grape TA.
-
Pre-processing methods Rc RMSEC Rp RMSEP RPD Original 0.870 0.713 0.849 0.828 1.728 FD 0.930 0.532 0.852 0.819 1.748 S-G 0.886 0.671 0.868 0.814 1.758 FD + S-G 0.936 0.506 0.874 0.773 1.852 SD 0.892 0.655 0.681 1.060 1.351 SD + S-G 0.765 0.935 0.741 1.007 1.421 SNV 0.890 0.660 0.876 0.789 1.812 MSC 0.889 0.660 0.877 0.788 1.815 Table 2.
The full-band modeling results of original spectral data and various processing spectral data.
Figures
(5)
Tables
(2)