


-
Grapes are significant in Chinese agricultural production and consumption, serving as one of the country's leading fruit crops and a vital component of the domestic fruit industry. As the global second-largest grape producer and the largest producer of table grapes, the Chinese grape industry has demonstrated robust growth in recent years[1]. Chinese grape production is primarily oriented towards fresh consumption, unlike the production models in Europe and the United States, which predominantly focus on wine grapes. This phenomenon has contributed to a steady increase in domestic consumption of fresh grapes. This upward trend not only reflects the growing demand for grapes within China but also underscores the significant role of the grape industry in driving rural economic growth and advancing agricultural modernization[2−3].
The quality of grapes is a crucial factor influencing consumer purchasing decisions and market pricing. High-quality grapes are characterized by superior sensory attributes and enhanced nutritional value[4]. Quality evaluation typically relies on external characteristics and internal physicochemical parameters, such as pH, total acidity(TA), and overall sugar content. Total acidity is essential, as it directly affects the taste profile of grapes. Consequently, accurate detection of TA is necessary for quality assessment. Traditional methods for measuring internal grape quality—such as acid-base titration, refractometer measurements, and Fehling's reagent thermal titration— effectively quantify parameters like sugar content, acidity, and sugar-acid ratios. However, these methods are often encumbered by several limitations, including the potential for sample destruction, complex procedures, long detection times, and susceptibility to human error[5]. Therefore, the development of non-destructive quality assessment technologies, which preserve the integrity of the grapes, is of considerable practical value for the table grape industry.
Recent advances in scientific technology have established spectroscopy as a promising non-destructive tool for agricultural product quality detection[6]. In particular, spectral techniques have made substantial progress in grape quality assessment. Researchers have rapidly and accurately determined critical quality indicators, such as sugar content and acidity, by collecting spectral data and applying advanced data processing and analysis methods. The development has enhanced the efficiency and precision of grape quality evaluation and provided technical support for innovations within the grape industry[7]. For example, Wu et al. employed Vis-NIR spectroscopy to assess various grape varieties' soluble solids content (SSC). They used partial least squares regression (PLSR) and the BP neural network model to predict SSC, with a correlation coefficient 0.85[8]. Zhou et al. combined chemometric techniques with Vis-NIR spectroscopy to perform non-destructive detection of overall phenols, tannins, and other compounds in grape skins and seeds. The results confirmed the effectiveness of this approach for grape quality evaluation[9]. Ping et al. used the Vis-NIR spectroscopy to detect multiple quality parameters of table grapes and established PLSR prediction models for grape quality assessment[10].
The above research indicates the promising potential of spectroscopy for grape quality assessment. Meanwhile, the development of spectroscopy instruments has also become a focus of attention for researchers. For example, Gao et al. chose the USB 2000+ miniature fiber optic spectrometer from the American Ocean Optics Company to build a high-quality visible/near-infrared detection instrument for red grapes[11]. Xiao et al. designed a portable grape-specific instrument for SSC and color analysis of the Manicure Finger grape and Ugni Blanc grape using a grating spectrometer[12]. Urraca et al. conducted a sugar content detection experiment on whole grape clusters in the field using a handheld near-infrared device[13]. The development of portable instruments based on spectroscopic techniques for grape quality assessment has emerged as a prominent area of research. However, the high cost of spectrometers remains a significant barrier to their widespread application. Consequently, photoelectric sensors based on spectral data have emerged as a cost-effective alternative. These sensors offer rapid near-infrared spectral detection while significantly reducing the cost of detection equipment, thereby facilitating the development of specialized devices for grape quality monitoring. However, due to current manufacturing limitations, producing high-precision single-wavelength photoelectric sensors remains challenging. Additionally, conventional sensors with broad wavelength ranges must accurately match the selected characteristic wavelengths[14]. Norgaard et al. proposed the synergy interval partial least squares (Si-PLS) algorithm to overcome this limitation. This algorithm identifies optimal wavelength regions and constructs partial least squares (PLS) regression models, improving the accuracy of spectral data analysis. Compared to traditional models based on single-wavelength features, more stable prediction results could be established by using the regions screened through the filtering algorithm. Integrating Si-PLS-optimized photoelectric sensors with spectral regression models provides a robust technical foundation for developing rapid detection devices for grape TA, offering significant potential for future applications[15−17].
The study's primary objective is to build a prediction model for detecting table grape total acidity based on the collaborative interval approach. This model aims to support the development of rapid near-infrared spectral detection devices for grape total acidity. The specific goals of this research are as follows: (1) examine the impact of various spectral preprocessing methods on the prediction accuracy of visible and near-infrared spectral models; (2) use the Si-PLS algorithm to screen the optimal collaborative interval that reflects grape total acidity; (3) develop Vis-near-infrared spectral prediction models for grape total acidity using spectral data from the selected collaborative intervals and full-band spectral data (400–1,100 nm), thereby identifying the most sensitive spectral regions for detecting total acidity and optimizing the most accurate prediction model.
-
The research object, Seedless White table grapes, was purchased from Yangling Haoyouduo Supermarket. To avoid damaging the grape berries, the grape berries were cut off manually with fruit scissors, and a small section of the fruit stem was retained to reduce water loss. Seedless White berries of similar size and without damage were divided into three parts, which were stored in different storage environments for 15 d. To simulate three storage states, room temperature storage, low-temperature storage, and chilled storage, the ambient temperatures were set to 20.6, 10.0, and 2.7 °C. With 20 grapes as a group, three or four groups of grapes were taken from each storage temperature daily as the measurement objects. The TA and spectral information of 149 groups of grapes were obtained during the experiment.
Vis-NIR spectroscopy detection acquisition
-
The instruments used in the experiment include a WR-D97 diffuse reflection whiteboard, halogen light source(HL2000), optical fiber, spectrometer (ATP3030, Optosky Photonics Inc., Xiamen, China), and computer, as shown in Fig. 1a. The spectrometer has a resolution of 0.5 nm and a detection range of 200−1,100 nm. When collecting the grape spectrum, the system was connected to the computer, and Optosky Spectra software V3.1.25 was used for data acquisition. During the experiment, the integration time was set to 1 ms. The black and white reference was collected and calibrated before collecting grape spectral information. Due to significant noise in the initial portion of the spectrum, the spectral data within the 400 to 1,100 nm range was selected as valuable information for subsequent analysis. Each sample spectrum contains 1508 variables within the 400 to 1,100 nm wavelength range.
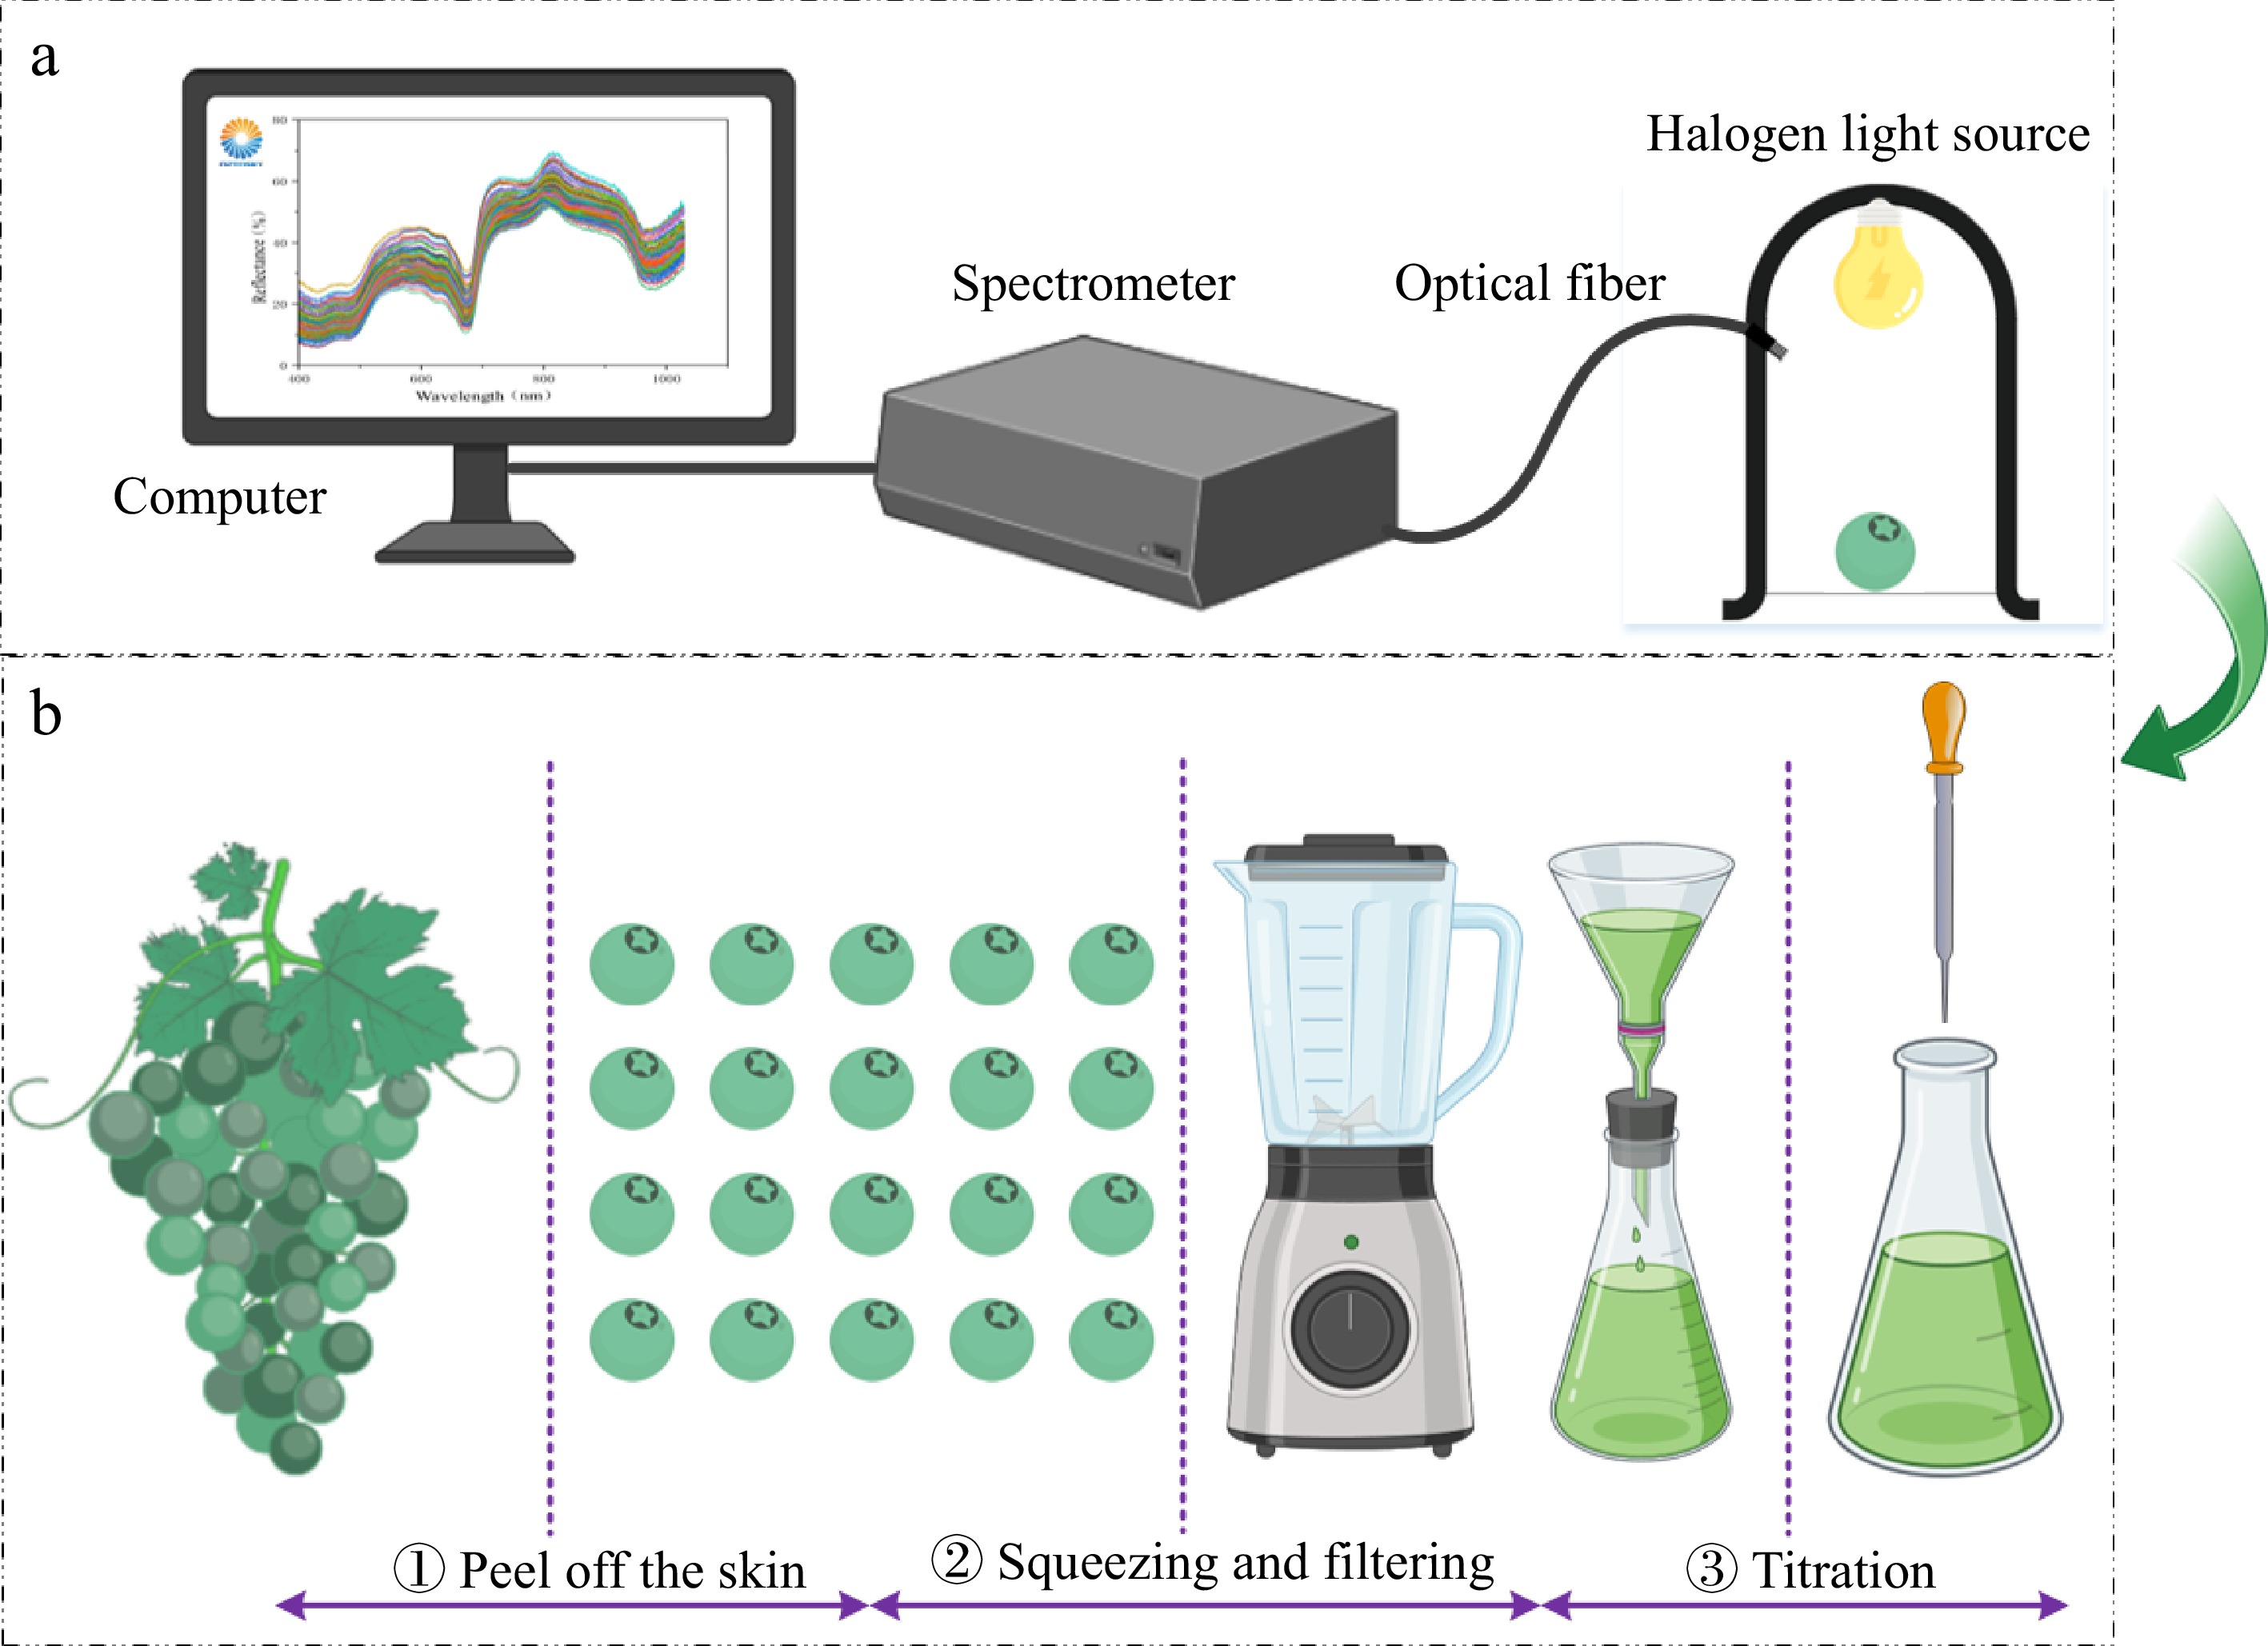
Figure 1.
Vis-NIR spectroscopy acquisition system and grape TA measurement (a) Spectral information collection (b) Determination of grape TA content.
Laboratory reference measurement
-
The grape TA content tests were conducted using the acid-base neutralization principle according to the Chinese National Standard GB/T 12456-2021. The 20 grapes were peeled, and the seeds were removed. The grapes were then pressed into juice. The grape juice was filtered using filter paper and a funnel. Approximately 50 mL of distilled water and two drops of phenolphthalein were added into a 2 mL filtrate. The obtained mixture was titrated to the end of the achromatic color using a sodium hydroxide solution. Blank tests were performed for the reagent. All samples were subjected to three parallel titrations to improve data reliability[18]. According to the volume of the consumed sodium hydroxide solution, the grape TA content could be calculated using the Eqn (1).
$ X = \dfrac{{C \times \left( {{V_1} - {V_2}} \right) \times 0.075}}{m} \times 1000 $ (1) where, X is the overall acid content in the sample (g/L), C is the concentration of sodium hydroxide standard titration solution (mol/L), V1 is the volume of sodium hydroxide standard titration solution consumed in titration test (mL), V2 is the volume of sodium hydroxide standard titration solution consumed in blank experiments (mL), m is the mass of the sample.
Spectral data pre-processing
-
The first derivative processing method involves applying the first-order derivative operation to the spectral data, enhancing the signal characteristics while reducing noise and offsets. The approach is particularly practical for processing complex spectral data and improving accuracy and reliability[19]. The Savitzky-Golay (S-G) convolutional smoothing is a commonly used spectral smoothing based on the least squares principle. It smooths the data and eliminates random noise by fitting the local data with a polynomial, making the spectral data smoother and more continuous[20]. The standard normal variables transformation (SNV) involves calculating the average reflectance at each wavelength position for all samples. The method subtracts the average value at the wavelength from the spectral data of each sample, and computes the standard deviation for the adjusted data at each wavelength. Finally, the spectral data for each sample are divided by the standard deviation at the corresponding wavelength position. The SNV processing corrects the systematic offsets and scale variations in the spectral data, making the processed data more uniform and reliable[21]. The multivariate scatter correction (MSC) method could significantly enhance the correlation between spectral data and practical applications by eliminating spectral anomalies caused by differences in scattering levels[22].
Synergy intervals screening method
-
The Si-PLS method is a statistical analysis technique that combines the interval partial least squares (iPLS) and traditional partial least squares (PLS) methods. The core concept involves dividing the data into multiple intervals, modeling each interval using the PLS method, and simultaneously considering the correlations between these intervals to enhance the model's predictive performance. The specific process could be outlined in the following steps: (1) divide the original data (typically time series or spatial data) into several intervals; (2) for each interval, apply traditional PLS to model the data; (3) use the root mean square error of cross-validation (RMSECV) as the evaluation criterion for local models, compare each local model to the global model, and select the optimal local model's corresponding variable interval as the selected sub-interval; (4) use the selected interval as the center, and extend the wavelength variable region either in one direction or in both directions; (5) combine the intervals with the highest prediction accuracy from several local models within the same partition to build the prediction model, and determine the optimal interval combination through RMSECV. Additionally, PLS is used to develop the Si-PLS prediction model for selecting characteristic spectral bands[23,24].
In the Si-PLS algorithm, two key parameters are involved: the overall number of intervals N and the number of selected intervals M. Typically, the number of intervals chosen is set to two, three, or four, while there is no restriction on the overall number of intervals. Once the values for N and M are determined, the number of possible combinations Q of selected intervals for each algorithm run can be calculated according to Eqn (2). As indicated by Eqn (1), when the number of intervals chosen is determined, the number of combinations grows with the overall number of intervals N. Similarly, when the overall number of intervals is determined, the number of combinations grows as the number of selected intervals M increases.
$ Q = C_N^M = \dfrac{{N!}}{{M!(N - M)!}} $ (2) where, Q is the number of combinations of candidate intervals, N is the number of overall intervals, M is the number of selected intervals.
Evaluation of the indicators
-
The accuracy and stability of the model are assessed using the following indexes. The correlation coefficient of the calibration set (Rc) and the corresponding root mean square error (RMSEC), the correlation coefficient of the prediction set (Rp) and the corresponding root mean square error (RMSEP), and the residual predictive deviation (RPD). A lower root mean square error and a higher correlation coefficient signify better accuracy and stability of the model. An RPD value below 1.5 indicates poor predictive accuracy and stability. An RPD value below 1.5 signifies poor predictive performance. An RPD between 1.5 and 2.0 suggests that the model can distinguish between the low and high values of the response variable. An RPD between 2.0 and 2.5 indicates the model can make rough predictions, while an RPD above 2.5 reflects high predictive accuracy[25−27]. The calculation formulas for each evaluation metric are provided in Eqn (3) and (5).
$ {Rc}/{Rp} = \sqrt {1 - \dfrac{{\mathop \sum \nolimits_{i = 1}^n {{\left( {{y_i} - {{\hat y}_i}} \right)}^2}}}{{\mathop \sum \nolimits_{i = 1}^n {{\left( {{y_i} - \bar y} \right)}^2}}}} $ (3) $ RMS EC/RMS EP = \sqrt {\dfrac{{\mathop \sum \nolimits_{i = 1}^n {{\left[ {{y_i} - {{\hat y}_i}} \right]}^2}}}{{n - 1}}} $ (4) $ RPD = \dfrac{{S D}}{{RMS EP}} $ (5) where, Rc and Rp are the correlation coefficient of the calibration set and prediction set; RMSEC and RMSEP are the root mean square error of calibration set and prediction set; RPD is the ratio of performance-to-deviation; n is the number of samples; yi is the actual overall acid value of the ith sample;
${\hat y_i}$ -
To measure the total acidity of Seedless White grapes, 149 groups of samples were analyzed following the Chinese National Standard (GB/T 12456-2021). To develop a spectral prediction model with high accuracy and reliable performance, the distribution of reference measurement values in both the calibration and prediction sets must meet certain conditions. The reference values in both sets should be evenly distributed across the entire range. The calibration set should encompass the full range of values in the prediction set. Additionally, the mean and standard deviation of the reference measurement values in the calibration set should be equal to or slightly greater than those in the prediction set.
To satisfy these criteria, the gradient concentration method was used to divide the 149 samples into calibration and prediction sets in a 3:1 ratio. The results are shown in Table 1. As shown in Table 1, the calibration set contained 112 samples, while the prediction set included 37 samples. The ranges of reference measurement values were 3.87−9.79 and 3.96−9.57 g/L for the calibration and prediction sets, respectively, with the calibration set fully encompassing the prediction set. The mean reference values of the calibration and prediction sets were 5.913 and 5.900 g/L, respectively, while the standard deviations were 1.455 and 1.432 g/L, respectively. The slightly lower mean and standard deviation in the prediction set indicate that the division meets the grouping criteria for the calibration and prediction sets[28].
Table 1. Reference measurement of grape TA.
Subsets Sample number Range of TA (g/L) Mean
(g/L)Standard deviation (g/L) Calibration set 112 3.87−9.79 5.913 1.455 Prediction set 37 3.96−9.57 5.900 1.432 Overall samples 149 3.87−9.79 5.906 1.431 Analysis of grape TA spectral data
-
Figure 2 illustrates the raw spectral data curve obtained for Seedless White grapes. The red solid line in Fig. 2 represents the average spectral curve, and the red shadow represents the range of the spectral curve. It can be seen that the spectral curves demonstrate consistent spectral trends under various conditions. The phenomenon indicated an absence of significant abnormalities in the spectral data of the 149 grape groups. Three prominent peaks are observed across the full-band wavelength range, at 530−630, 720, and 810 nm, along with two distinct troughs identified at 670 and 970 nm. At the wavelength of 820 nm, the reflectance of grape samples is the highest, but not exceeding 80%; At the wavelength of 440 nm, the reflectance of grape samples is the lowest, not exceeding 10%. The yellow-green coloration of the Seedless White grape skin corresponds to the peak at 580−630 nm. The trough at 670 nm falls within the chlorophyll absorption region and is potentially related to the absorption of carotenoids and chlorophyll. The absorption at 810 nm may be associated with optical path correction for temperature, while the absorption at 970 nm may be attributed to the stretching vibrations of O-H bonds in carbohydrates and water[29−30].
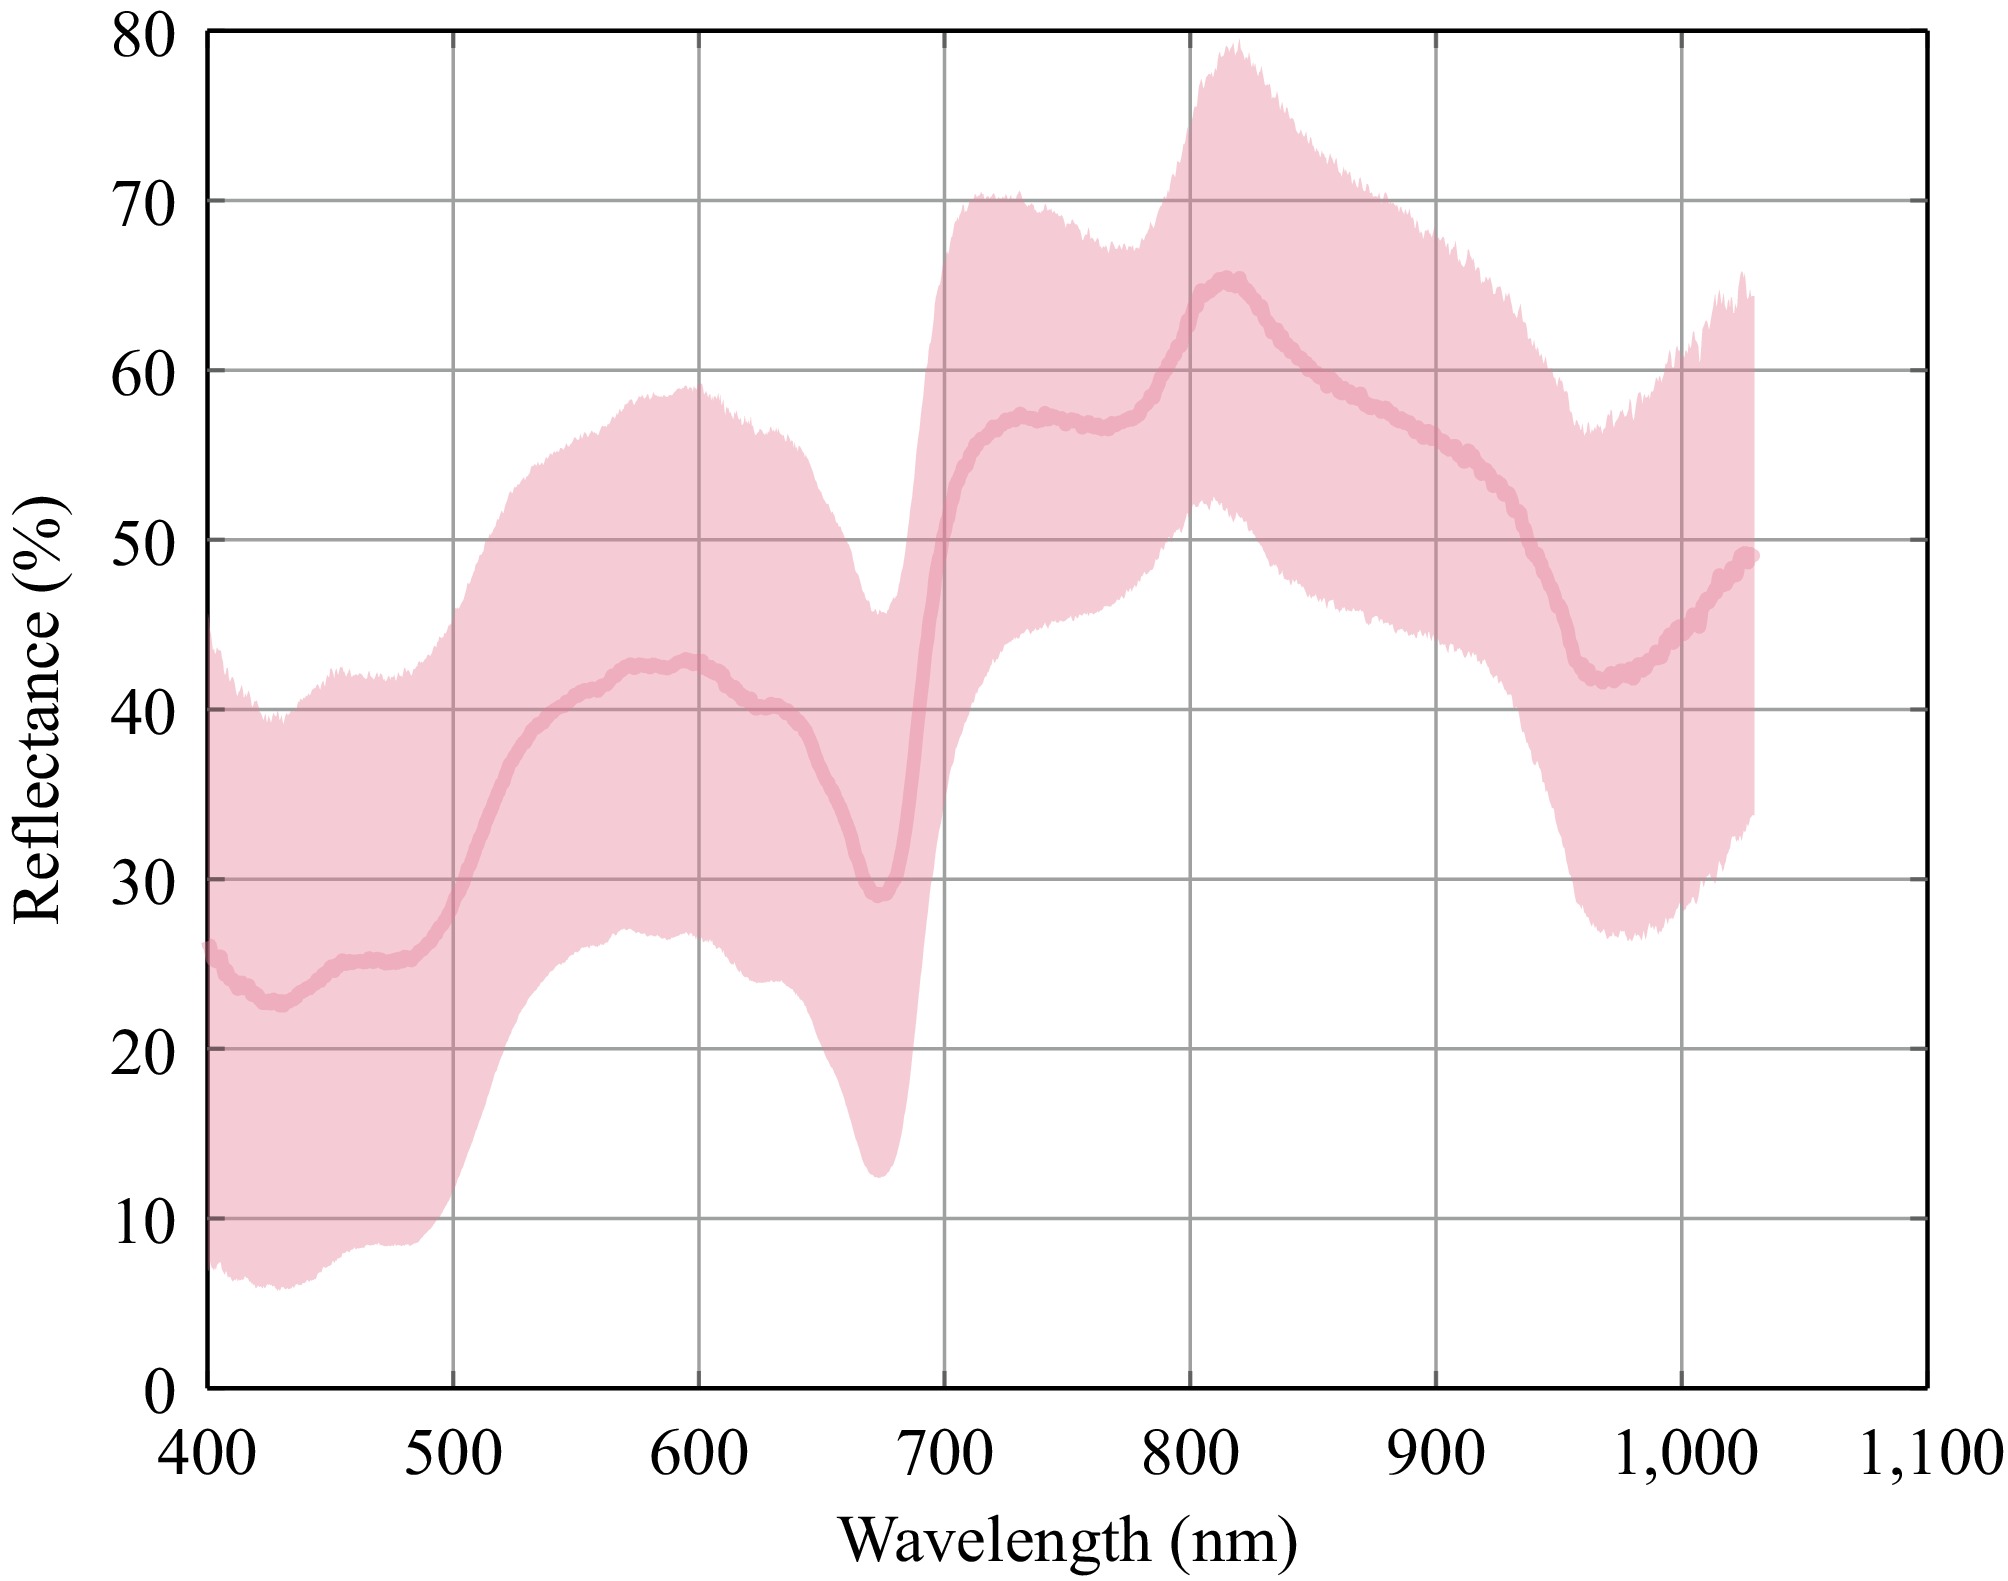
Figure 2.
Original spectral curves of grape TA.
Spectrum detection analysis of TA based on the full-band spectral data
-
A prediction model was developed using the PLSR algorithm to establish the relationship between the full-band spectrum data and the total acidity of 149 grape sample groups. To further enhance the model's predictive accuracy and identify the optimal spectral preprocessing method, separate total acidity prediction models were constructed using the original spectral data and various preprocessed spectral data.
The accuracy of the prediction model directly influences the design and optimization of practical detection devices. High-precision prediction models provide a solid foundation for real-time monitoring, effectively reducing errors and enhancing the reliability of detection results. In practical applications, optimizing preprocessing steps and selecting appropriate algorithms can enable the design of devices that account for noise suppression, spectral signal enhancement, and efficient data processing, thereby improving the adaptability and stability of the equipment under various environmental conditions. In predicting total acidity in grapes, the choice of spectral preprocessing methods significantly enhances prediction accuracy, which is of considerable importance for the development of intelligent detection devices.
The modeling results are summarized in Table 2. Different spectral preprocessing methods affected the prediction model for total acidity in grapes. A comparison of the modeling results based on the original and the preprocessed data reveals a slight improvement in prediction accuracy after applying first-derivative preprocessing. This improvement may be attributed to enhancing useful spectral information during the first-derivative preprocessing. Similarly, a slight increase in prediction accuracy was observed after Savitzky-Golay (S-G) smoothing preprocessing, which likely reduced high-frequency noise. Furthermore, combining the first derivative and S-G smoothing preprocessing resulted in a model with improved predictive accuracy for total acidity in grapes. However, the prediction accuracy decreased after the second derivative preprocessing, likely due to the introduction of significant noise during the preprocessing, which negatively impacted model accuracy. The prediction model built using spectral data preprocessed with a combination of second derivative and S-G smoothing also exhibited even lower accuracy compared to the model based on the original spectral data. This decrease may be attributed to excessive noise introduced by the derivative preprocessing, which the S-G smoothing could not fully mitigate. The prediction models built using MSC and SNV also showed improved accuracy, with similar performance between the two methods. This improvement could be attributed to the ability of MSC and SNV to reduce surface scattering caused by uneven sample granularity. Among the prediction models constructed using full-spectrum data, the model with the first derivative combined with S-G smoothing preprocessing exhibited the highest predictive performance. For the optimal full-band spectrum model, the Rc and Rp were 0.936 and 0.874, respectively. The RMSEC and RMSEP were 0.506 and 0.773 g/L, respectively, yielding an RPD value of 1.852.
Table 2. The full-band modeling results of original spectral data and various processing spectral data.
Pre-processing methods Rc RMSEC Rp RMSEP RPD Original 0.870 0.713 0.849 0.828 1.728 FD 0.930 0.532 0.852 0.819 1.748 S-G 0.886 0.671 0.868 0.814 1.758 FD + S-G 0.936 0.506 0.874 0.773 1.852 SD 0.892 0.655 0.681 1.060 1.351 SD + S-G 0.765 0.935 0.741 1.007 1.421 SNV 0.890 0.660 0.876 0.789 1.812 MSC 0.889 0.660 0.877 0.788 1.815 Spectrum determination analysis of TA based on combined sub-interval spectral data
-
The optimum model based on the full-band spectrum was obtained by combining first derivative preprocessing and S-G smoothing. Consequently, interval selection and model development were conducted exclusively using the spectral data preprocessed with the first derivative combined with S-G smoothing when applying the Si-PLS algorithm.
In the study, the overall number of intervals was between 10 and 70, with a step size of 10, and the number of selected intervals was determined to be two, three, and four, respectively. The selected interval variables are presented in Fig. 3. As shown in Fig. 2a−g, when the number of selected intervals was fixed at two, the width of the selected intervals progressively decreased with an increasing overall number of intervals. The selected intervals near 810 nm approach the characteristic peaks of the spectrum. In Fig. 3h−u, similar behavior was observed when the number of selected intervals was three or four, indicating that the spectral variables near 810 nm are critical for accurately predicting grape total acidity. As seen in Fig. 3h−n, when the number of selected intervals was 3, multiple intervals within the 500−720 nm range were selected as the overall number of intervals increased, suggesting that the spectral variables within the range were essential for predicting grape total acidity. In Fig. 3o−u, when the number of selected intervals was 4, the selected intervals did not stabilize within a specific wavelength range as the overall number of intervals increased. For instance, in Fig. 3p, the fourth selected interval was located near 970 nm, corresponding to the water absorption peak, while in Fig. 3t, the first selected interval was near 410 nm. This phenomenon indicated that with an increase in the overall number of intervals and the number of selected intervals, the model's interval combinations might result in selections that fail to correspond precisely to the spectral characteristic peaks.
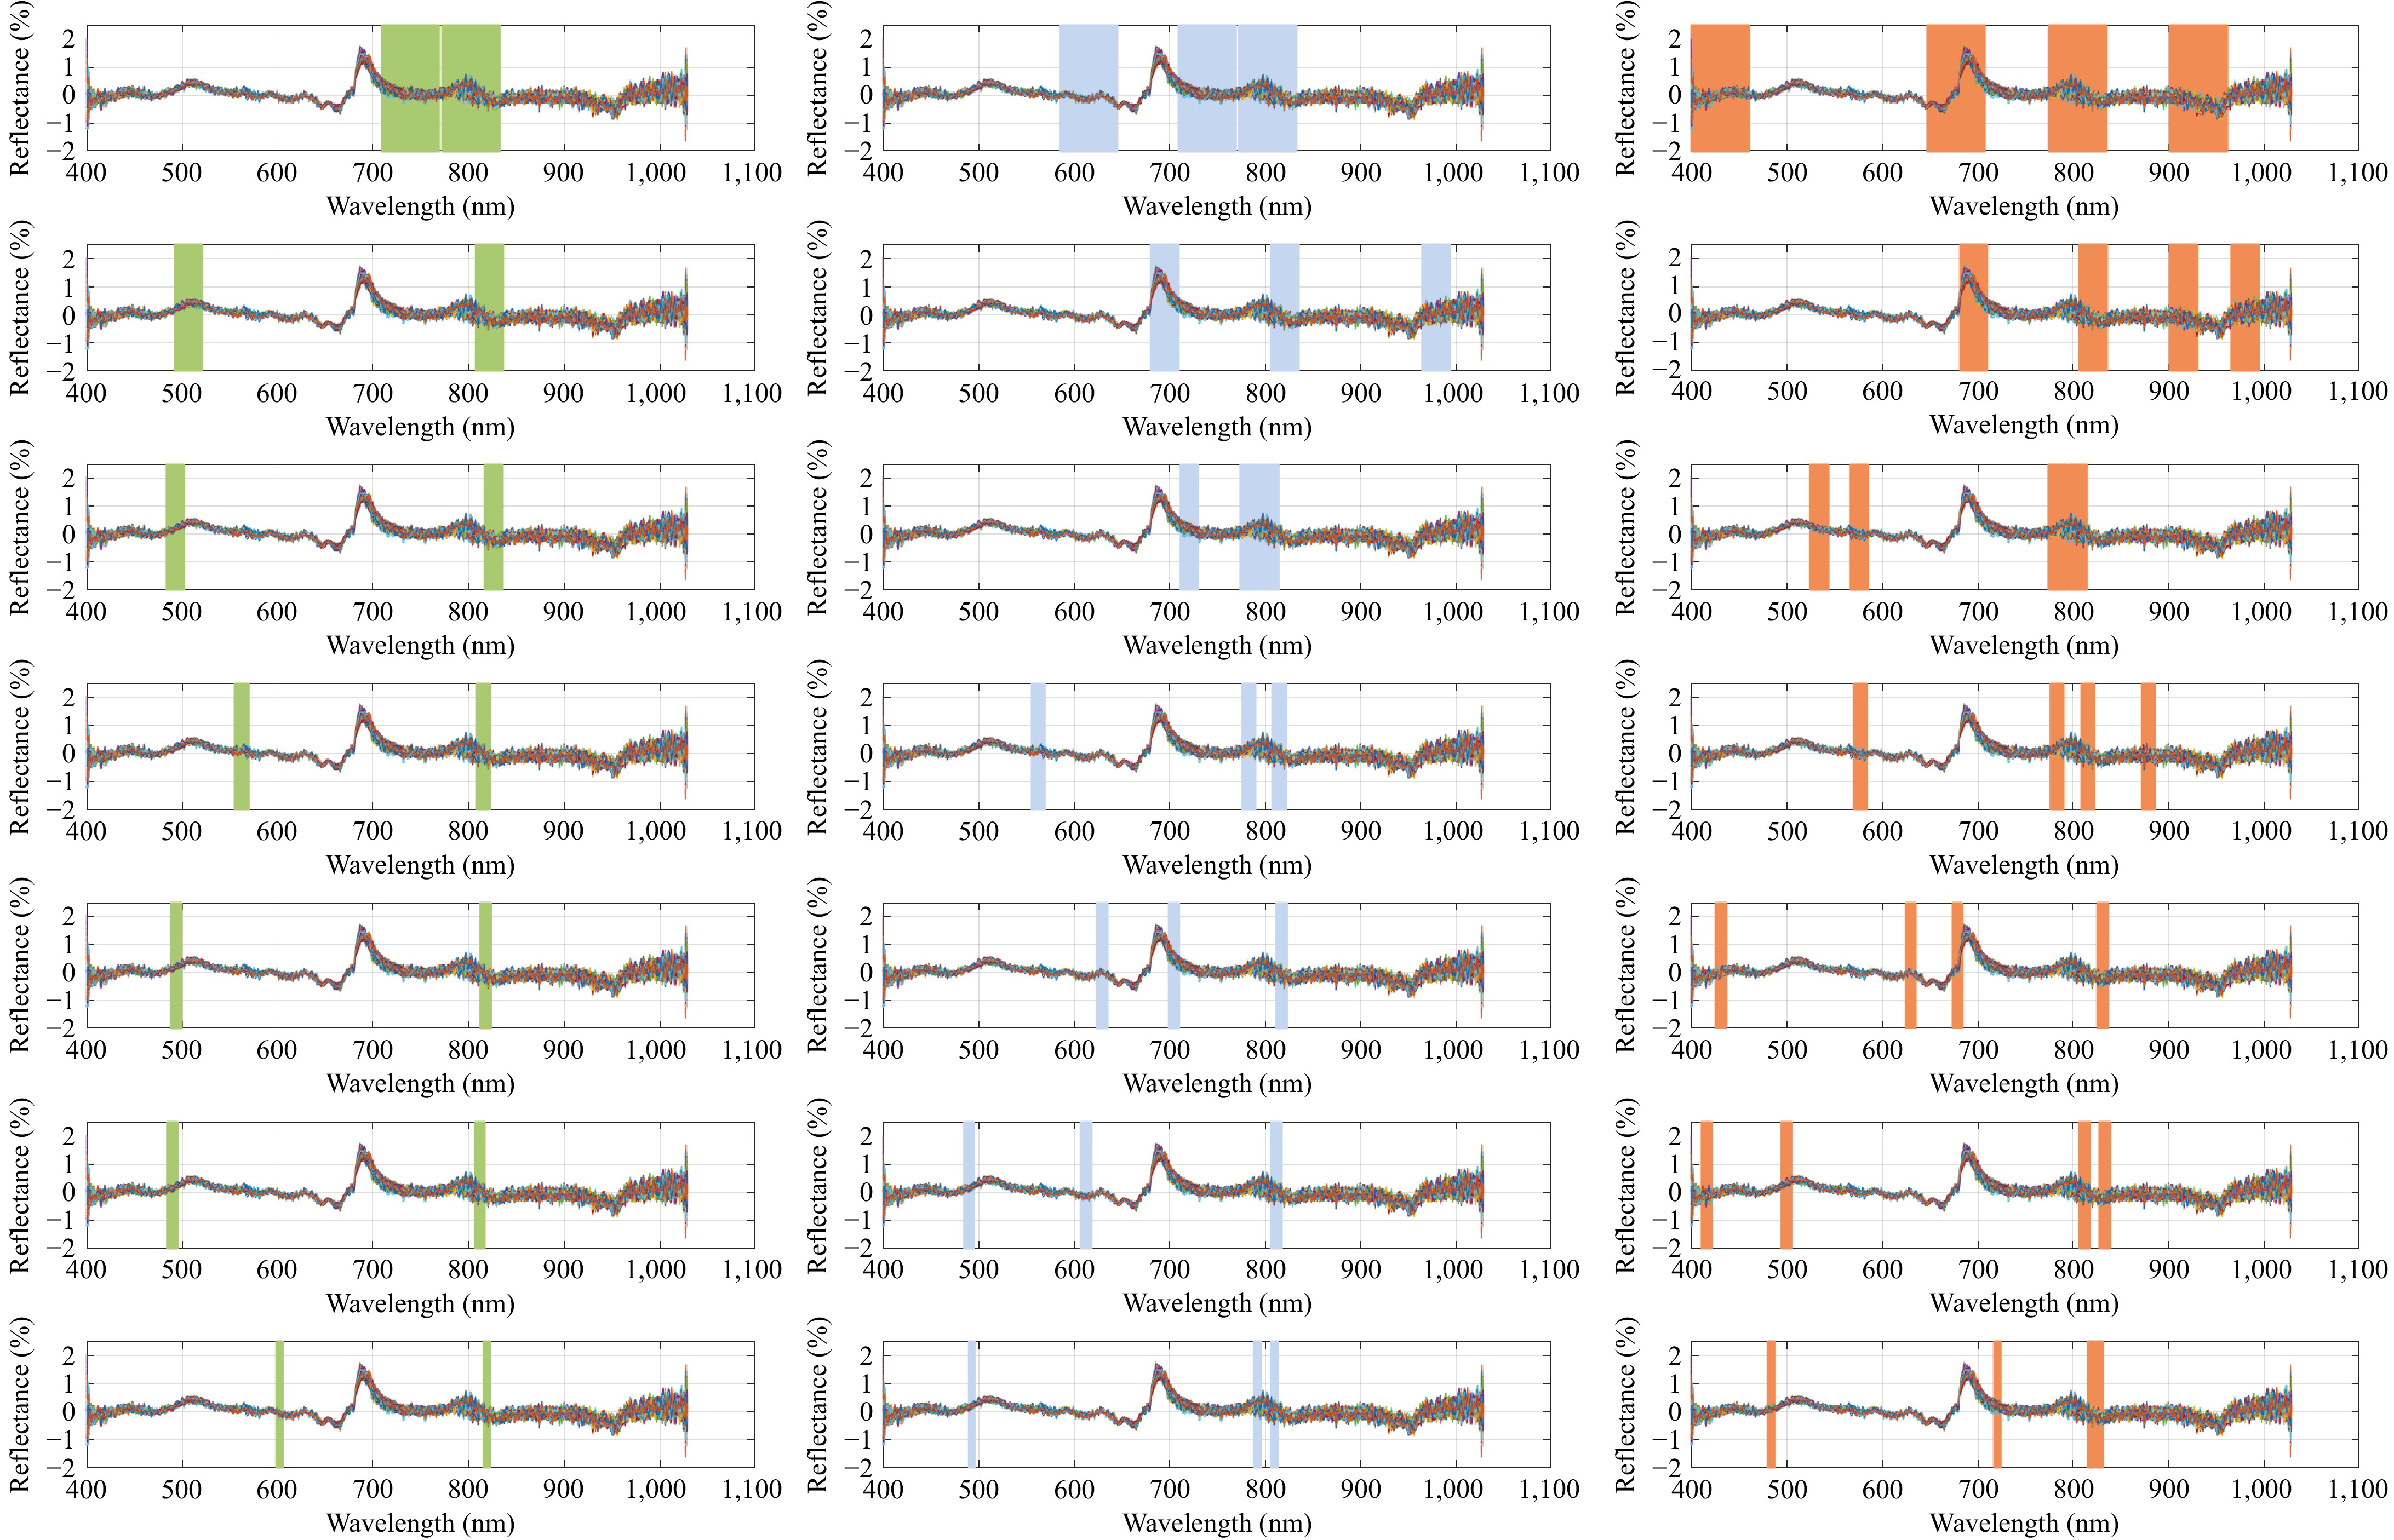
Figure 3.
The selected synergy intervals of FD + S-G processing spectral data. (a) Ten independent intervals and two candidate intervals. (b) Twenty independent intervals and two candidate intervals. (c) Thirty independent intervals and two candidate intervals. (d) Forty independent intervals and two candidate intervals. (e) Fifty independent intervals and two candidate intervals. (f) Sixty independent intervals and two candidate intervals. (g) Seventy independent intervals and two candidate intervals.(h) Ten independent intervals and three candidate intervals. (i) Twenty independent intervals and three candidate intervals. (j) Thirty independent intervals and three candidate intervals. (k) Forty independent intervals and three candidate intervals. (l) Fifty independent intervals and three candidate intervals. (m) Sixty independent intervals and three candidate intervals. (n) Seventy independent intervals and three candidate intervals. (o) Ten independent intervals and four candidate intervals. (p) Twenty independent intervals and four candidate intervals. (q) Thirty independent intervals and four candidate intervals. (r) Forty independent intervals and four candidate intervals. (s) Fifty independent intervals and four candidate intervals. (t) Sixty independent intervals and four candidate intervals. (u) Seventy independent intervals and four candidate intervals.
Figure 3 also reveals it can be observed that when the overall number of intervals was determined, as the number of selected intervals increased, the selected variables generally covered those when the number of selected intervals was lower (Fig. 3a, h & o). This suggested that a higher number of selected intervals typically led to the identification of more spectral characteristic peaks. However, as both the overall number of intervals and the number of selected intervals increased, the number of possible combinations of selected intervals increased rapidly, as described by Eqn (2). Consequently, the execution time of the algorithm in the program also increased, as shown in Fig. 4. When the overall number of intervals was small, the number of selected intervals had a negligible impact on the algorithm's runtime. In contrast, when the overall number of intervals was large, the number of selected intervals significantly affected the algorithm's runtime. For example, when the overall number of intervals is 70 and the number of selected intervals is two, there are 2,415 possible combinations of selected intervals, and the algorithm runtime is less than 5 s. When the number of selected intervals is 3, the combination rises to 54,740, and the runtime increases to under 100 s. However, with four selected intervals, the number of combinations increases to 916,895, and the runtime extends to 7,641 s.
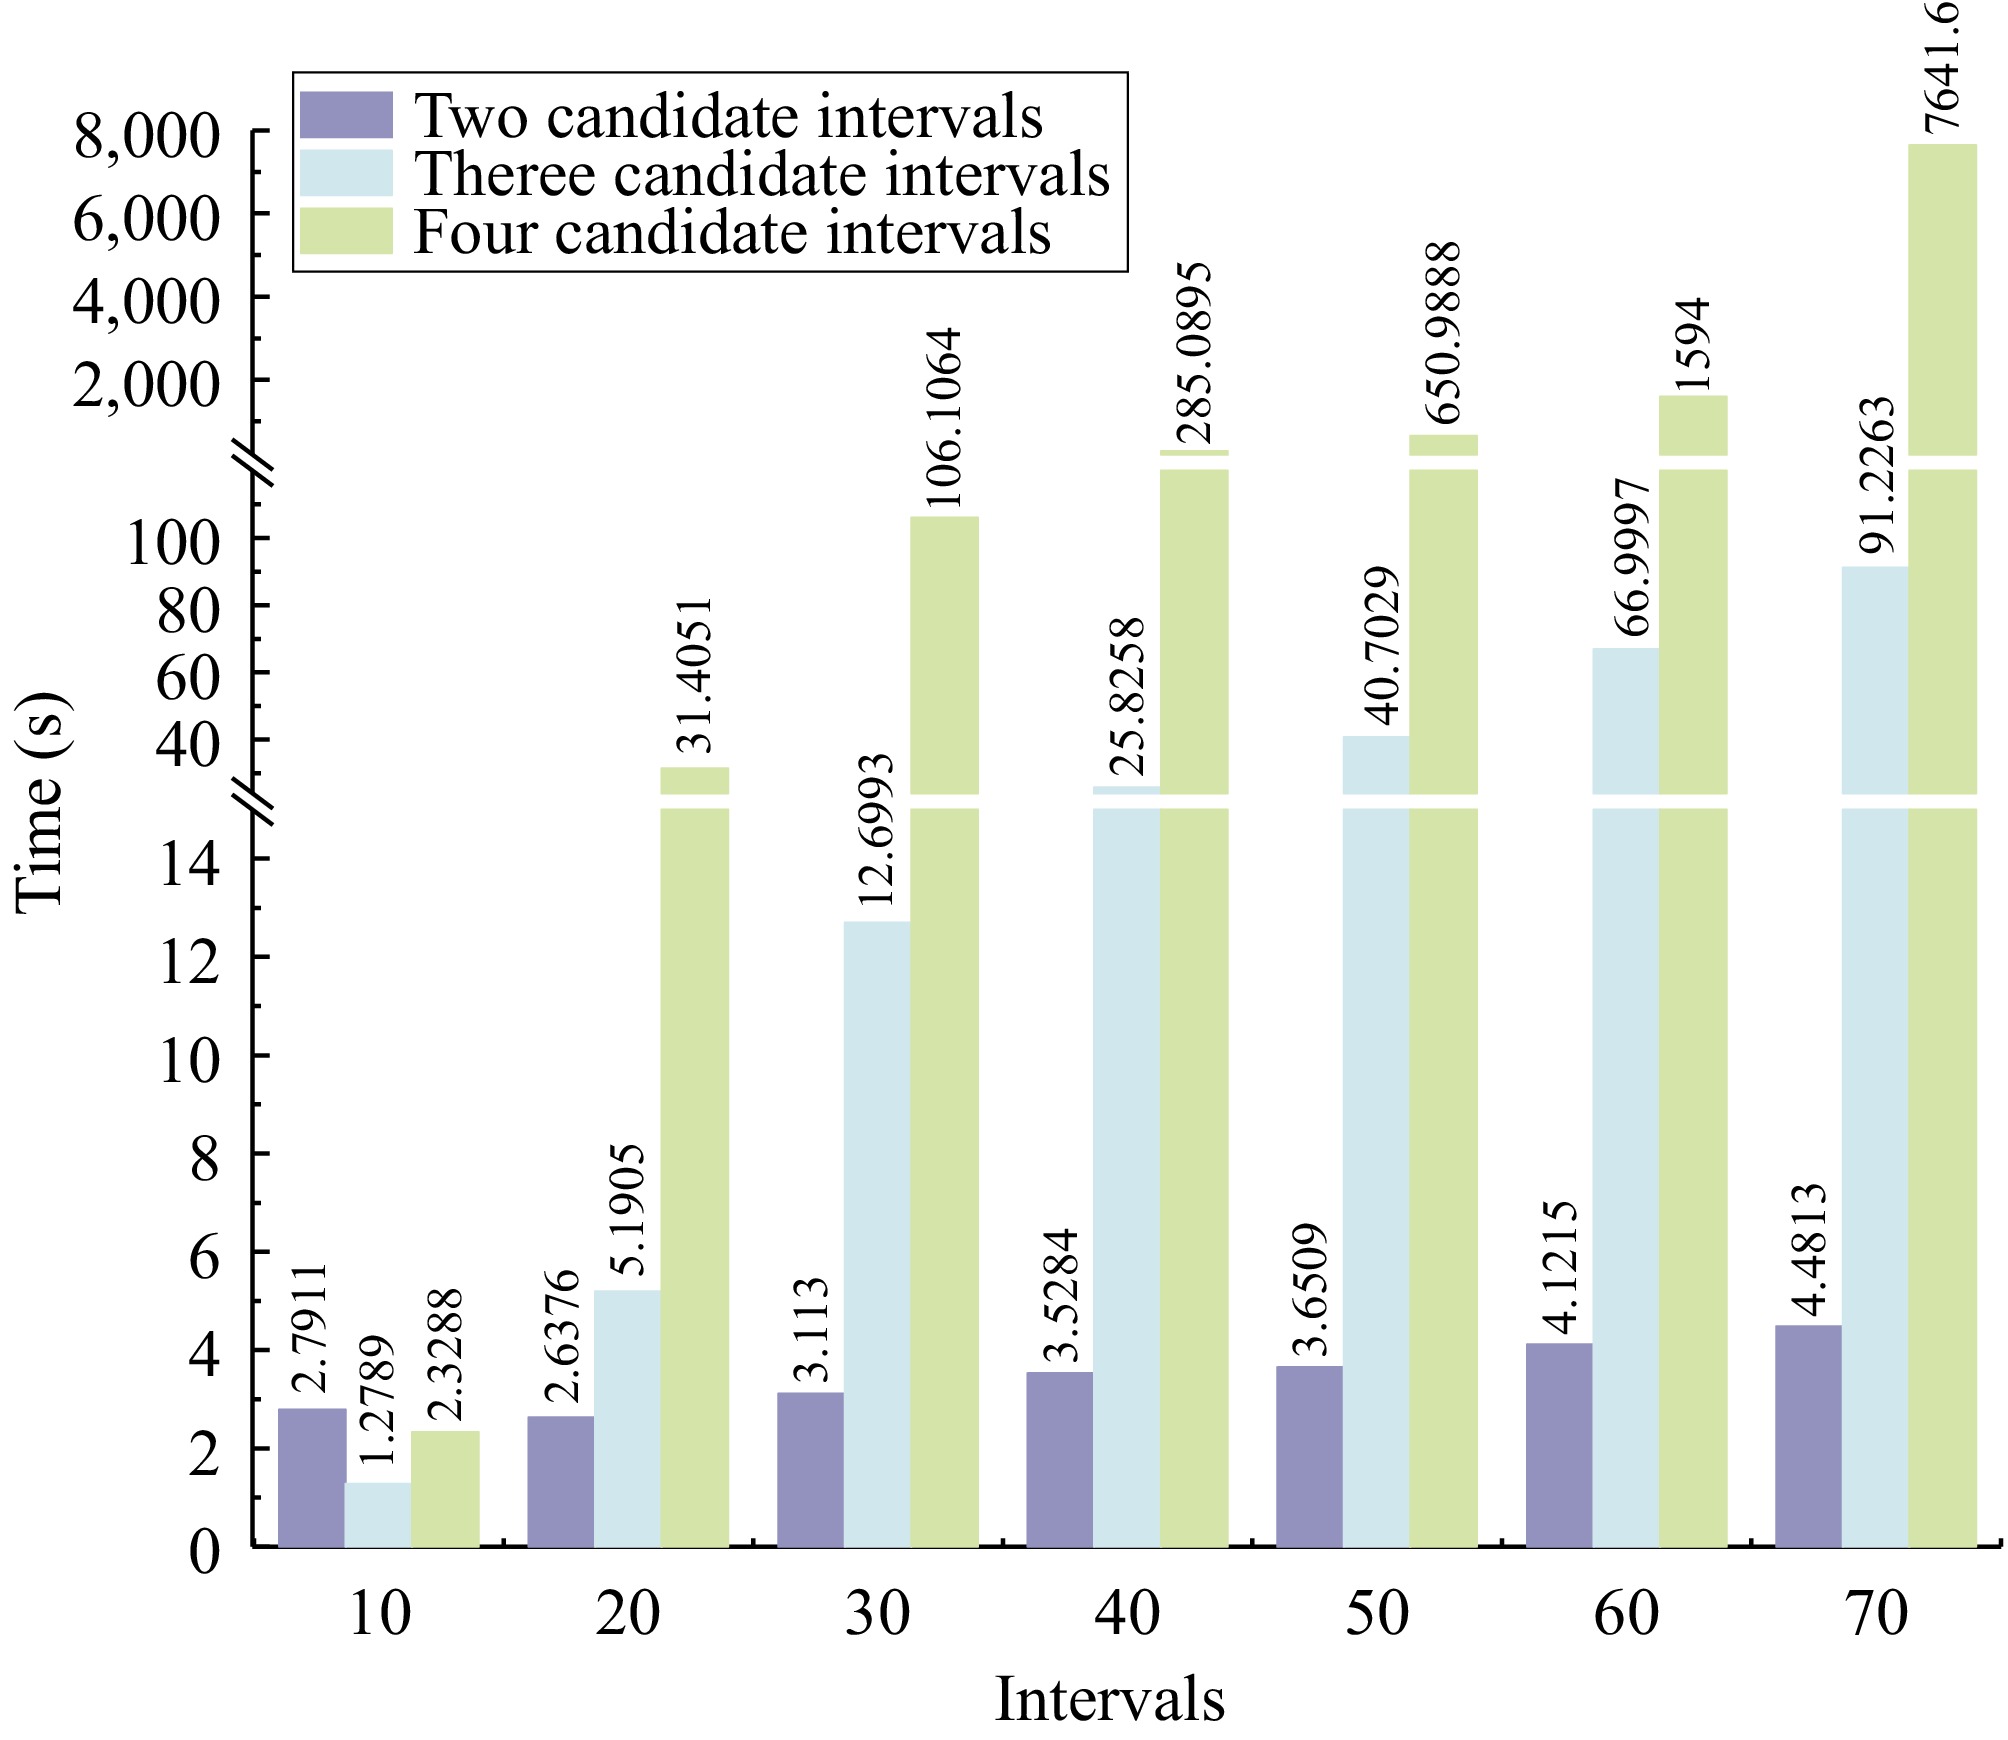
Figure 4.
Comparison of time consumption for screening synergy programs.
This exponential growth in computational complexity presents a significant challenge for real-world applications, particularly when the model is implemented on devices with limited processing power, such as handheld devices or industrial systems. In such scenarios, excessive computational demands may hinder the model's ability to perform real-time analysis, leading to delays or decreased efficiency. Additionally, as the number of intervals increases, the need for more powerful hardware and optimized algorithms becomes critical, particularly in large-scale or high-throughput settings where rapid processing and timely decision-making are essential. Therefore, balancing the number of intervals with the algorithm's runtime efficiency is crucial to ensure the model's practical applicability without compromising its performance in real-world environments. Therefore, considering the algorithm's runtime, the overall number of intervals should be carefully managed to avoid excessive computational demand.
The results of the prediction models established based on different numbers of selected intervals are shown in Fig. 5. As seen in Fig. 5, it can be observed that when the number of intervals chosen was two, there was no significant difference in the correlation coefficients between the calibration and prediction sets across the models. The optimum prediction model with two selected intervals had calibration and prediction set correlation coefficients of 0.806 and 0.832, respectively, with RMSEC and RMSEP values of 0.856 and 0.806, and an RPD value of 1.774. For models with three selected intervals, the optimum prediction model showed calibration and prediction set correlation coefficients of 0.814 and 0.851, with RMSEC and RMSEP values of 0.839 and 0.778, and an RPD value of 1.836. Although the optimum model achieved a relatively higher RPD value, the Rc and RMSEC were higher than the Rp and RMSEP, suggesting a potential overfitting risk. When the number of selected intervals was increased to four, the optimum prediction model yielded Rc and Rp of 0.915 and 0.835, respectively, with RMSEC and RMSEP values of 0.587 and 0.788, respectively, and an RPD value of 1.815. The optimal prediction model was obtained when the overall number of intervals was set to 20, and the number of selected intervals was four. The selected interval bands were 681−711, 806−831, 901−931, and 965−995 nm, with the number of variables used in the model reduced to 120.
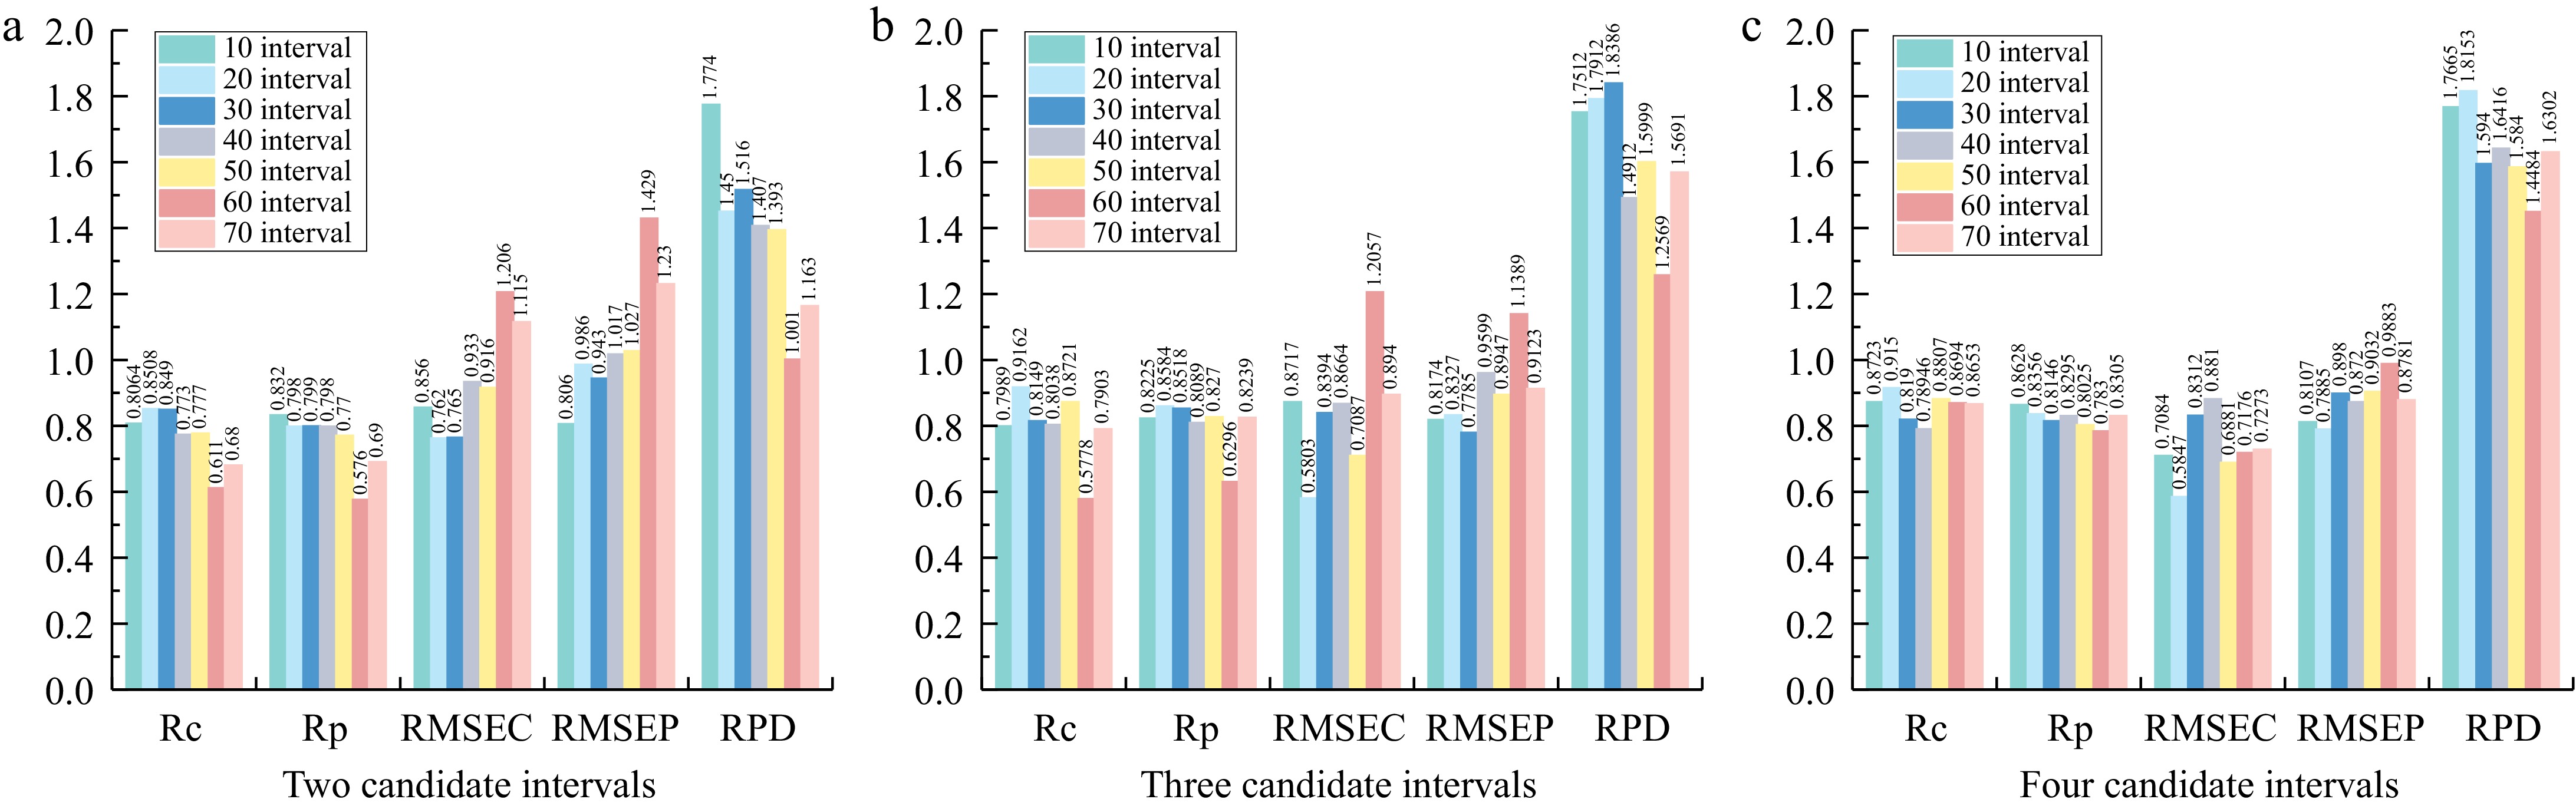
Figure 5.
Comparison of modeling results for different synergy intervals.
Comparison of modelling results between the whole band and Si-PLS screening spectral data
-
A comparison of the modeling results presented in Table 2 and Fig. 4 reveals that under the condition of first derivative preprocessing combined with S-G smoothing, the prediction performance of the Si-PLS model using selected subinterval combinations was inferior to that of the full-band spectrum model. However, using Si-PLS for subinterval selection significantly reduced the number of input variables. By employing Si-PLS to select intervals, irrelevant spectral data not associated with NIR detection could be substantially eliminated. This is one of the primary reasons why the Si-PLS model with selected subintervals could still yield an acceptable prediction model performance. In the NIR spectra of Seedless White grape total acidity, the spectral signal at 710 nm, which directly reflected the total acidity content, was a relatively weak peak. The first derivative preprocessing could enhance these weak absorption peaks, while S-G smoothing could reduce the noise introduced during the derivative processing. Finally, Si-PLS was used to eliminate variables unrelated to total acidity, resulting in a prediction model suitable for estimating the total acidity.
By employing Si-PLS for subinterval selection, the model narrows down the spectral range, thereby reducing the number of variables and enhancing computational efficiency, at the cost of potentially losing some predictive accuracy in the process. The trade-off highlights a fundamental consideration in real-world applications; as the number of input variables is reduced, the computational burden decreases, but this may lead to a slight reduction in the precision of predictions, especially when dealing with subtle spectral features. Conversely, using the full spectrum allows for more comprehensive information in the model, leading to higher accuracy at the expense of longer computational time and greater complexity. Therefore, the key challenge lies in balancing computational efficiency with the requirement for model accuracy, particularly in contexts where real-time analysis and resource limitations (e.g., in handheld or industrial devices) must be considered.
-
This study utilized a spectrometer to obtain full-band spectrum data of Seedless White grapes, and developed the optimal Si-PLS model for predicting grape total acidity, enabling rapid quantitative detection of total acidity. The results showed that different spectral preprocessing methods considerably affect the modeling outcomes for total acidity prediction, with the first derivative combined with S-G smoothing having the most notable influence on model performance. A comparison between the modeling results using full-band spectrum data and those based on Si-PLS selected subinterval spectral data revealed that Si-PLS effectively reduces the contribution of spectral data unrelated to total acidity detection, thereby simplifying model complexity without significantly affecting model performance. By applying first derivative preprocessing combined with S-G smoothing to the spectral data and using Si-PLS to select the optimal subinterval combinations, the optimal near-infrared spectral prediction model for detecting the total acidity of Seedless White grapes was established. The selected optimal subintervals correspond to the wavelengths 681−711, 806−831, 901−931, and 965−995 nm. The optimal model yielded correlation coefficients of 0.915 and 0.835 for the calibration and prediction sets, respectively, with RMSE values of 0.587 and 0.788 and RPD of 1.815. This study demonstrated that using Si-PLS for subinterval selection could establish the optimal spectral prediction model for total acidity. The findings are of significant importance for developing near-infrared spectral detection devices for total acidity, as the Si-PLS selected subinterval variables could provide a foundation for the design of optoelectronic sensors and contribute to the rapid quantitative detection of grape total acidity. Of course, although the model improves the specificity of spectral data through subinterval selection, a practical implementation may encounter challenges such as hardware discrepancies and sample variability. These factors necessitate that the model possesses robust generalization capabilities to ensure reliable predictions across different batches or grape varieties. Therefore, successfully integrating this model into handheld devices or industrial settings requires overcoming several technical challenges, including data processing, environmental adaptability, and hardware integration.
This work was supported by the National Natural Science Foundation of China (Project No. 52305281) , the Modern Agricultural Engineering Key Laboratory at Universities of Education Depart-ment of Xinjiang Uygur Autonomous Region (Project No. TDNG2024101 and TDNG2023102), the Shaanxi Provincial Youth Fundation (2025JC-YBQN-238), the Key R&D Program of Shaanxi Province (2025NC-YBXM-194) and the Shaanxi Province Youth Talent Support Program (20250604). The authors declare no conflict of interest, and the authors are grateful to anonymous reviewers for their comments.
-
The authors confirm contribution to the paper as follows: conceptualization, writing - draft manuscript preparation: Xing J, He X; investigation and methodology: Sun X, Liu W; investigation: He K, Li J; supervision, funding, administration: He K, Su Y. All authors reviewed the results and approved the final version of the manuscript
-
The datasets generated and analyzed during the current study are available from the corresponding author upon reasonable request.
-
The authors declare that they have no conflict of interest.
-
Authors contributed equally: Jianfei Xing, Xiaowei He
- Copyright: © 2025 by the author(s). Published by Maximum Academic Press on behalf of China Agricultural University, Zhejiang University and Shenyang Agricultural University. This article is an open access article distributed under Creative Commons Attribution License (CC BY 4.0), visit https://creativecommons.org/licenses/by/4.0/.
-
About this article
Cite this article
Xing J, He X, Sun X, Liu W, Li J, et al. 2025. Feasibility quantitative analysis of NIR spectroscopy coupled with Si-PLS to predict total acidity of Seedless White table grapes. Food Innovation and Advances 4(2): 183−190 doi: 10.48130/fia-0025-0018 

Feasibility quantitative analysis of NIR spectroscopy coupled with Si-PLS to predict total acidity of Seedless White table grapes
- Received: 11 December 2024
- Revised: 23 January 2025
- Accepted: 25 February 2025
- Published online: 26 May 2025
Abstract: Total acidity (TA) is a critical parameter for evaluating the quality of table grapes. Research on rapid detection techniques for table grapes contributes substantially to the comprehensive assessment of grape quality. This study employed visible-near-infrared (Vis-NIR) spectroscopy to rapidly and quantitatively determine TA in Seedless White grapes. Various spectral preprocessing techniques were employed on the spectral data within the 400 to 1100 nm wavelength range. The synergy interval partial least squares (Si-PLS) method was utilized to screen the optimal subintervals from the preprocessed spectral data correlating with the TA content in grapes. Spectral prediction models for total acidity were developed based on full-band spectrum data and optimal subintervals. The impact of various preprocessing methods on the accuracy of the TA prediction models was evaluated, and the performance of the full-band spectrum model was compared with that of the subinterval-based model. Through comparative analysis, the first derivative method combined with the Savitzky-Golay smoothing method emerged as the most effective preprocessing approach. Si-PLS was subsequently employed to select spectral intervals, and a prediction model based on these intervals was established. The optimal model showed a correlation coefficient (Rc) of 0.915 and a root mean square error (RMSEC) of 0.584 g/L for the calibration set, and a correlation coefficient (Rp) of 0.835 with root mean square error (RMSEP) of 0.788 g/L for the prediction set, yielding a residual predictive deviation (RPD) of 1.815. The results demonstrate that integrating NIR spectroscopy and Si-PLS facilitates the rapid and precise quantitative detection of TA in grapes. This study provides a reference for developing rapid detection devices.
-
Key words:
- Table Grape /
- Total acidity /
- Non-destructive testing /
- Si-PLS /
- Full-band /
- Subinterval