-
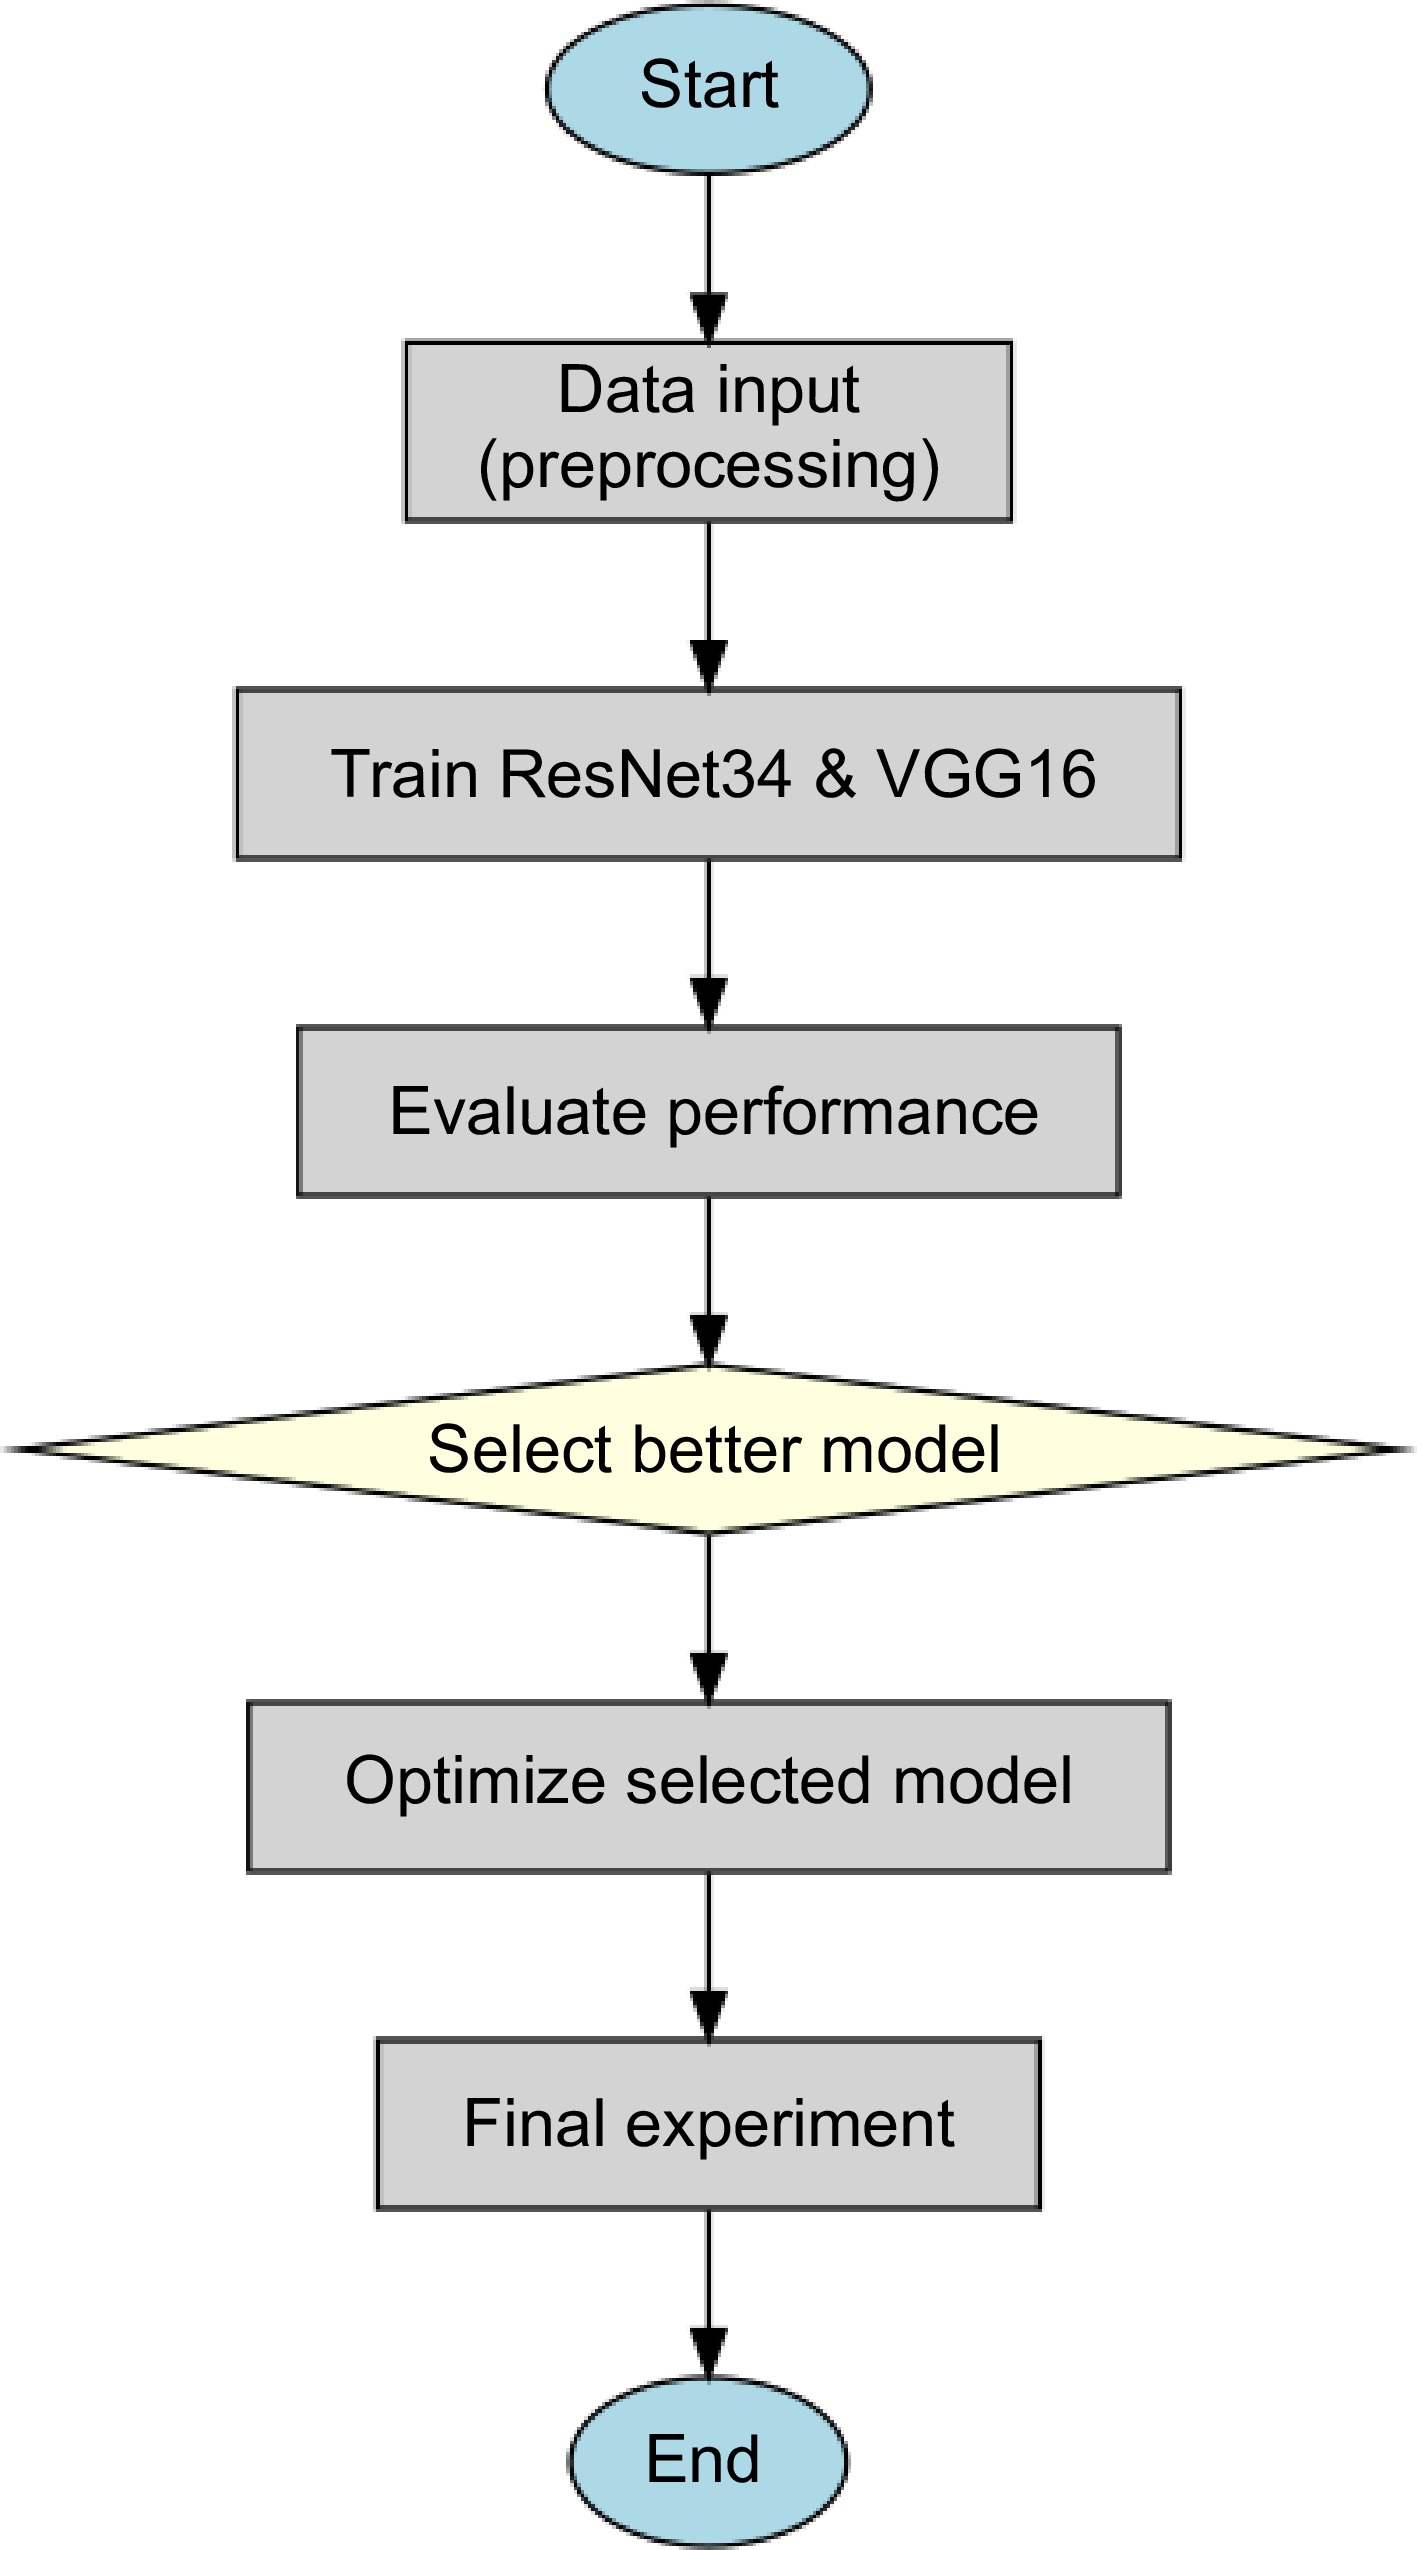
Figure 1.
Experimental procedure.
-
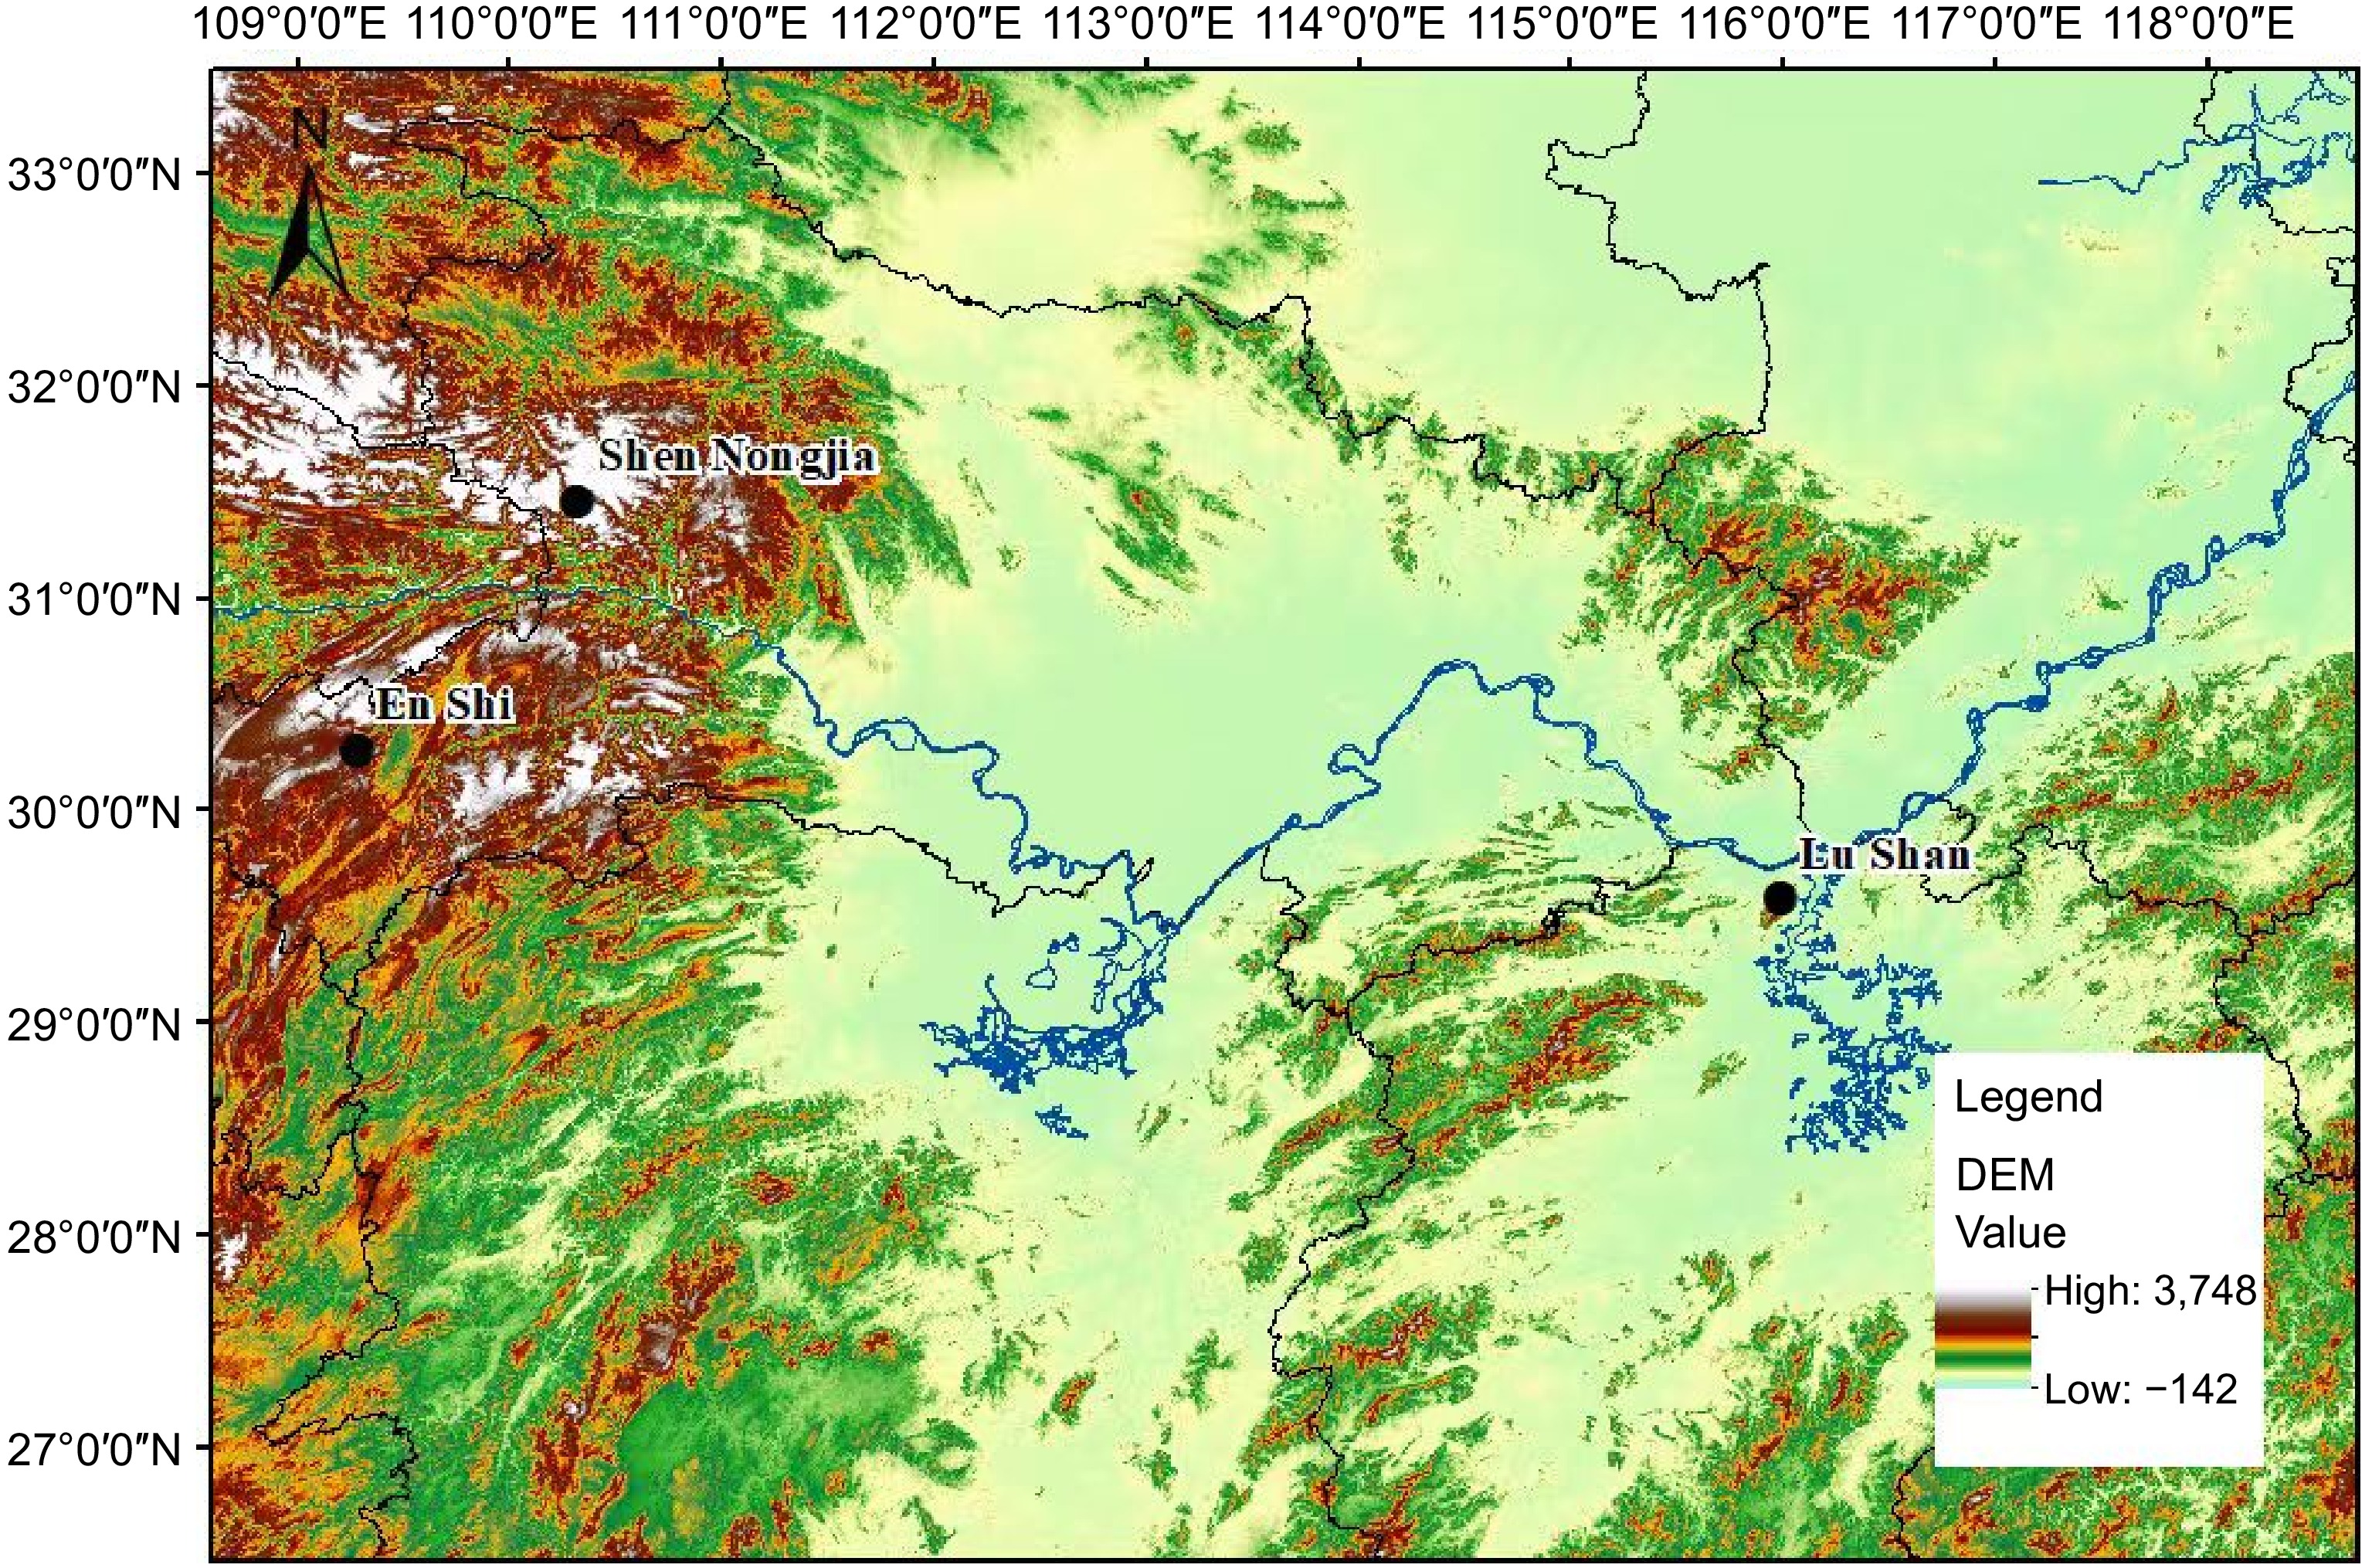
Figure 2.
Geolocation of the observation sites.
-
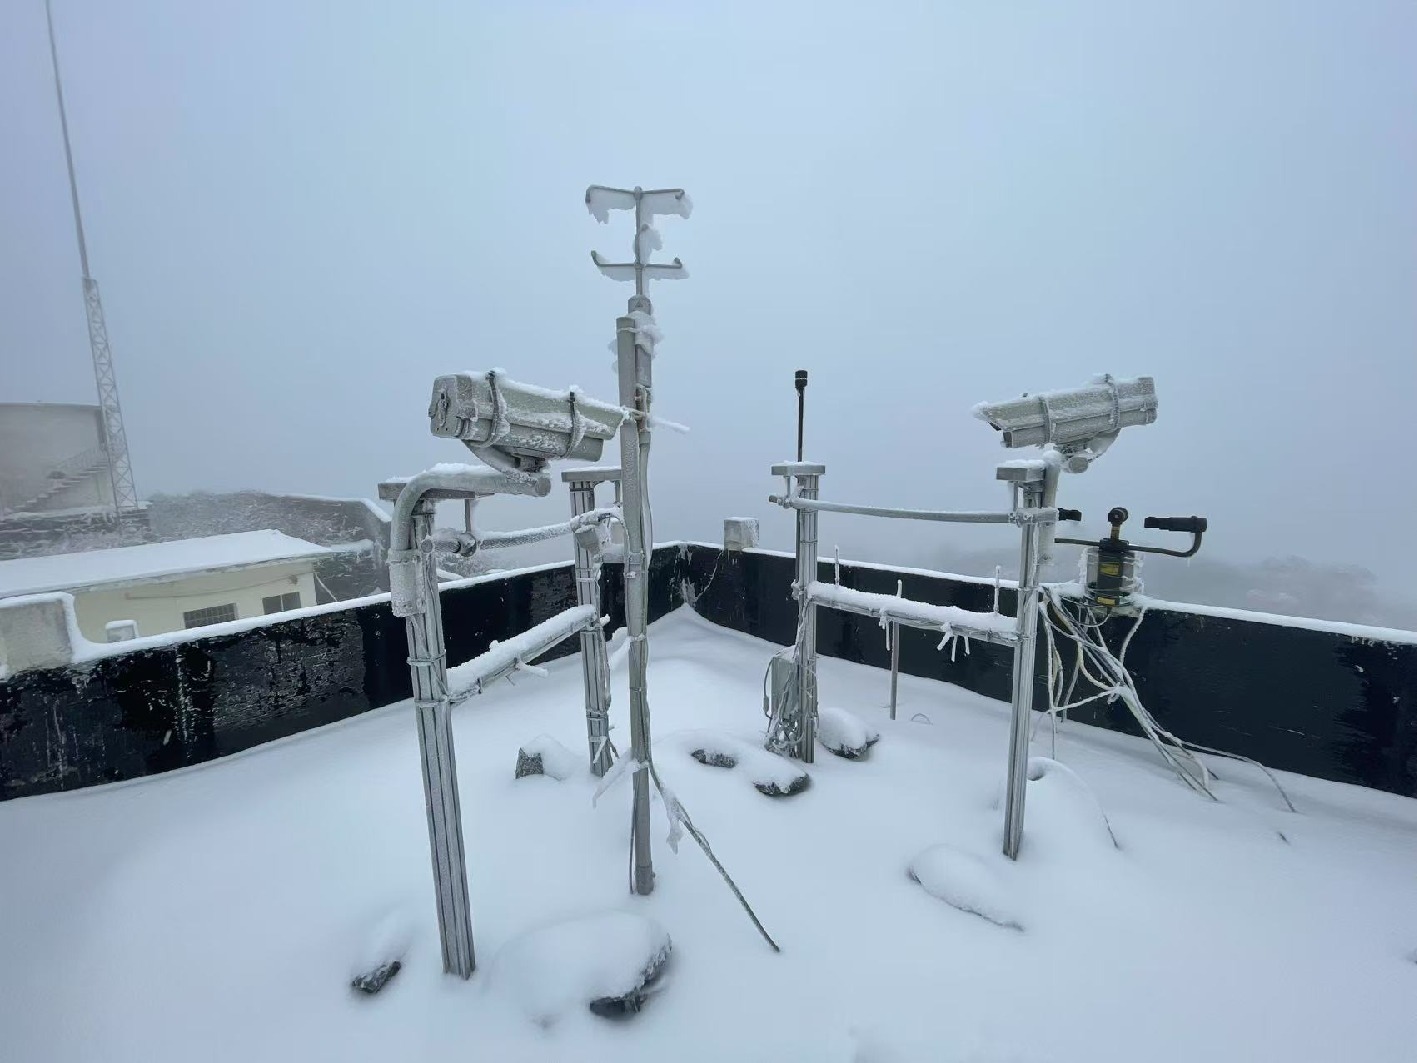
Figure 3.
The NH3000 automatic wire icing monitoring system and its installation setup.
-
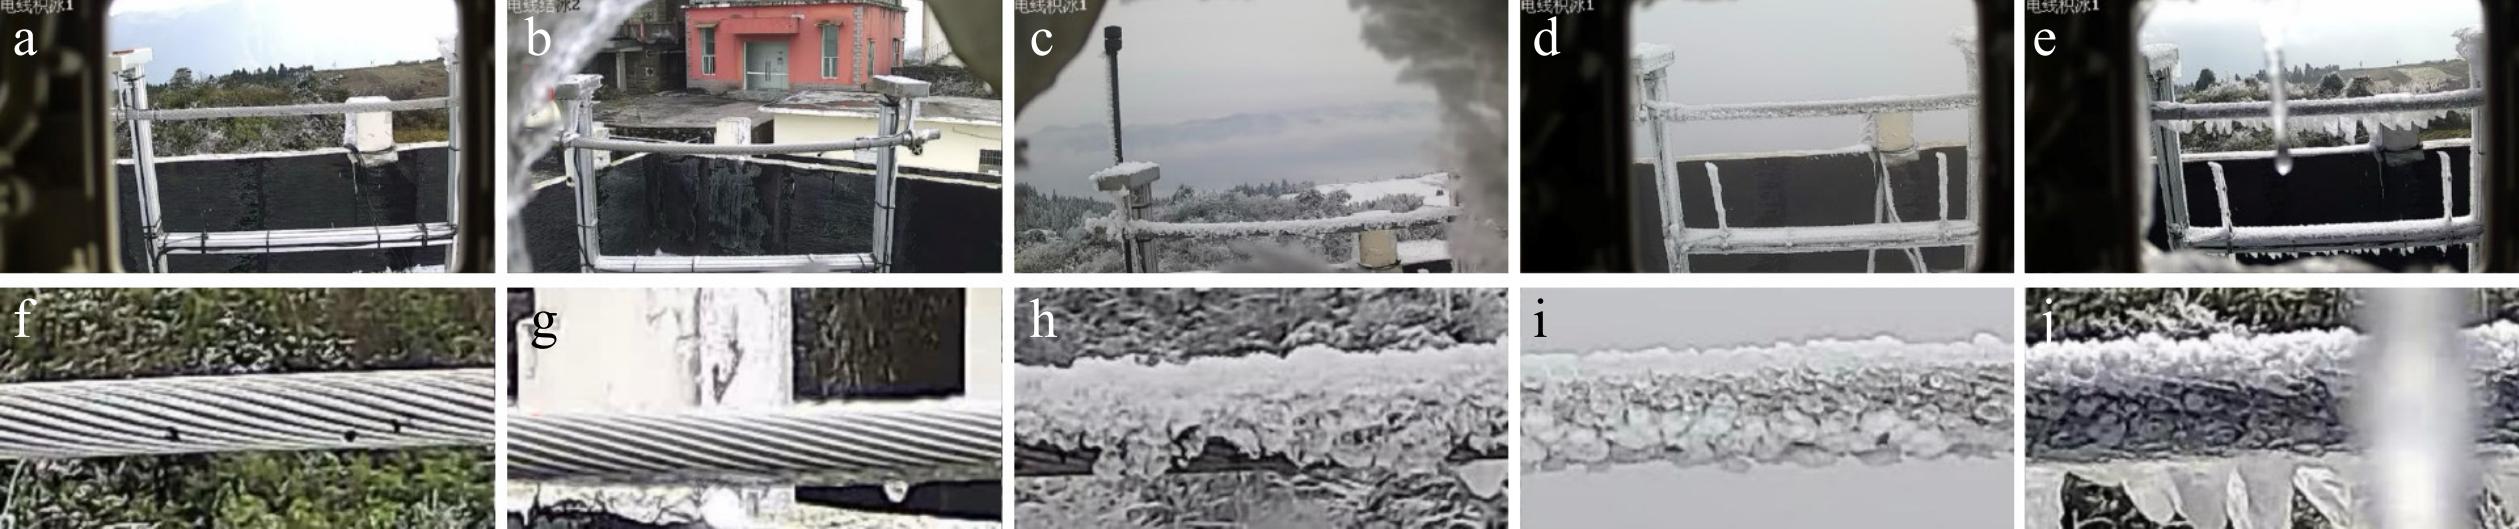
Figure 4.
(a)−(e) Original and (f)−(j) cropped images of wire icing for different risk levels (Levels 0−4).
-
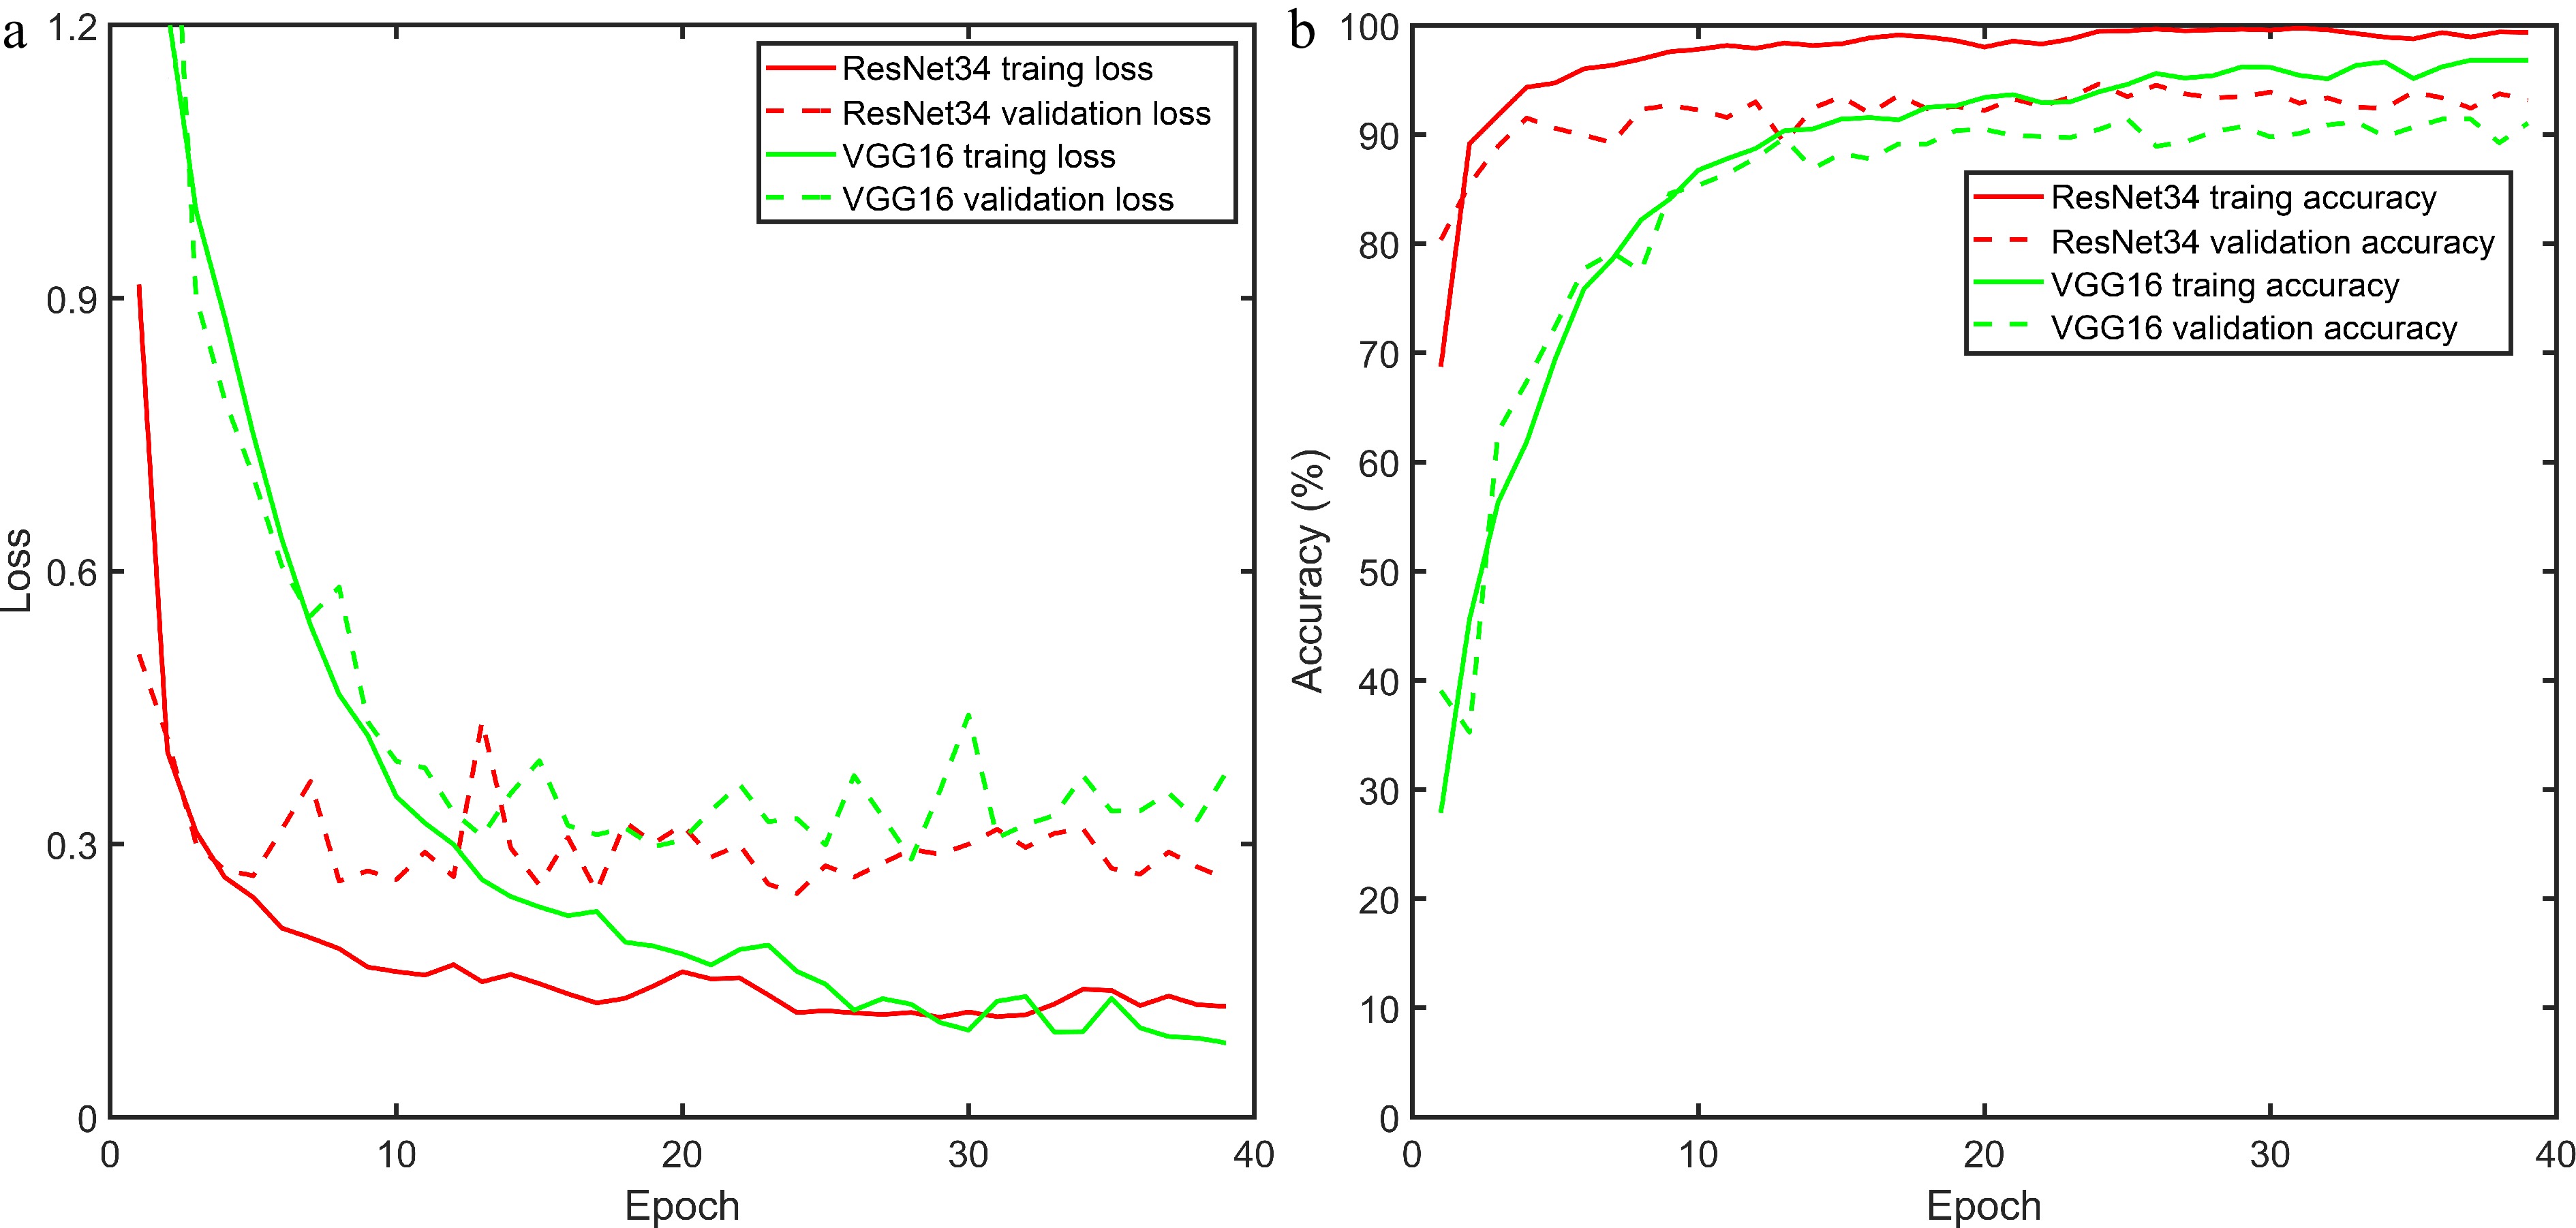
Figure 5.
(a) Cross-Entropy Loss curves and (b) accuracy curves for the training and validation sets of VGG16 and ResNet34 models.
-
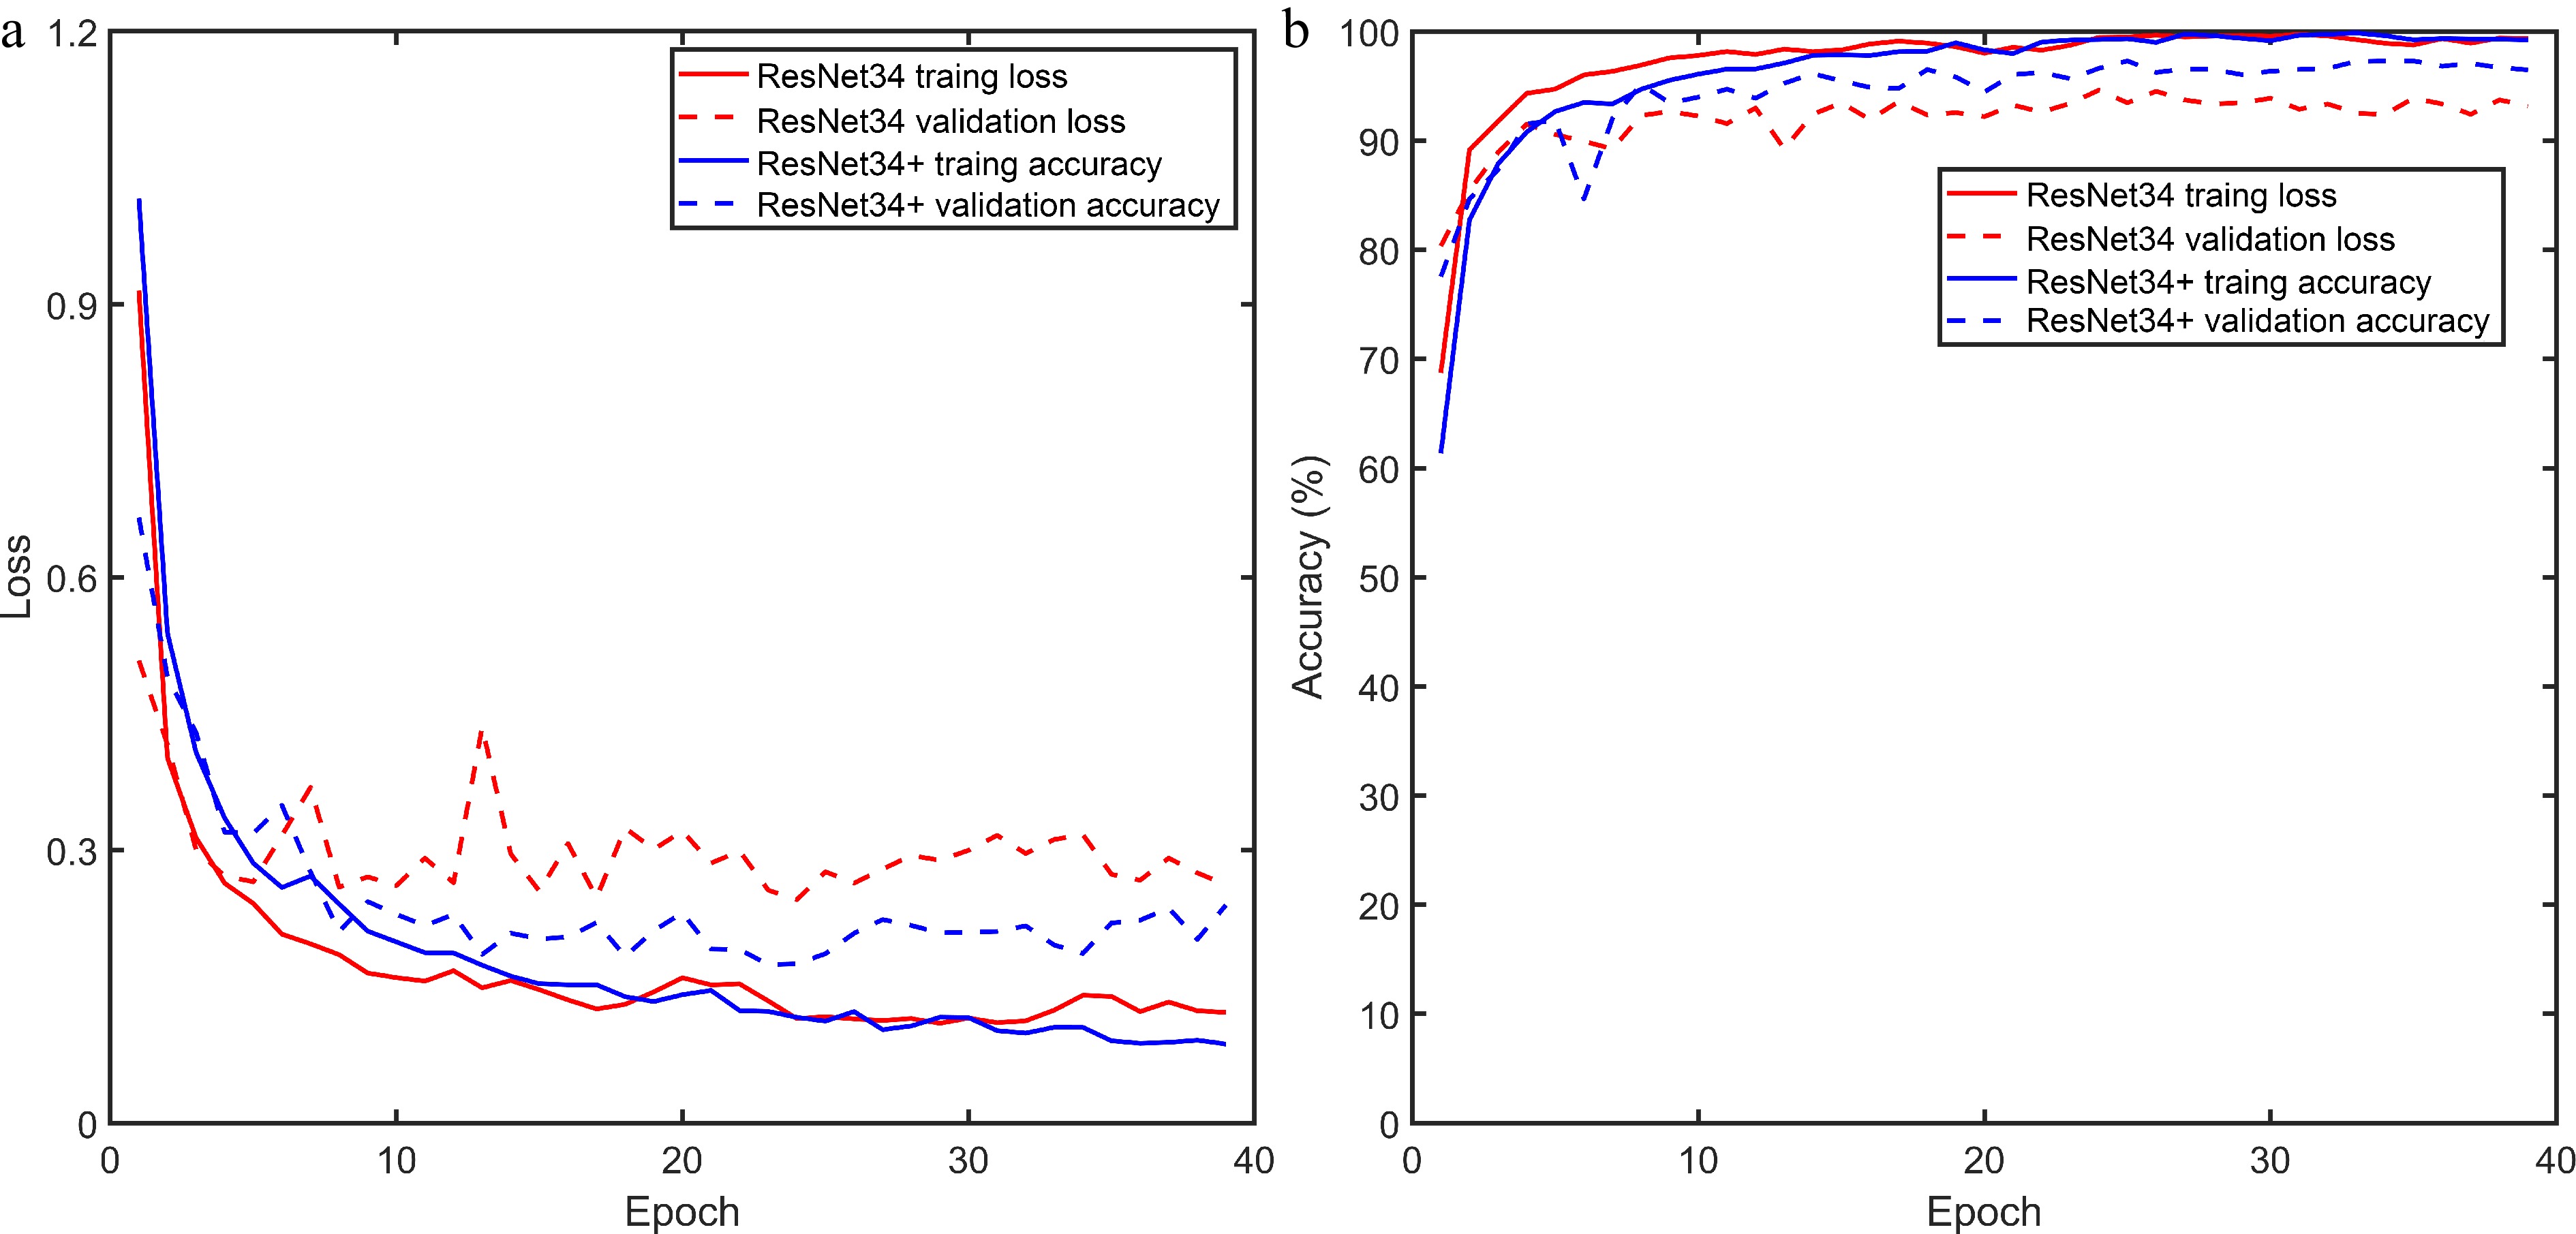
Figure 6.
(a) Cross-Entropy Loss curves and (b) accuracy curves for the training and validation sets of ResNet34 and ResNet34+ models.
-
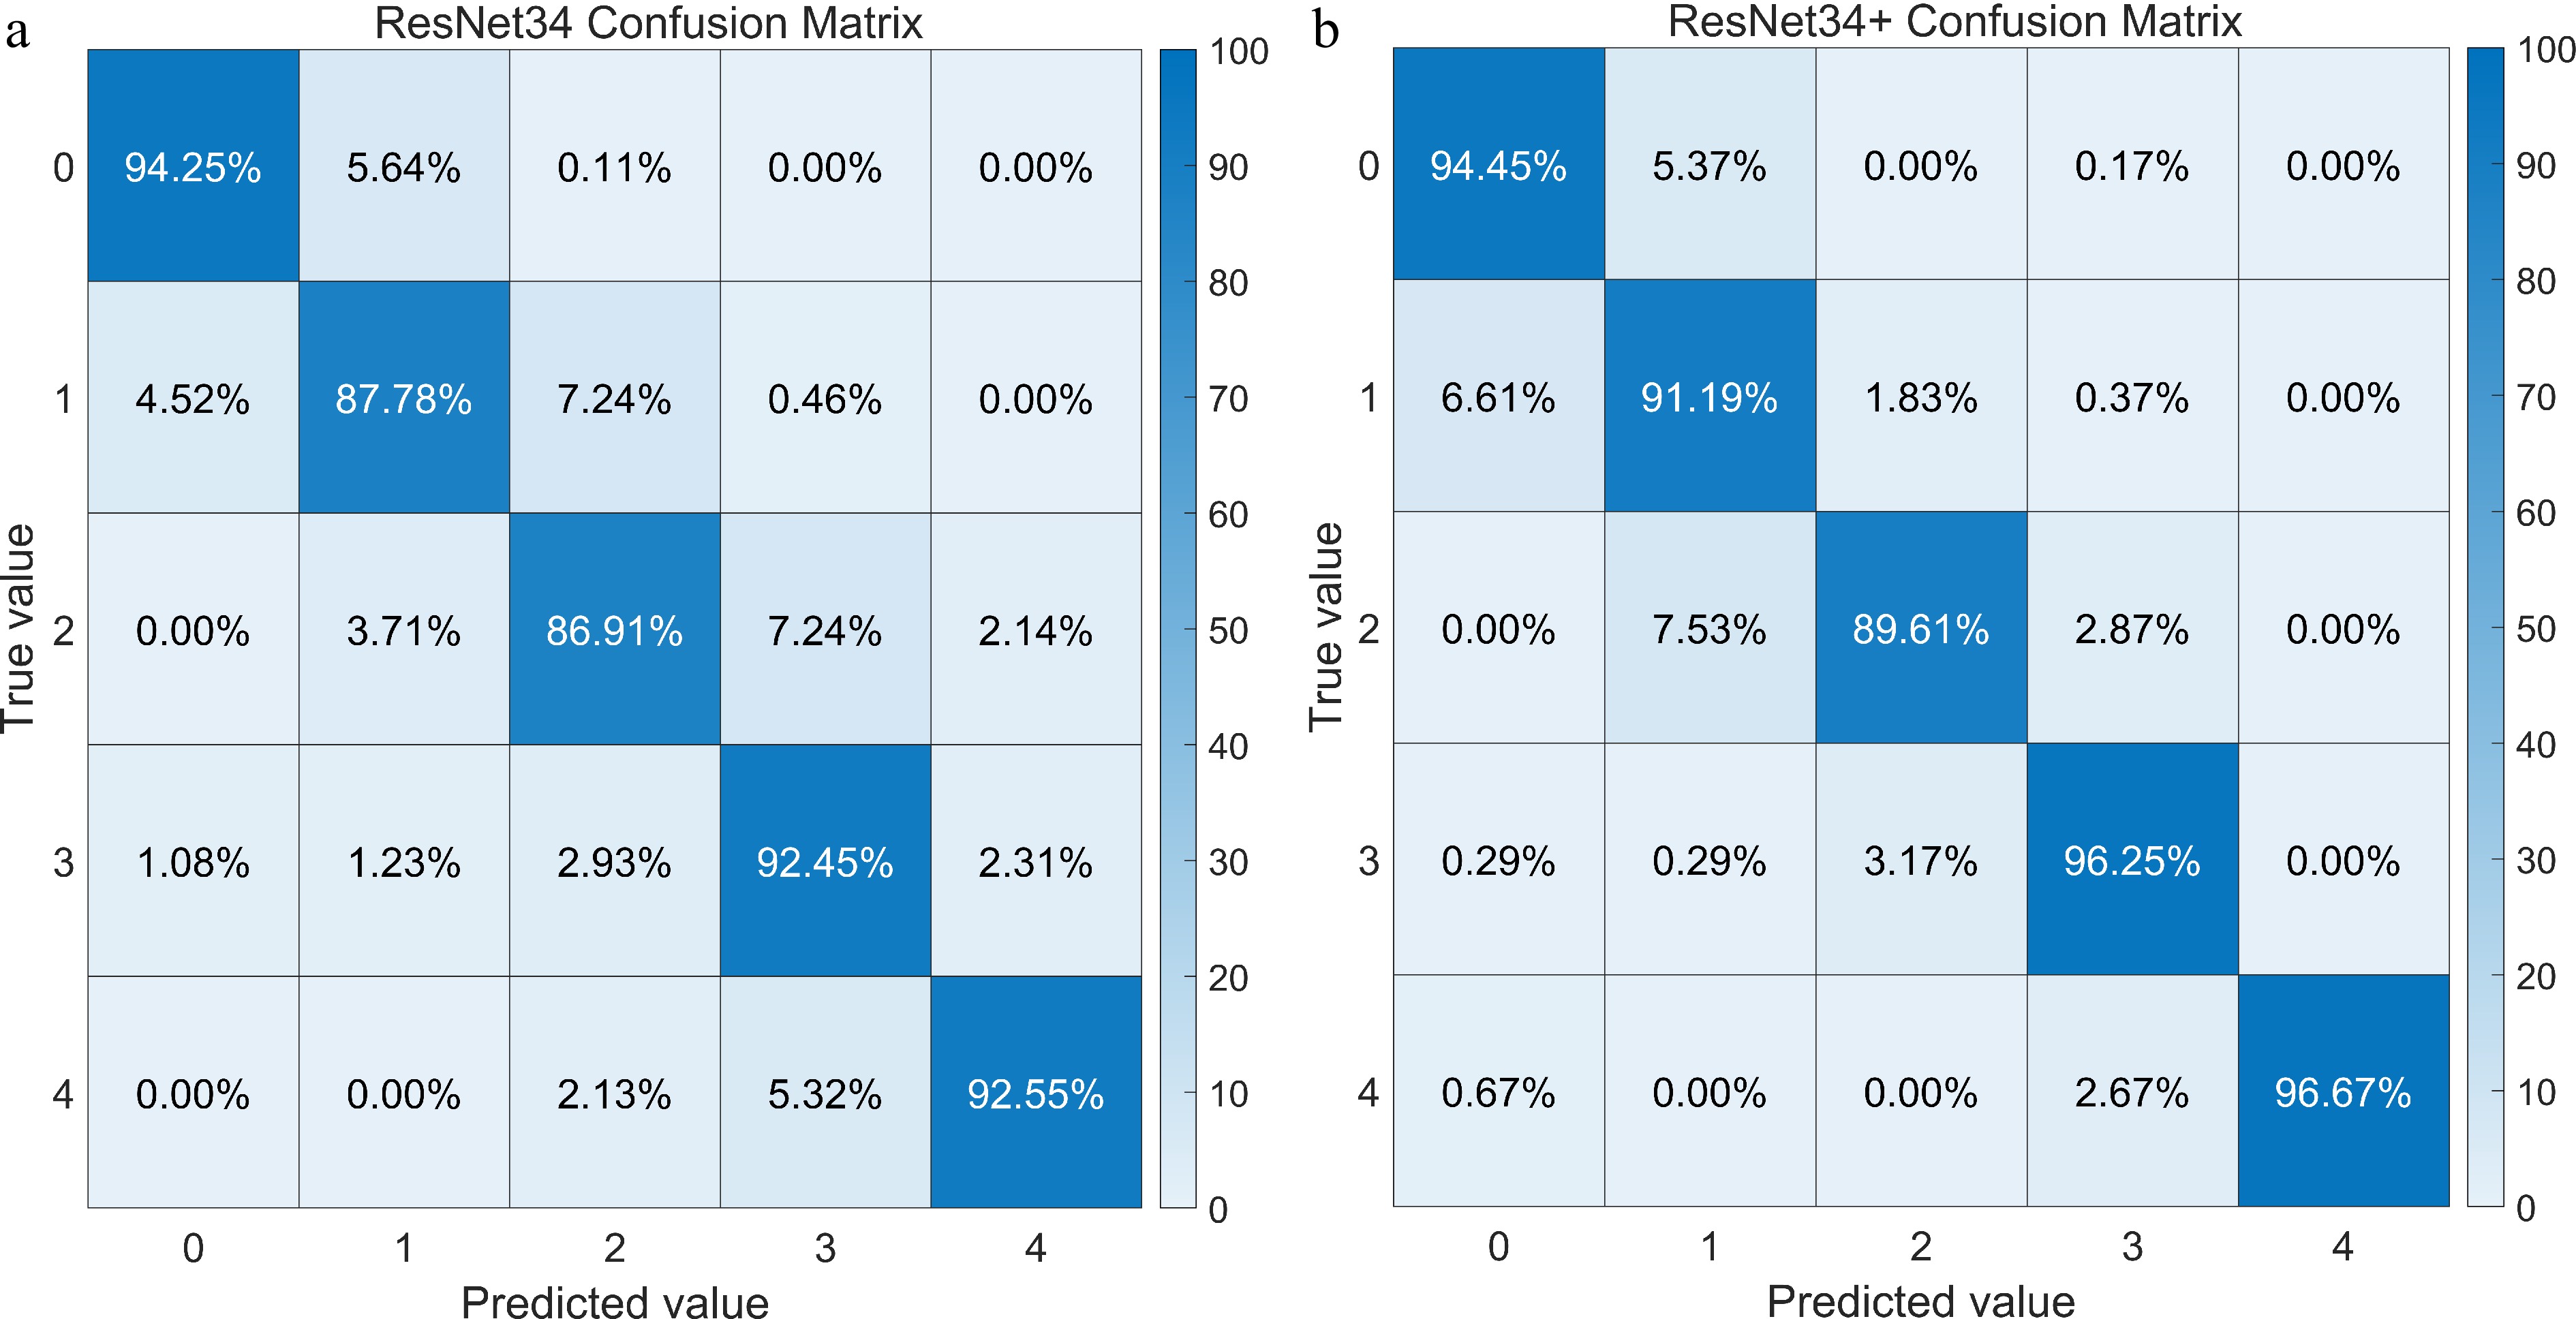
Figure 7.
Confusion matrix of the recognition accuracy for different wire icing risk levels using the (a) ResNet34 and (b) ResNet34+ model.
-
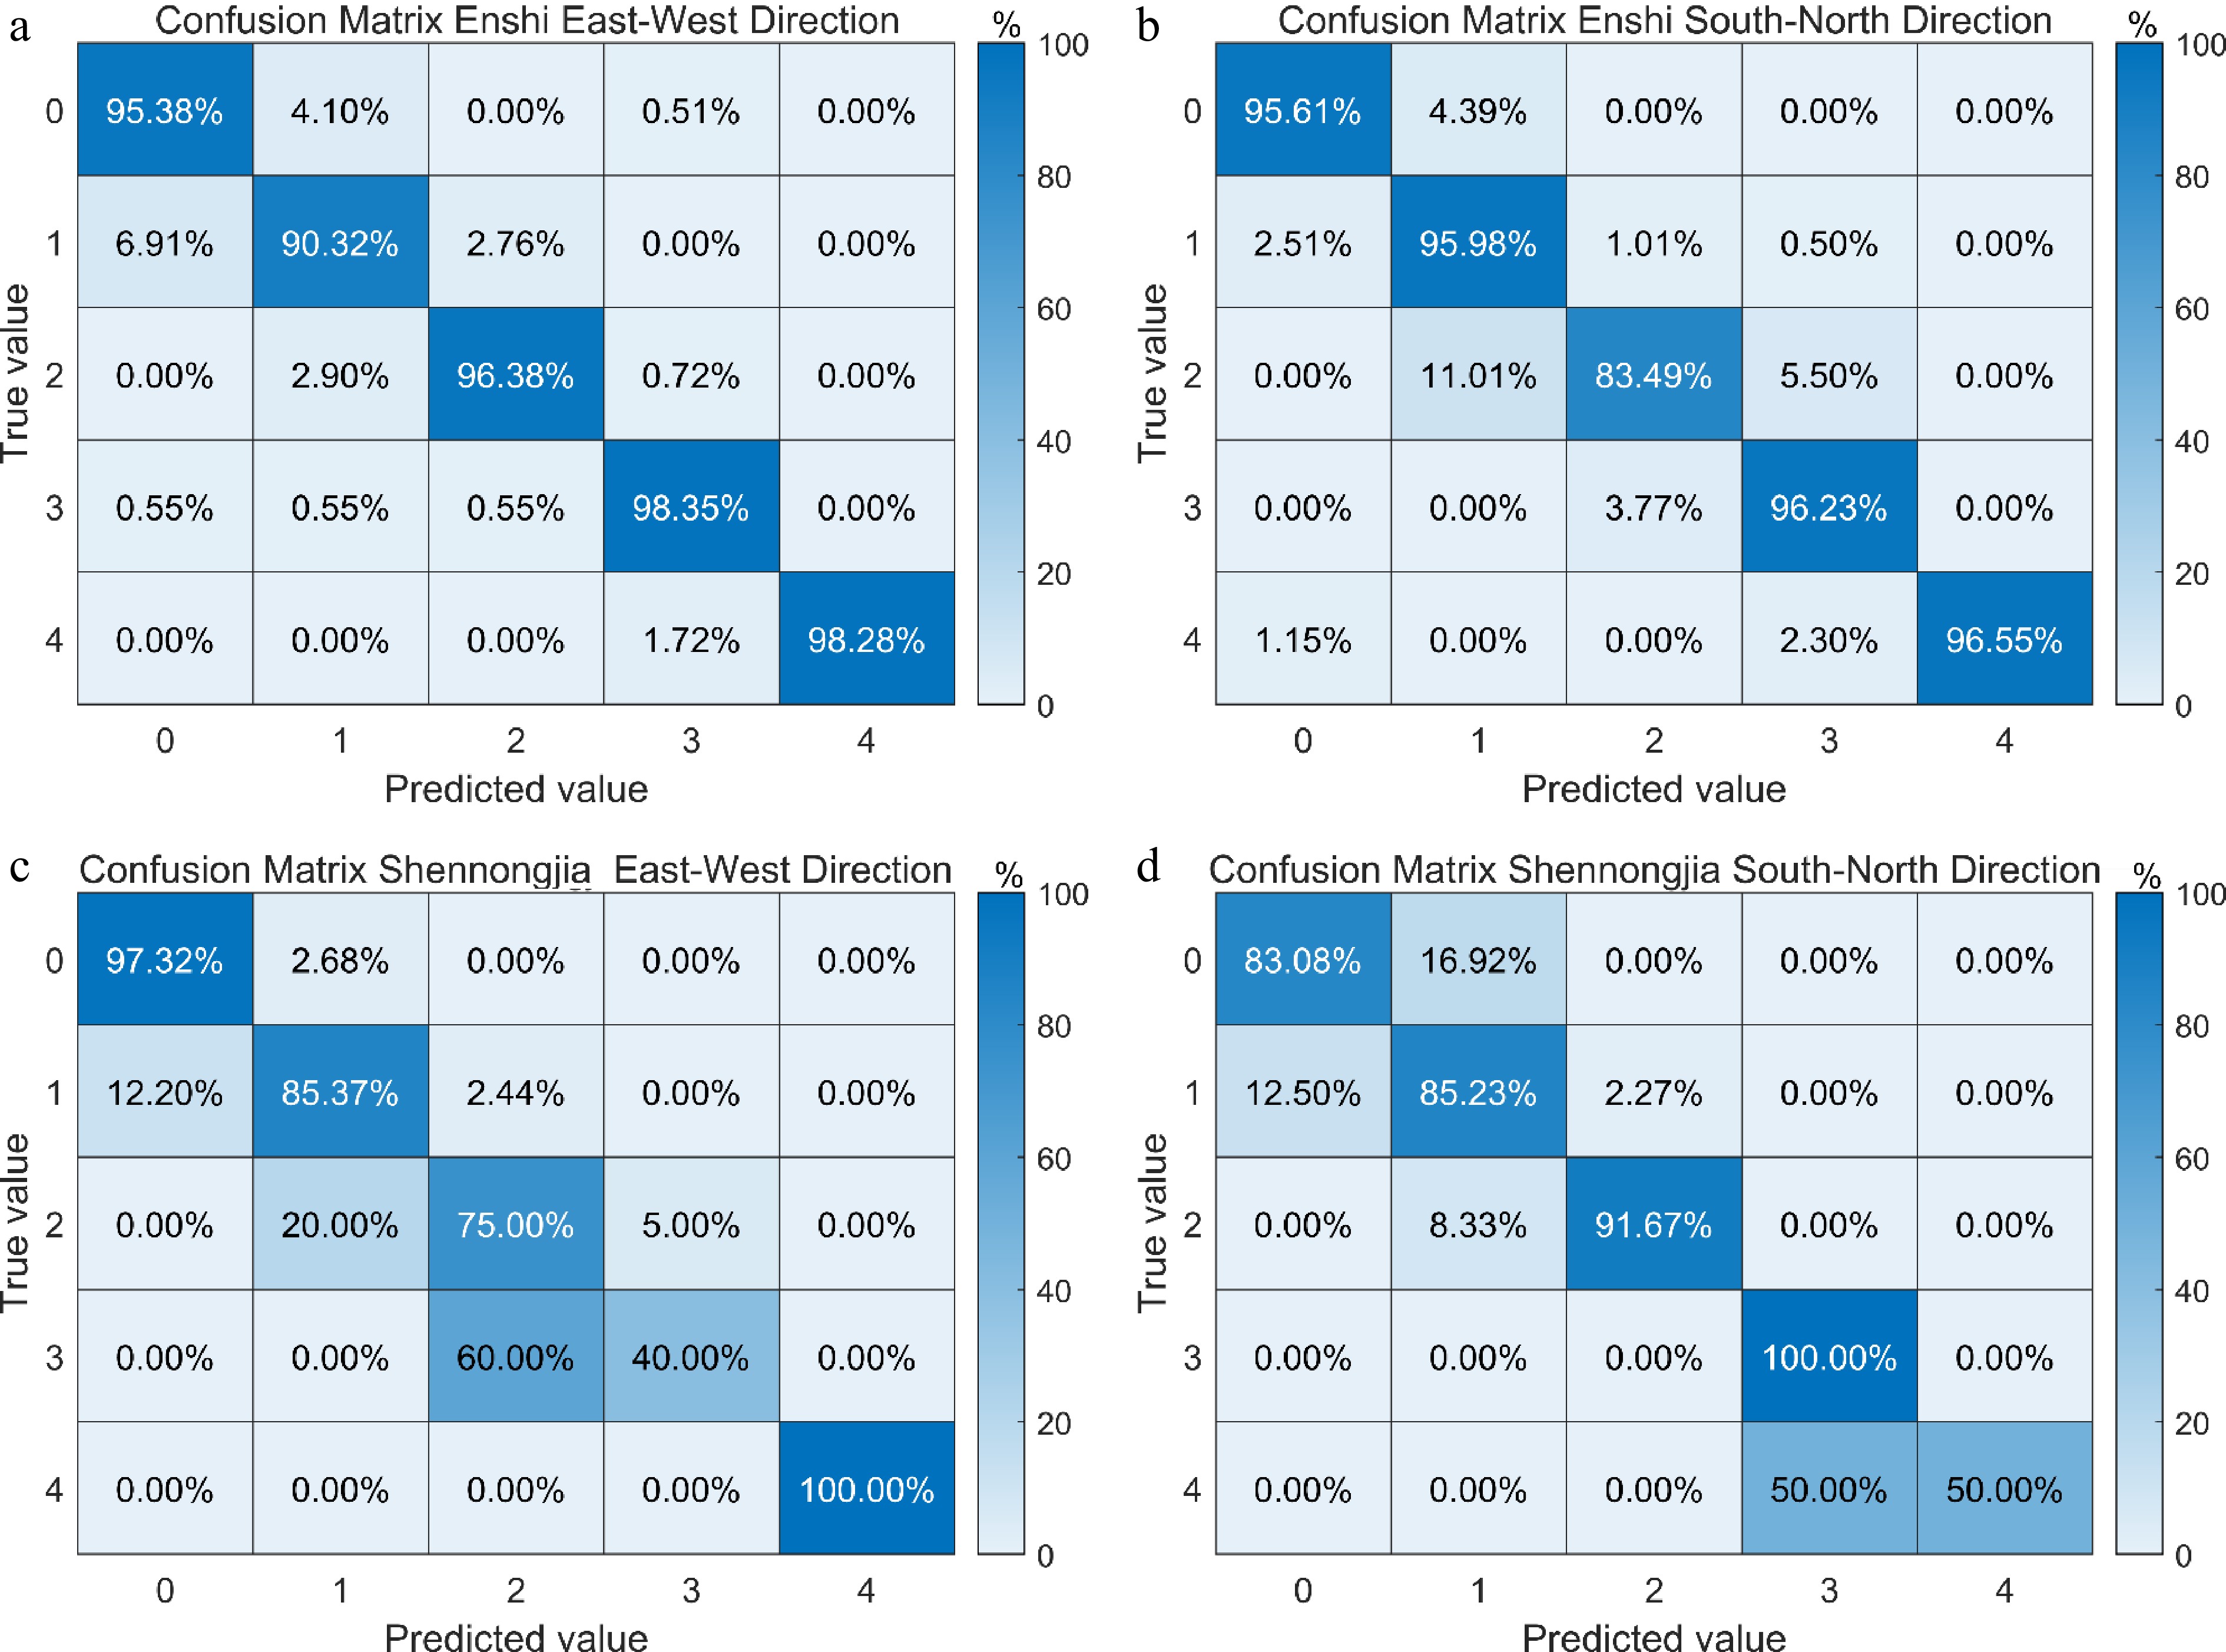
Figure 8.
Confusion matrices of the recognition accuracy for different wire icing risk levels using the ResNet34+ model in various regions and different directions of wires: (a) Enshi East-West direction, (b) Enshi North-South direction, (c) Shennongjia East-West direction, and (d) Shennongjia North-South direction.
-
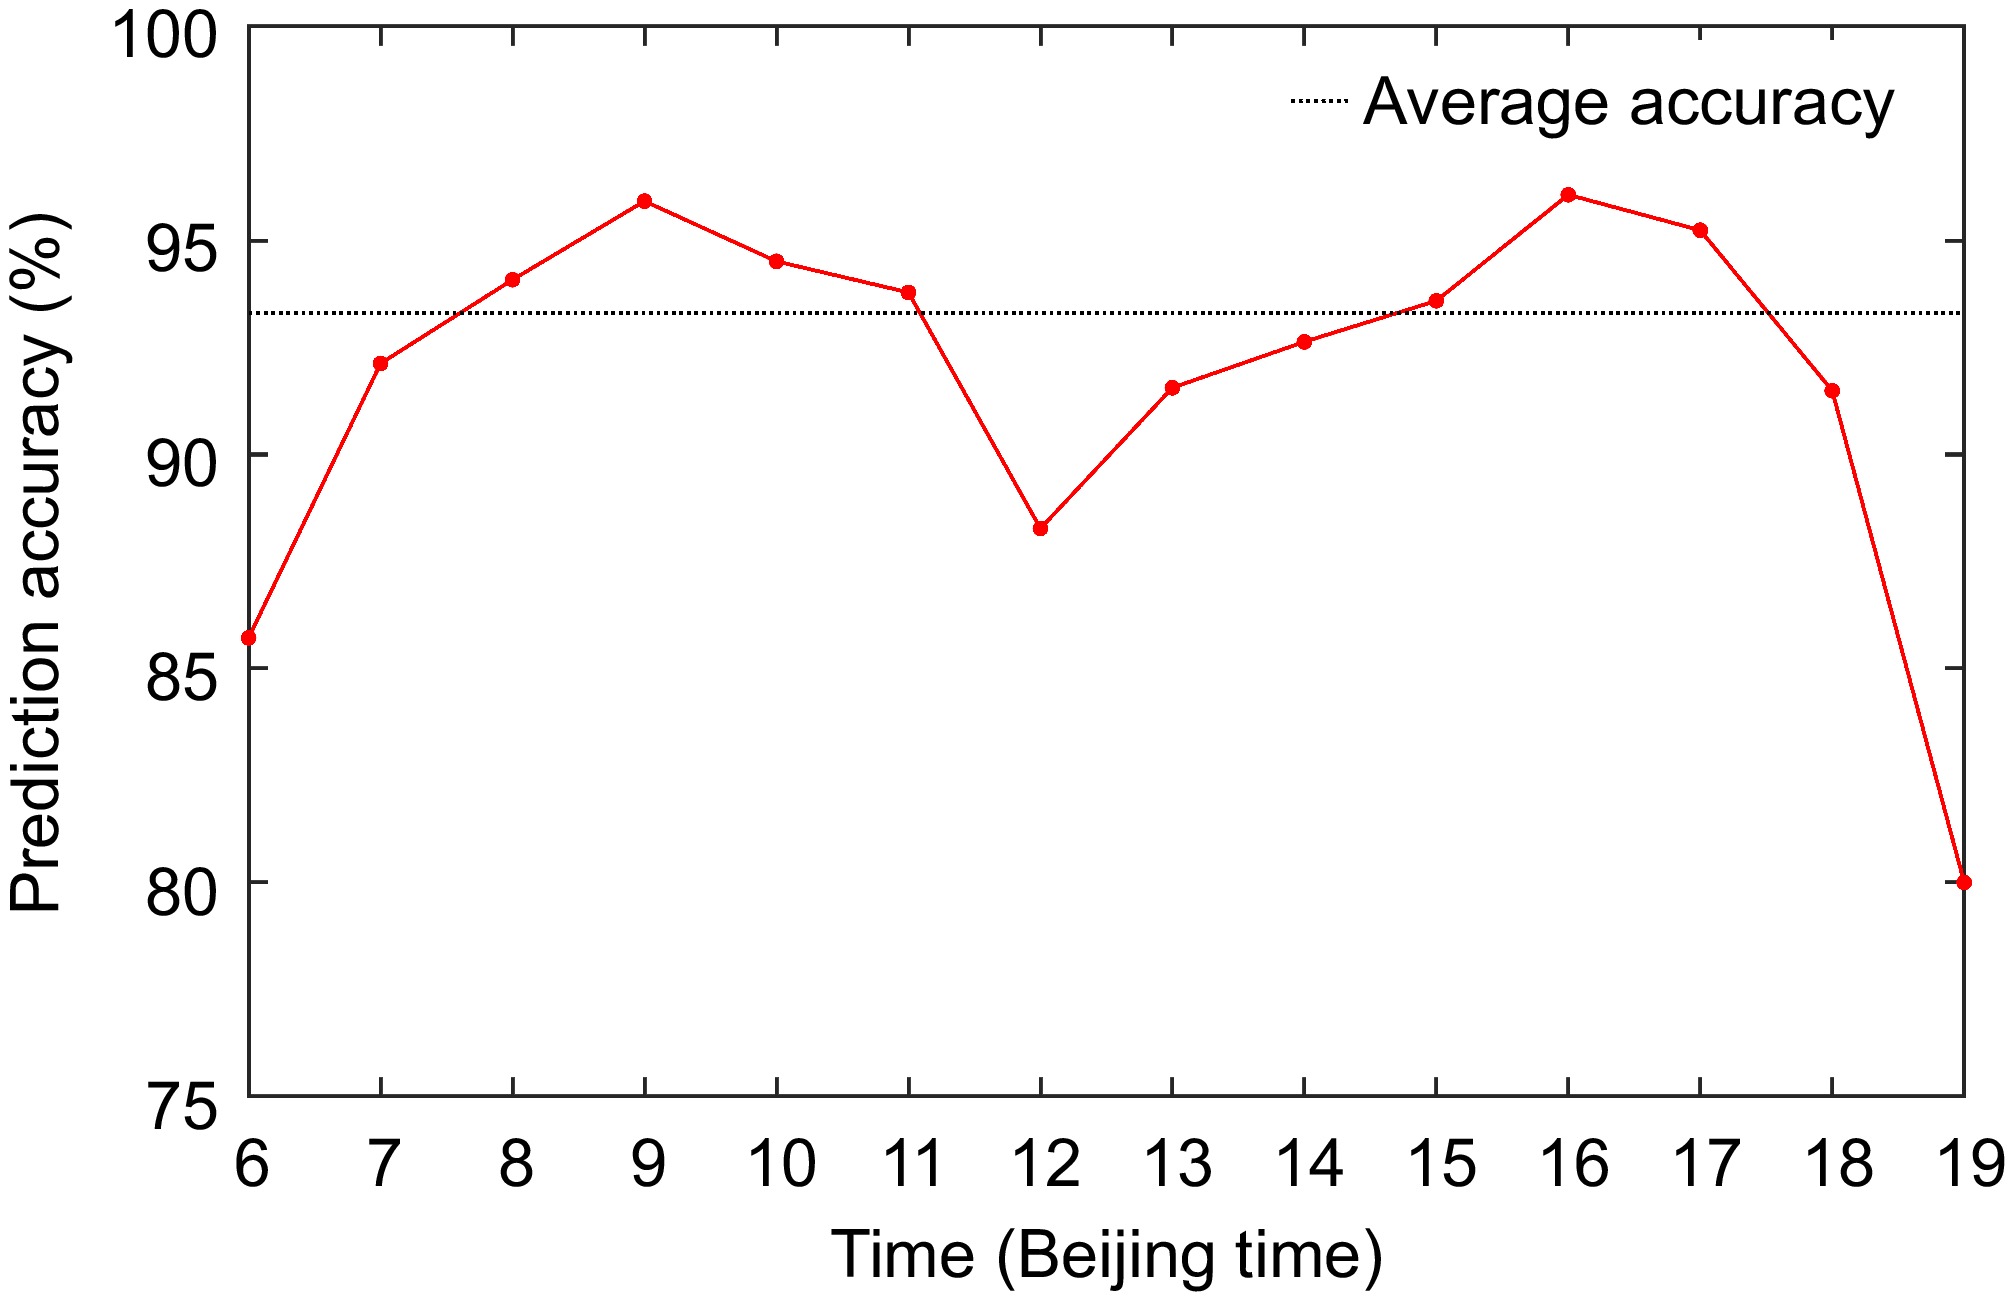
Figure 9.
The accuracy curves for different time intervals in wire icing risk level identification.
-
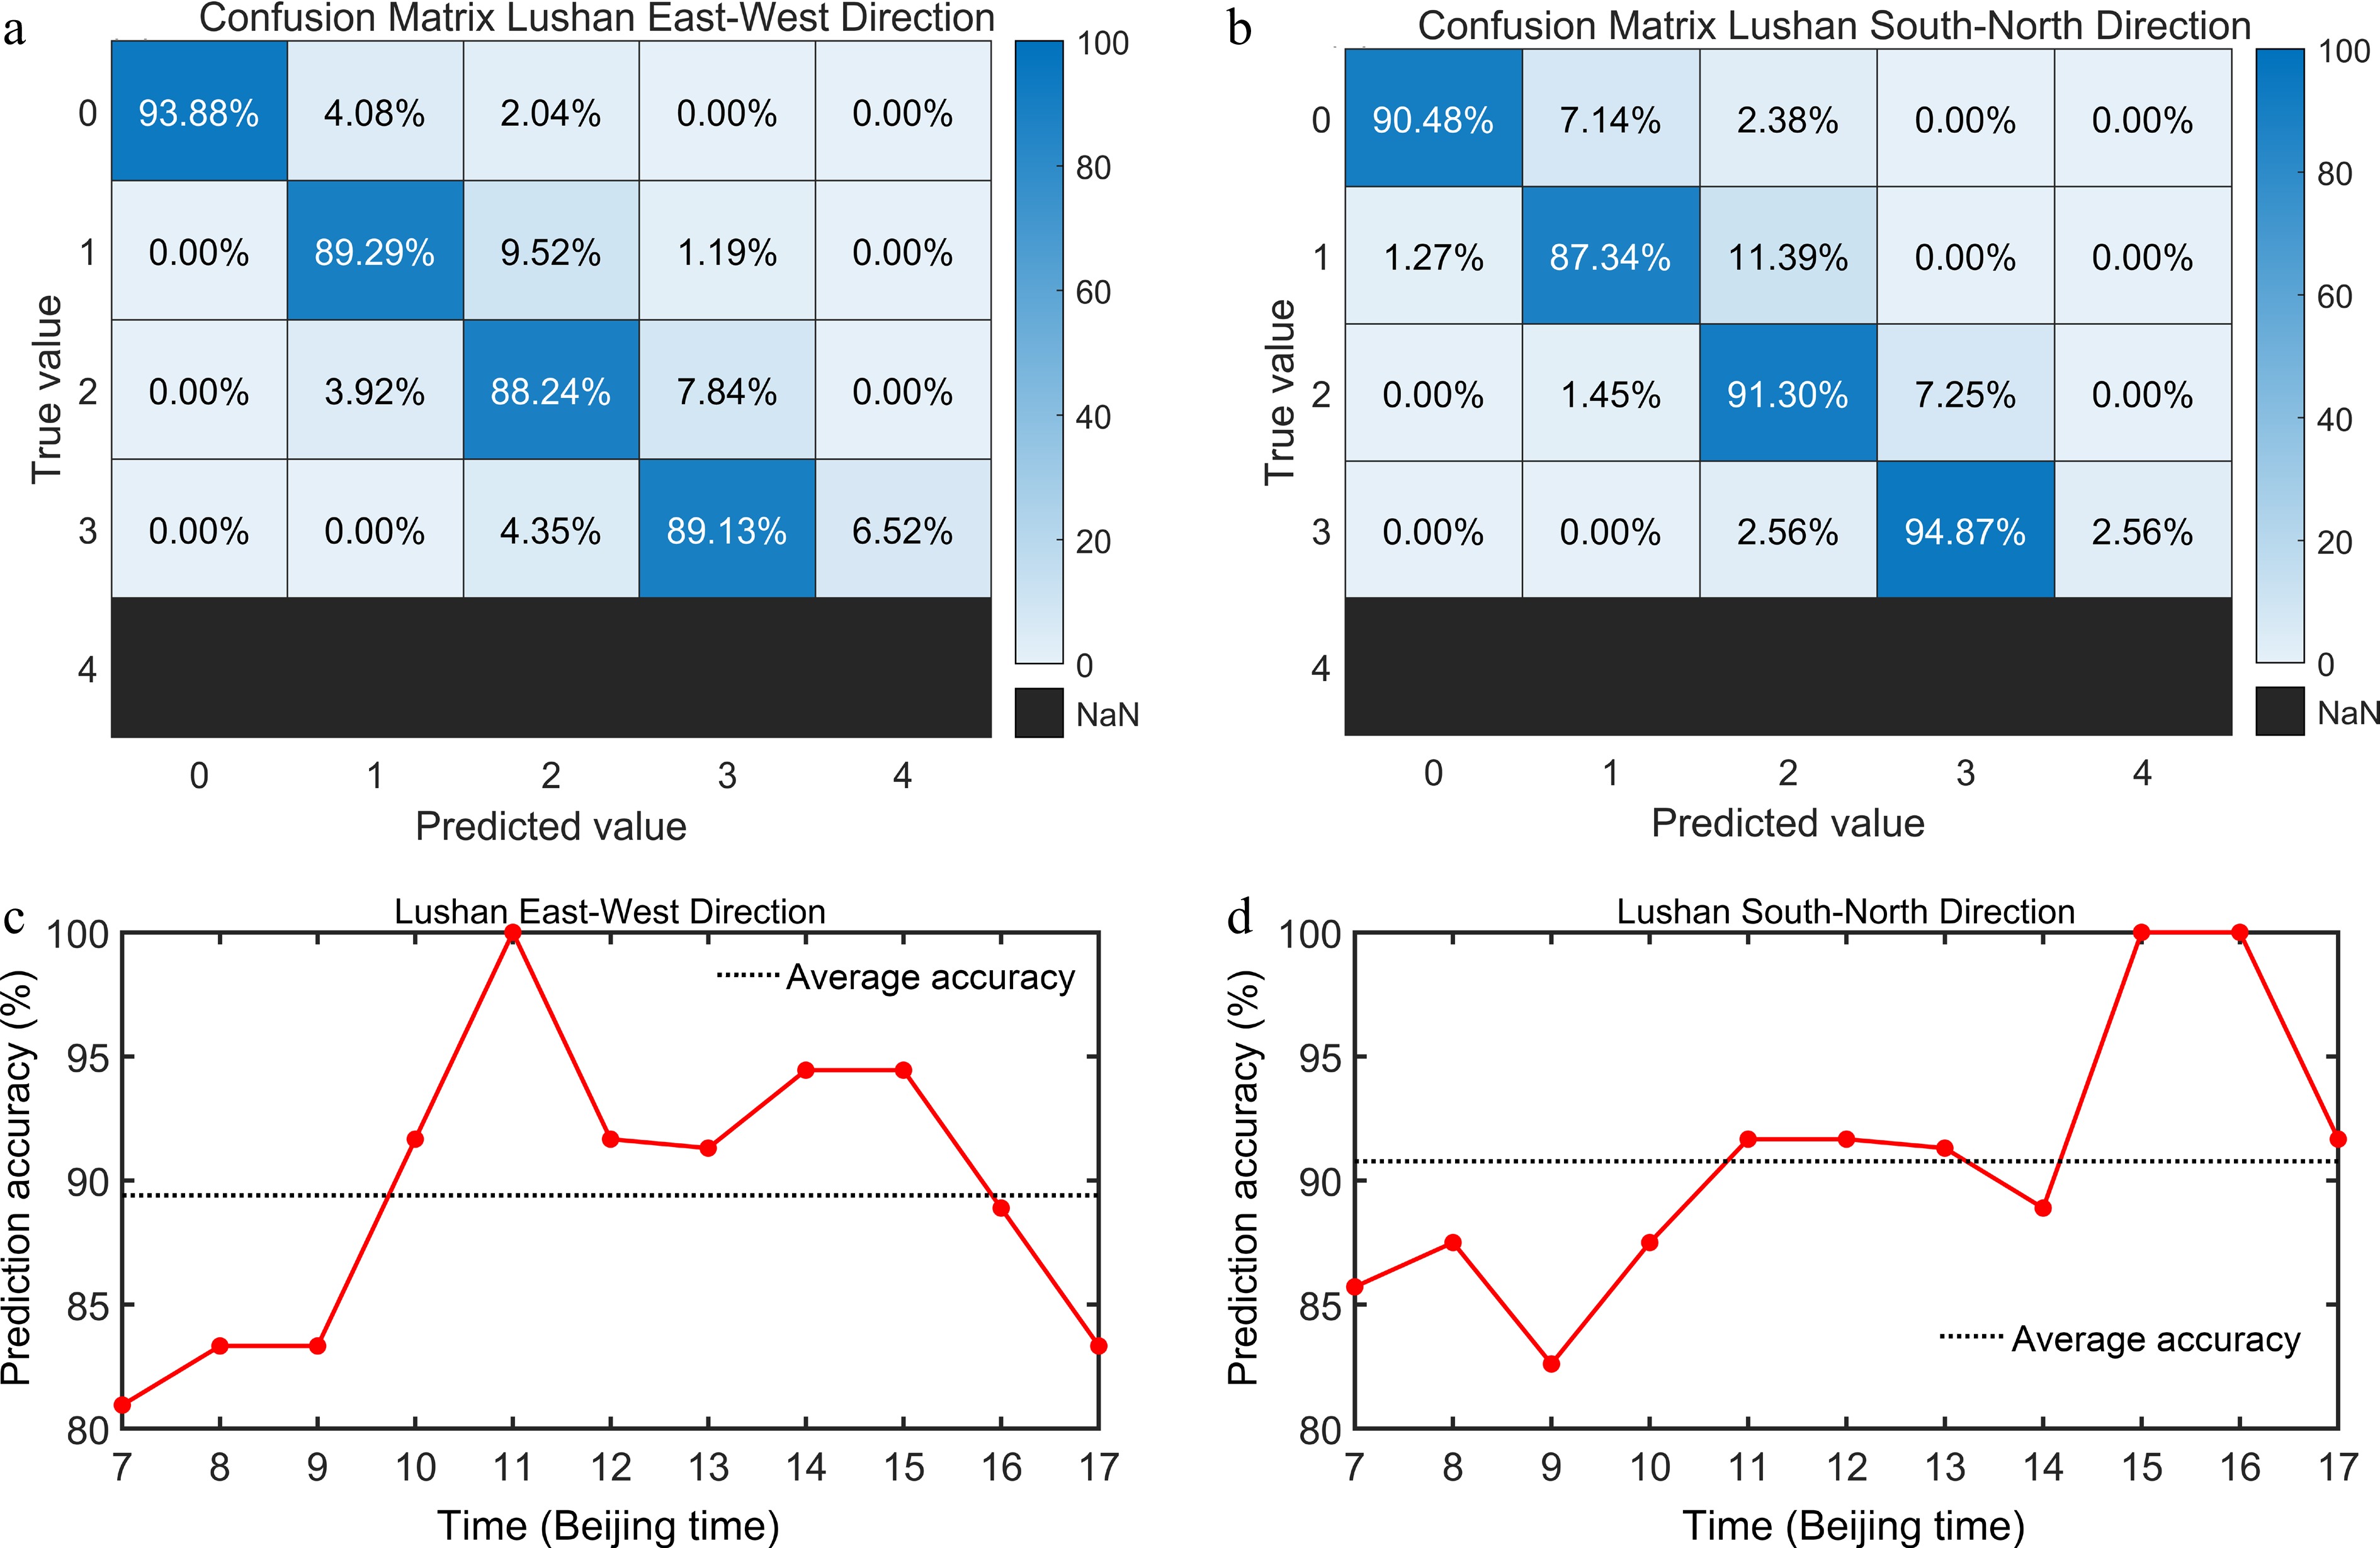
Figure 10.
Confusion matrices of the recognition accuracy for different wire icing risk levels using the ResNet34+ model in different directions of wires (a), (b) and the accuracy curves for different time intervals in ice accumulation risk level identification (c), (d) in Mount. Lu.
-
Model hyperparameters Specific values/algorithms Batch size 128 Max epochs 100 Patience 15 Learning rate 0.001 Random horizontal flip probability 0.3 Random rotation probability 0.3 Random rotation Angle range 30° Random image filtering probability 0.2 Optimizer Adam Dropout probability 0.2 Table 1.
Specific values or algorithms for adjusted model hyperparameters.
Figures
(10)
Tables
(1)