-
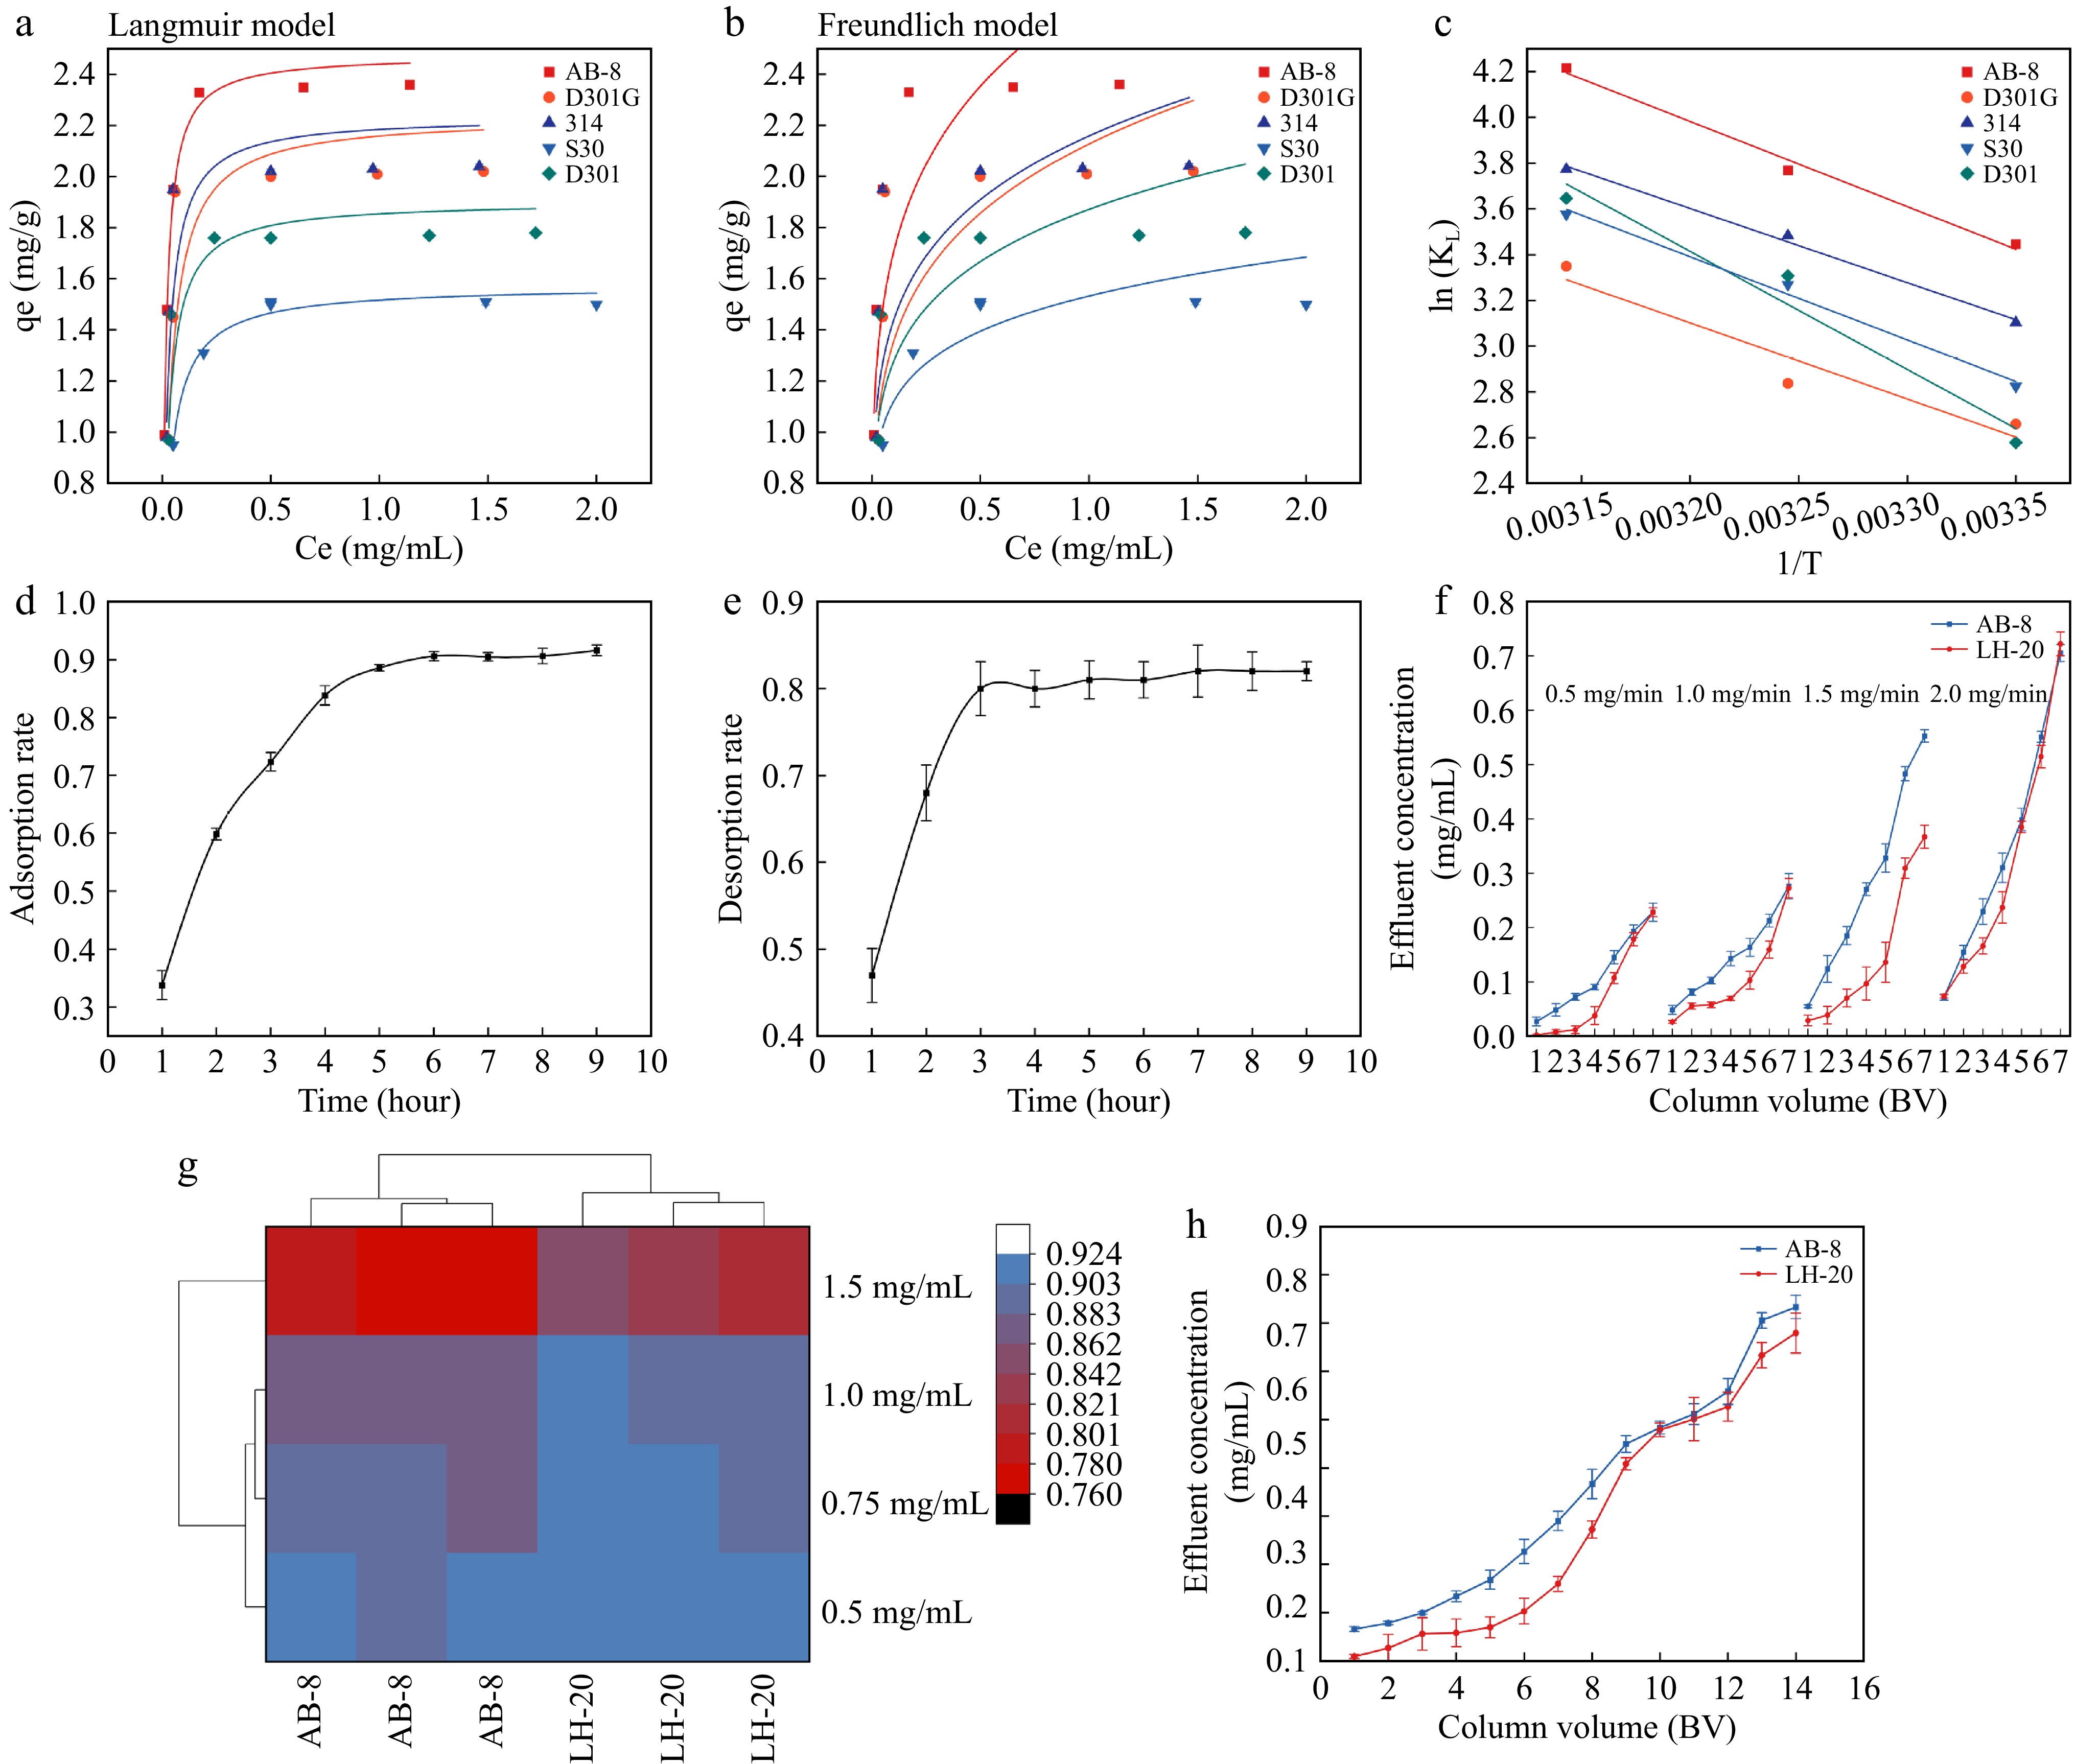
Figure 1.
Langmuir model and Freundlich model fitting and optimization of loading parameters. (a) Langmuir model fitting for PAs at 25 °C. (b) Freundlich model fitting for PAs at 25 °C. (c) Linear fitting of lnKL and 1/T. (d) Static adsorption curve of proanthocyanidins by AB-8 macroporous resin. (e) Static desorption curve of proanthocyanidins by AB-8 macroporous resin. (f) Influence of sample loading velocity on dynamic tannin adsorption efficiency under resin and gel loading chromatographic column. (g) Influence of sample concentration on dynamic tannin adsorption efficiency under resin and gel loading chromatographic column. (h) Dynamic tannin adsorption curve under resin and gel loading chromatographic column.
-
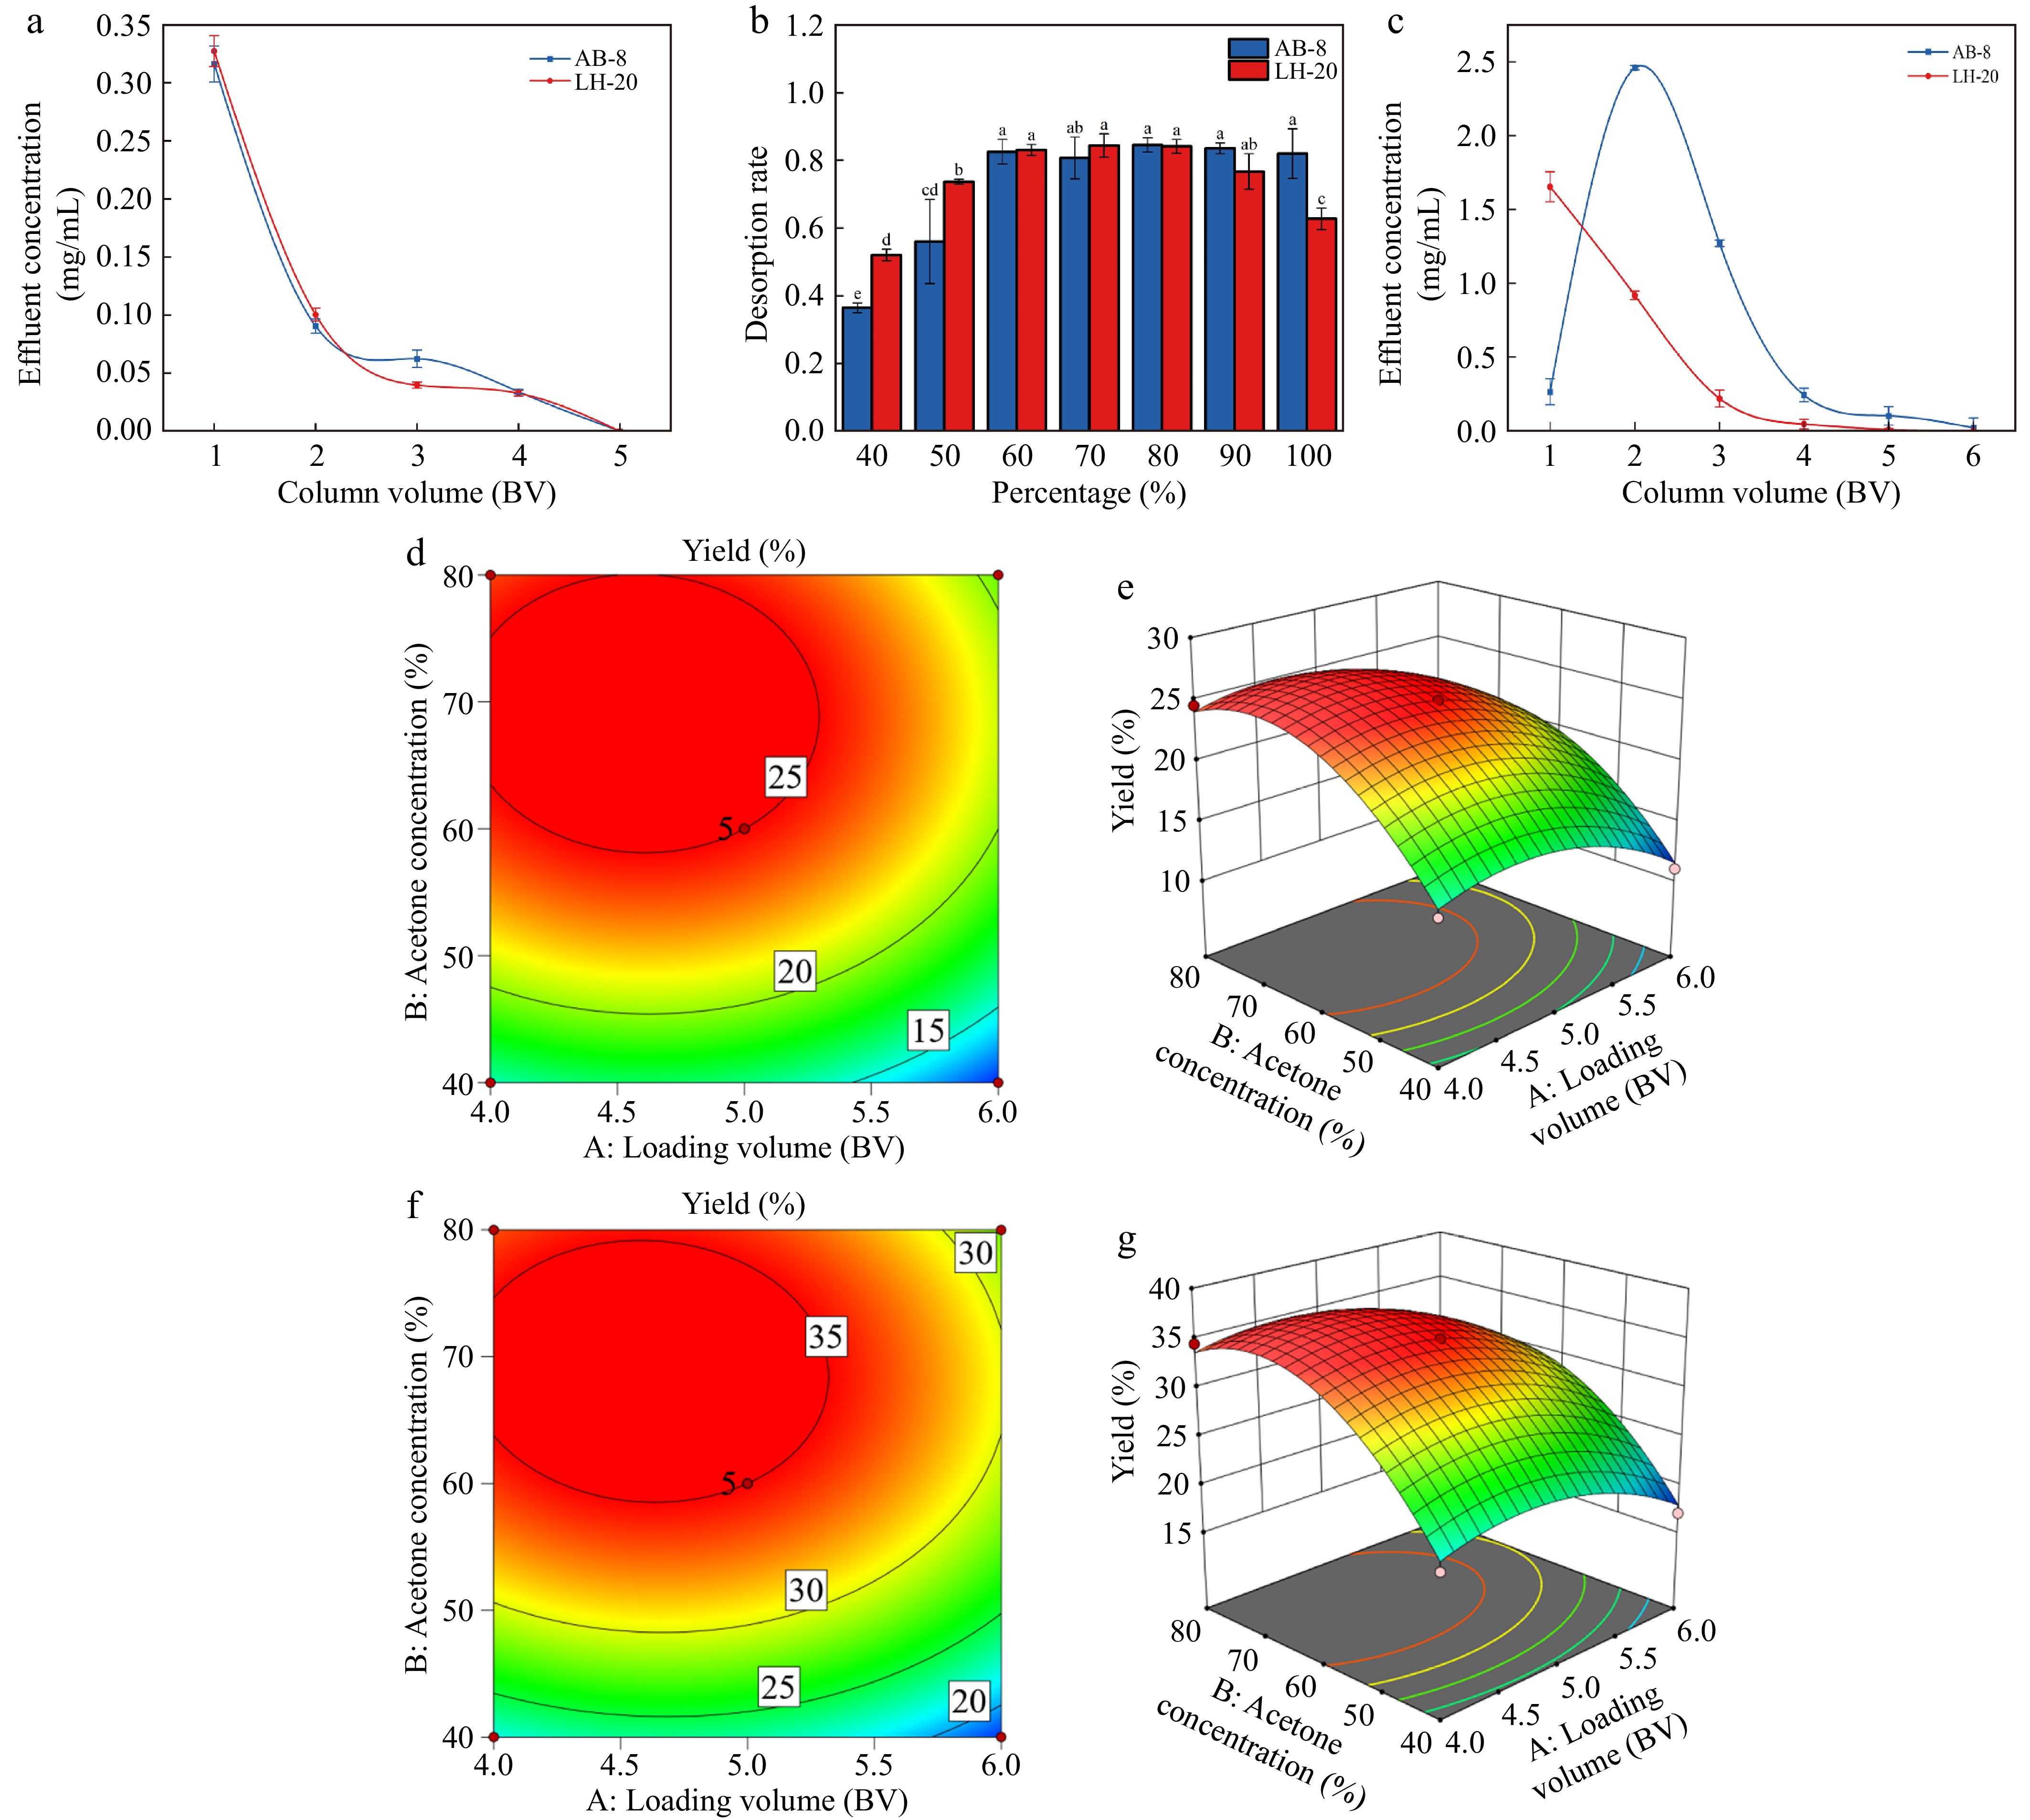
Figure 2.
Elution parameters and response surface optimization. (a) Influence of proanthocyanidins washing volume on filtrate concentration. (b) Influence of acetone volume fraction of eluent on desorption. (c) Influence of desorption amount on filtrate concentration. (d) 2D response surface plots of macroporous resin between Loading volume (BV) and Acetone concentration (%). (e) 3D response surface plots of macroporous resin between Loading volume (BV) and Acetone concentration (%). (f) 2D response surface plots of Sephadex LH-20 between Loading volume (BV) and Acetone concentration (%). (g) 3D response surface plots of Sephadex LH-20 between Loading volume (BV) and Acetone concentration (%).
-
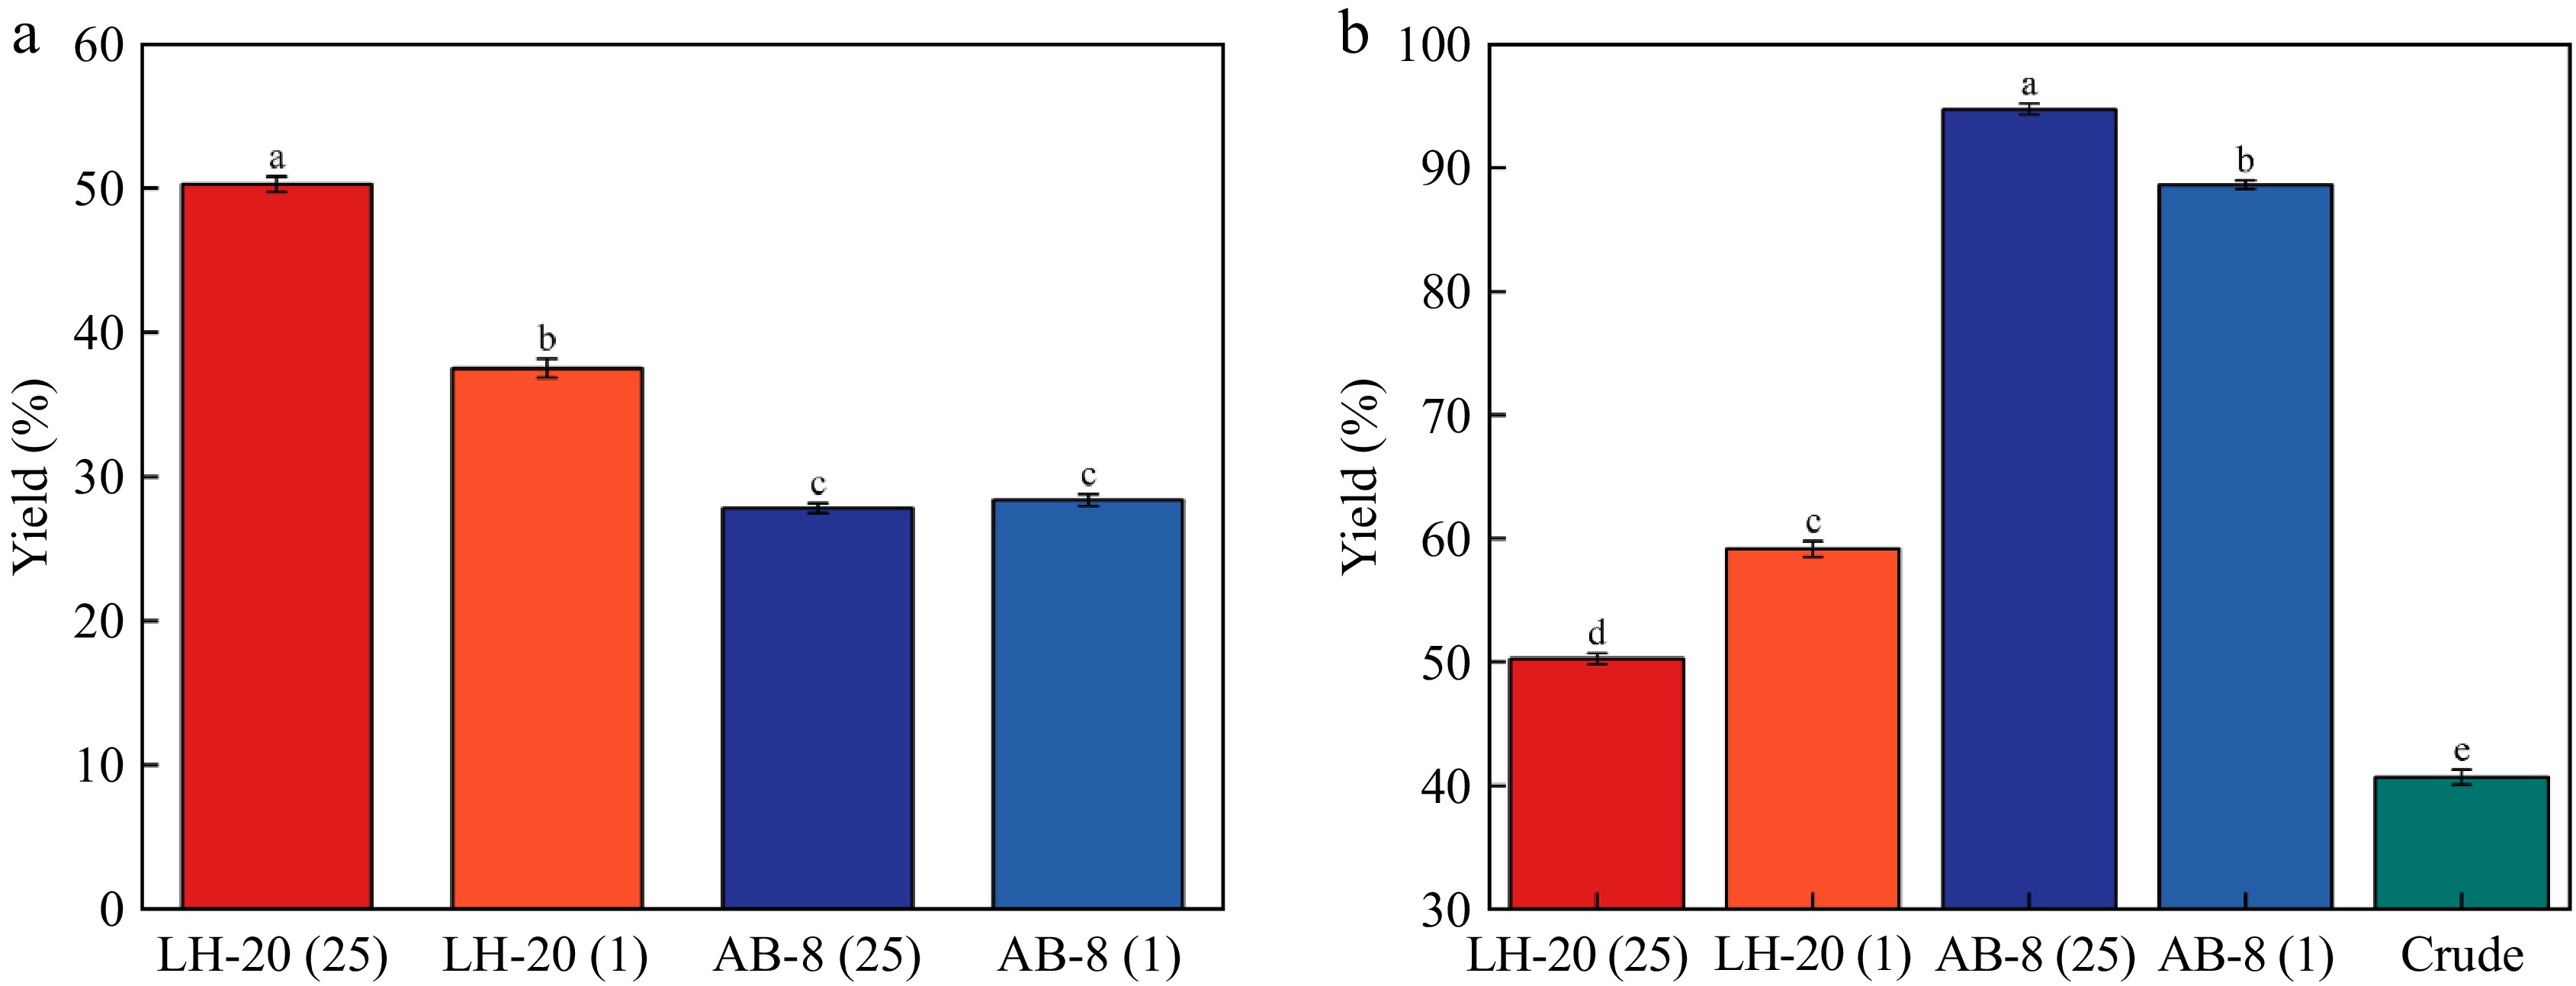
Figure 3.
Yield and purity of the test. (a) Verification of the yield of the experiment. (b) Verification of the purity of the experiment.
-
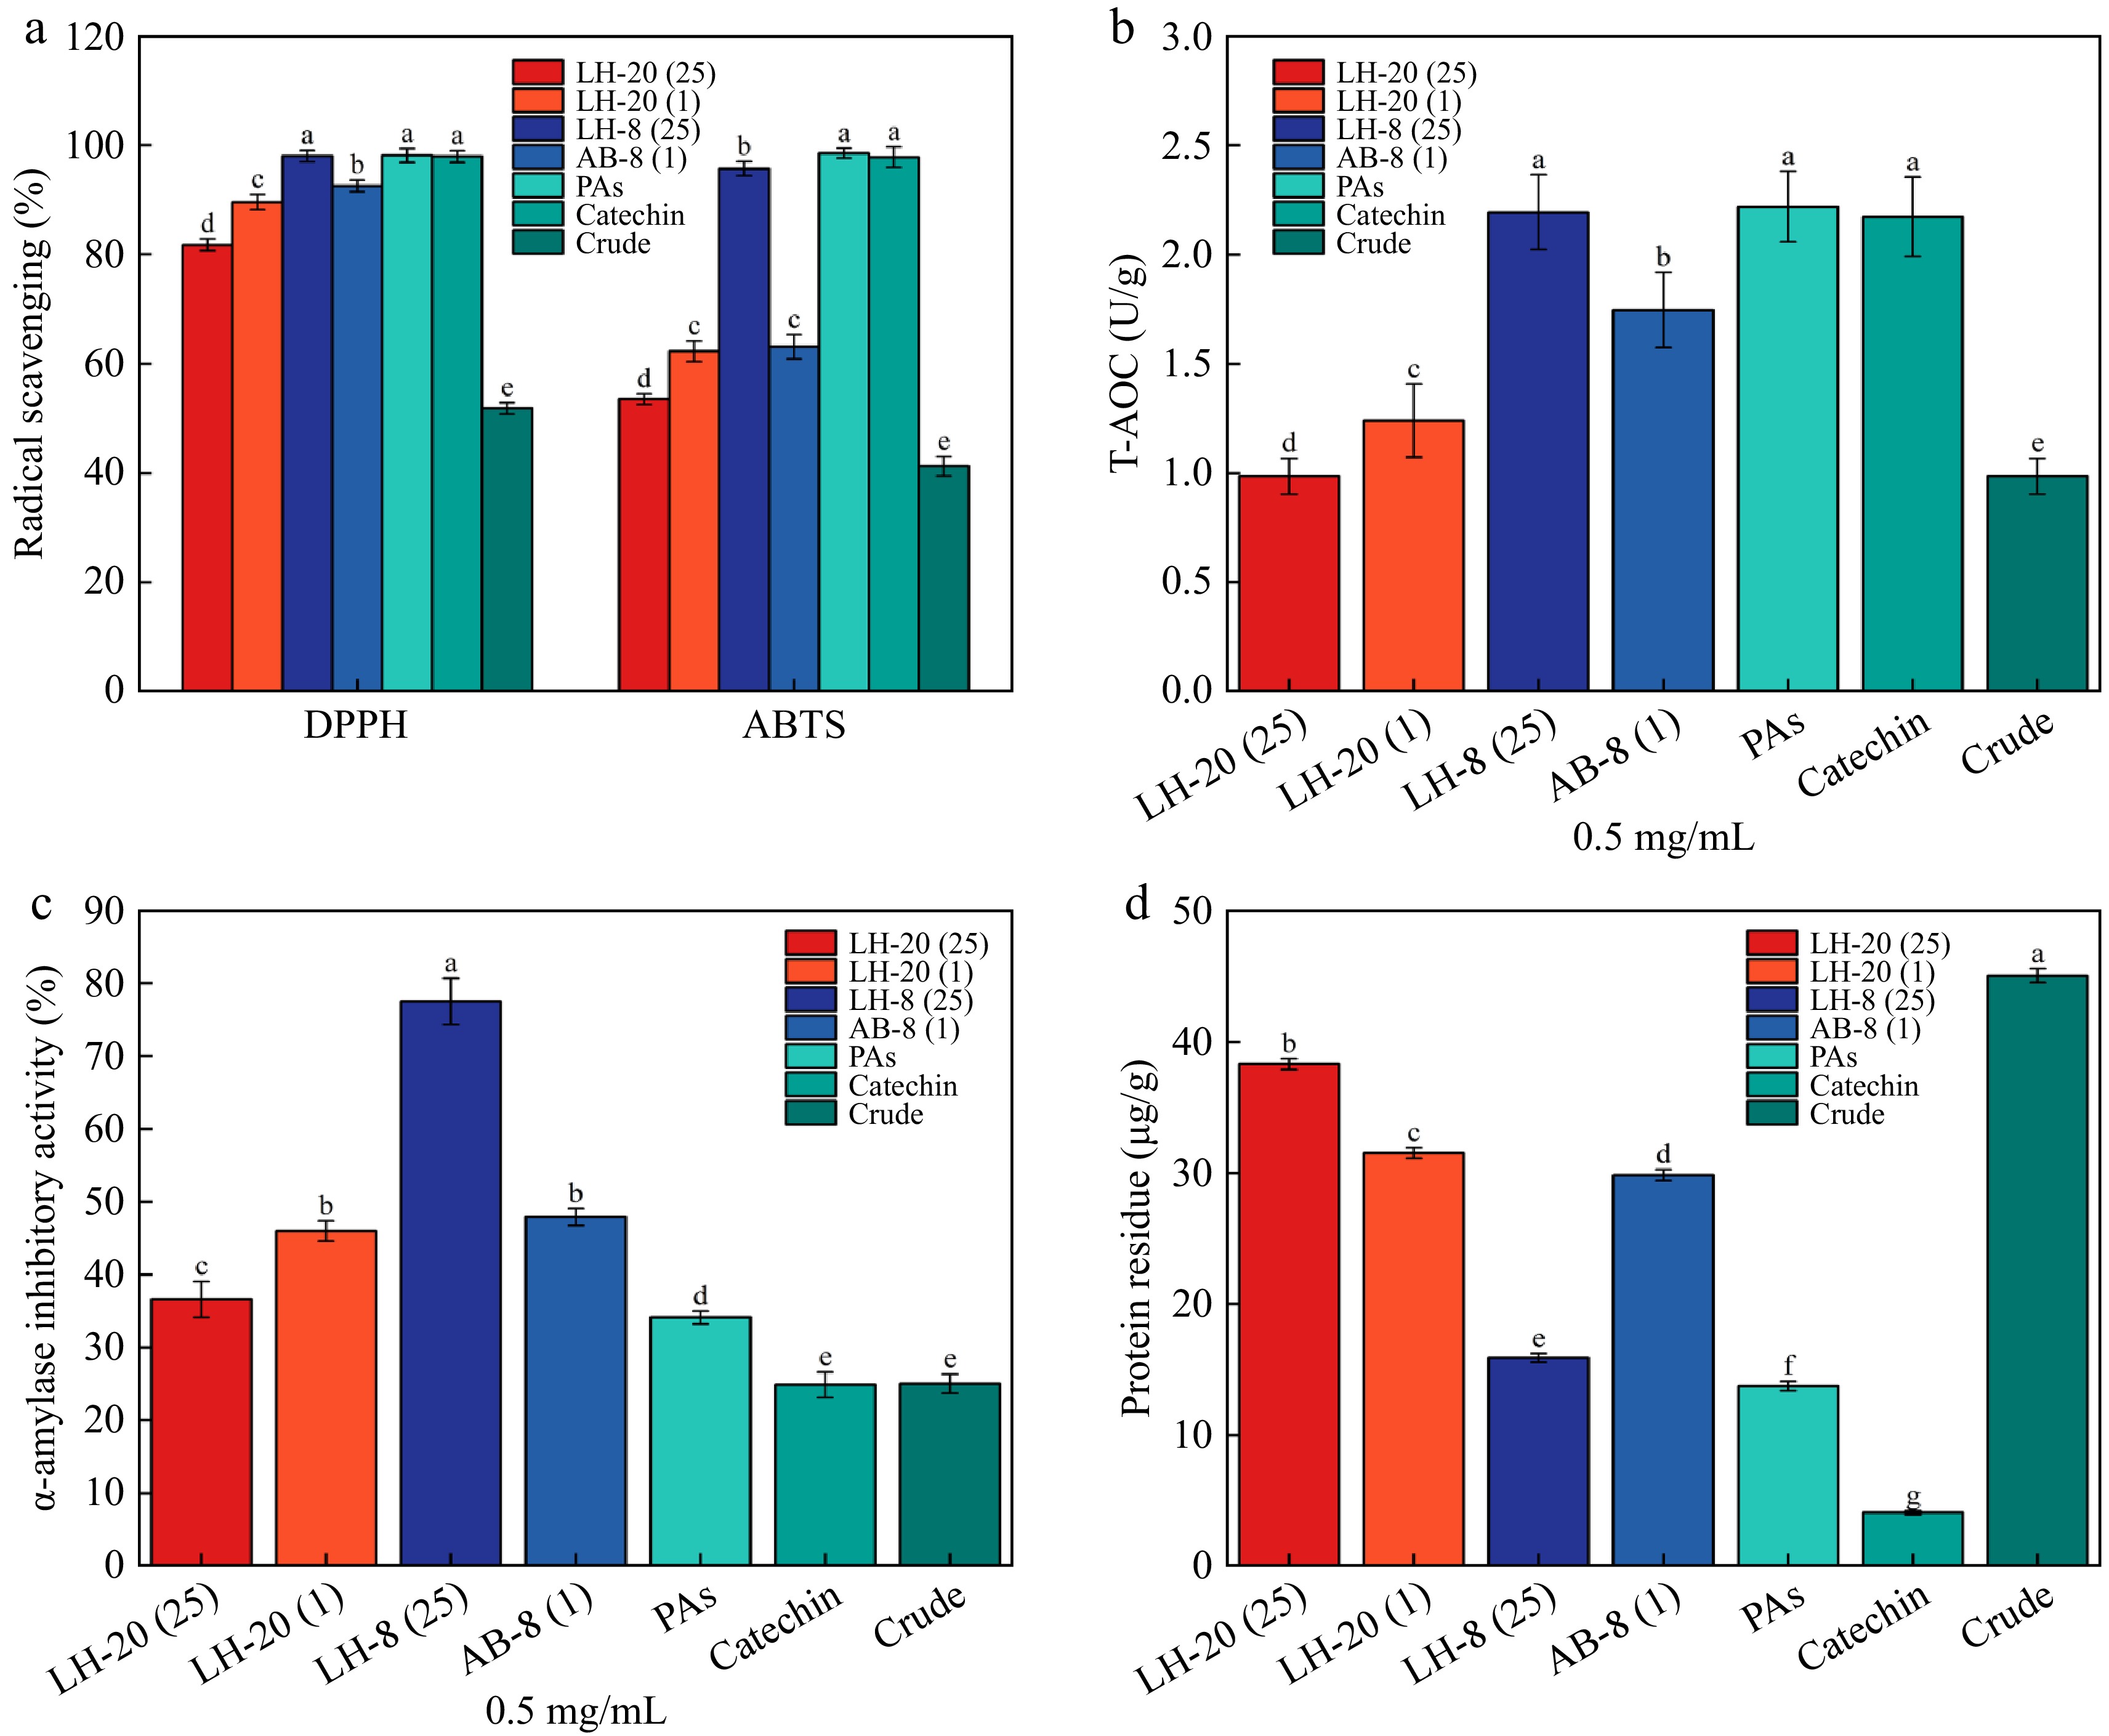
Figure 4.
(a) Scavenging rate of DPPH and ABTS free radicals from PAs. (b) T-AOC antioxidant level of PAs. (c) Inhibition rate of α-amylase from PAs. (d) Protein residue of PAs.
-
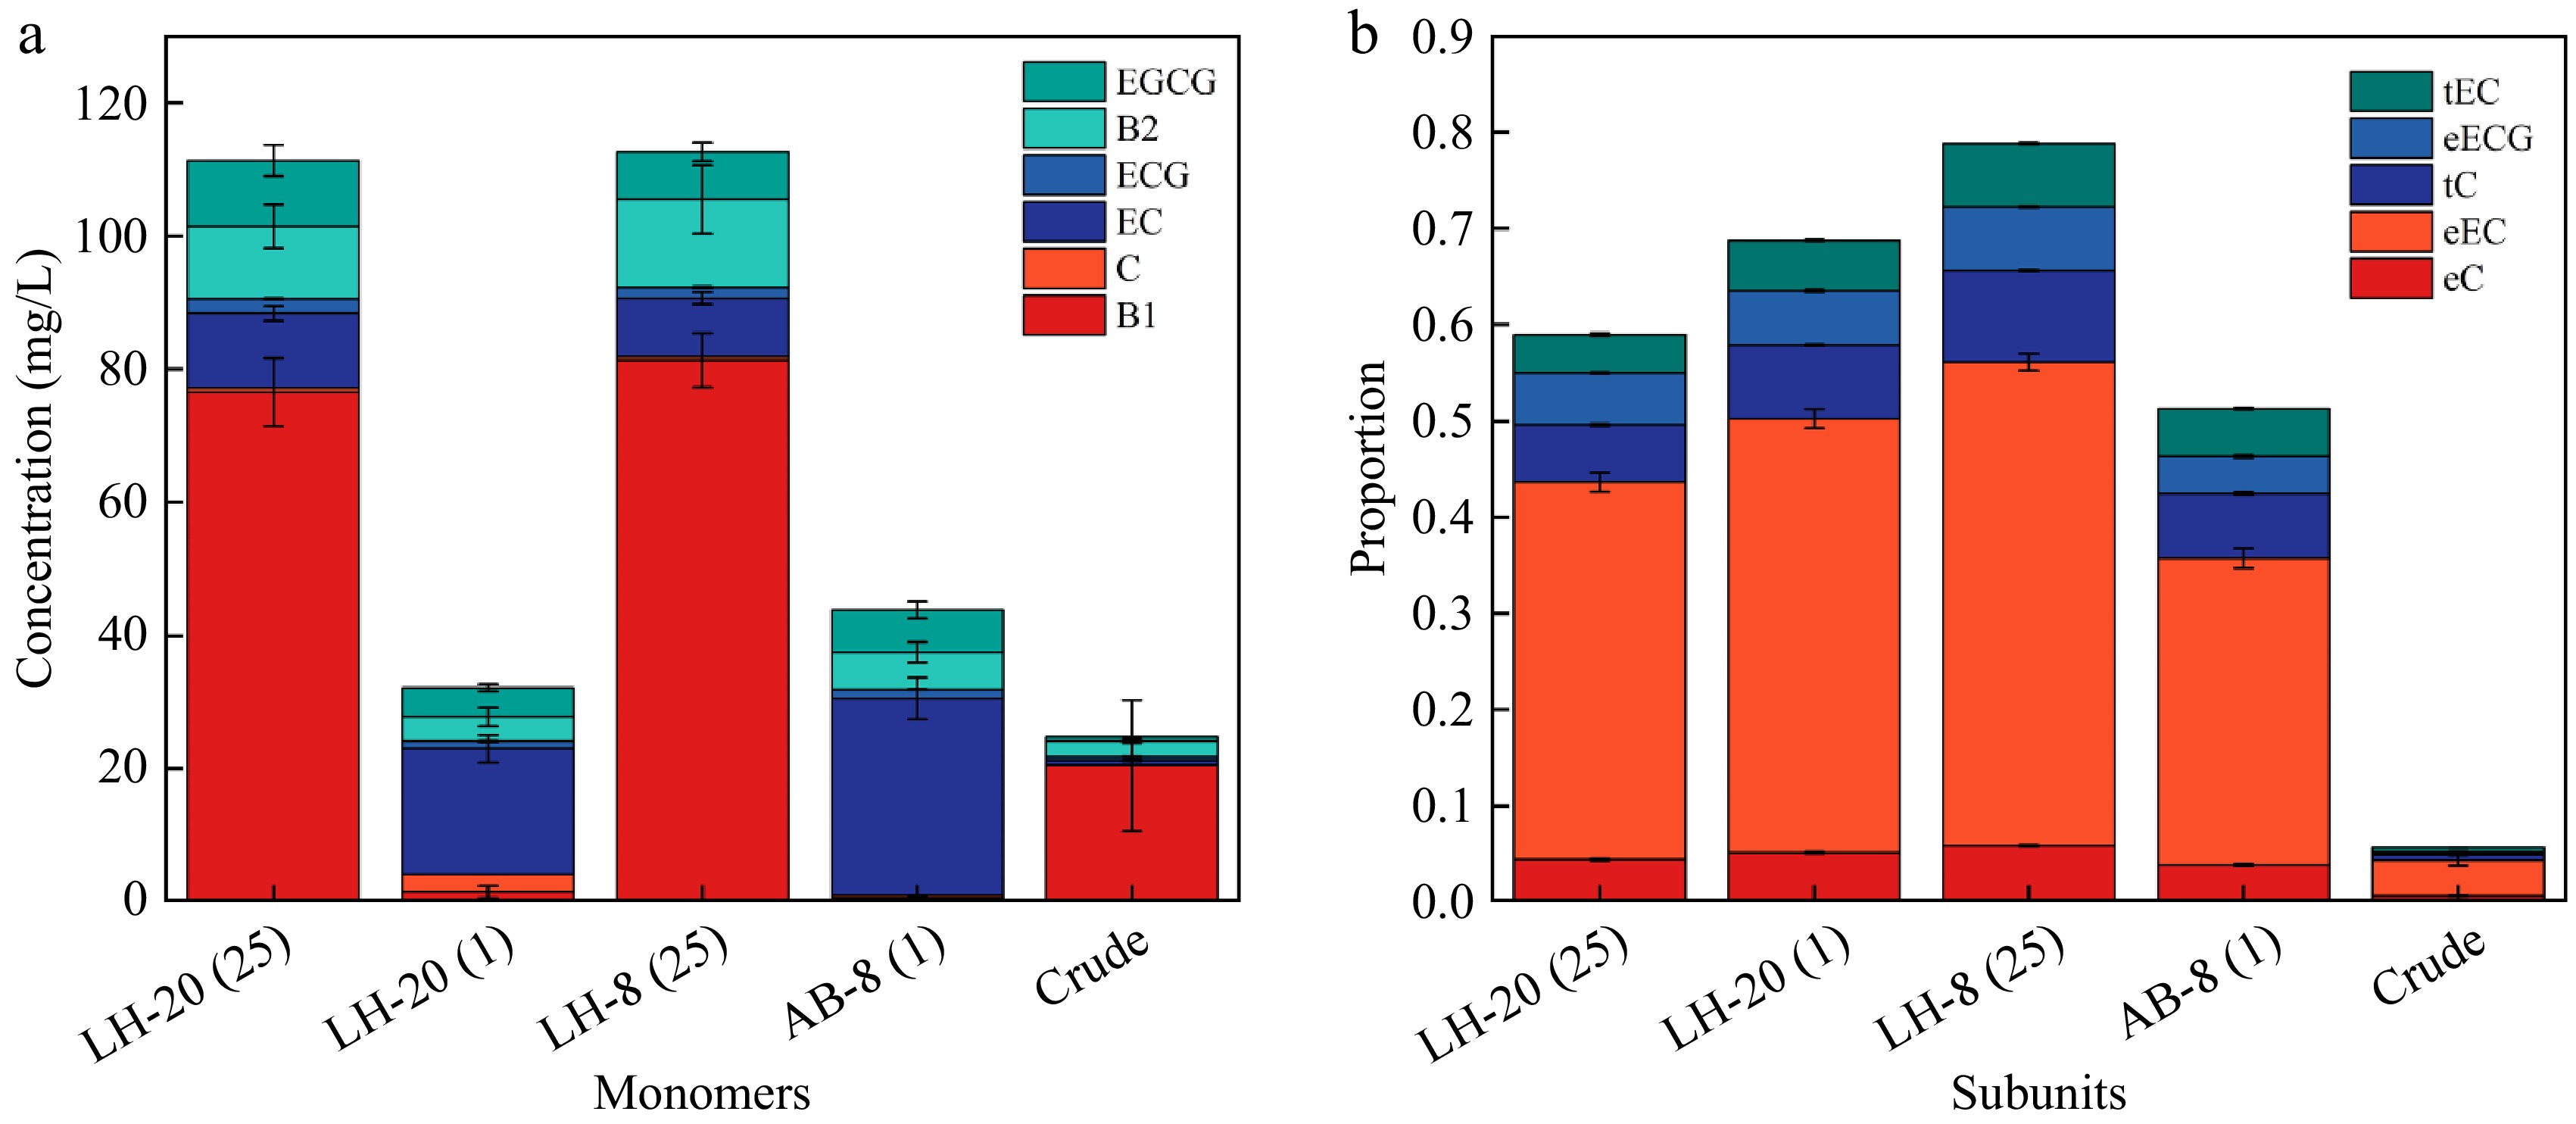
Figure 5.
(a) Monomer concentration of five proanthocyanidins. (b) Structural composition of five proanthocyanidins.
-
Resin type Adsorption capacity (mg/g) Adsorption rate (%) Desorption rate (%) AB-8 2.34 ± 0.01a 93.59 ± 1.39a 82.11 ± 1.07a D301G 2.00 ± 0.01b 80.37 ± 1.25b 68.80 ± 0.96b 314 2.03 ± 0.02b 81.45 ± 2.17b 25.32 ± 1.67c 330 1.50 ± 0.01d 60.06 ± 1.07c 55.11 ± 2.79d D301 1.76 ± 0.01c 70.35 ± 1.35d 29.86 ± 0.68d Different lowercase letters (a, b, c) indicate statistically significant differences between groups (p < 0.05, Tukey's HSD test). Table 1.
Adsorption and desorption rates of the five macroporous resins for PAs.
-
Resin type Temperature (°C/K) Langmuir equation Freundlich equation KL qm R2 KF n R2 AB-8 25/298.15 31.39 ± 5.4 2.43 ± 0.08 0.96 2.60 ± 0.33 4.34 ± 0.65 0.85 AB-8 35/308.15 43.38 ± 4.95 2.54 ± 0.17 0.95 2.64 ± 0.45 4.34 ± 1.23 0.76 AB-8 45/318.15 67.91 ± 3.38 2.47 ± 0.05 0.99 2.70 ± 0.42 5.00 ± 0.84 0.79 D301G 25/298.15 14.28 ± 5.16 2.18 ± 0.35 0.77 1.96 ± 0.38 4.34 ± 1.00 0.58 D301G 35/308.15 17.06 ± 6.51 2.22 ± 0.38 0.75 2.04 ± 0.41 4.54 ± 1.10 0.57 D301G 45/318.15 28.50 ± 8.93 2.23 ± 0.31 0.77 2.12 ± 0.41 5.09 ± 1.09 0.61 314 25/298.15 22.25 ± 9.81 2.04 ± 0.17 0.72 1.96 ± 0.40 4.17 ± 1.05 0.56 314 35/308.15 32.56 ± 9.29 2.21 ± 0.40 0.71 2.06 ± 0.44 5.00±1.30 0.55 314 45/318.15 43.55 ± 12.11 2.23 ± 0.27 0.81 2.15 ± 0.42 5.55 ± 1.01 0.62 330 25/298.15 16.85 ± 2.26 1.44 ± 0.05 0.95 1.34 ± 0.09 6.25 ± 1.05 0.80 330 35/308.15 26.31 ± 2.41 1.44 ± 0.04 0.97 1.39 ± 0.08 7.14 ± 0.82 0.84 330 45/318.15 35.78 ± 14.51 1.57 ± 0.05 0.99 1.53 ± 0.22 7.69 ± 2.14 0.53 D301 25/298.15 13.17 ± 5.45 1.79 ± 0.28 0.69 1.62 ± 0.25 5.01 ± 1.30 0.59 D301 35/308.15 27.32 ± 9.92 1.74 ± 0.22 0.73 1.67 ± 0.24 6.25 ± 1.25 0.62 D301 45/318.15 38.33 ± 10.26 1.90 ± 0.19 0.80 1.87 ± 0.27 6.25 ± 1.25 0.68 Table 2.
Thermodynamic parameters for PA adsorption on resin at 25, 35, and 45 °C.
-
Sample Total molar concentration (%) % G Total monomer concentration (mmol/L) mDP LH-20 (25) 0.62 ± 0.014c 9.13 ± 0.128a 112.40 ± 0.198a 5.56 ± 0.085a LH-20 (1) 0.72 ± 0.004b 8.16 ± 0.223b 34.95 ± 0.392c 4.97 ± 0.123b AB-8 (25) 0.81 ± 0.010a 8.38 ± 0.230b 113.98 ± 0.064a 4.70 ± 0.051c AB-8 (1) 0.54 ± 0.018d 7.55 ± 0.031c 48.20 ± 0.113b 4.23 ± 0.067d mDP is the average degree of polymerization; % G is galloylation percentage. Different lowercase letters (a, b, c) indicate statistically significant differences between groups (p < 0.05, Tukey's HSD test) Table 3.
Comparison of polymerization degree of four pure products.
Figures
(5)
Tables
(3)