


-
The by-products obtained following wine production, seeds, and pomace, constitute a cheap source for extracting antioxidant compounds, providing significant economic advantages[1]. Grape seed extract PA content is very high, up to approximately 30%; the raw material cost is very low, and it is easy to obtain as a by-product of wine-making, which is the most significant source of PAs[2]. The extractive residue contains free and bound PAs, which can be extracted and purified for use as nutrients[3]. Grape seed PAs can act as protective agents against cancer, prevent colorectal cancer, inhibit skin cancer development, and deter the growth of xenogenic tumors of prostate cancer cells PC3 in vivo, essential for reducing fat accumulation and alleviating inflammation and oxidative stress[4].
The main purification methods of PAs include chromatography[5], membrane separation[6], and supercritical fluid extraction[7]. However, these methods have some drawbacks, including a long production cycle and high costs[8], which make them unsuitable for use on an industrial scale[9−11]. Macroporous resin is a polymer with pores and a large surface area[12], providing a high adsorption capacity for organic molecules. They can selectively adsorb target components from both aqueous and non-aqueous systems by electrostatic force, hydrogen bond interactions, complexation, and particle size screening[13,14]. Adsorption is the process of absorbing fluid components (adsorbates) by selectively transferring these components to the surface of an adsorbent solid (adsorbent) so that separation occurs. The mass transfer mechanism in the adsorption process generally goes through several stages. The first is the mass transfer of adsorbate from the solute to the outer surface of the adsorbent through the film layer, then the intraparticle mass transfer through the pores, and the last is the mass transfer of the adsorbate from the pores to the pore surface (adsorption)[15,16]. AB-8 macroporous resin is often used to purify PAs, flavonoids, and maltooligosaccharide. The Sephadex LH-20 is a derivative of Sephadex G-25. Sephadex LH-20 introduced hydroxypropyl and hydroxypropyl ether groups, which increased their solubility and stability in organic solvents, enabling them to be used in gel permeation chromatography in organic solvents[17−19]. It is widely used to separate the PAs with different polymerization degrees and separate small phytochemical compounds, and is also commonly used to prepare anthocyanin from blueberry and antioxidants from vine tea[20,21]. However, the comparative purification of proanthocyanidins by macroporous resins and crosslinked dextran gel are limited.
In this study, the adsorption properties of macroporous resin and the Sephadex LH-20 on grape seed PAs were investigated. The adsorption isotherm was analyzed by using the Langmuir and Freundlich equations, and the adsorption mechanism was expounded. The purification parameters were optimized through static and dynamic adsorption and desorption experiments. The composition and content of the purified products were analyzed using high-performance liquid chromatography, and the antioxidant activity was determined using photo chemiluminescence and oxygen radical absorption capacity. This study aimed to provide data for the purification of grape seed PAs from wine waste using macroporous resins and Sephadex LH-20. The antioxidation of anthocyanins before and after purification was compared. It provides reference for the purification of grape seed PAs.
-
All materials were of analytical grade and supplied by SolarBio (Shaanxi, Xi'an, China), unless the contrary was indicated. Grape skins were supplied by (Pernod Ricard Wine Brewing Co., Ltd, Ningxia, China) in 2021. The glass protein separation column (outer diameter 10 × 300 mm) was supplied by (Beijing Jinding Biological Company, Beijing, China). Sephadex LH-20 was obtained from General Electric Company (Boston, MA, USA). Double-distilled water was used throughout the study.
Extraction process
-
The grape peel residue was obtained from Bulgarica Winery in Ningxia, China. The grape seeds were picked out from grape skins, washed and dried naturally, and sieved through a 5-mesh screen (particle diameter ≈ 4 mm) to remove larger impurities. The grape seed powder was weighed in a beaker, added with n-hexane (1 g : 3 mL), soaked for 48 h at 25 °C, and stirred using a glass rod. Following extraction and filtration, solvent and oil were removed, and organic solvent extraction was performed with an extraction temperature of 38 °C, solid–liquid ratio of 1:20, ethanol concentration of 70% (volume fraction), ultrasonic power of 80 W, and extraction time of 25.3 min[22]. Subsequently, rotary evaporation and freeze drying were carried out.
PAs purification
Macroporous resin selection, isothermal curves, and heat of adsorption
-
Five kinds of macroporous adsorption resins including AB-8, D301G, D301, 330, and 314 were selected and activated. Next, 4 g of each of the macroporous adsorption resins were accurately weighed, placed in 15 conical bottles, and sequentially added with 10 mL concentration in 1 mg/mL crude PAs extract. Next, the conical bottle was placed in a constant temperature water bath at 25 °C for static adsorption for 12 h. One mL was taken into the standard curve to measure the absorbance, and the PAs concentration was calculated. The adsorption capacity and adsorption rate of the resin were calculated using Eqns (1) and (2). The saturated resin was washed with distilled water until no residue was noted on the surface, and static desorption was performed with 70% acetone. The desorption rate was calculated using Eqn (3).
$ {\mathrm{Adsorption}}\;{\mathrm{capacity}}\;{\mathrm{Q}}=({\mathrm{C}}_0 -\mathrm{C}_1 )\times {\mathrm{V}}_1 / \mathrm{m} $ (1) $ \mathrm{Adsorption}\; \mathrm{rate}=\dfrac{\mathrm{C_{0\mathrm{ }}}-\mathrm{C}_1}{\mathrm{C}_0}\times100{\text{%}} $ (2) $ \mathrm{Desorption}\; \mathrm{rate}=\dfrac{\mathrm{C_2}\times\mathrm{V}_2}{\left(\mathrm{C}_0-\mathrm{C}_1\right)}\times\mathrm{V}_1\mathrm{\times100{\text{%}}} $ (3) where, Q indicates resin adsorption capacity, mg/g; m indicates resin quality, g; C0, C1, and C2 indicate the mass concentration of polyphenols in the supernatant before, after, and desorption, mg/mL; and V1 and V2 indicate the adsorption liquid, and desorption liquid used, mL[23].
Adsorption isotherm experiments were carried out by exposing the resin to six aliquots of sample solutions at different concentrations. The sample solutions were composed of PAs crude extract (1.0, 1.5, 2.0, 2.5, 3, and 3.5 mg/mL), Finally, sample solutions (4 mL) were added to each tube together with 4 g (dry weight) of the best resin obtained from the preceding experiments and shaken at 25, 35, or 45 °C for 12 h. Fitting the data to different isotherm models is important to describe the adsorbent-adsorbate interaction and for the design of the adsorption process. Langmuir and Freundlich isotherm models are widely used.
The Langmuir isotherm model equation is usually given as:
$ \mathrm{q}_{\mathrm{e}}=\dfrac{\mathrm{q}_{\mathrm{m}}\mathrm{K}_{\mathrm{L}}\mathrm{C}_{\mathrm{e}}}{1+\mathrm{K}_{\mathrm{L}}\mathrm{C}_{\mathrm{e}}} $ (4) The Freundlich isotherm model equation is expressed as:
$ \mathrm{Lnq}_{ \mathrm{e}} ={\mathrm{lnK}}_{ \mathrm{F}} +({\mathrm{ln}}C_{ \mathrm{e}} )/{\mathrm{n}} $ (5) where, qm indicates saturated adsorption capacity (mg/g); Ce represents the equilibrium concentration; KL represents the adsorption energy correlation constant; KF is the Freundlich adsorption capacity coefficient; and 1/n is the correlation coefficient of the resin capacity.
The heat of adsorption is related to the constant KL in the Langmuir model. The KL values obtained at different root temperatures are used to calculate the heat of adsorption by the mapping method and it is usually calculated using the following equation:
$ \mathrm{lnK}_{ \mathrm{L}} =\mathrm{lnK}_{ {\mathrm{L}}0} +\mathrm{Q}/{\mathrm{RT}} $ (6) where, Q is the heat of adsorption (kJ/mol); R is the universal gas constant; T is the absolute temperature (K)[24].
Static adsorption and desorption kinetics curve of macroporous resin
-
Resin AB-8 (4 g) was added into a 10 mL concentration of 1 mg/mL grape seed PAs crude extract and incubated at 25 °C at 120 rpm. To detect the PA concentration, samples were collected at different time points (60, 120, 180, 240, 300, 360, 420, 480, and 540 min) to detect the content of proanthocyanidins[23]. The appropriate amount of acetone desorption was added, to detect the PA concentration, samples were collected at different time points (60, 120, 180, 240, 300, 360, 420, 480, and 540 min) to detect the content of proanthocyanidins.
Influence of loading flow rate on resin adsorption efficiency
-
AB-8 macroporous adsorption resin and dextran gel were gradually loaded into the adsorption column using the wet method, respectively, and PAs crude extract with a mass concentration of 1 mg/mL of the extract powder was added. The flow rate was controlled at 0.5, 1, 1.5, and 2 mL/min. Filtrate was collected in a unit of 1 BV. The PAs concentration in the filtrate was measured, and the dynamic adsorption curve was drawn with the filtrate volume as the horizontal coordinate and the grape seed PAs concentration in 1 BV filtrate as the vertical coordinate[25].
Influence of loading concentration and loading amount on the adsorption efficiency of resin
-
AB-8 macroporous adsorption resin and Sephadex LH-20 gel were gradually loaded into the adsorption column using the wet method, respectively. PAs extract liquid with powder mass concentrations of 0.5, 0.75, 1, and 1.5 mg/mL was taken at the optimal flow rate, and the sample was continuously loaded with 1 BV as one flow fraction. The PAs concentration in each flow fraction was calculated. Additionally, the concentration of the abovementioned samples was taken as the horizontal coordinate, and the grape seed PAs concentration in the filtrate was taken as the vertical coordinate, and a histogram was drawn. The optimal concentration of the extracted liquid was taken as the sample, and the PAs concentration in each flow fraction was counted; and the filtrate volume was taken as the horizontal coordinate, and the grape seed PAs concentration in 1 BV filtrate was taken as the vertical coordinate. To determine the optimal loading amount, a dynamic adsorption curve was drawn[26].
Kinetics curve of impurity washing
-
Crude PAs contain impurities, including protein, and washing can wash away the impurities that are not adsorbed. The optimal loading concentration, loading amount, and loading velocity of PAs were passed into the chromatography column. The impurities on the column were washed with distilled water, and the flow rate of 1 BV/min was passed into the distilled water to collect the filtrate. The PAs concentration in each flow fraction was calculated. When the PAs concentration in the filtrate was close to zero, the minimum washing volume was determined[27].
Influence of eluent concentration and volume on desorption efficiency
-
After washing away the impurities, the resin and gel chromatographic columns were eluted with 40%, 50%, 60%, 70%, 80%, 90%, and 100% acetone, respectively; the acetone was steamed and lyophilized, and the PA concentration in the analytical solution was determined[28]. Acetone solution with the best six BV concentration was analyzed, the filtrate was collected in a unit of 1 BV, and the PAs concentration in the filtrate was determined; and the filtrate volume was taken as the horizontal coordinate, and the PAs concentration was taken as the vertical coordinate to draw a curve. The experiment was repeated three times[29] , and the acetone elution curve was drawn to determine the minimum amount of acetone. The content of PAs in acetone solution being less than 0.2 mg/mL was taken as the criterion for determining the minimum volume of acetone.
Box–Behnken design
-
Response surface methodology (RSM) is an effective way to experimentally determine the best levels of multiple variables to get the most ideal response. One particular suite of techniques implemented by this process is known as Box-Behnken design (BBD). BBD makes use of mathematical models that take into account first- and second-order coefficients, which are drawn from three-level incomplete factorial designs. To exemplify this approach, we will consider a scenario where the goal is to maximise the Yield (%) with respect to three independent variables: Loading volume (BV), Acetone concentration (%), and Acetone volume (BV). Experiments for this purpose were performed at three distinct levels: negative one, zero, and positive one. Ultimately, RSM allows us to gain insight on how to craft an optimal solution to our problem giving us the power to manifest successful outcomes.
Purification process verification
-
AB-8 macroporous adsorption resin and Sephadex LH-20 were gradually loaded into the adsorption column using the wet method, respectively, and three pieces were loaded in parallel. In this experiment, 5 mL is a column volume, after pretreatment of AB-8 resin and Sephadex LH-20, sample volume 5 BV (25 mL), 1 mg/mL of the extract powder concentration was taken at a 1 mL/min flow rate, we call this group as [AB-8 (1) and LH-20 (1)], (1) represents the sample concentration of 1 mg/mL. The packing adsorbed a crude solution with a volume of 1 BV, and a concentration of 25 mg/mL as [AB-8 (25) and LH-20 (25)], (25) represents the sample concentration of 25 mg/mL, after elution under the best elution conditions. The eluent was collected, and the PA concentration was determined in the eluent. The purified PA powder was obtained by spinning and freeze-drying.
Determination of antioxidant activity, determination of concentration of protein, and α-amylase inhibition rate
-
The method of DPPH free radical clearance referred to Mishra K was slightly modified, and the concentration was 0.01 mg/mL[30]. The ABTS was based on Re R slightly modified with a concentration of 0.01 mg/mL[31,32]. The total antioxidant capacity (T-AOC) of pure product was determined using the kit method according to the kit instructions[33]. Coomassie brilliant blue method was used to determine the residual protein of purified products after four purification methods, according to the Bradford M[34,35] method in μg/mL. α-amylase has the most suitable inhibition rate at 0.5 mg/mL, as determined by the method of Borsoi et al.[36]. Four pure PAs were plotted as the variables and the experiment was repeated three times.
Qualitative and quantitative analysis of pure PAs
-
Phloroglucinol was employed in acid catalysis to identify the structure of PAs. The relative content of PAs was determined by standard curves for catechin, and the content of their monomers was determined using standard curves for catechin (C), epicatechin (EC), epigallocatechin (ECG), proanthocyanidin B1 (B1), and proanthocyanidin B2 (B2). An Agilent 1260 Infinity II series HPLC system (Agilent Technologies, Palo Alto, CA, USA) was employed for PAs analysis. Separation was achieved using an ODS Hypersyl C18 LC column (125 mm × 4.6 mm, 5 μm, Thermo Scientific). All subunits for structure and the component of PAs were detected at 280 nm. The chromatographic conditions, the gradient elution program, and the details of the determination of the structure and composition of PAs refer to our previously published methods[37]. The total PAs, mean DP, and galloylation percentage (G%) were calculated following a previously established method[28].
Statistical analysis
-
Data were plotted using Origin 8.6 software (OriginLab, Northampton, MA, USA) and the results were statistically analyzed using Statistical Package for the Social Sciences (version 16, IBM, Chicago, IL, USA). Means and standard deviations were calculated, and significant differences were determined at p ≤ 0.05.
-
The adsorption/desorption properties of the five resins were investigated to identify the resin suitable for PAs purification; the results are presented in Table 1. The adsorption rate of grape seed PAs by AB-8 resin was approximately 92%, the adsorption capacity was 3.74 (mg/g) and the adsorption effect was significantly higher than that of the other resins (p < 0.05). The desorption rate of grape seed PAs by AB-8 resin was 82.59%, and the desorption effect was significantly higher than that of the other resins (p < 0.05). The surface area is speculated to favor its strong adsorption capacity on PAs, and that the larger the identified surface area, the more binding sites the resin will have; subsequently, the general adsorption capacity will increase[38]. PAs are extremely polar, and AB-8 has a weak polarity. The adsorption capacity of AB-8 and the ball rate after grinding are speculated to be larger than other resins. The results of adsorption and desorption experiments showed that AB-8 resin had better adsorption and desorption capacity for PAs than other resins, which was consistent with previous results[39]. Therefore, the macroporous resin was selected to enrich PAs from grape seed residue, and the related operating conditions were optimized.
Table 1. Adsorption and desorption rates of the five macroporous resins for PAs.
Resin type Adsorption capacity (mg/g) Adsorption rate (%) Desorption rate (%) AB-8 2.34 ± 0.01a 93.59 ± 1.39a 82.11 ± 1.07a D301G 2.00 ± 0.01b 80.37 ± 1.25b 68.80 ± 0.96b 314 2.03 ± 0.02b 81.45 ± 2.17b 25.32 ± 1.67c 330 1.50 ± 0.01d 60.06 ± 1.07c 55.11 ± 2.79d D301 1.76 ± 0.01c 70.35 ± 1.35d 29.86 ± 0.68d Different lowercase letters (a, b, c) indicate statistically significant differences between groups (p < 0.05, Tukey's HSD test). The PA data for adsorption were fitted to the Langmuir and Freundlich isotherm equations. The equation constants and correlation coefficients obtained for each model are listed in Table 2. According to the correlation coefficient obtained from each model, the Langmuir model better described the adsorption properties than Freundlich model. The fitting curves of the Langmuir model for PAs at 25C, 35, and 45 °C are shown in Fig. 1a. The fitting curves of the Freundlich model for PAs at 25, 35, and 45 °C are shown in Fig. 1b. The best temperature for adsorption of PAs by AB-8 was 25 °C. The adsorption equilibrium constant (KL) of the Langmuir model was used to calculate the heat of adsorption (Q) of the resin for the four components. Linear fitting was performed with lnKL as the ordinate and 1/T as the abscissa, as shown in Fig. 1c. Equation (6), in which Q/R is the slope and lnKL0 is the intercept, could then be used to determine Q. Generally when Q is less than 40 kJ/mol[40], physical adsorption is indicated, otherwise chemical adsorption is occurring. According to Eqn (6), the Q values of AB-8, D301G, 314, 330, and D301 were calculated as −49.37, −44.12, −43.03, −48.25, and −68.51 kJ/mol, respectively. All components exhibited negative heat of adsorption, indicating exothermic physical adsorption. The change in the amount of adsorption is usually temperature-dependent[41]. When the temperature is increased, the solubility of the solute usually increases, meaning that under certain conditions, more solute can be present in solution. Therefore, the original solute on the adsorbent may be 'diluted' due to the increased amount of solvent, leading to decreased adsorption. Adsorption is an exothermic process, that is, the system releases heat during adsorption. If the structure of the adsorbent remains the same, then the activity of the adsorbate on the adsorbent surface is enhanced at high temperatures, which may lead to a further reduction in the amount of adsorption[42]. However, it has also been shown that some adsorption processes are endothermic, so in this case, increased temperature may lead to increased adsorption.
Table 2. Thermodynamic parameters for PA adsorption on resin at 25, 35, and 45 °C.
Resin type Temperature (°C/K) Langmuir equation Freundlich equation KL qm R2 KF n R2 AB-8 25/298.15 31.39 ± 5.4 2.43 ± 0.08 0.96 2.60 ± 0.33 4.34 ± 0.65 0.85 AB-8 35/308.15 43.38 ± 4.95 2.54 ± 0.17 0.95 2.64 ± 0.45 4.34 ± 1.23 0.76 AB-8 45/318.15 67.91 ± 3.38 2.47 ± 0.05 0.99 2.70 ± 0.42 5.00 ± 0.84 0.79 D301G 25/298.15 14.28 ± 5.16 2.18 ± 0.35 0.77 1.96 ± 0.38 4.34 ± 1.00 0.58 D301G 35/308.15 17.06 ± 6.51 2.22 ± 0.38 0.75 2.04 ± 0.41 4.54 ± 1.10 0.57 D301G 45/318.15 28.50 ± 8.93 2.23 ± 0.31 0.77 2.12 ± 0.41 5.09 ± 1.09 0.61 314 25/298.15 22.25 ± 9.81 2.04 ± 0.17 0.72 1.96 ± 0.40 4.17 ± 1.05 0.56 314 35/308.15 32.56 ± 9.29 2.21 ± 0.40 0.71 2.06 ± 0.44 5.00±1.30 0.55 314 45/318.15 43.55 ± 12.11 2.23 ± 0.27 0.81 2.15 ± 0.42 5.55 ± 1.01 0.62 330 25/298.15 16.85 ± 2.26 1.44 ± 0.05 0.95 1.34 ± 0.09 6.25 ± 1.05 0.80 330 35/308.15 26.31 ± 2.41 1.44 ± 0.04 0.97 1.39 ± 0.08 7.14 ± 0.82 0.84 330 45/318.15 35.78 ± 14.51 1.57 ± 0.05 0.99 1.53 ± 0.22 7.69 ± 2.14 0.53 D301 25/298.15 13.17 ± 5.45 1.79 ± 0.28 0.69 1.62 ± 0.25 5.01 ± 1.30 0.59 D301 35/308.15 27.32 ± 9.92 1.74 ± 0.22 0.73 1.67 ± 0.24 6.25 ± 1.25 0.62 D301 45/318.15 38.33 ± 10.26 1.90 ± 0.19 0.80 1.87 ± 0.27 6.25 ± 1.25 0.68 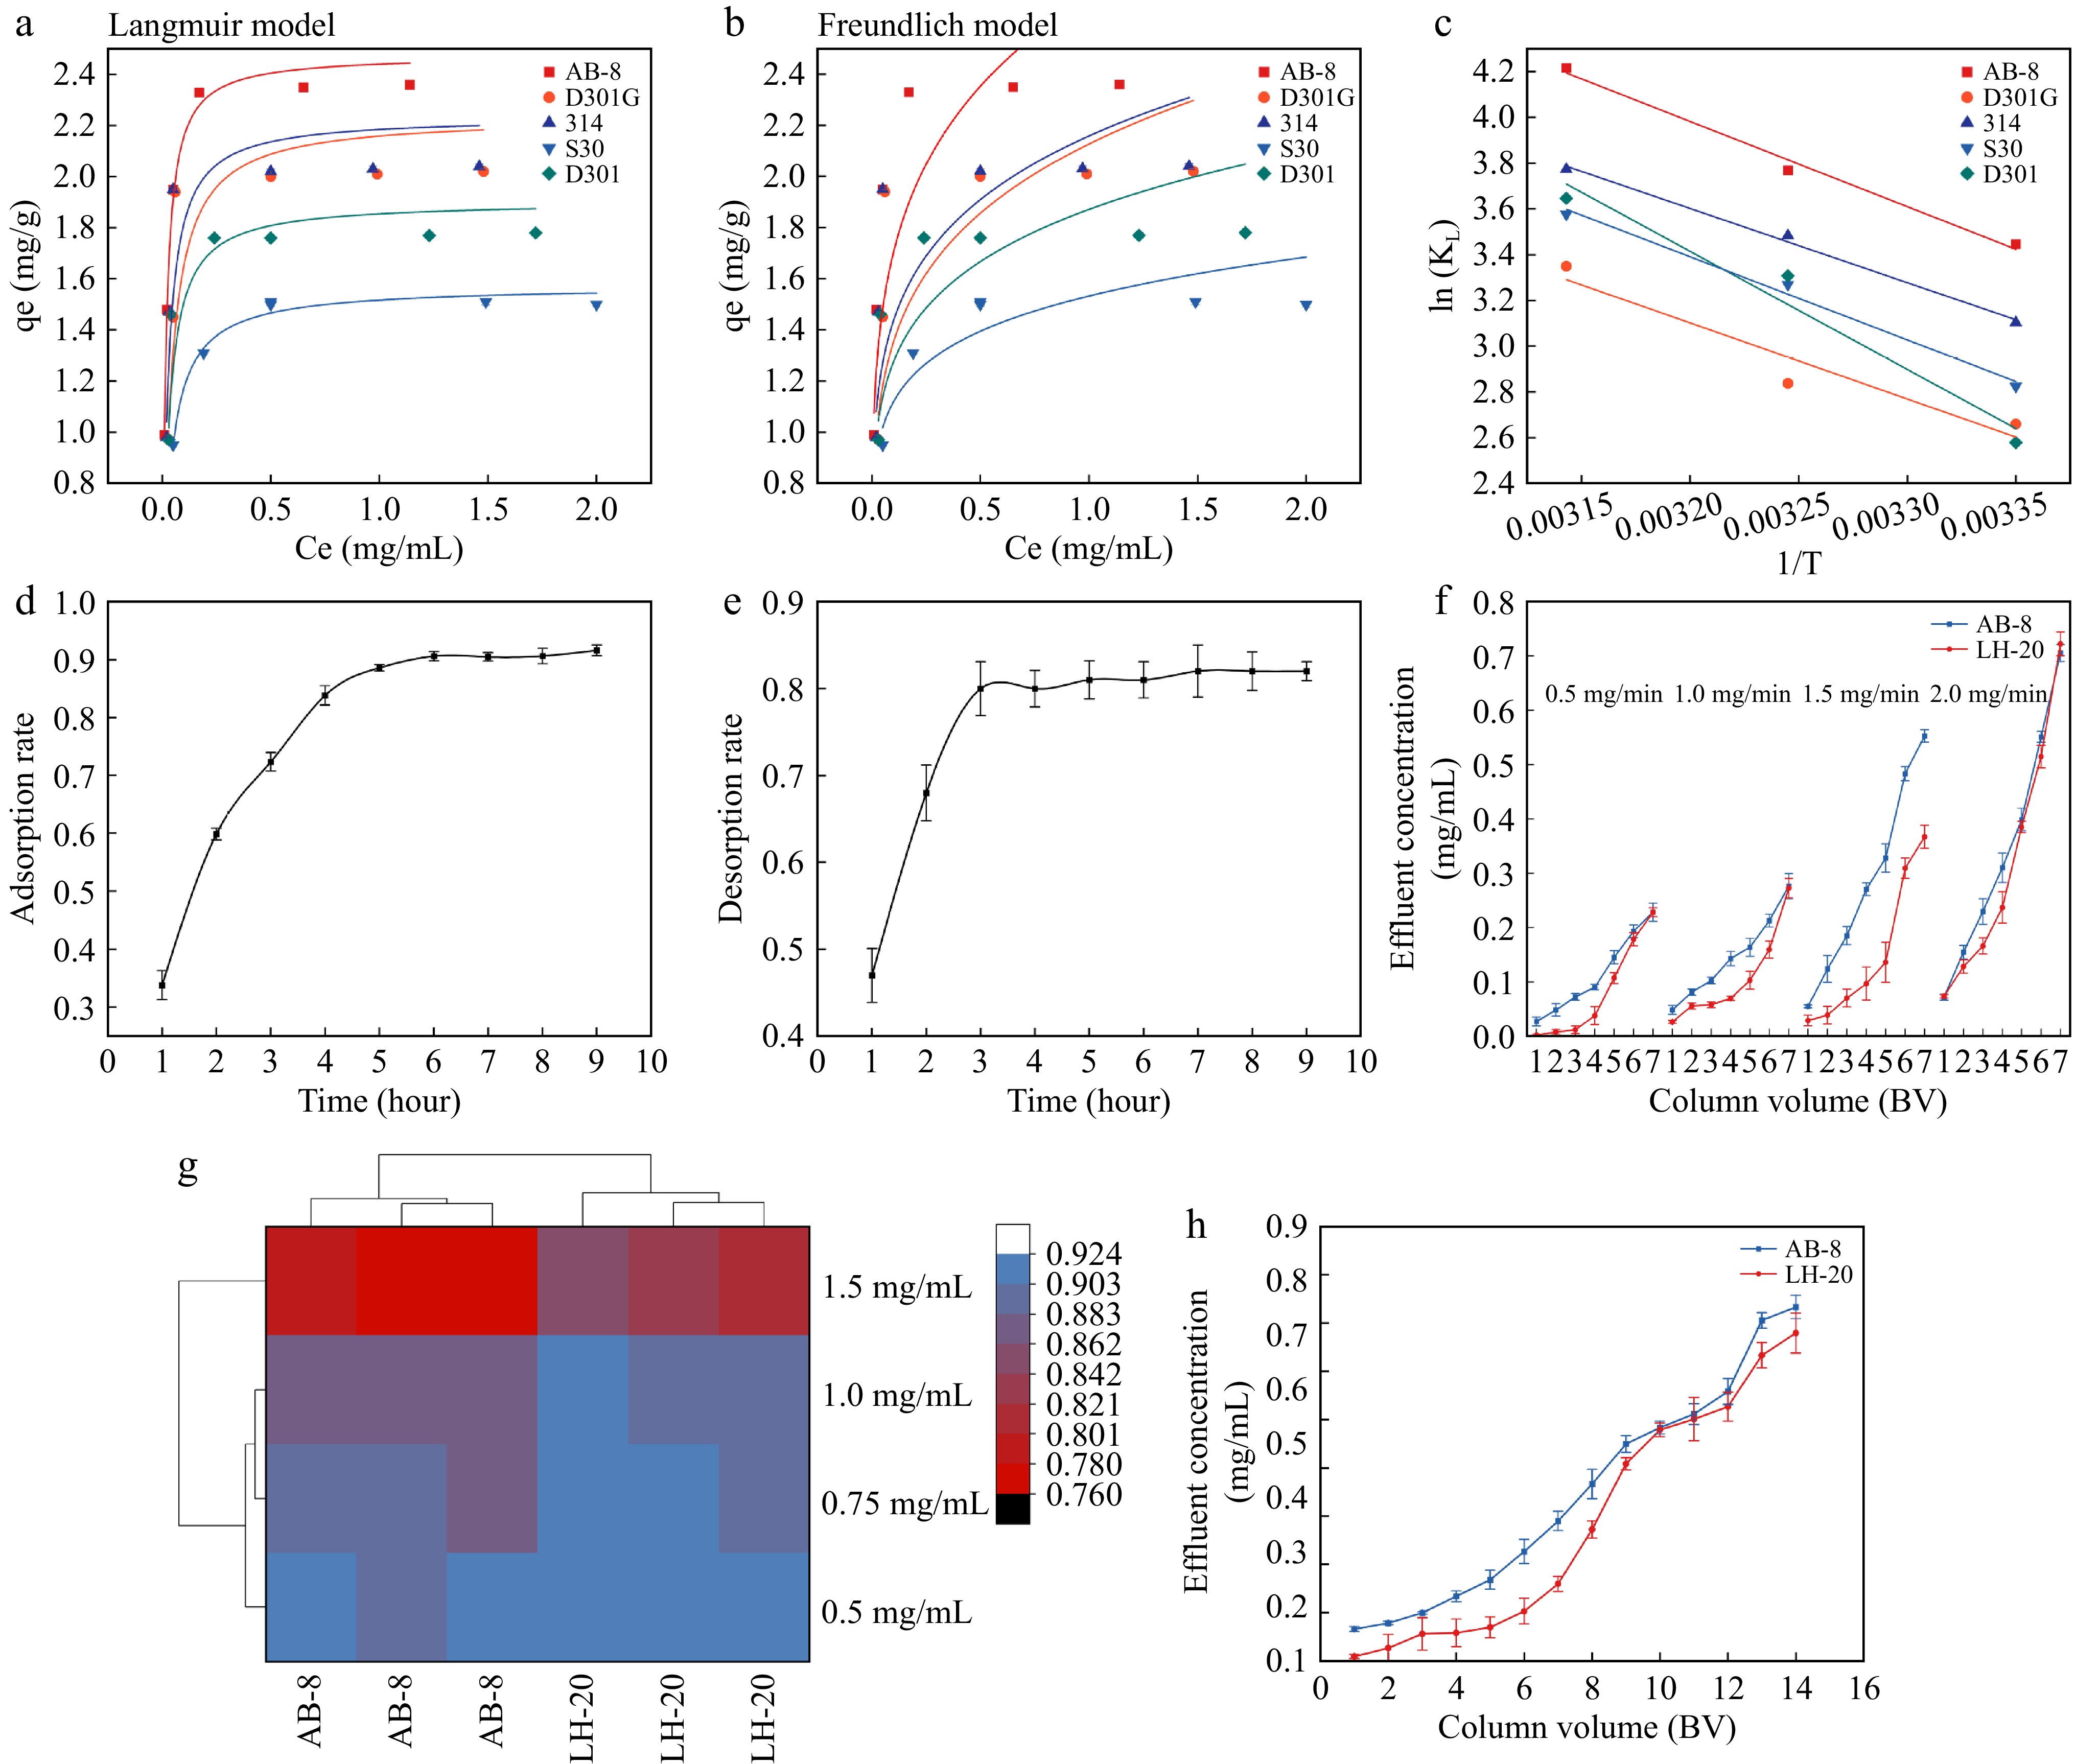
Figure 1.
Langmuir model and Freundlich model fitting and optimization of loading parameters. (a) Langmuir model fitting for PAs at 25 °C. (b) Freundlich model fitting for PAs at 25 °C. (c) Linear fitting of lnKL and 1/T. (d) Static adsorption curve of proanthocyanidins by AB-8 macroporous resin. (e) Static desorption curve of proanthocyanidins by AB-8 macroporous resin. (f) Influence of sample loading velocity on dynamic tannin adsorption efficiency under resin and gel loading chromatographic column. (g) Influence of sample concentration on dynamic tannin adsorption efficiency under resin and gel loading chromatographic column. (h) Dynamic tannin adsorption curve under resin and gel loading chromatographic column.
Static adsorption curve of AB-8 macroporous resin
-
The kinetic curve obtained by fitting static adsorption experimental data is shown in Fig. 1d. PAs were rapidly adsorbed by macroporous resin in the first 2 h, due to the large concentration difference between macroporous resin and PAs crude solution at the initial stage of adsorption, the mass transfer driving force between the two phases is larger, so the adsorption rate is faster (Fig. 1d). A slow adsorption process occurs between 2 h and 5 h; equilibrium adsorption occurs after 5 h because with the extension of the adsorption time, the adsorption sites on the surface of the macroporous resin basically reach saturation[43]; therefore, the 5 h adsorption time is more appropriate. Compared with the previous study[39], the saturation point was slightly off in the present study, which may be related to the shaker speed and initial liquid concentration. The kinetic curve obtained by fitting static desorption experimental data is shown in Fig. 1e. PAs were rapidly desorbed by macroporous resin in the first 3 h, due to the large concentration difference between macroporous resin and acetone solution at the initial stage of desorption, the mass transfer driving force between the two phases is larger, so the desorption rate is faster (Fig. 1e). The 3 h desorption time is more appropriate than other times.
Comparison of dynamic purification parameters of macroporous resin and Sephadex LH-20
Comparison between adsorption parameters
-
The influence of different sample flow rates on the adsorption rate is shown in Fig. 1f. The adsorption rate of PAs by AB-8 macroporous resin and Sephadex LH-20 decreased with the increase in the loading flow rate, and the filtrate concentration increased with the increase in the loading flow rate. Additionally, the filtrate concentration reached the maximum when the flow rate was 2 mg/mL. This finding is because of the very high loading flow rate, which will significantly affect the contact time of PAs, macroporous resin, and Sephadex LH-20 as well as the adsorption site of PAs by macroporous resin, and Sephadex LH-20, thereby resulting in significant changes in the adsorption rate. The flow rate of 0.5 and 1 mg/mL filtrate concentrations gradually increased, and the difference was not significant; therefore, the optimal flow rate is 1 mg/mL. This result is consistent with the previous optimal flow rate[44]. In this study, the filtrate concentration of Sephadex LH-20 was always lower than that of macroporous resin at the initial stage of sample loading, indicating that Sephadex LH-20 had a better adsorption capacity than AB-8 macroporous resin.
As shown in Fig. 1g, when the mass concentration of PAs loading solution exceeds 1 mg/mL, the adsorption rate will significantly decrease. This finding is because when the mass concentration of the sample liquid is high, the PAs that are not adsorbed by resin and Sephadex LH-20 gel will precipitate, thereby resulting in resin blockage; moreover, the impurities will precipitate, thereby resulting in a decrease in the PAs adsorption rate. However, when the mass concentration of the sample solution is low, the adsorption force between the extract solution and macroporous resin and Sephadex LH-20 will decrease, thereby resulting in no significant differences between 0.5 and 0.75 mg/mL compared with 1 mg/mL. Moreover, resin adsorption not reaching saturation, results in resin and gel wasting. Additionally, procyanidin pure product will be wasted without adsorption and subsequently washed away by distilled water as waste liquid. Sephadex LH-20 had a slightly higher adsorption rate and was more stable during adsorption than macroporous resin.
The kinetic curve obtained by fitting the dynamic adsorption experimental data is shown in Fig. 1h. As the concentration difference of PAs between macroporous resin and Sephadex LH-20 and the extract was large at the initial stage of adsorption, 5 BV was previously a rapid adsorption process, and the driving force of mass transfer between the two phases was large; therefore, the adsorption rate was fast. After 5 BV, with the accumulation of loading amount, the adsorption sites on the surface of the macroporous resin and Sephadex LH-20 reached saturation. Therefore, 5 BV is the most suitable loading amount. The comparison between macroporous resin and Sephadex LH-20 is depicted in Fig. 1h. At 1–8 BV, the adsorption capacity of Sephadex LH-20 is always higher than that of macroporous resin, and the difference is significant. When the loading volume is 6 BV, the adsorption capacity of macroporous resin and Sephadex LH-20 is significantly decreased, and the macroporous resin and Sephadex LH-20 have reached saturation. Therefore, with reference to previous research conclusions[26] 5 BV was selected as the optimal loading volume.
Comparison of desorption parameters
-
The crude extract of PAs contains sugar, protein, lipids, and other soluble impurities. After the PAs are adsorbed by resin, these soluble impurities can be washed away; however, PAs adsorbed by resin cannot be eluted by highly polar distilled water. Therefore, increasing the amount of washing can improve the purity of PAs to a certain extent. As shown in Fig. 2a, with the increase in the amount of washing, the PA concentration in the filtrate gradually decreases until the volume of washing is 5 BV and decreases to 0 mg/mL, which tends to be stable. This finding was consistent with that of a previous study[45]; therefore, 5 BV was selected as the washing volume.
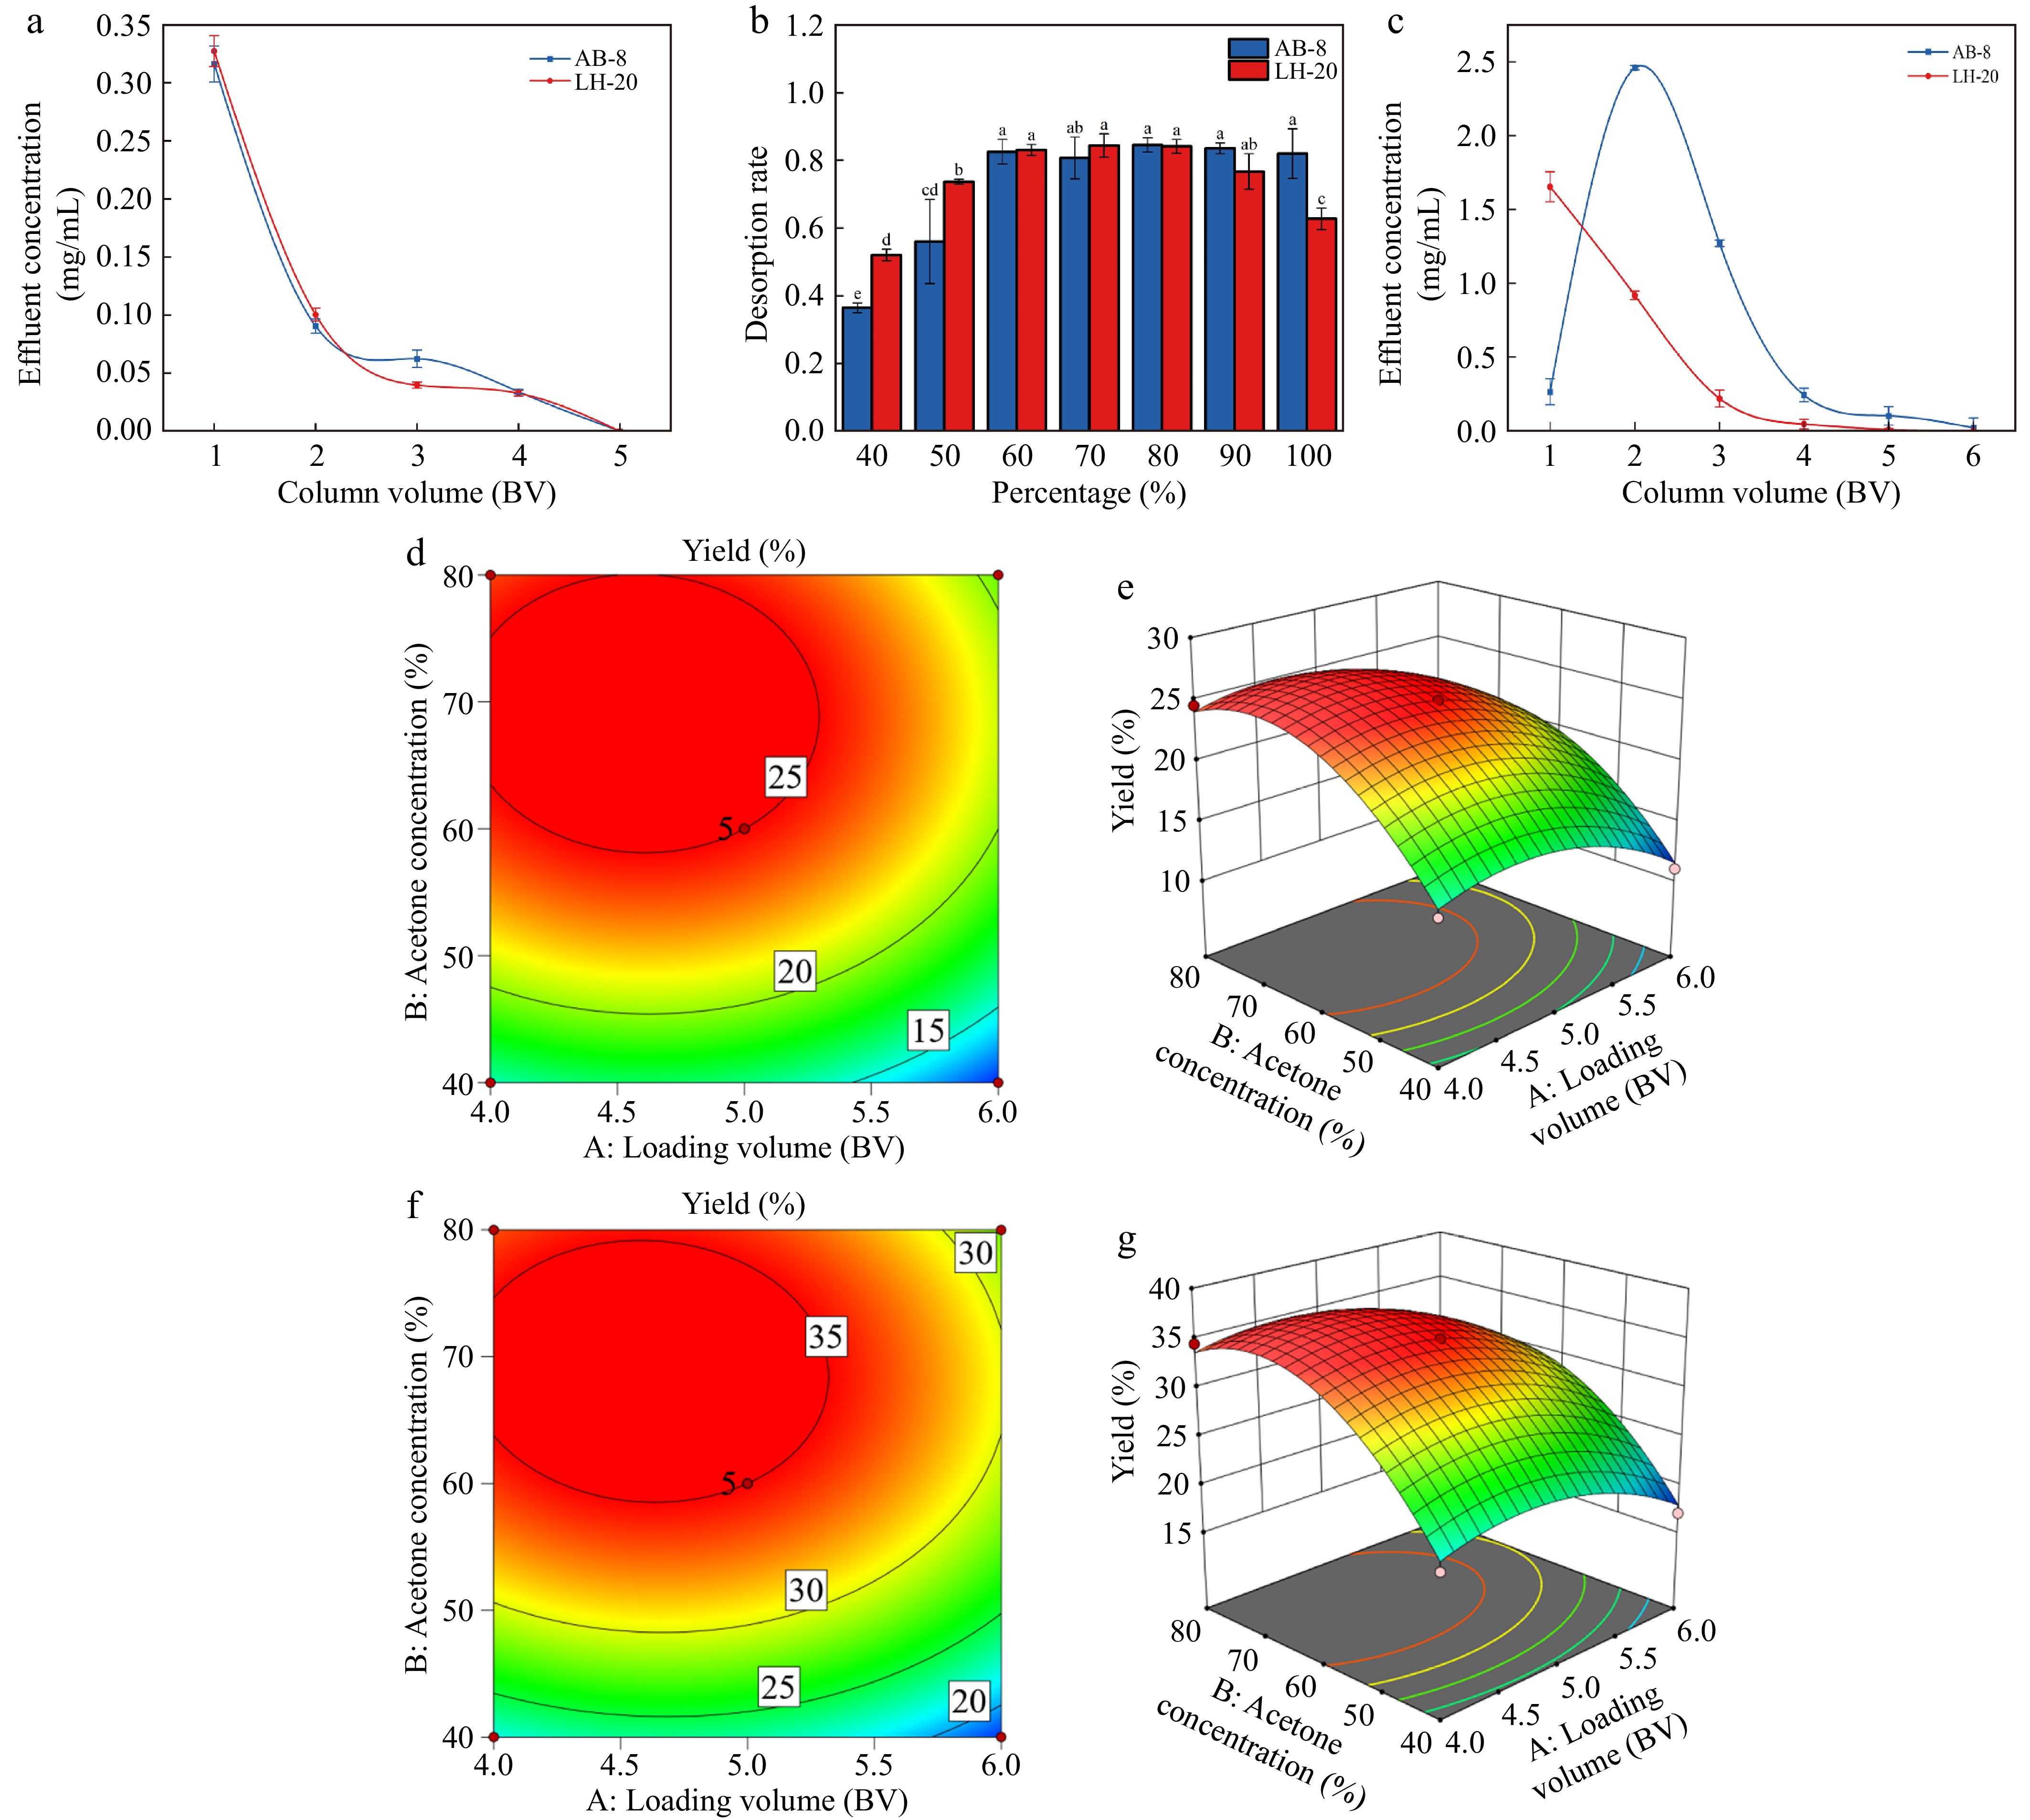
Figure 2.
Elution parameters and response surface optimization. (a) Influence of proanthocyanidins washing volume on filtrate concentration. (b) Influence of acetone volume fraction of eluent on desorption. (c) Influence of desorption amount on filtrate concentration. (d) 2D response surface plots of macroporous resin between Loading volume (BV) and Acetone concentration (%). (e) 3D response surface plots of macroporous resin between Loading volume (BV) and Acetone concentration (%). (f) 2D response surface plots of Sephadex LH-20 between Loading volume (BV) and Acetone concentration (%). (g) 3D response surface plots of Sephadex LH-20 between Loading volume (BV) and Acetone concentration (%).
The influence of acetone volume fraction of desorption solution on the desorption rate is shown in Fig. 2b. The resolution rate increases with the increase in acetone volume fraction, reaches its highest when the acetone volume fraction is 60%, and subsequently begins to gradually decline. As AB-8 macroporous resin is weakly polar, the desorption effect will increase with the increase in acetone volume fraction and its polarity. The volume fraction of acetone is < 60%, and the polarity is too weak, which will weaken the desorption effect of the eluent; therefore, the integral number of the desorption liquid in the static desorption test is set at 60%. The analytical adhesion level of Sephadex LH-20 at 60% was significantly higher than that of the other concentrations, which may be related to the swelling volume of the gel. This finding is consistent with those of previous studies on ethanol elution[46].
As the amount of acetone increased, the resin filtrate concentration initially increased and subsequently decreased. As shown in Fig. 2c, when the amount of acetone is 4 BV, basically all the PAs adsorbed by the resin have been resolved, and further increases in the amount of acetone would result in a waste of materials; therefore, the amount of acetone for analysis of PAs was selected. PAs adsorbed by Sephadex LH-20 gels are more easily desorbed than those by macroporous resins. As the optimal elution volume, 4 BV is slightly more than 3 BV in previous studies[47], which may be related to the elution flow rate.
Optimization based on the BBD method was used to specify the optimum condition to reach the maximum PA production. Based on the results, the maximum PA extraction on the resin of 26.01% was obtained at the loading volume 4.64 BV, the acetone concentration 61.64% and acetone volume 4.66 BV. The obtained optimal results were confirmed by two more experiment runs under the optimum conditions. The PA extraction of 25.14% was observed and confirmed the reliability of the suggested response for the prediction of extraction efficiency. Based on the results, the maximum PA extraction on Sephadex LH-20 of 36.05% was obtained at the loading volume 5.05 BV, the acetone concentration 63.34%, and acetone volume 4.32 BV. The obtained optimal results were confirmed by three more experiment runs under the optimum conditions. The PAs extraction of 35.21% was observed and, confirmed the reliability of the suggested response for the prediction of extraction efficiency (Fig. 2d−g).
Yield and purity analysis
-
As shown in Fig. 3, the purified yield of Sephadex LH-20 with 25 mg/mL loading volume of 1 mL was the highest, reaching 53.91%; however, the purification rate is the lowest compared with the crude product. AB-8 macroporous resin with 25 mg/mL loading volume of 1 mL had the lowest yield following purification; however, the purity was up to 94%, which was similar to the results of previous studies using macroporous resin purification[48]. Overall, the purity of macroporous resin purification is better than that of Sephadex LH-20. Although Sephadex LH-20 has the advantages of smooth and stable sample loading, high yield, and high absorption rate during sample loading, AB-8 macroporous resin is more suitable for PAs purification because the purity of PAs obtained from macroporous resin is much higher than that of Sephadex LH-20 purification.
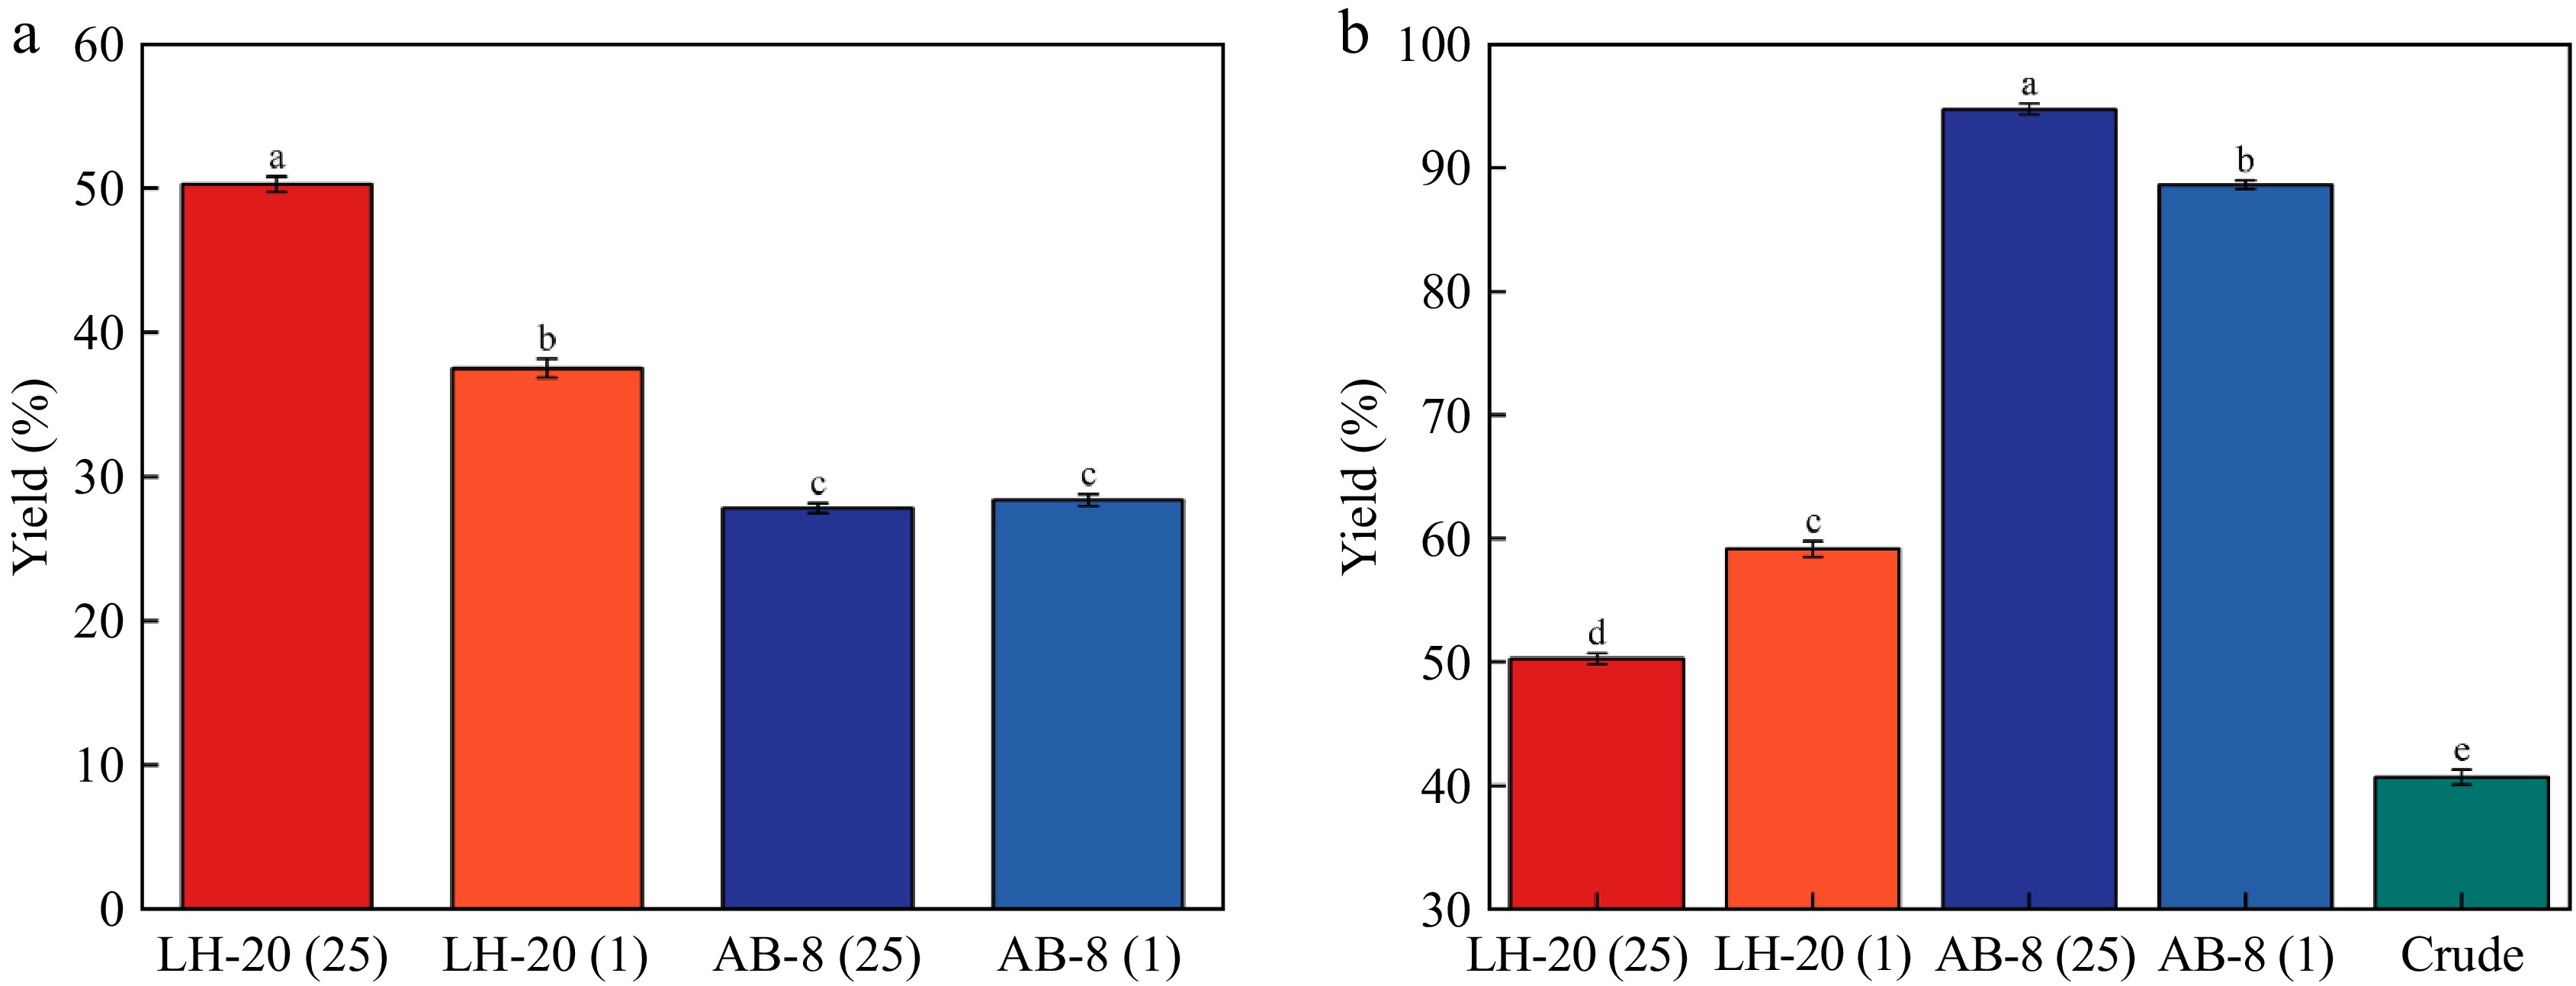
Figure 3.
Yield and purity of the test. (a) Verification of the yield of the experiment. (b) Verification of the purity of the experiment.
Comparison of antioxidant and amylase inhibition ability
-
As shown in Fig. 4a, catechins and PAs purchased on the market have the strongest scavenging ability on DPPH free radicals, with a clearance rate of 98%. Compared with crude PAs following purification, the clearance rate of the former was significantly higher than that of the latter (p < 0.05). The clearance rate of PAs purified by Sephadex LH-20 was approximately 80%, which was significantly lower than that of PAs purified by macroporous resin. The scavenging rate of PAs on DPPH free radicals was 50%, and the scavenging ability of crude extract was the lowest compared with purified extract. This finding is similar to a previous study with a rate of 80%[49], but with slight differences, possibly due to different raw materials. However, less relevant studies on the use of Sephadex LH-20 for purification have been conducted. Procyanidins purified by the two fillers had good ABTS free radical scavenging ability, and the purified PAs had a significantly higher scavenging ability than the crude product, and the scavenging rate of the purified procyanidins reached 50% at 2.5 μg/mL. PAs extracted by macroporous resin had better ABTS free radical scavenging ability. No significant difference was observed between the ABTS free radical ability of 25 mg/mL macroporous resin and that of PAs and catechins. The results of the antioxidant capacity of PAs T-AOC purified by macroporous resin and Sephadex LH-20 gel are shown in Fig. 4b. The antioxidant effect of 25 mg/mL macroporous resin on the 1-mL sample was significantly higher than that of the other groups.
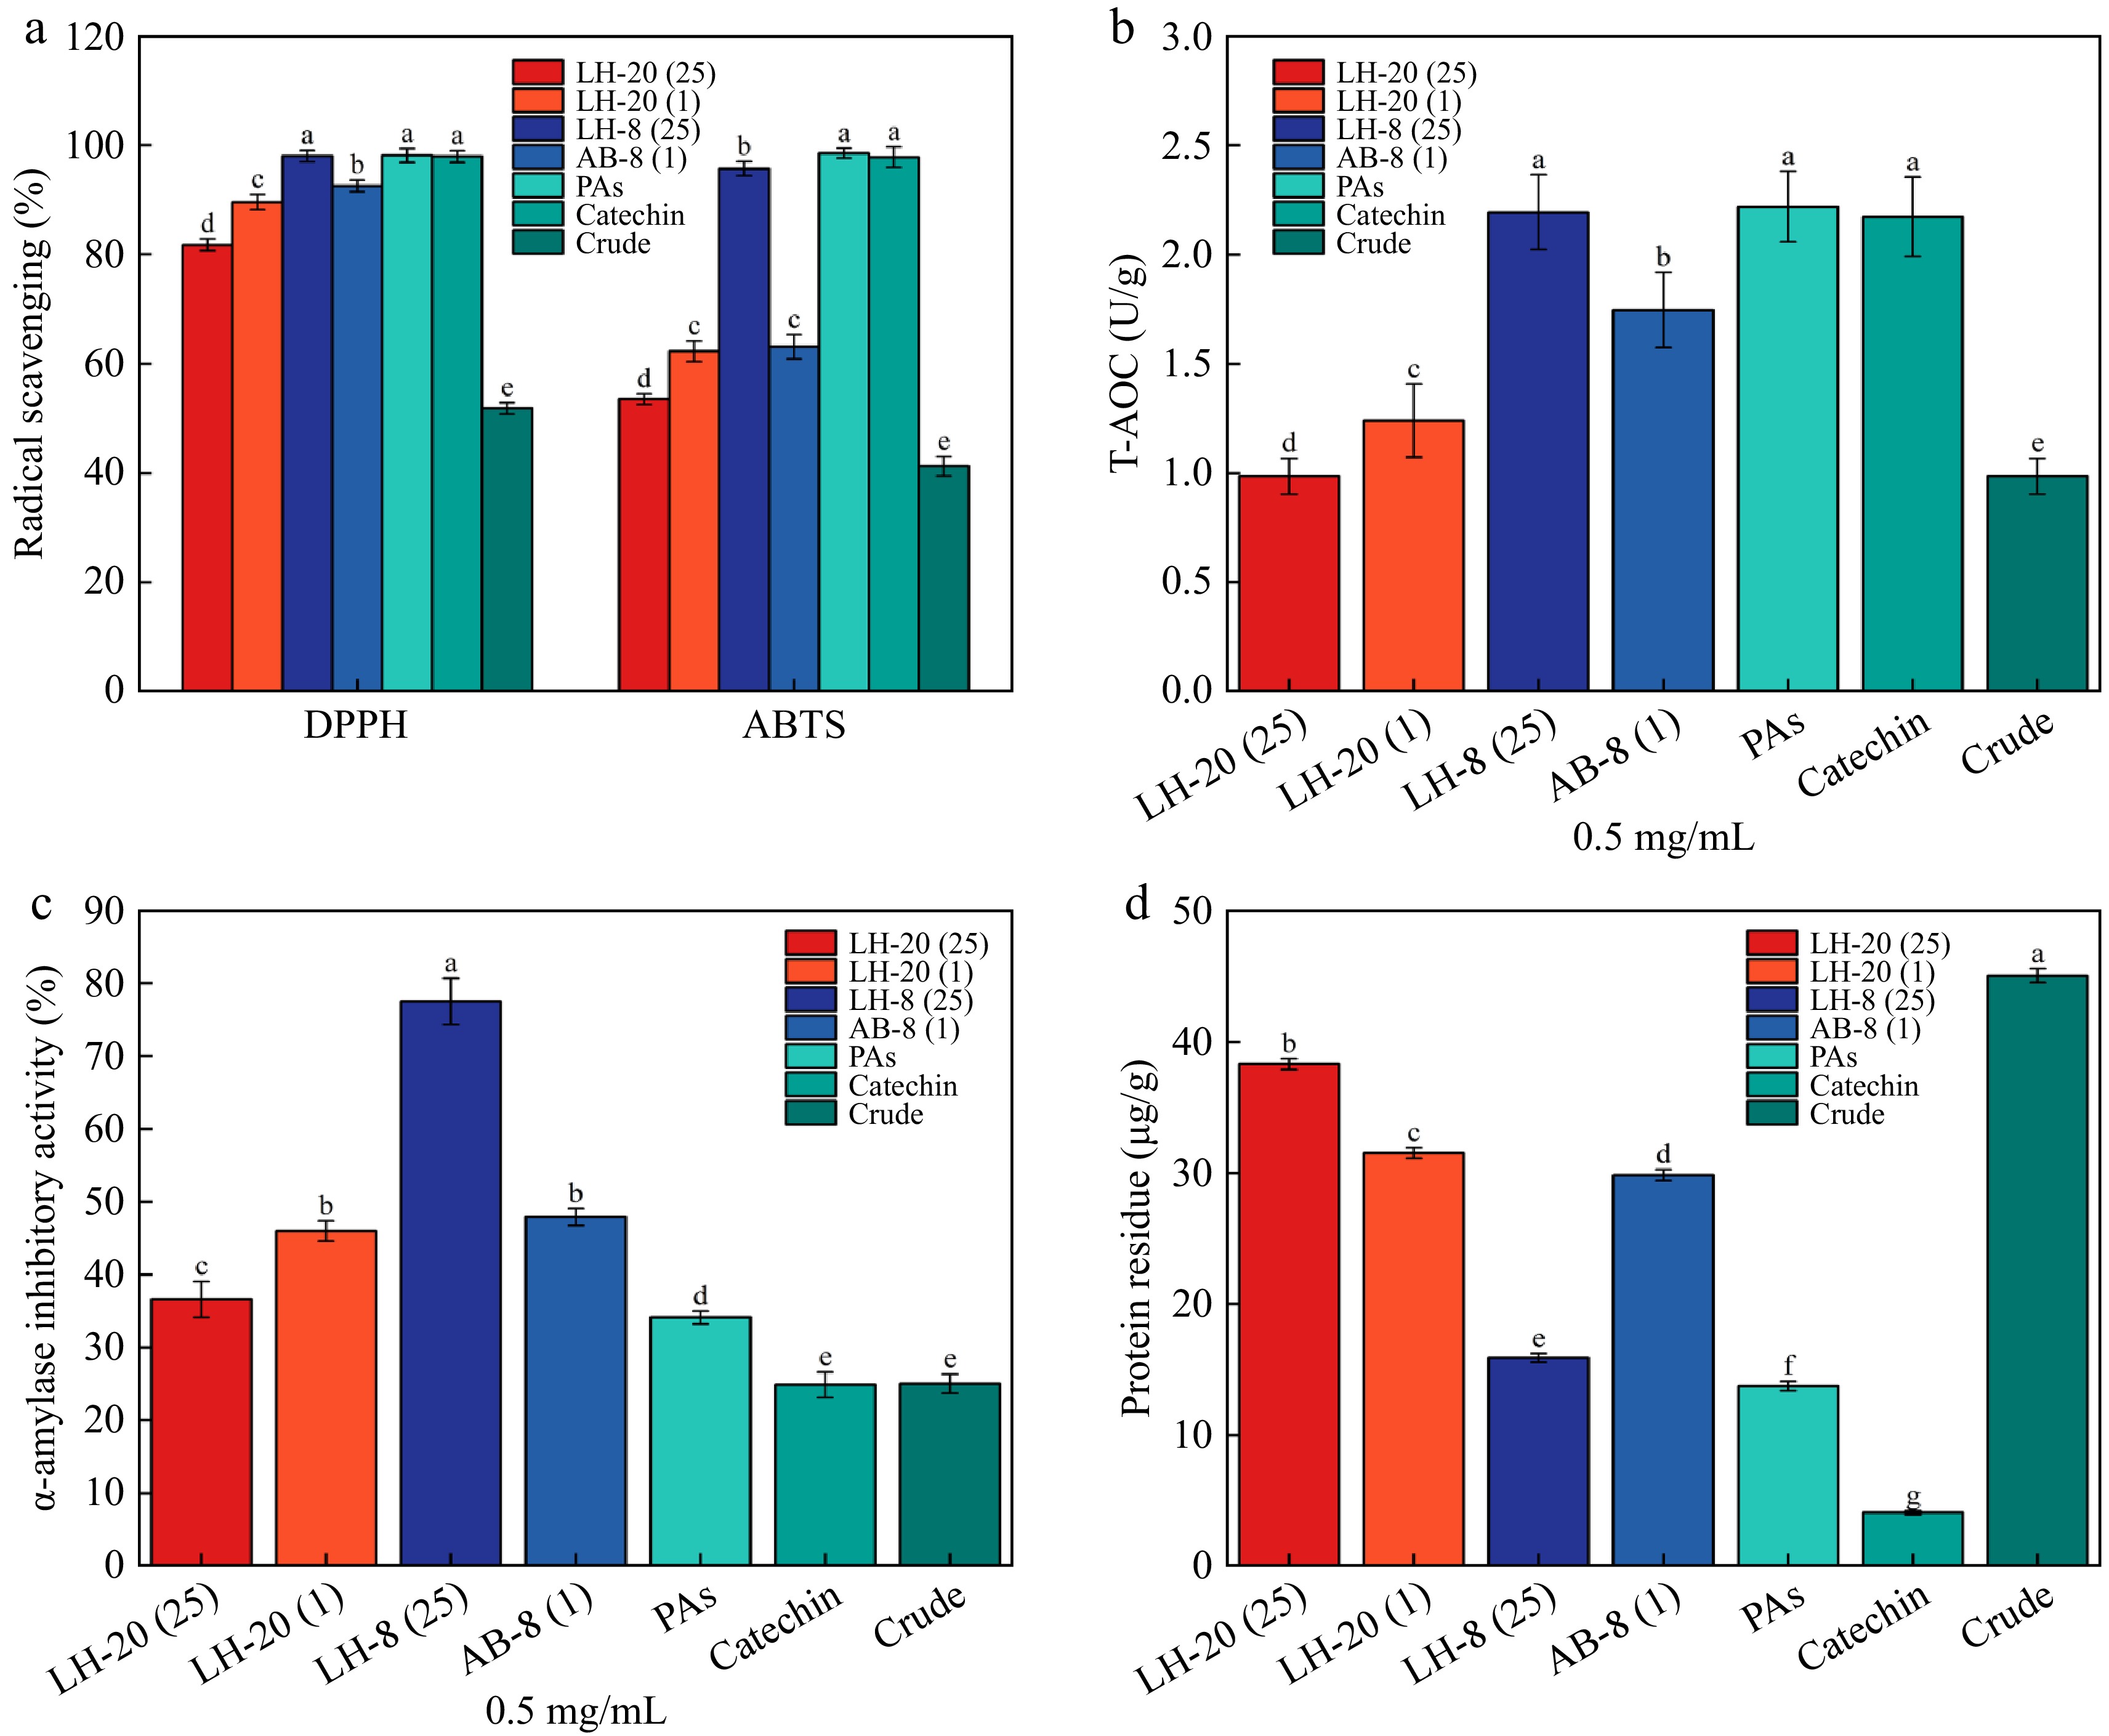
Figure 4.
(a) Scavenging rate of DPPH and ABTS free radicals from PAs. (b) T-AOC antioxidant level of PAs. (c) Inhibition rate of α-amylase from PAs. (d) Protein residue of PAs.
The α-amylase inhibitory activity of AB-8 (25) was the strongest, the α-amylase inhibitory activity of 0.5 mg/mL could reach 80%, and the α-amylase inhibitory activity of crude PAs could only reach 25%. The inhibitory activity of PAs on α-amylase is shown in Fig. 4c. When the mass concentration of PAs was 0.5 mg/mL, the crude product showed an inhibitory activity on α-amylase (inhibitory rate, 25%). In contrast, PAs purified by macroporous resin showed a higher activity against α-amylase. The inhibitory activity of PAs purified by Sephadex LH-20 on α-amylase was slightly lower than that purified by resin, which was one-half that of resin. Therefore, macroporous resin is an essential part of the PAs purification. Compared with previous studies[50], the inhibitory rate of amylase was low, which may be related to the low purity of the pure product following Sephadex LH-20 purification. Protein residues are shown in Fig. 4d. Samples with high purity have fewer protein residues.
Chromatographic analysis
-
As shown in Fig. 5 and Table 3, the average polymerization degree of the product obtained after Sephadex LH-20 is significantly higher than that of the product obtained after macroporous resin, and the loading concentration was 25 mg/mL of macroporous resin and Sephadex LH-20 had a significantly higher polymerization degree than loading concentration was 1 mg/mL of macroporous resin and Sephadex LH-20. The total molar concentration of 25 mg/mL macroporous resin was significantly higher than that of the other purification methods. The mDP of the crude product did not change significantly after purification, but the total monomer concentration increased. An Agilent 1260 Infinity II series HPLC system has identified the following five kinds of PAs monomer and dimer: tC, eC, eEC, eECG, and tEC. No tECG and eEGC were detected, e is extension units, t is terminal units. PAs purified by Sephadex LH-20 had a generally higher degree of polymerization than PAs purified by macroporous resin. LH-20 (25) has the highest G%. This finding may be related to the polarity of the different fillers. In the case of the same quality of PAs crude sample, the higher the concentration of PAs crude solution, the smaller the volume, resulting in higher monomer concentration and higher content of B1. The loading concentration directly affected the monomer concentration.
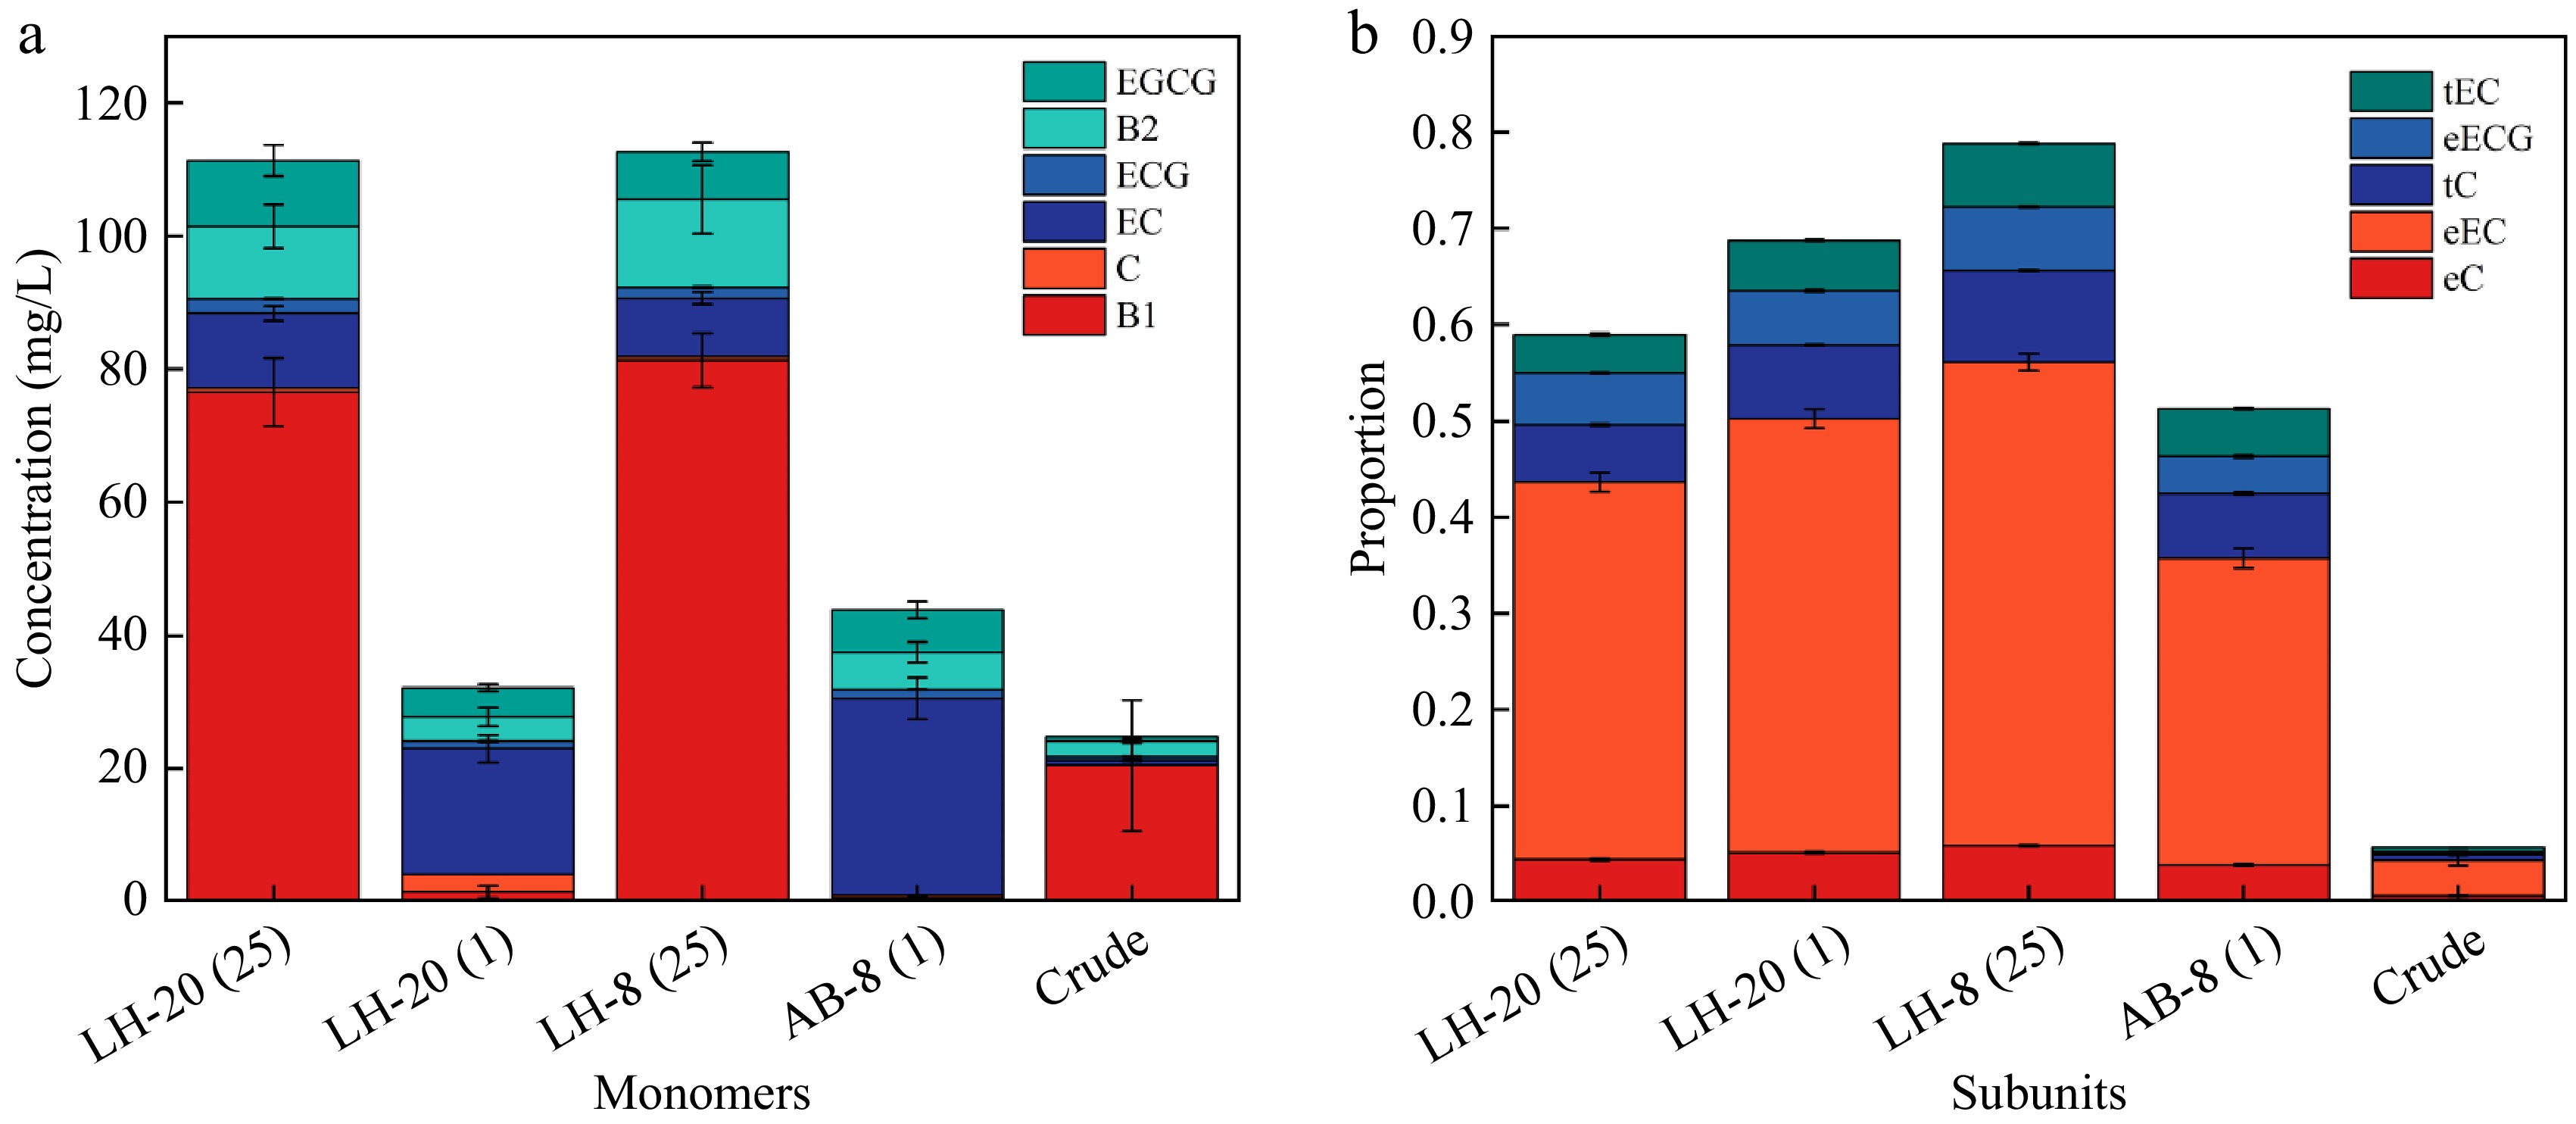
Figure 5.
(a) Monomer concentration of five proanthocyanidins. (b) Structural composition of five proanthocyanidins.
Table 3. Comparison of polymerization degree of four pure products.
Sample Total molar concentration (%) % G Total monomer concentration (mmol/L) mDP LH-20 (25) 0.62 ± 0.014c 9.13 ± 0.128a 112.40 ± 0.198a 5.56 ± 0.085a LH-20 (1) 0.72 ± 0.004b 8.16 ± 0.223b 34.95 ± 0.392c 4.97 ± 0.123b AB-8 (25) 0.81 ± 0.010a 8.38 ± 0.230b 113.98 ± 0.064a 4.70 ± 0.051c AB-8 (1) 0.54 ± 0.018d 7.55 ± 0.031c 48.20 ± 0.113b 4.23 ± 0.067d mDP is the average degree of polymerization; % G is galloylation percentage. Different lowercase letters (a, b, c) indicate statistically significant differences between groups (p < 0.05, Tukey's HSD test) -
In this study, AB-8 resin and Sephadex LH-20 were selected for purification of PA crude extract. The purification parameters were explored through static and dynamic adsorption and desorption experiments. Box-Behnken design can improve the yield of PAs. The mDP ranged from 4 to 5.6, and macroporous resins had a higher purity of PAs than Sephadex LH-20 gel. If the loading concentration was higher, the total monomer concentration was higher, and the free radical scavenging rate of the purified PAs could rise. Although the Sephadex LH-20 adsorption effect is better, from the point of view of purity, the macroporous resin is more suitable for the purification of PAs than Sephadex LH-20. According to the correlation coefficient obtained from each model, the Langmuir model better described the adsorption properties. The best temperature for adsorption of PAs by AB-8 was 25 °C. All resin exhibited negative heat of adsorption, indicating exothermic physical adsorption. The method used in this study can significantly improve the yield and antioxidant activity of PAs in grape seeds and has the advantages of simple operation, fast acceleration, low energy consumption, and high extraction rate, which can lay the foundation for the fine processing and utilization of grape seeds, as well as provide a theoretical basis for the rational development of grape seed PAs.
This research was supported by the Pegatron wine production area characteristic wine technology integration Foundation of China (TG20240330), and the China Postdoctoral Science Foundation (Grant No. 2024M762638).
-
The authors confirm contribution to the paper as follows: study conception and design: Song H, Liu S; data collection: Huang Y; analysis and interpretation of results: Song H, Huan J; draft manuscript preparation: Zhang C, Song H; supervision: Yuan C, Li J; resources: Yuan C. All authors reviewed the results and approved the final version of the manuscript.
-
This published article contain all of the data generated or analyzed during this work.
-
The authors declare that they have no conflict of interest.
- Copyright: © 2025 by the author(s). Published by Maximum Academic Press on behalf of China Agricultural University, Zhejiang University and Shenyang Agricultural University. This article is an open access article distributed under Creative Commons Attribution License (CC BY 4.0), visit https://creativecommons.org/licenses/by/4.0/.
-
About this article
Cite this article
Song H, Liu S, Huang Y, Huan J, Zhang C, et al. 2025. Comparative study on purification optimization and characteristics of grape seed proanthocyanidins. Food Innovation and Advances 4(2): 191−200 doi: 10.48130/fia-0025-0021 

Comparative study on purification optimization and characteristics of grape seed proanthocyanidins
- Received: 12 September 2024
- Revised: 14 January 2025
- Accepted: 15 January 2025
- Published online: 28 May 2025
Abstract: Grape seed is the main source of proanthocyanidins (PAs), which have antioxidant, anticancer, and anti-inflammatory activities. Resin can realize the separation and purification of substances and is frequently used for purifying PAs. Sephadex LH-20 is mostly used for PA classification; however, less relevant studies comparing the purification of the Sephadex LH-20 and the resin have been conducted. In this study, the purification capacity of proanthocyanidins from grape seeds was compared between the AB-8 macroporous resin and the Sephadex LH-20. The adsorption mechanism was described by Langmuir and Freundlich equations, and the purification parameters were optimized by adsorption–desorption experiments and Box-Behnken design. The components and contents of the purified products were analyzed, it was compared with crude products. The results showed that the optimal process parameters included the following: loading volume 25 mg/mL; loading volume 1 mL; washing with 5-bed volume (BV) distilled water to remove impurities; and about 60% (v/v) acetone washing with 4.3−4.6 BV desorption. After purification, the concentration of the monomer and purity were improved, and the AB-8 resin was more suitable as the purification filler than the Sephadex LH-20. In conclusion, optimization of the purification parameters of the AB-8 macroporous resin and the Sephadex LH-20 has the characteristics of high efficiency, economy, and environmental protection, and has significant industrial production potential, providing a direction for the reuse of waste wine residue.