-
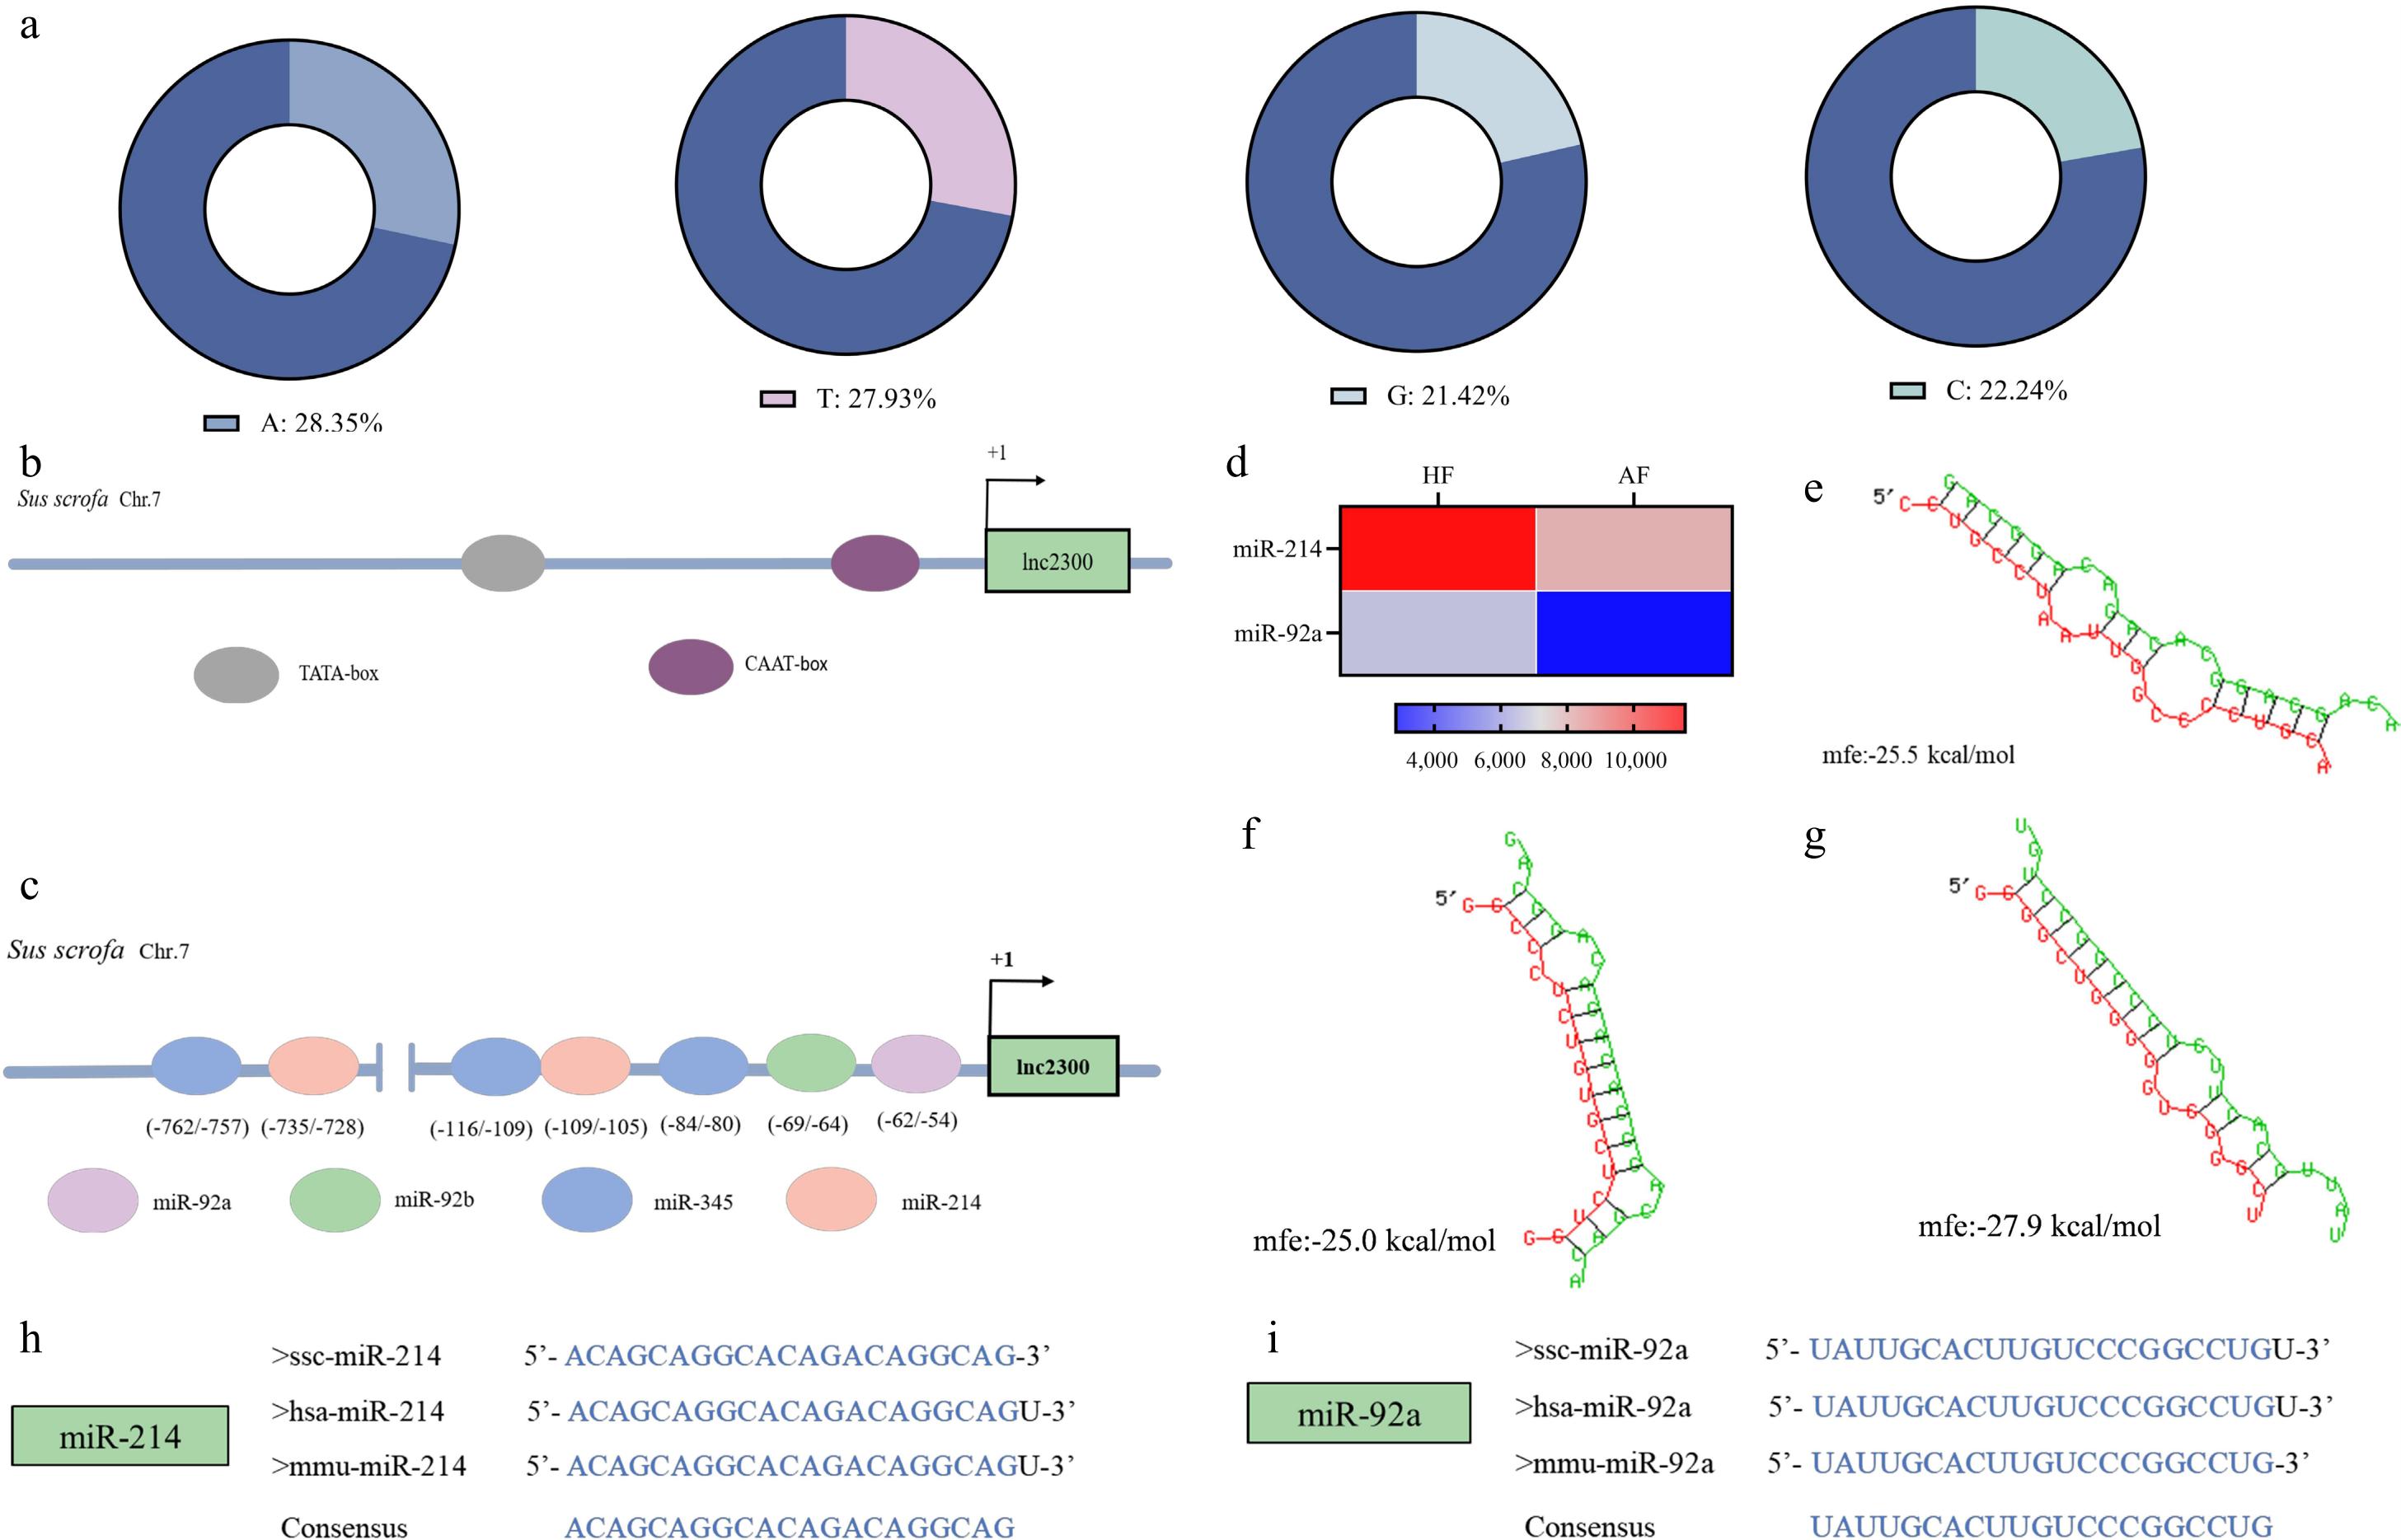
Figure 1.
Isolation and characterization of lnc2300 promoter. (a) Base composition of the lnc2300 promoter. (b) TATA-box and CAAT-box in the lnc2300 promoter are shown schematically. (c) miRNAs and MREs with strong binding capacity in the lnc2300 promoter are shown schematically. (d) Two miRNAs differentially expressed during follicular atresia. Chip data were obtained from a previous study[21]. The MRE motifs of (f) miR-214, (g) miR-92a, in the lnc2300 promoter were predicted by RNAhybrid. Alignment of mature sequences of (h) miR-214 and (i) miR-92a among humans, mouse, and pigs.
-
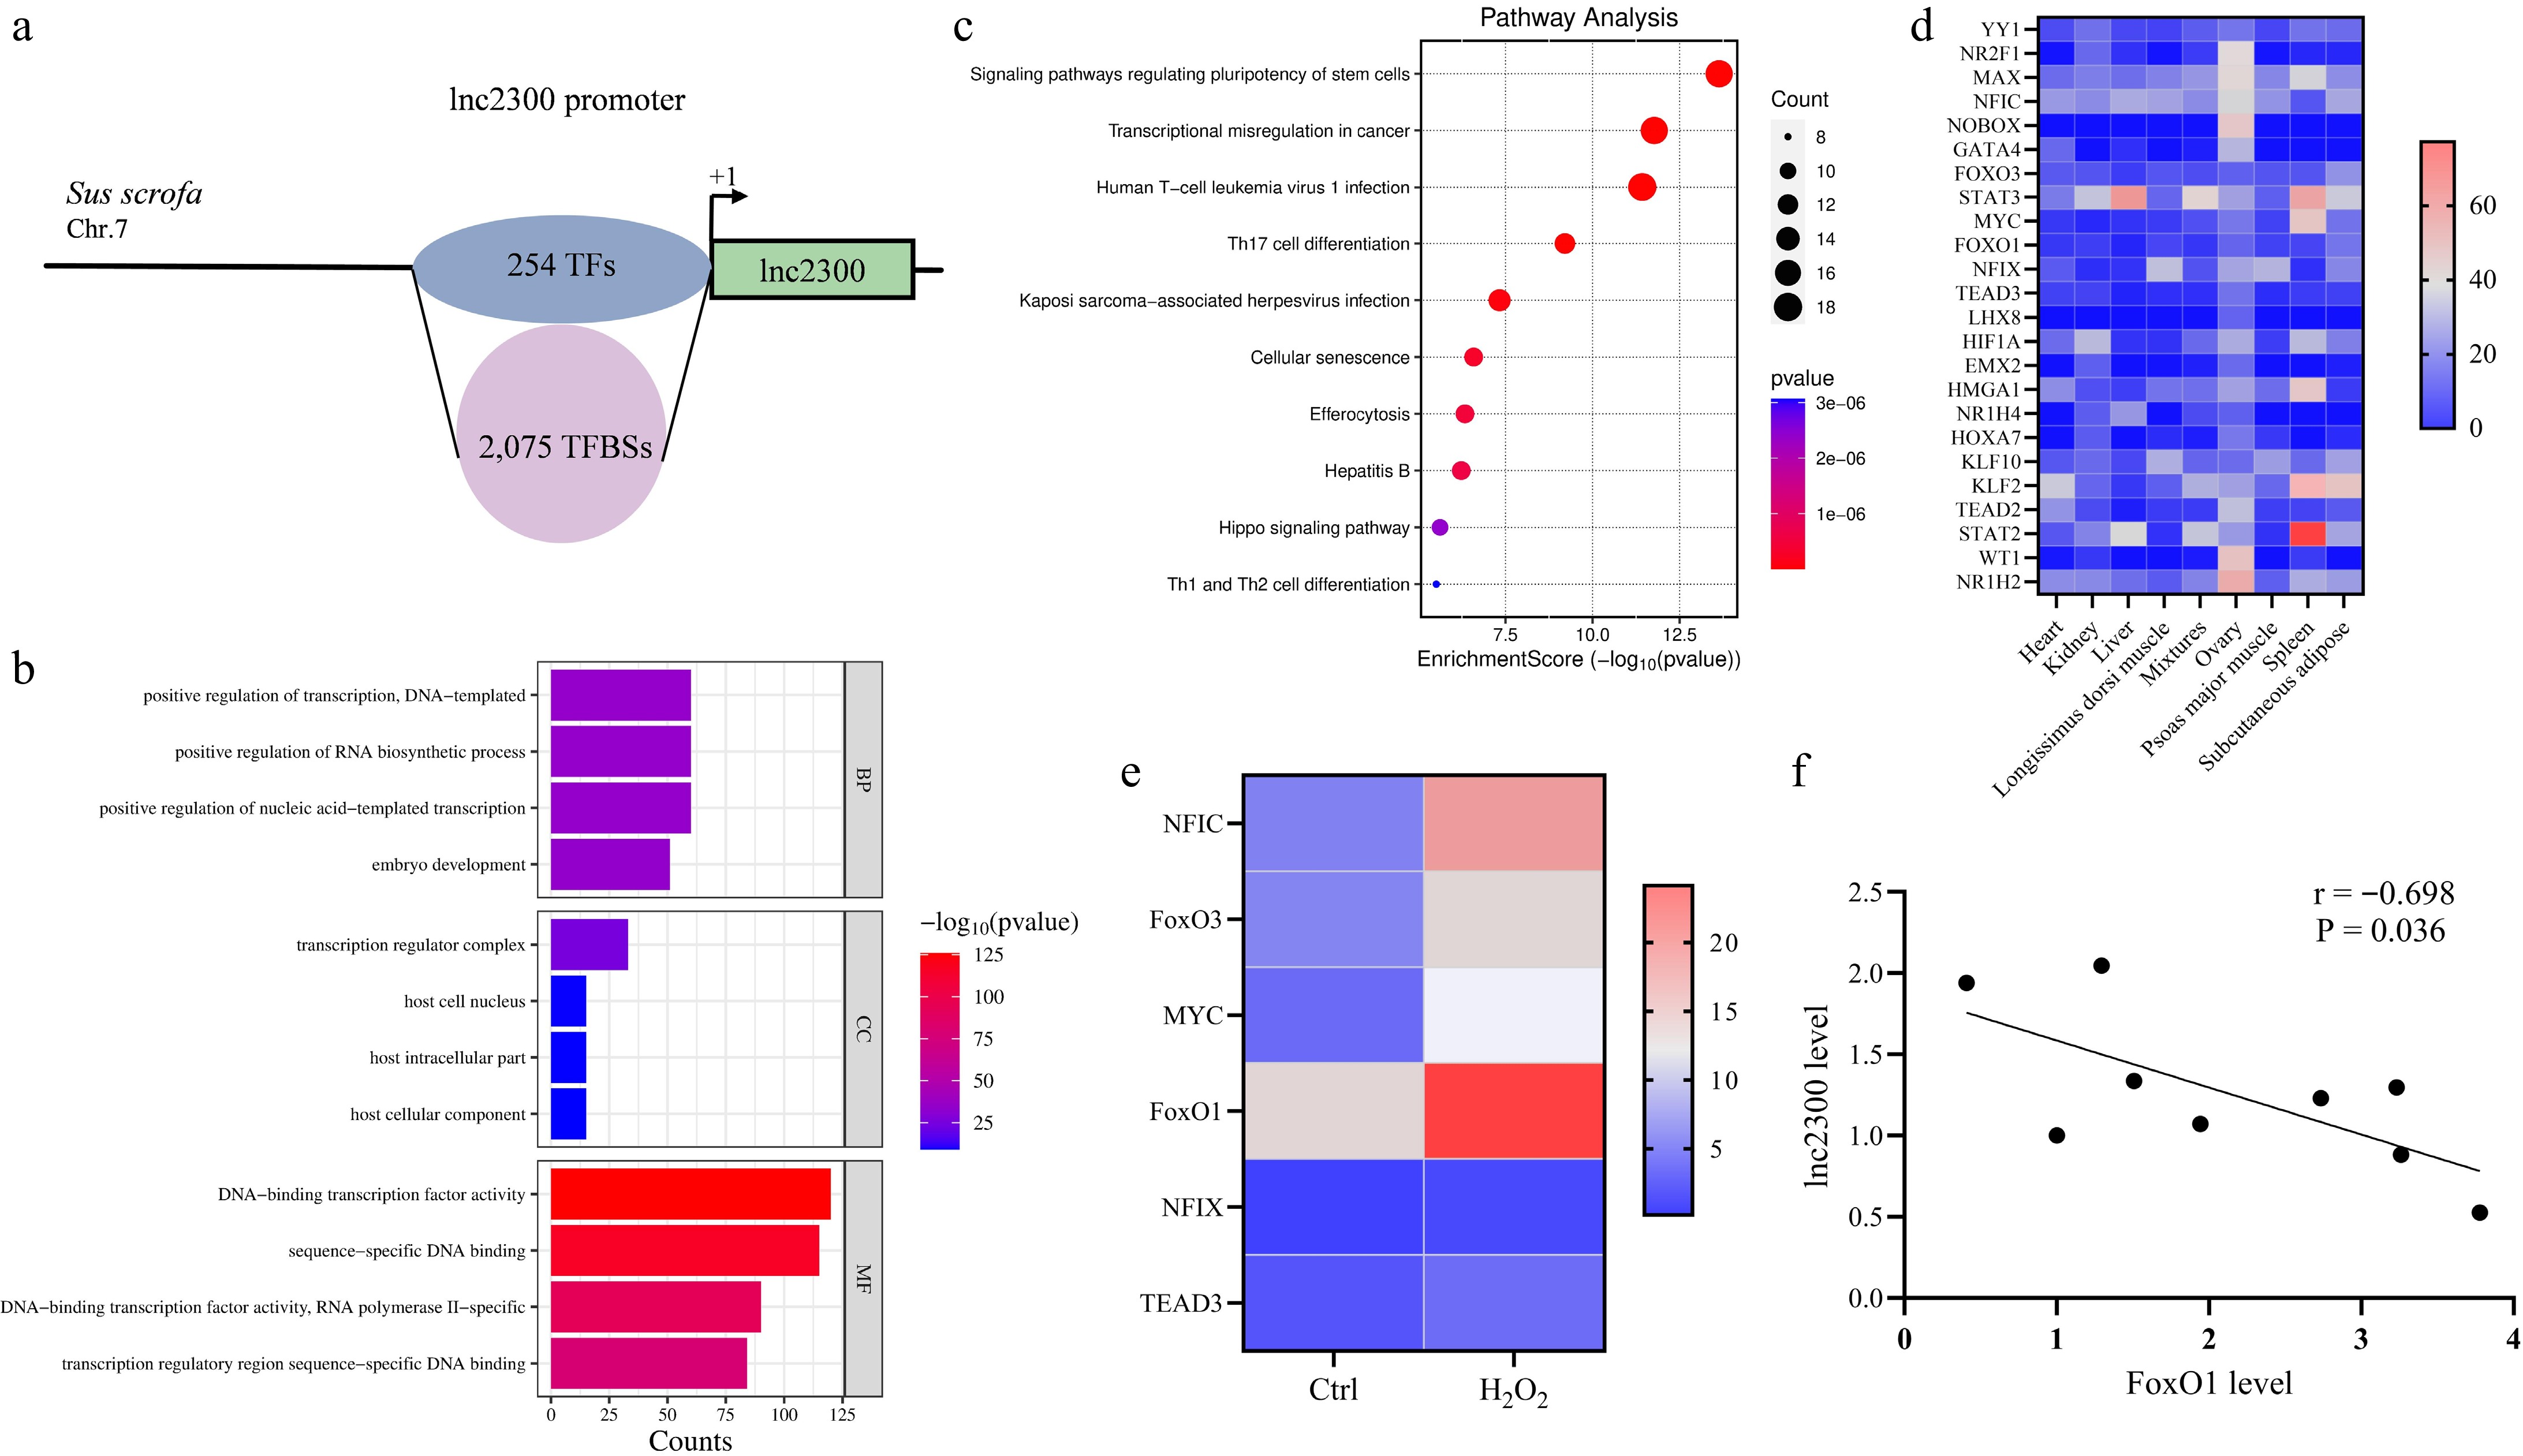
Figure 2.
FoxO1 is a potential transcription factor of lnc2300. (a) Schematic presentation of TFBSs in the lnc2300 promoter. GO and KEGG analysis of transcription factors that potentially bound to the lnc2300 promoter. (b) GO analysis. (c) KEGG analysis. (d) Heatmap indicating the high abundance of transcription factors in sow ovary. Data were obtained from NCBI database. (e) Heatmaps showing the expression of transcription factors with highly abundant in oxidative stress-stimulated sGCs. Data for RNA-seq were obtained from our previous study[23]. (f) Correlation analysis between FoxO1 and lnc2300 levels in sow antral follicles. n = 9.
-
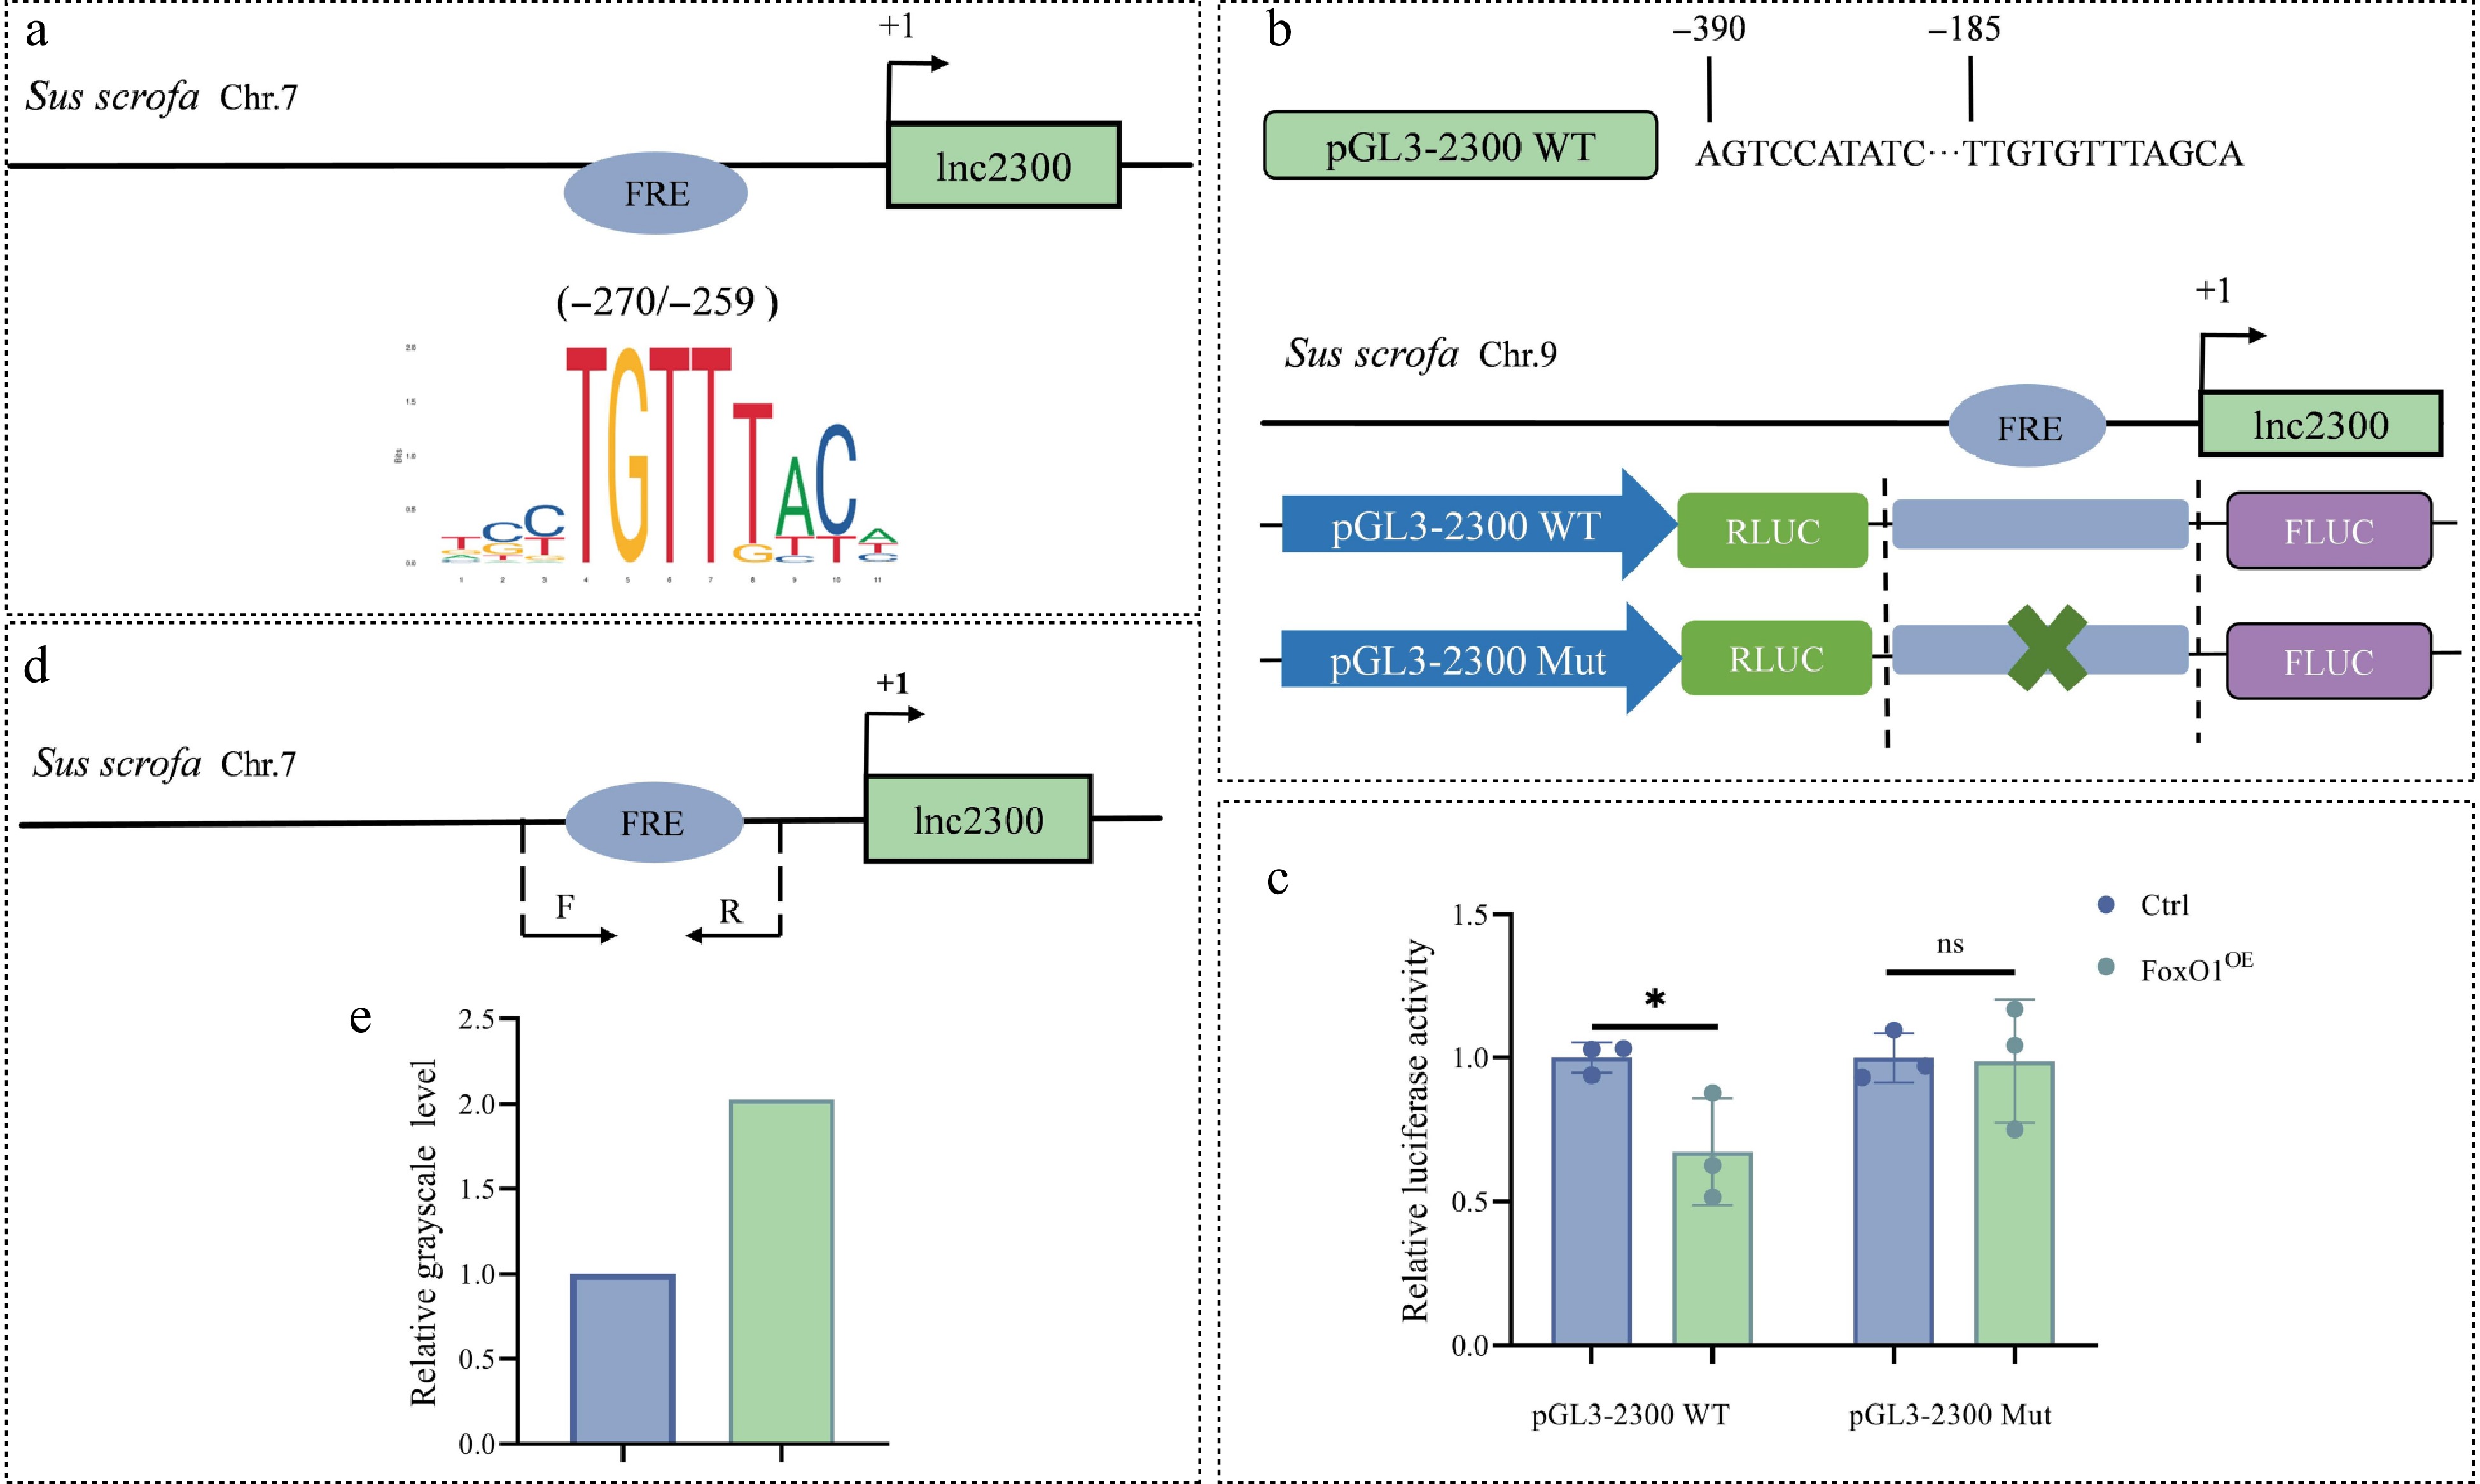
Figure 3.
FoxO1 binds to the lnc2300 promoter to suppress its transcriptional activity. (a) Schematic presentation of FRE motif in the lnc2300 promoter. FRE, FoxO1 response element. (b) Reporters of the lnc2300 promoter with FRE motif and its mutated version are shown schematically. (c) Reporter assay. pcDNA3.1-FoxO1 and reporters were co-transfected into KGN cells, luciferase activity was determined. (d) ChIP-PCR primers located in the lnc2300 promoter are shown schematically. (e) Enriched FoxO1 protein at the lnc2300 promoter was determined with ChIP. Data are expressed as mean ± SEM (n = 3). * p < 0.05. ns, no significance.
-
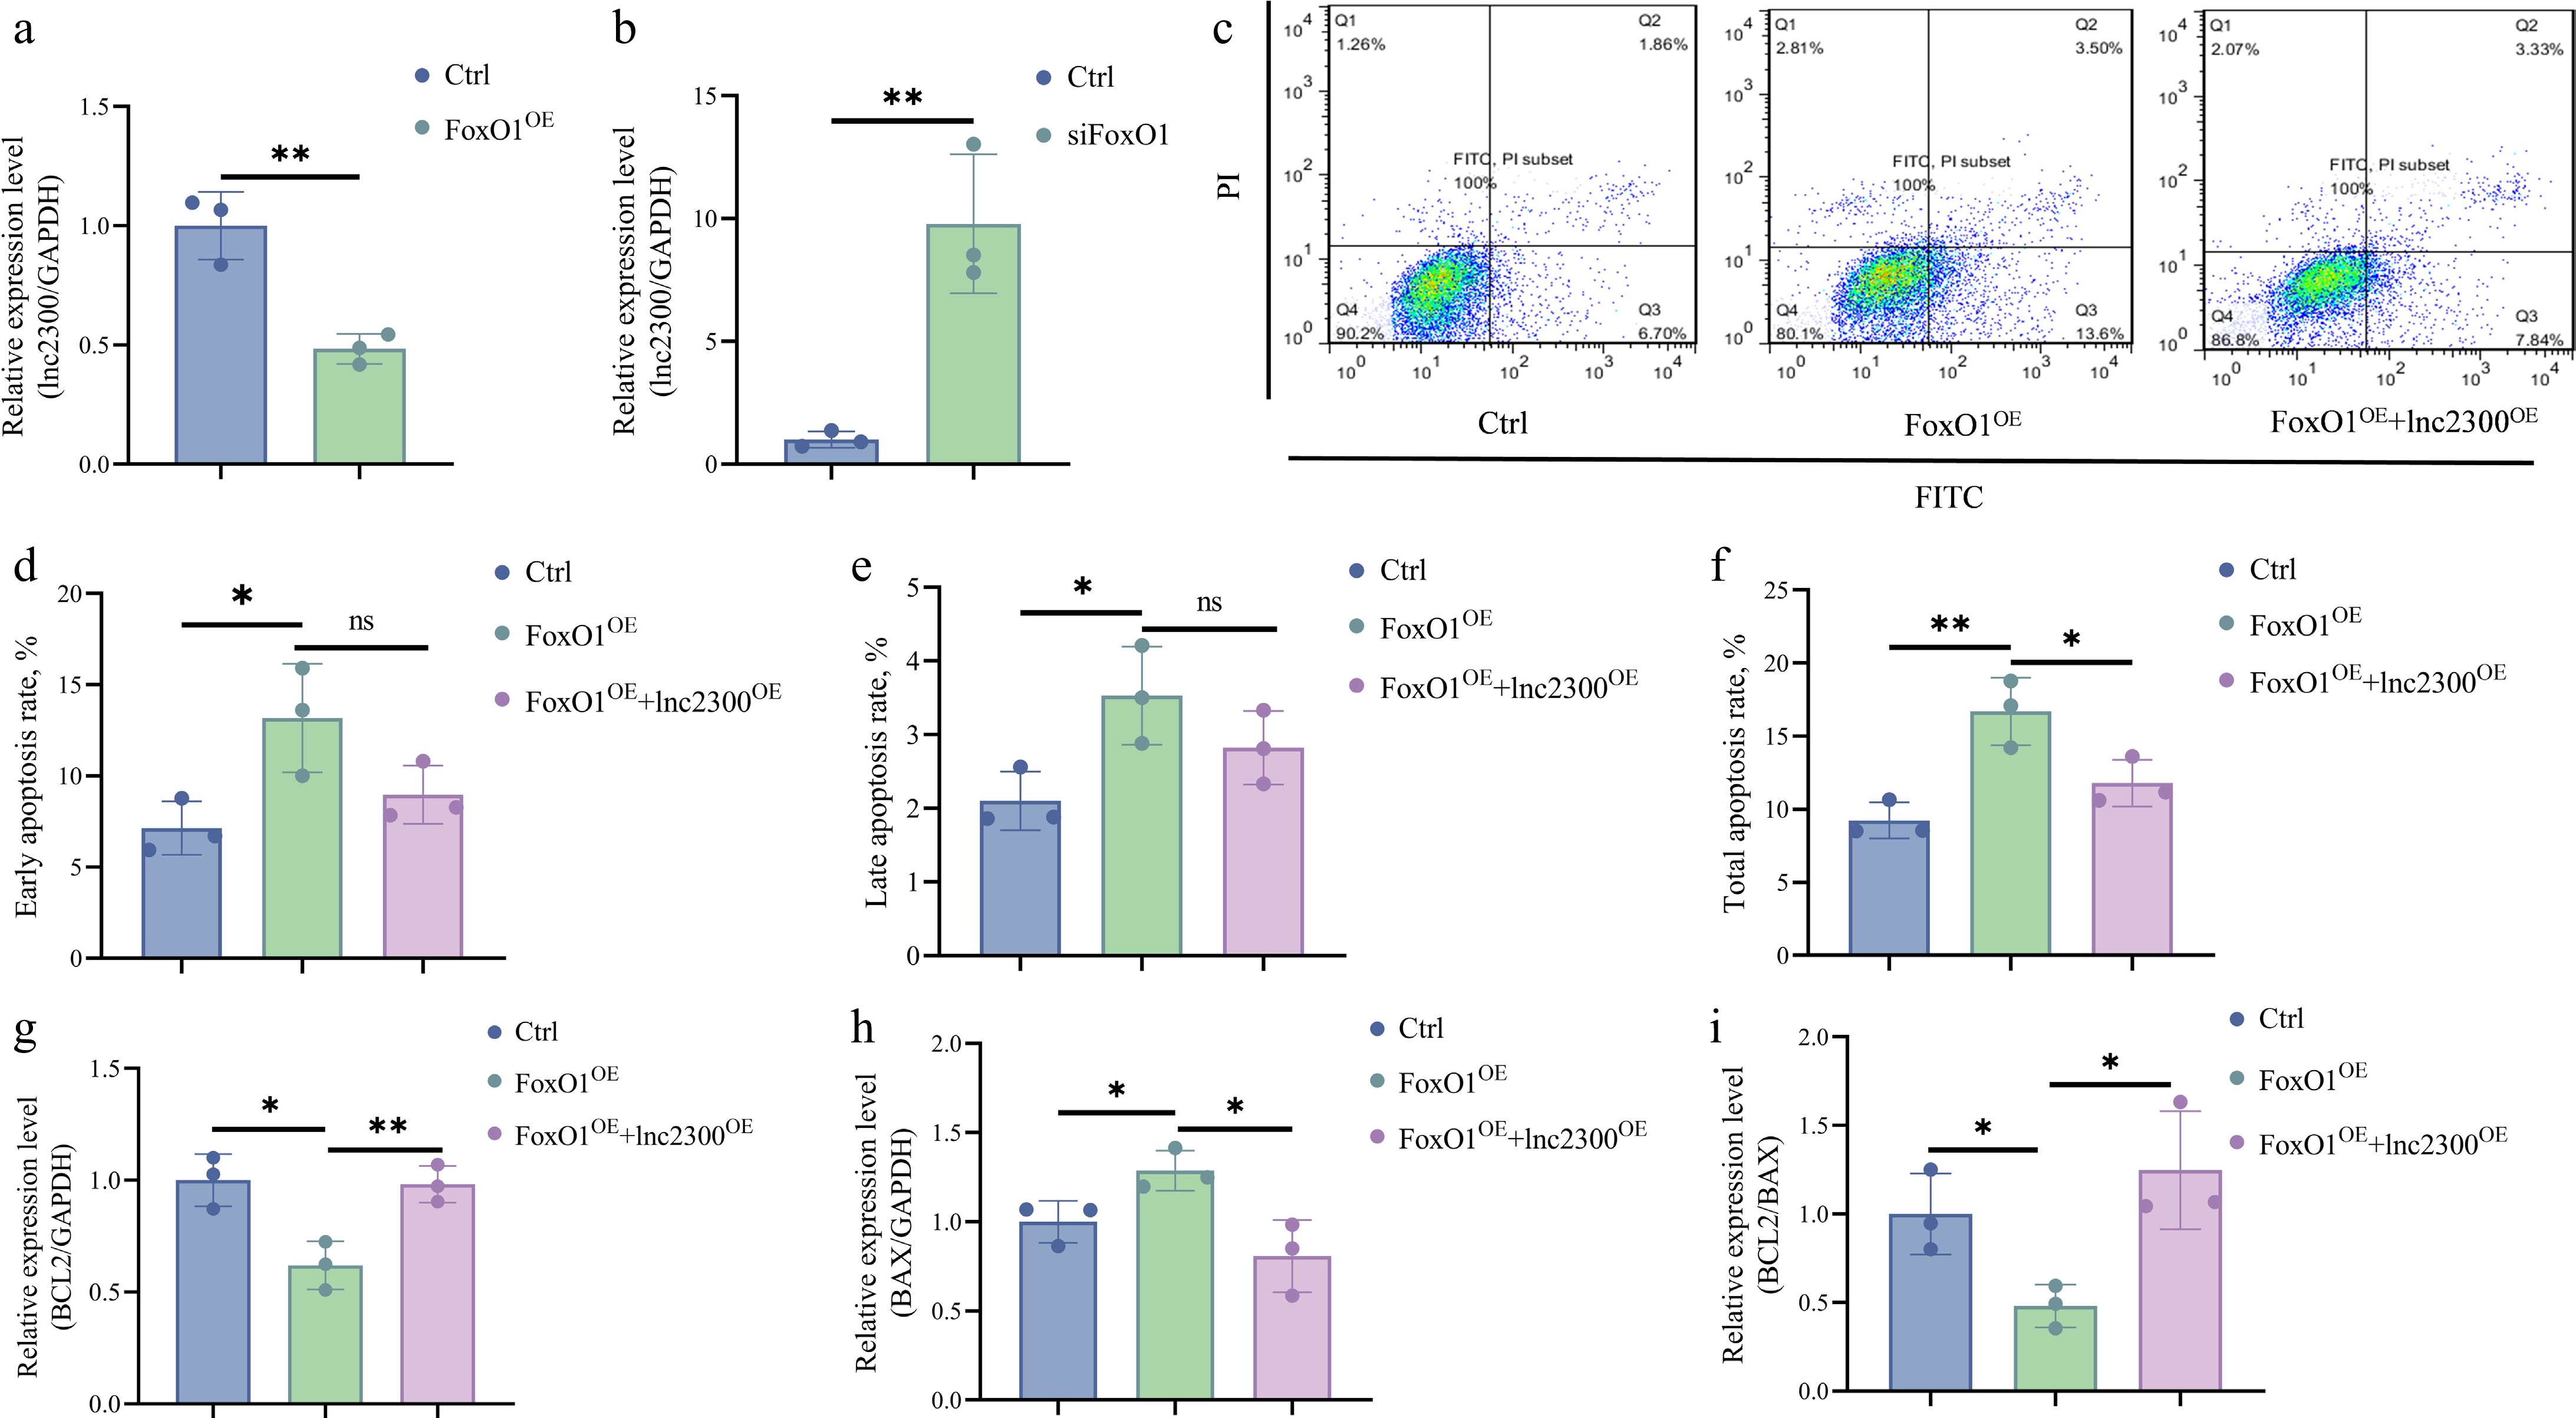
Figure 4.
FoxO1 suppresses transcription and function of lnc2300 in sGCs. sGCs were transfected with (a) pcDNA3.1-FoxO1 or (b) FoxO1-siRNA, lnc2300 levels were determined using qRT-PCR. (c)−(f) Apoptosis assay. sGCs were co-transfected with pcDNA3.1-FoxO1 and pcDNA3.1-lnc2300, apoptosis rate was determined by FACS. sGCs were co-transfected with pcDNA3.1-FoxO1 and pcDNA3.1-lnc2300, mRNA levels of (g) BCL2 and (h) BAX were determined, and the (i) BCL2/BAX ratio was analyzed. Data are expressed as mean ± SEM (n = 3). * p < 0.05. ** p < 0.01. ns, no significance.
-
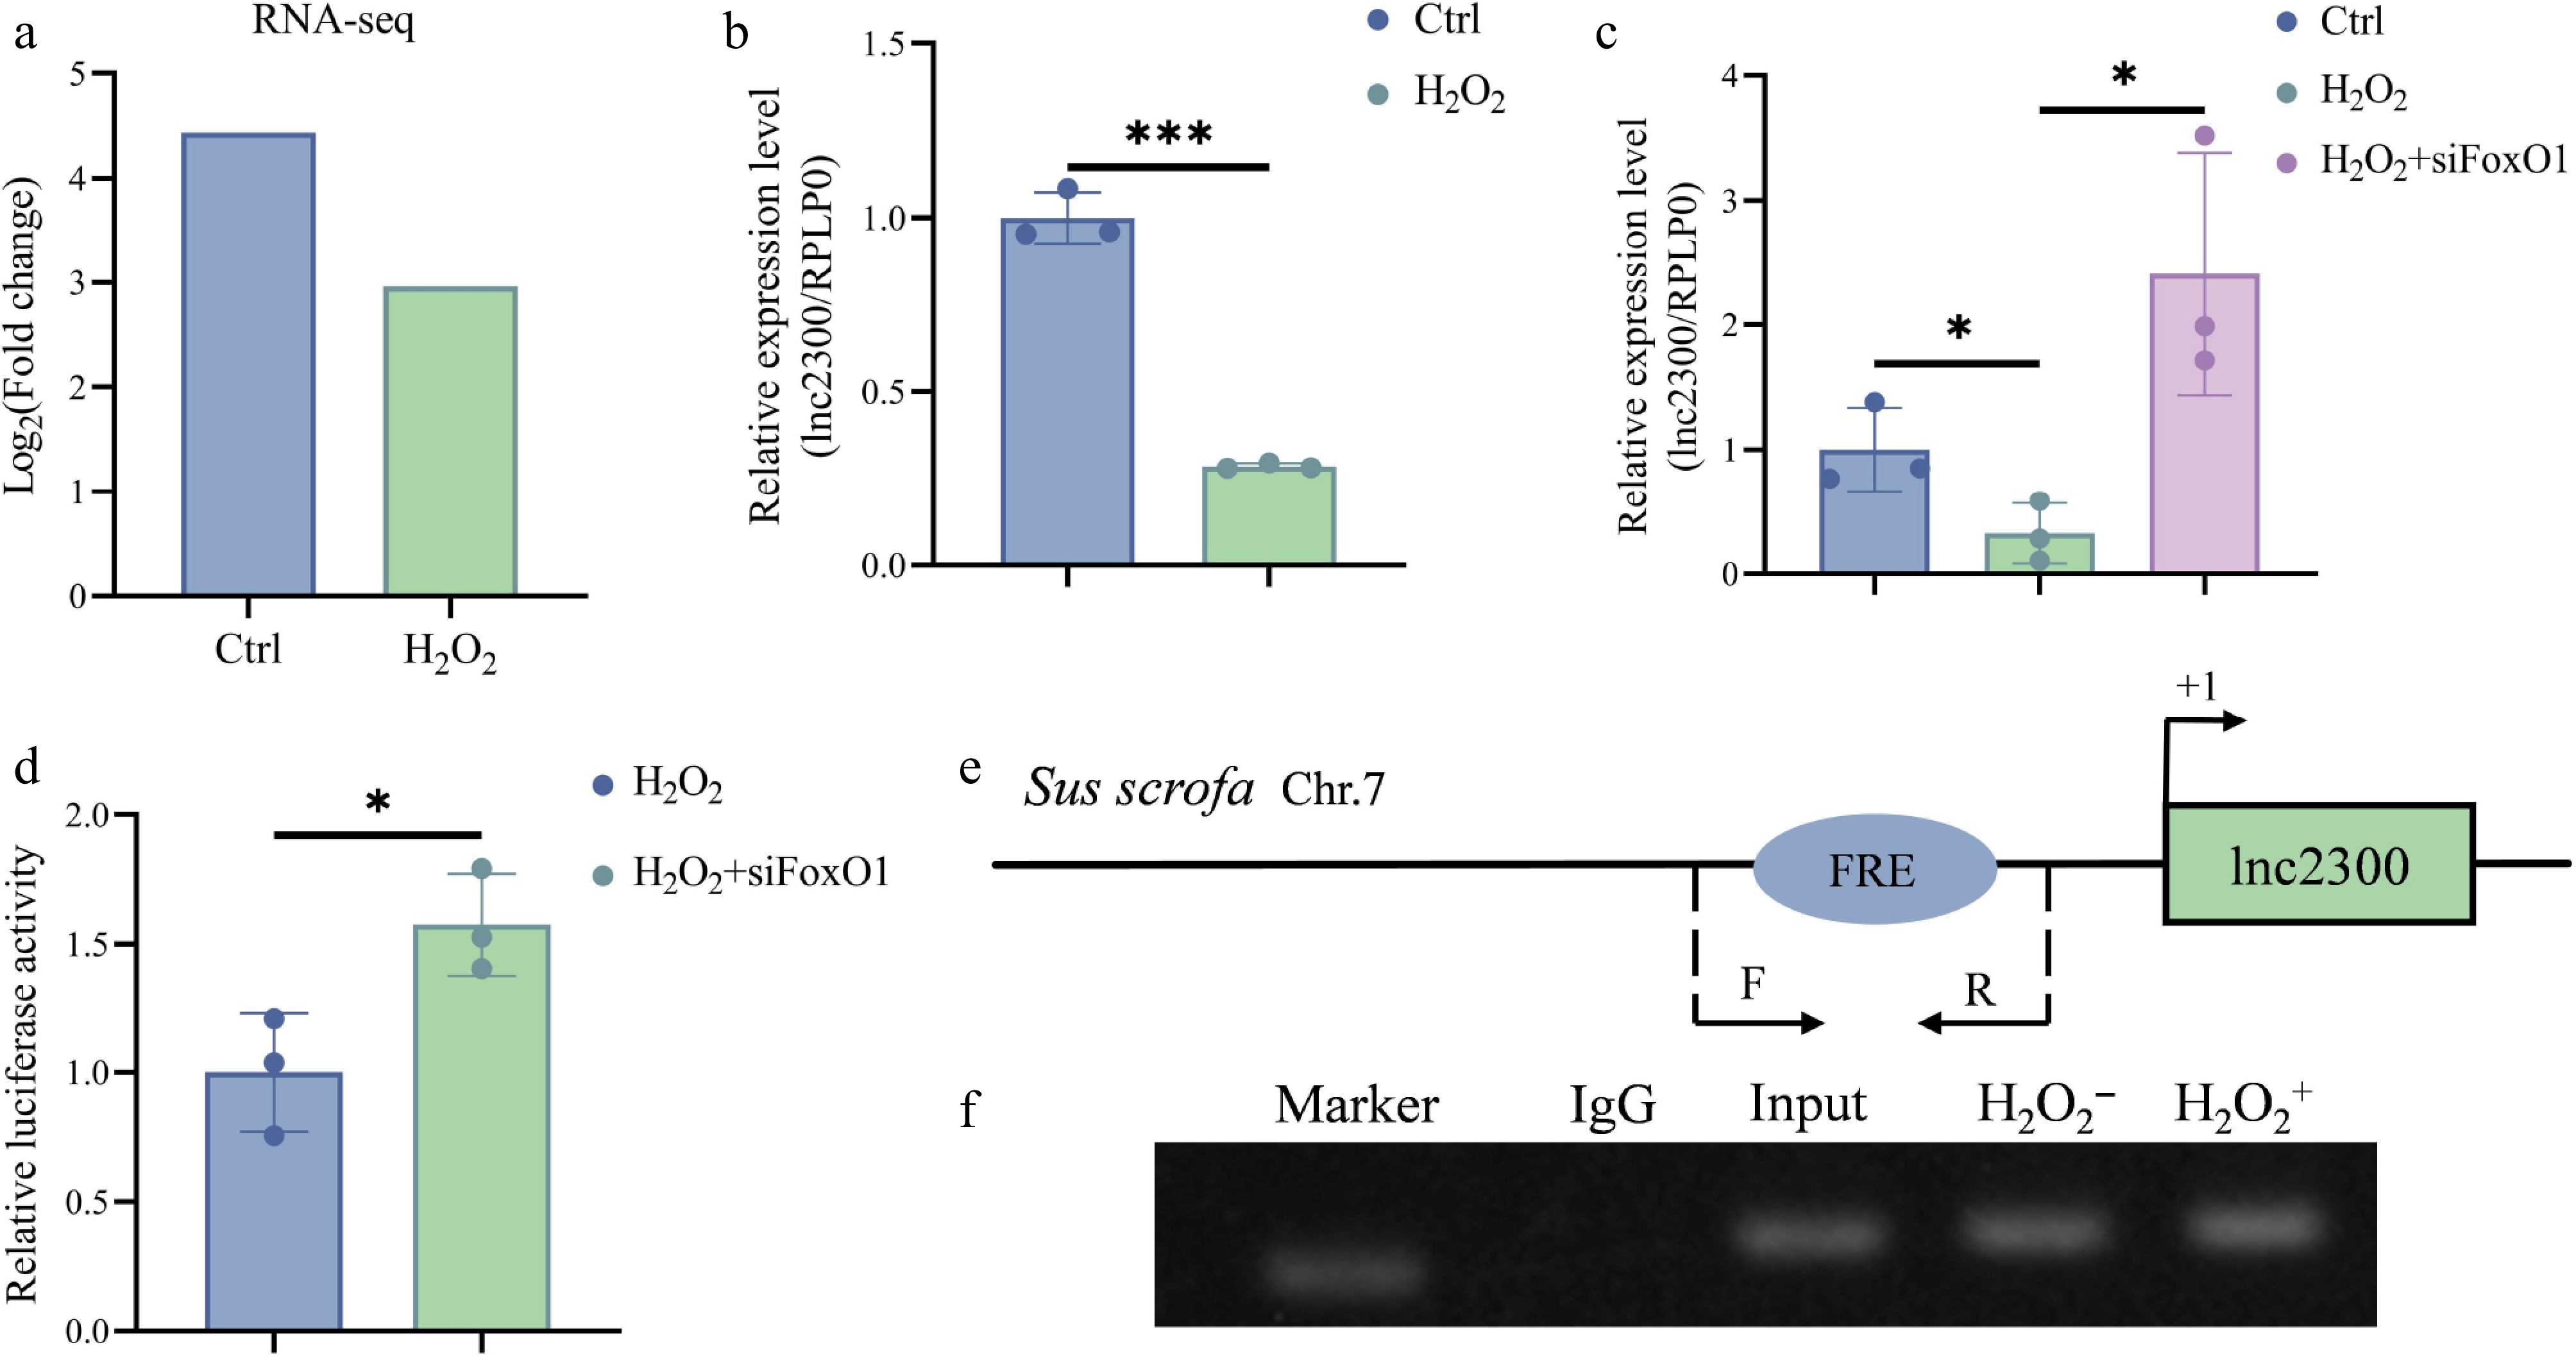
Figure 5.
FoxO1 mediates oxidative stress inhibition of lnc2300 transcription in sGCs. (a) lnc2300 was transcriptionally downregulated in oxidative stress-stimulated sGCs. Data was obtained from our previous RNA-seq[23]. (b) sGCs were exposed with H2O2, lnc2300 levels were determined with qRT-PCR. (c) sGCs were co-treated with H2O2 and FoxO1-siRNA, lnc2300 levels were determined with qRT-PCR. (d) sGCs were co-treated with reporter of the lnc2300 promoter, H2O2 and FoxO1-siRNA, luciferase activity was determined. (e) Specific primers are designed, to determine the (f) enriched FoxO1 protein on the lnc2300 promoter with ChIP assay, (f) in sGCs with or without H2O2 expose. Data are expressed as mean ± SEM (n = 3). * p < 0.05. *** p < 0.001.
-
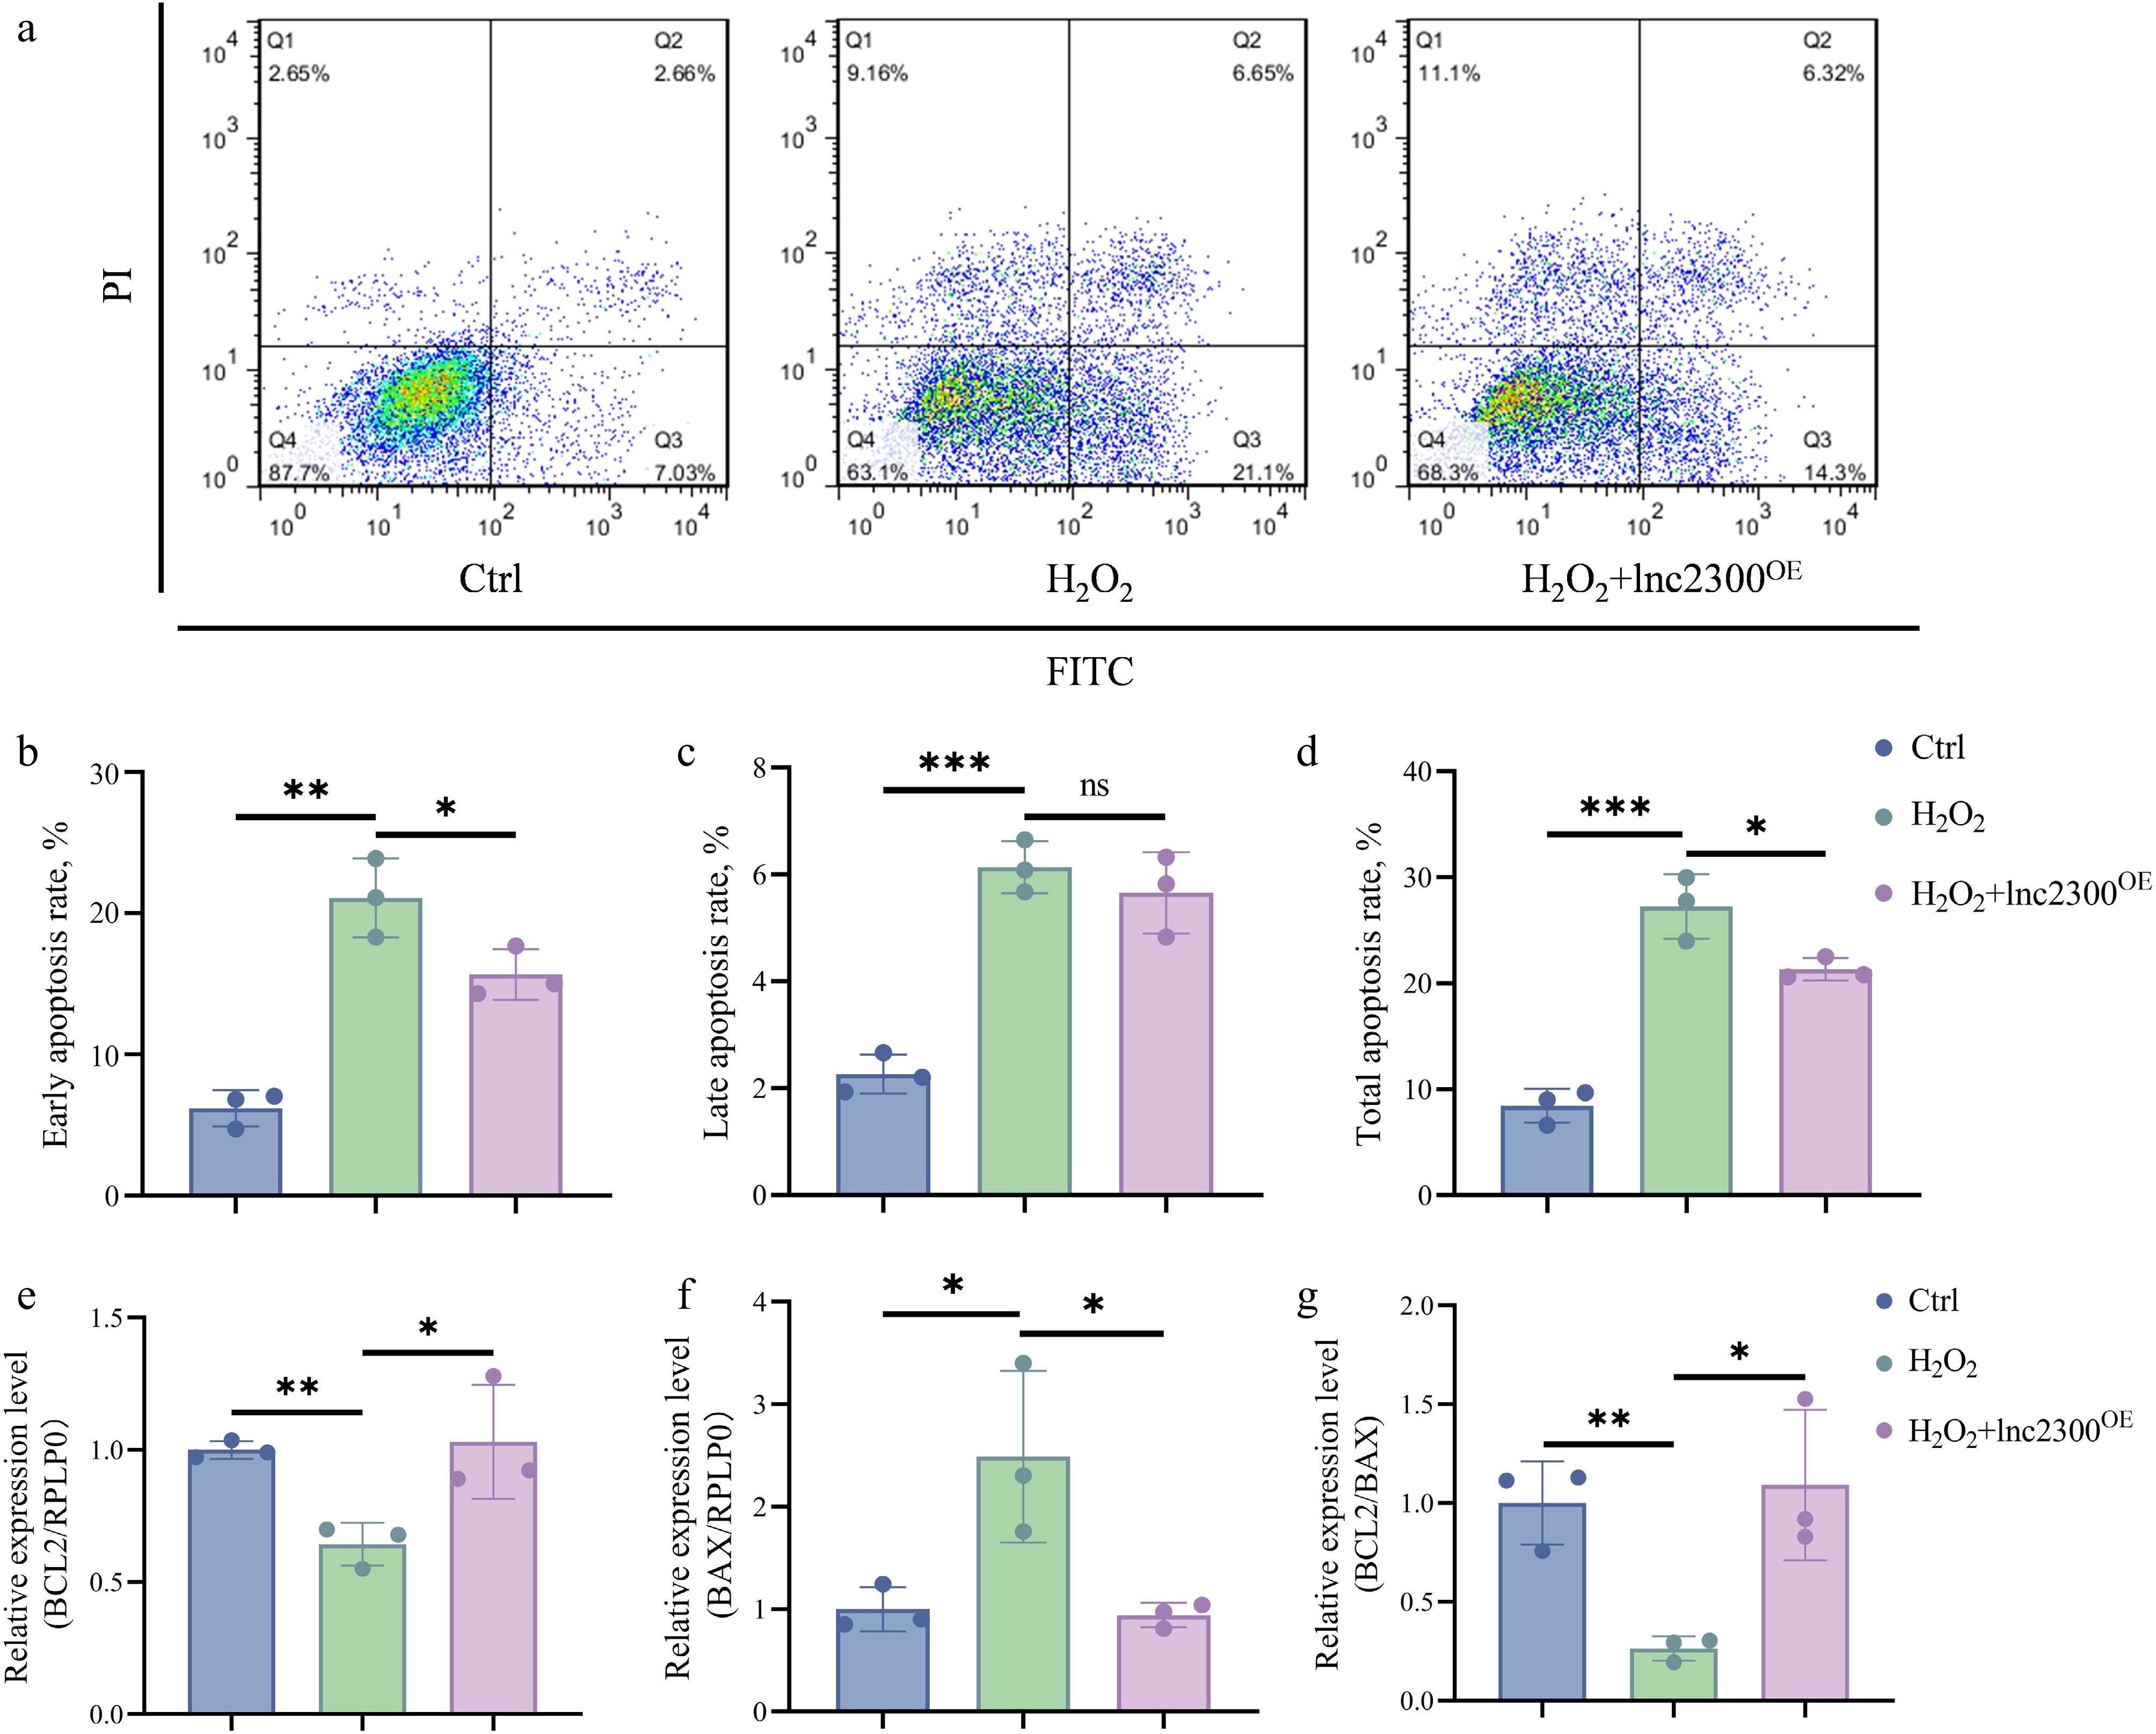
Figure 6.
lnc2300 mediates oxidative stress induction of sGC apoptosis. (a)−(d) Apoptosis assay. sGCs were co-treated with H2O2 and pcDNA3.1-lnc2300, apoptosis rate was determined by FACS. sGCs were co-treated with H2O2 and pcDNA3.1-lnc2300, mRNA levels of (e) BCL2 and (f) BAX were determined, and the (g) BCL2/BAX ratio was analyzed. Data are expressed as mean ± SEM (n = 3). * p < 0.05. ** p < 0.01. *** p < 0.001. ns, no significance.
-
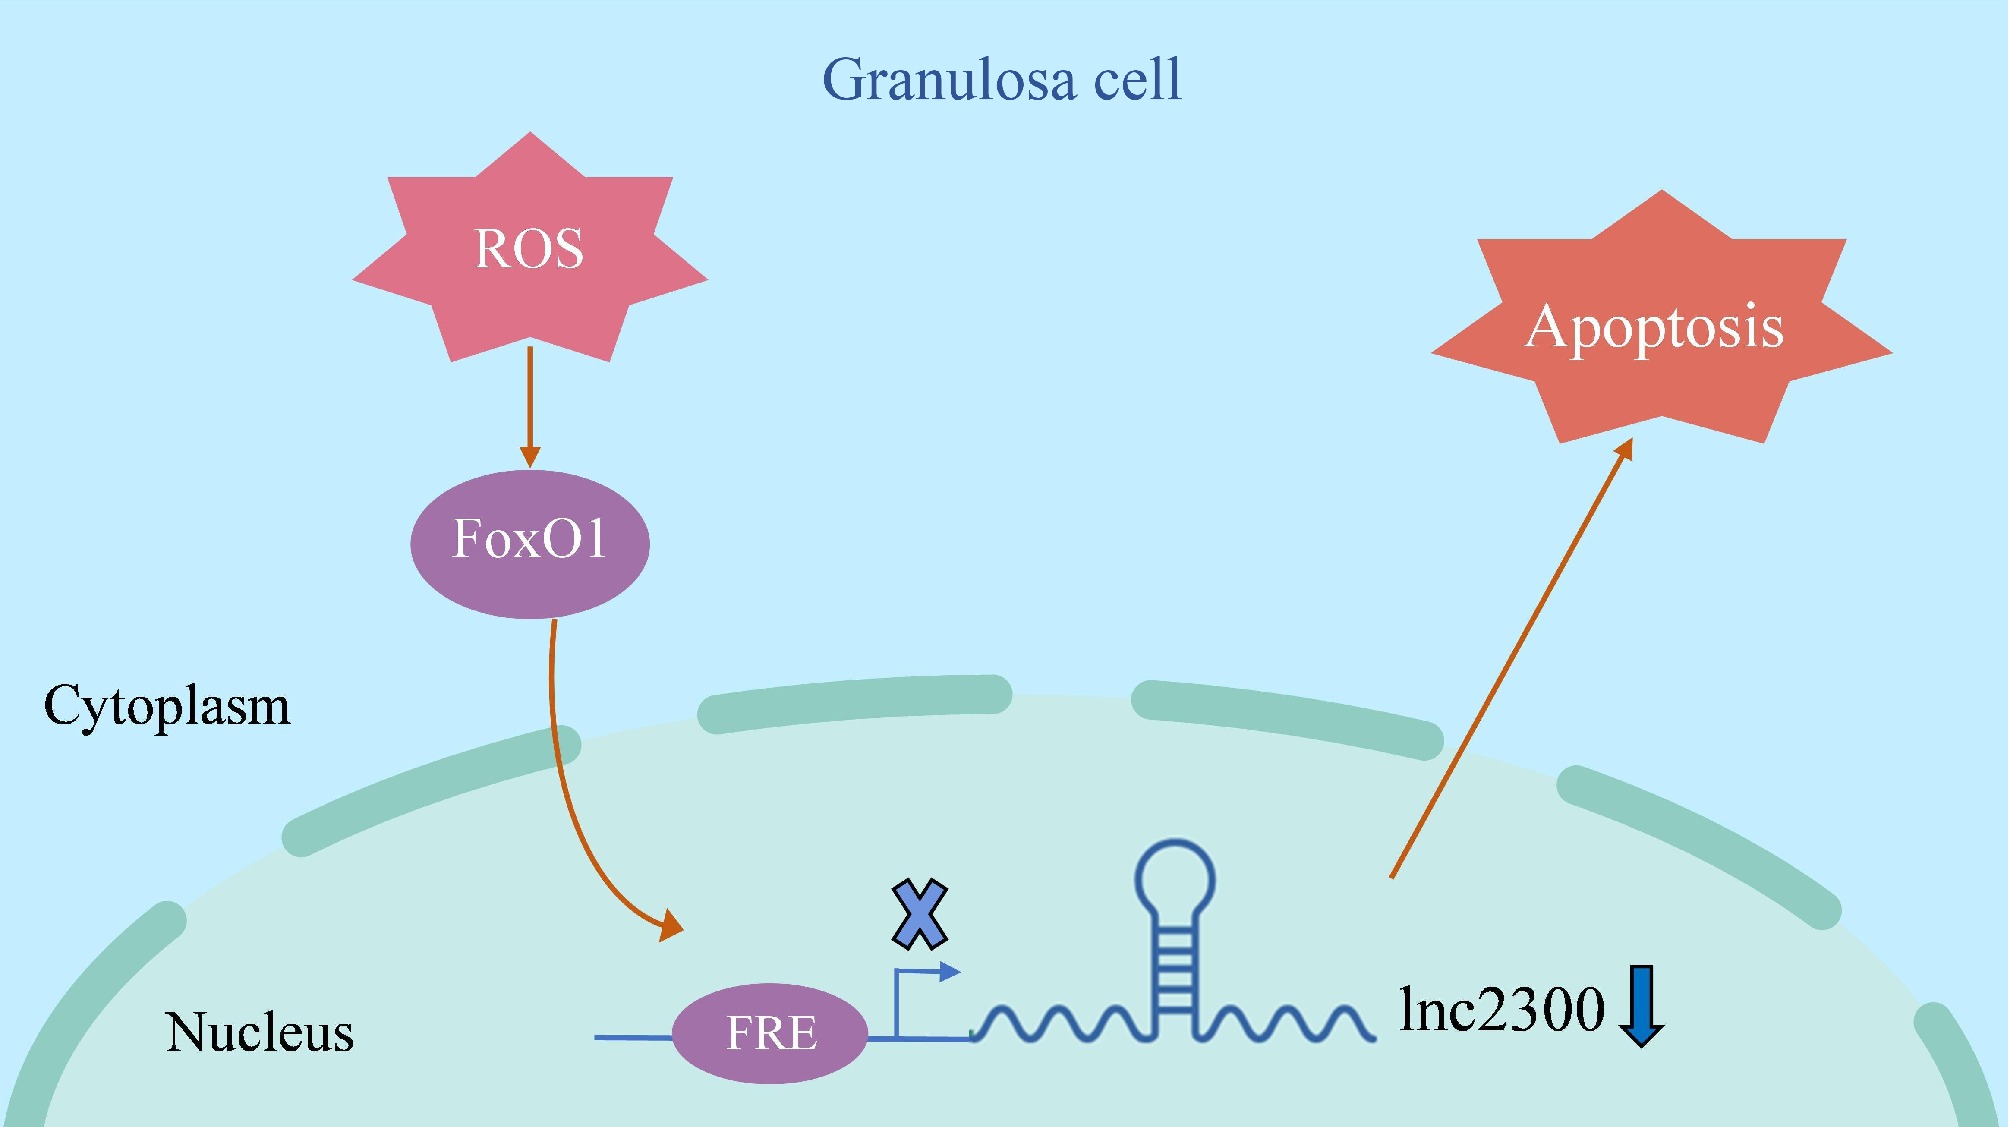
Figure 7.
Schematic illustration of lnc2300-mediated oxidative stress induction of sGCs. When sGCs undergo oxidative stress, its effector FoxO1 levels increase, which leads to transcription repressor FoxO1 enrichment in the promoter of transcriptional target lnc2300, thereby inhibiting lnc2300 transcription and causing cell apoptosis.
-
Name Sequence (5 'to 3') FoxO1-siRNA Sense: GCGGCAAAGAUGGCUUCUATT Antisense: UAGAAGCCAUCUUUGCCGCTT lnc2300-siRNA Sense: GAAUGCAGCGACUAUUAAUTT Antisense: AUUAAUAGUCGCUGCAUUCTT Table 1.
siRNA used in this study.
-
Genes Primer sequences (5' to 3') Tm (°C) Size (bp) lnc2300 F: GCAAATCACGGTCAACCTACGA 60 181 R: TCAGCCAAAGAGACACATCTGAAAT FoxO1 F: GCAAATCGAGTTACGGAGGC 60 170 R: AATGTCATTATGGGGAGGAGAGT BAX F: TTTCTGACGGCAACTTCAACTGGG 64 122 R: TGTCCAGCCCATGATGGTTCTGAT BCL2 F: TTCTTTGAGTTCGGTGGGG 57 195 R: CCAGGAGAAATCAAATAGAGGC GAPDH F: GGACTCATGACCACGGTCCAT 60 163 R: TCAGATCCACAACCGACACGT RPLP0 F: TGCCCAGGGAAGACAG 60 119 R: TCTGCTTGGAGCCCACATT Table 2.
Primers for qRT-PCR.
Figures
(7)
Tables
(2)