-
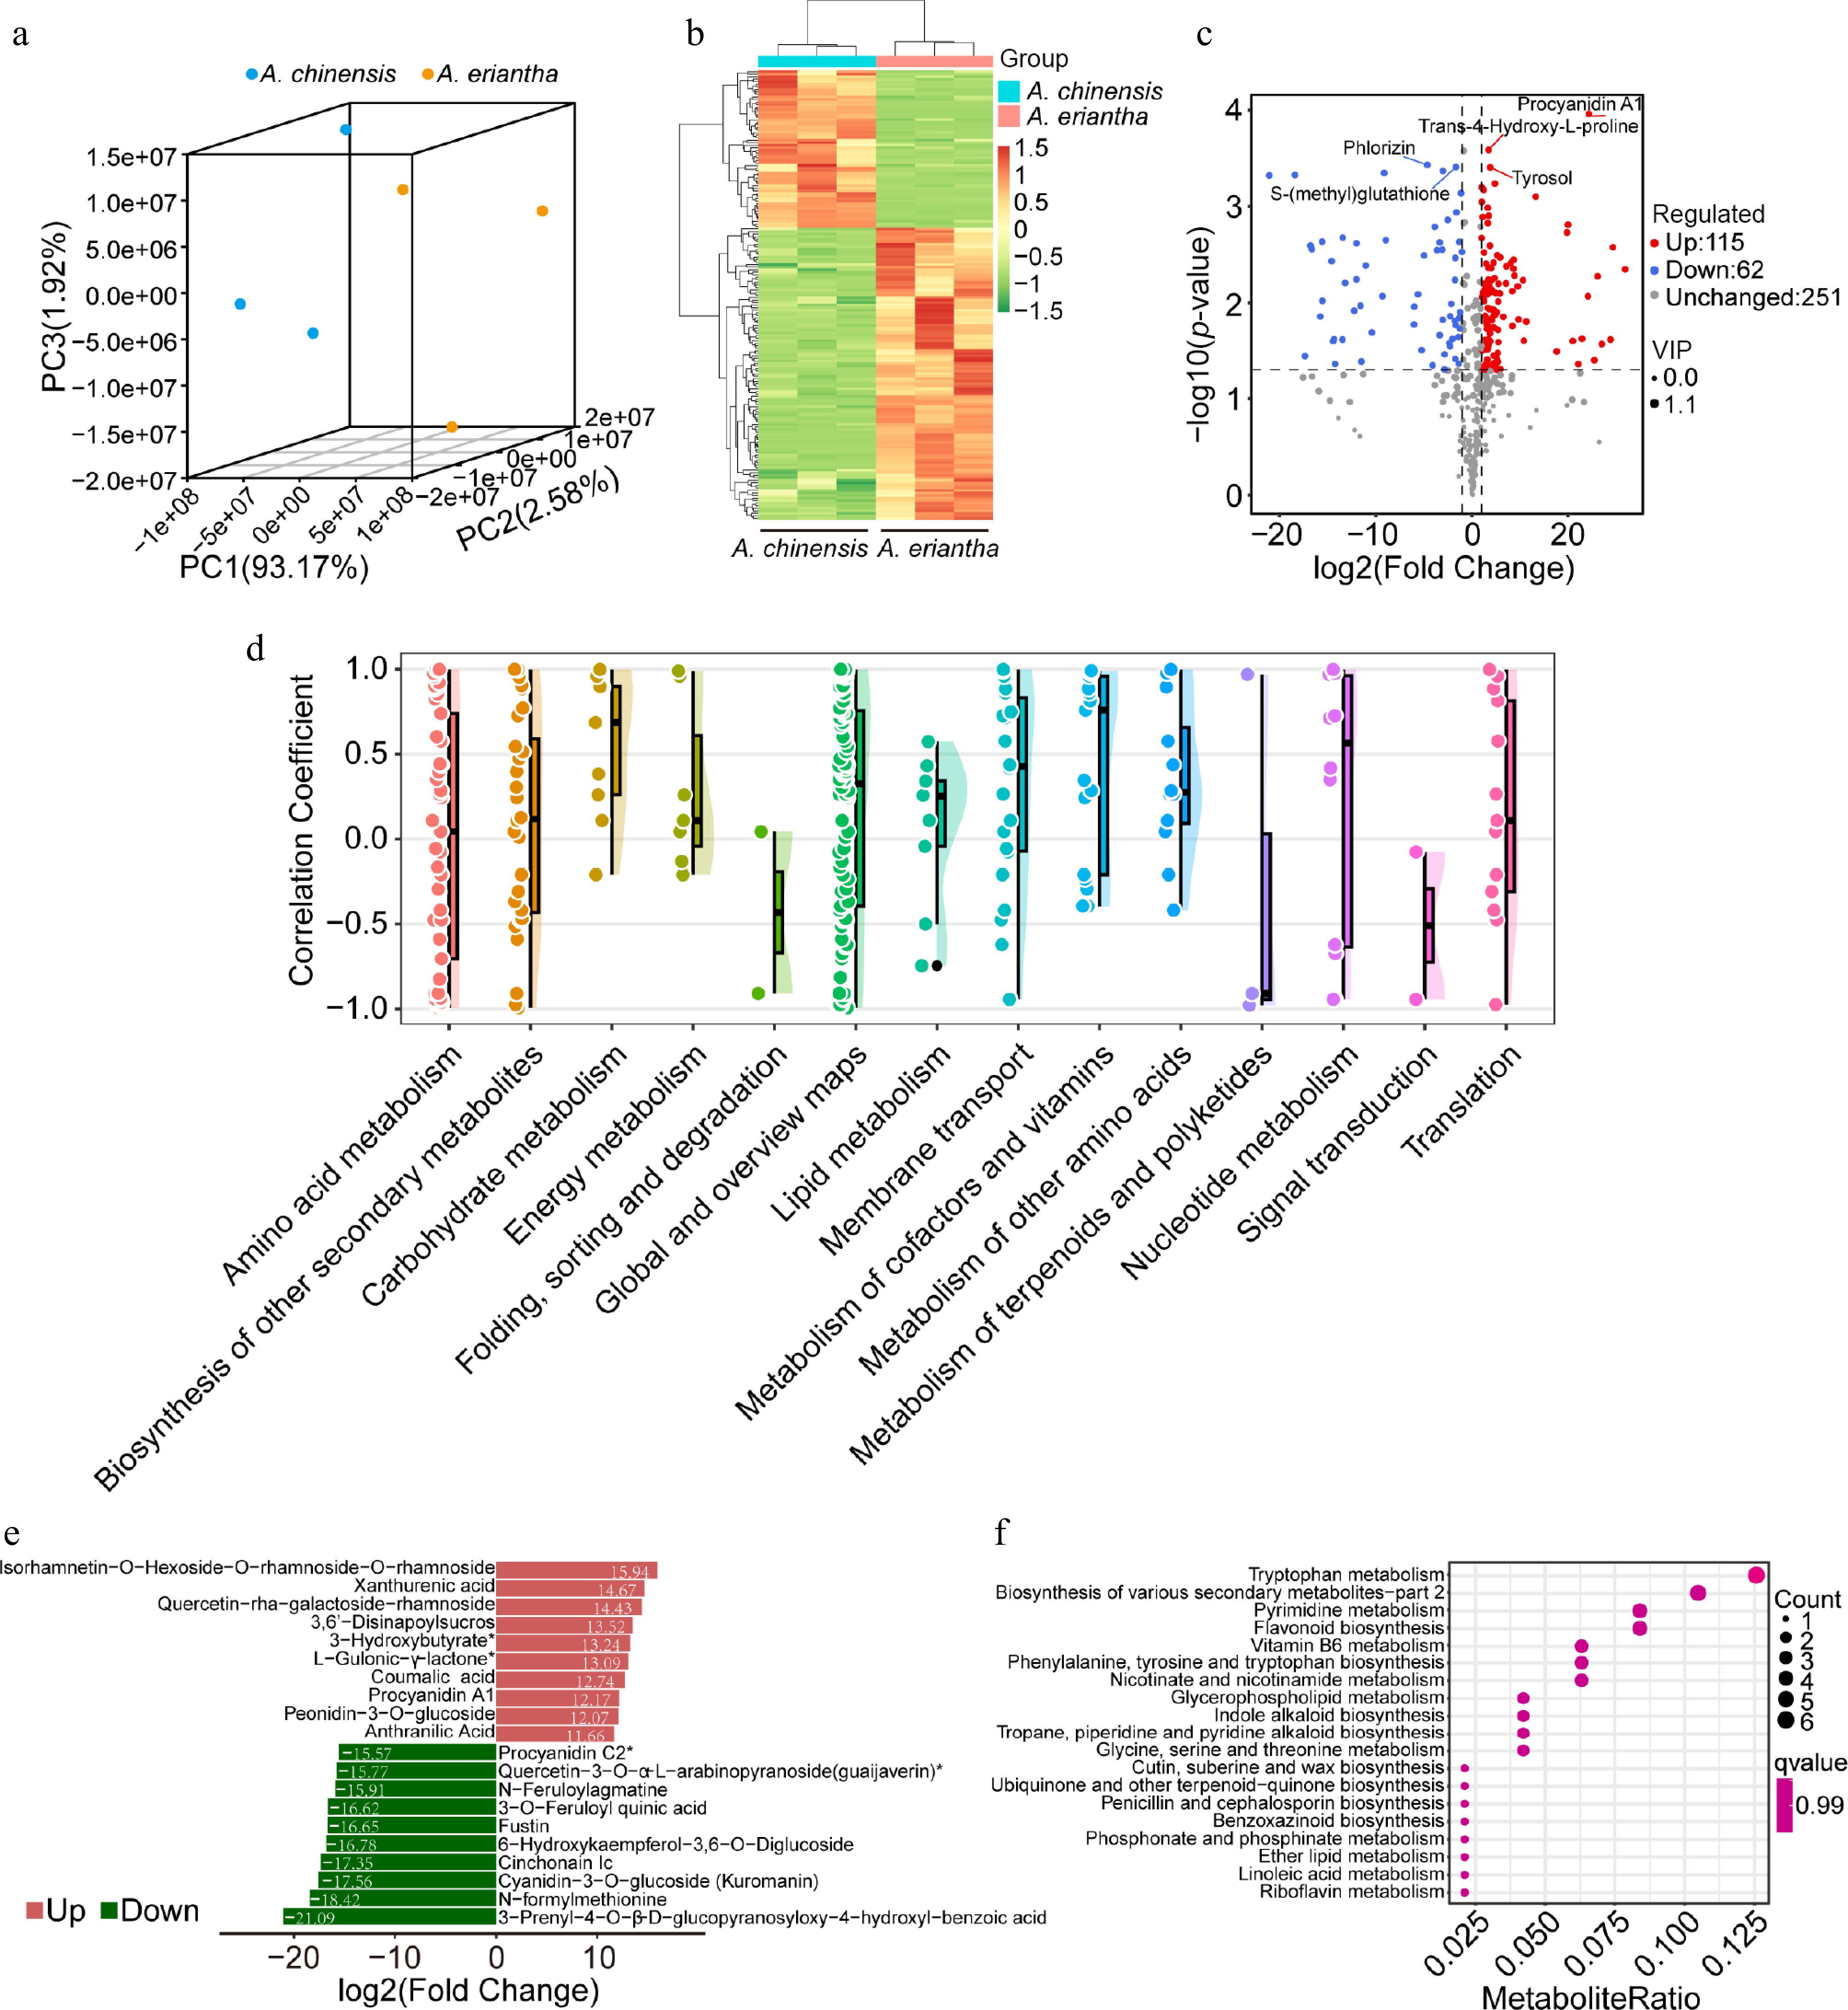
Figure 1.
Analysis of metabolites in A. chinensis and A. eriantha fruits. (a) Clustering of all fruit samples using Principal Component Analysis (PCA). (b) Hierarchical cluster-based heatmap of differential metabolites detected in fruit samples. (c) Volcano plot illustrating the identified differentially accumulated metabolites (DAMs). (d) Correlation coefficients of metabolites content patterns in ripening fruit shared by A. chinensis and A. eriantha. (e) Top 10 upregulated and downregulated metabolites based on log2(Fold Change). (f) Enriched components based on KEGG analysis of all DEGs.
-
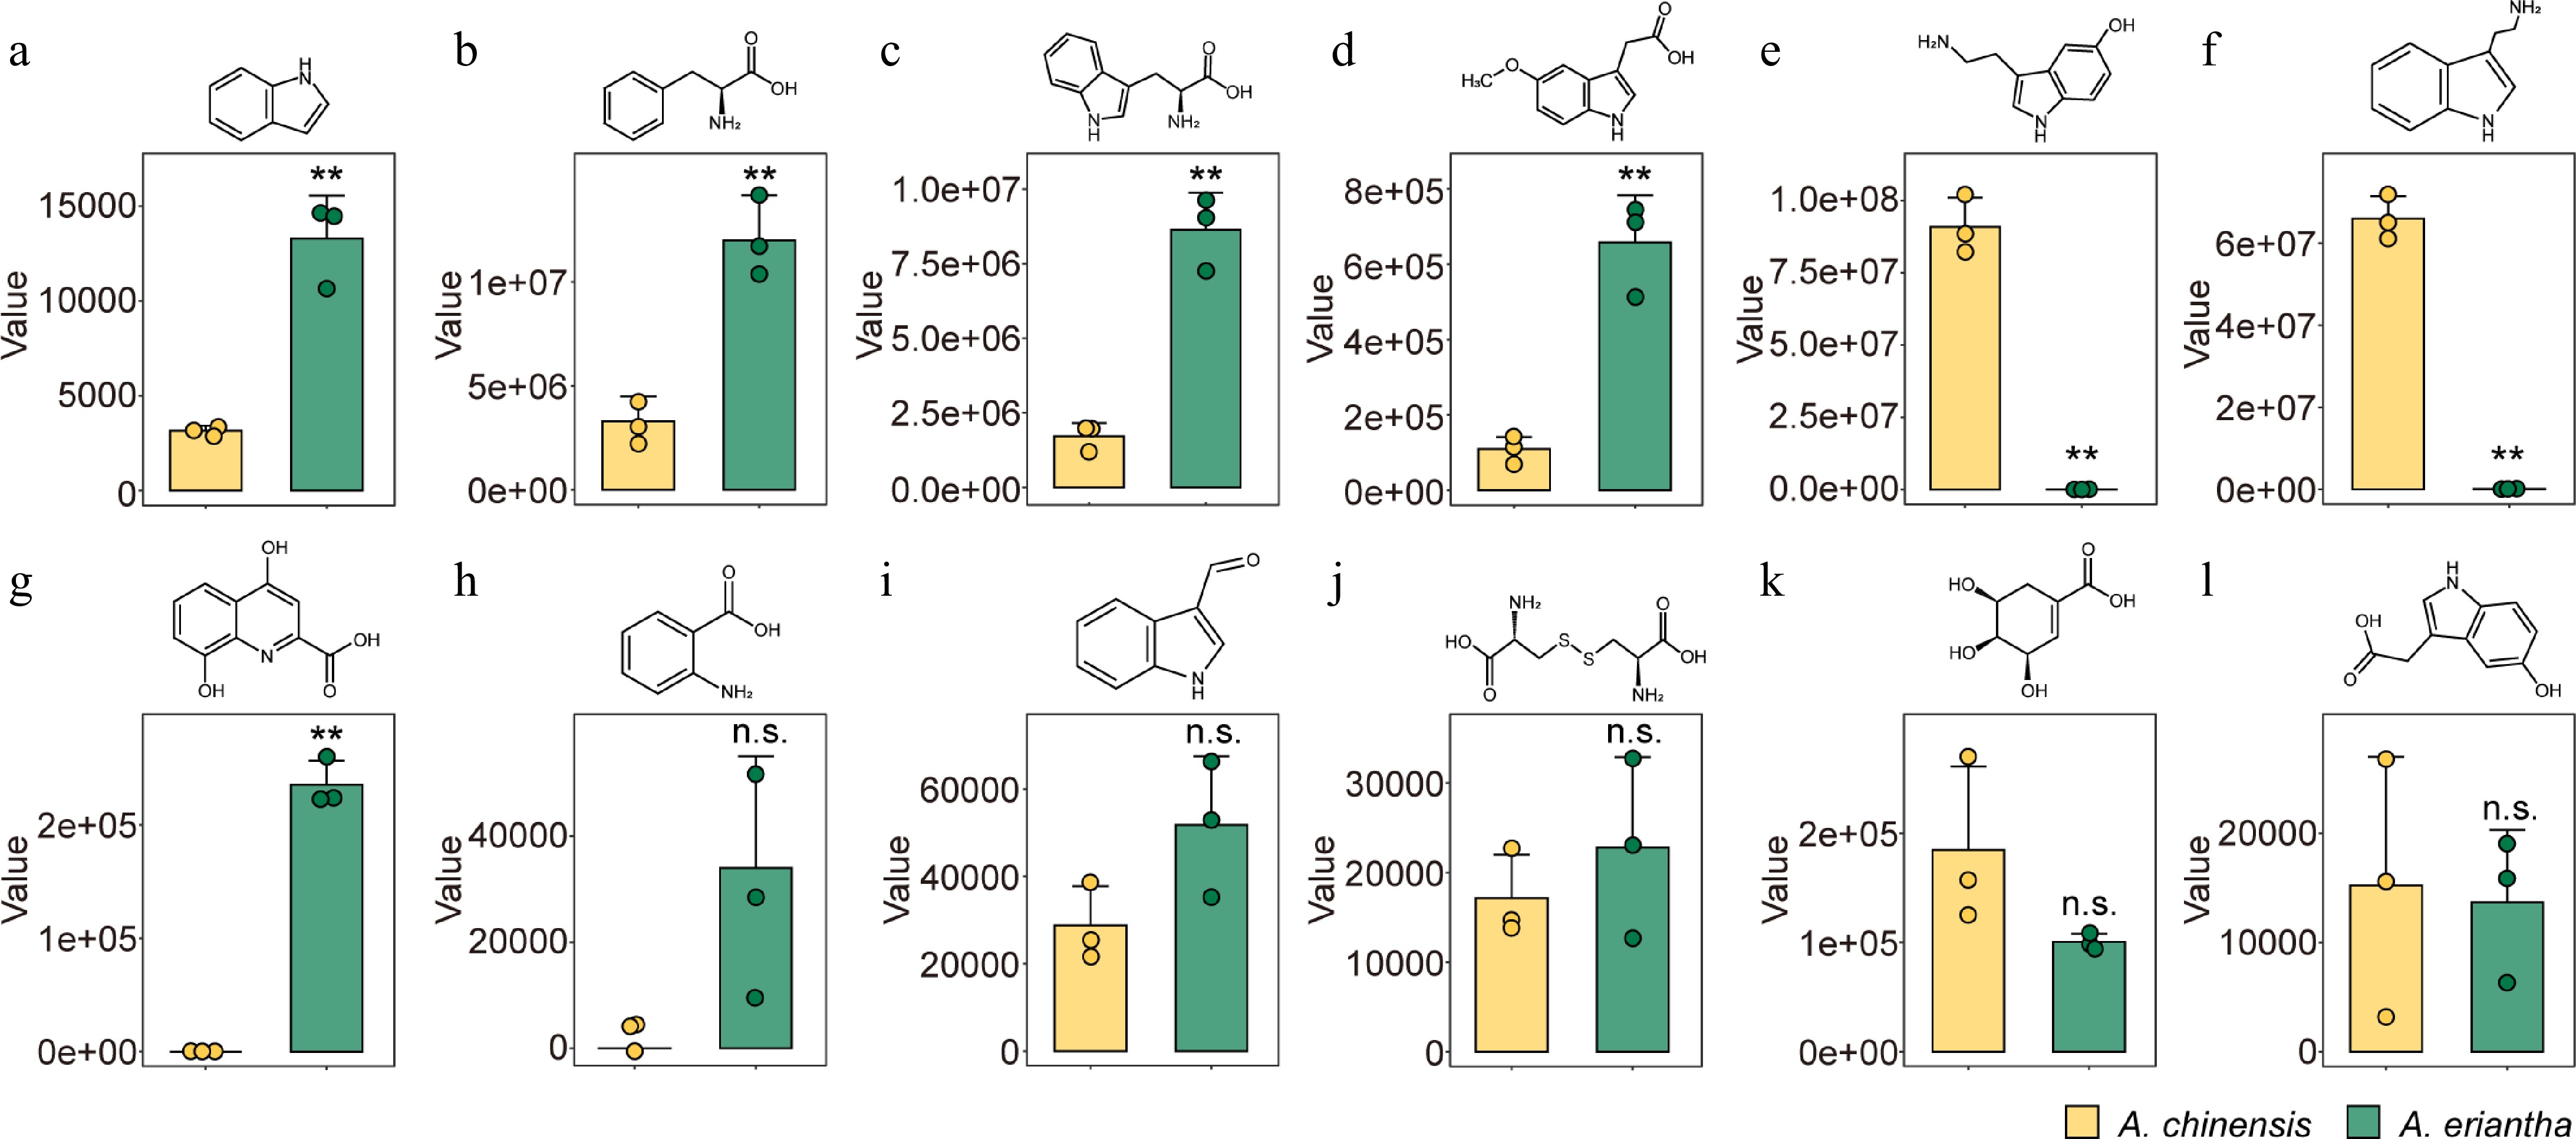
Figure 2.
Contents of differentially accumulated metabolites (DAMs) associated with the tryptophan metabolism pathway in A. chinensis and A. eriantha fruits. (a) Indole, (b) L-phenylalanine, (c) L-tryptophan, (d) methoxyindoleacetic acid, (e) serotonin, (f) tryptamine, (g) xanthurenic acid, (h) anthranilic acid, (i) indole-3-carboxaldehyde, (j) L-(-)-cystine, (k) shikimic acid, and (l) 5-hydroxyindole-3-acetic acid. ** p < 0.01, n.s. non-significance.
-
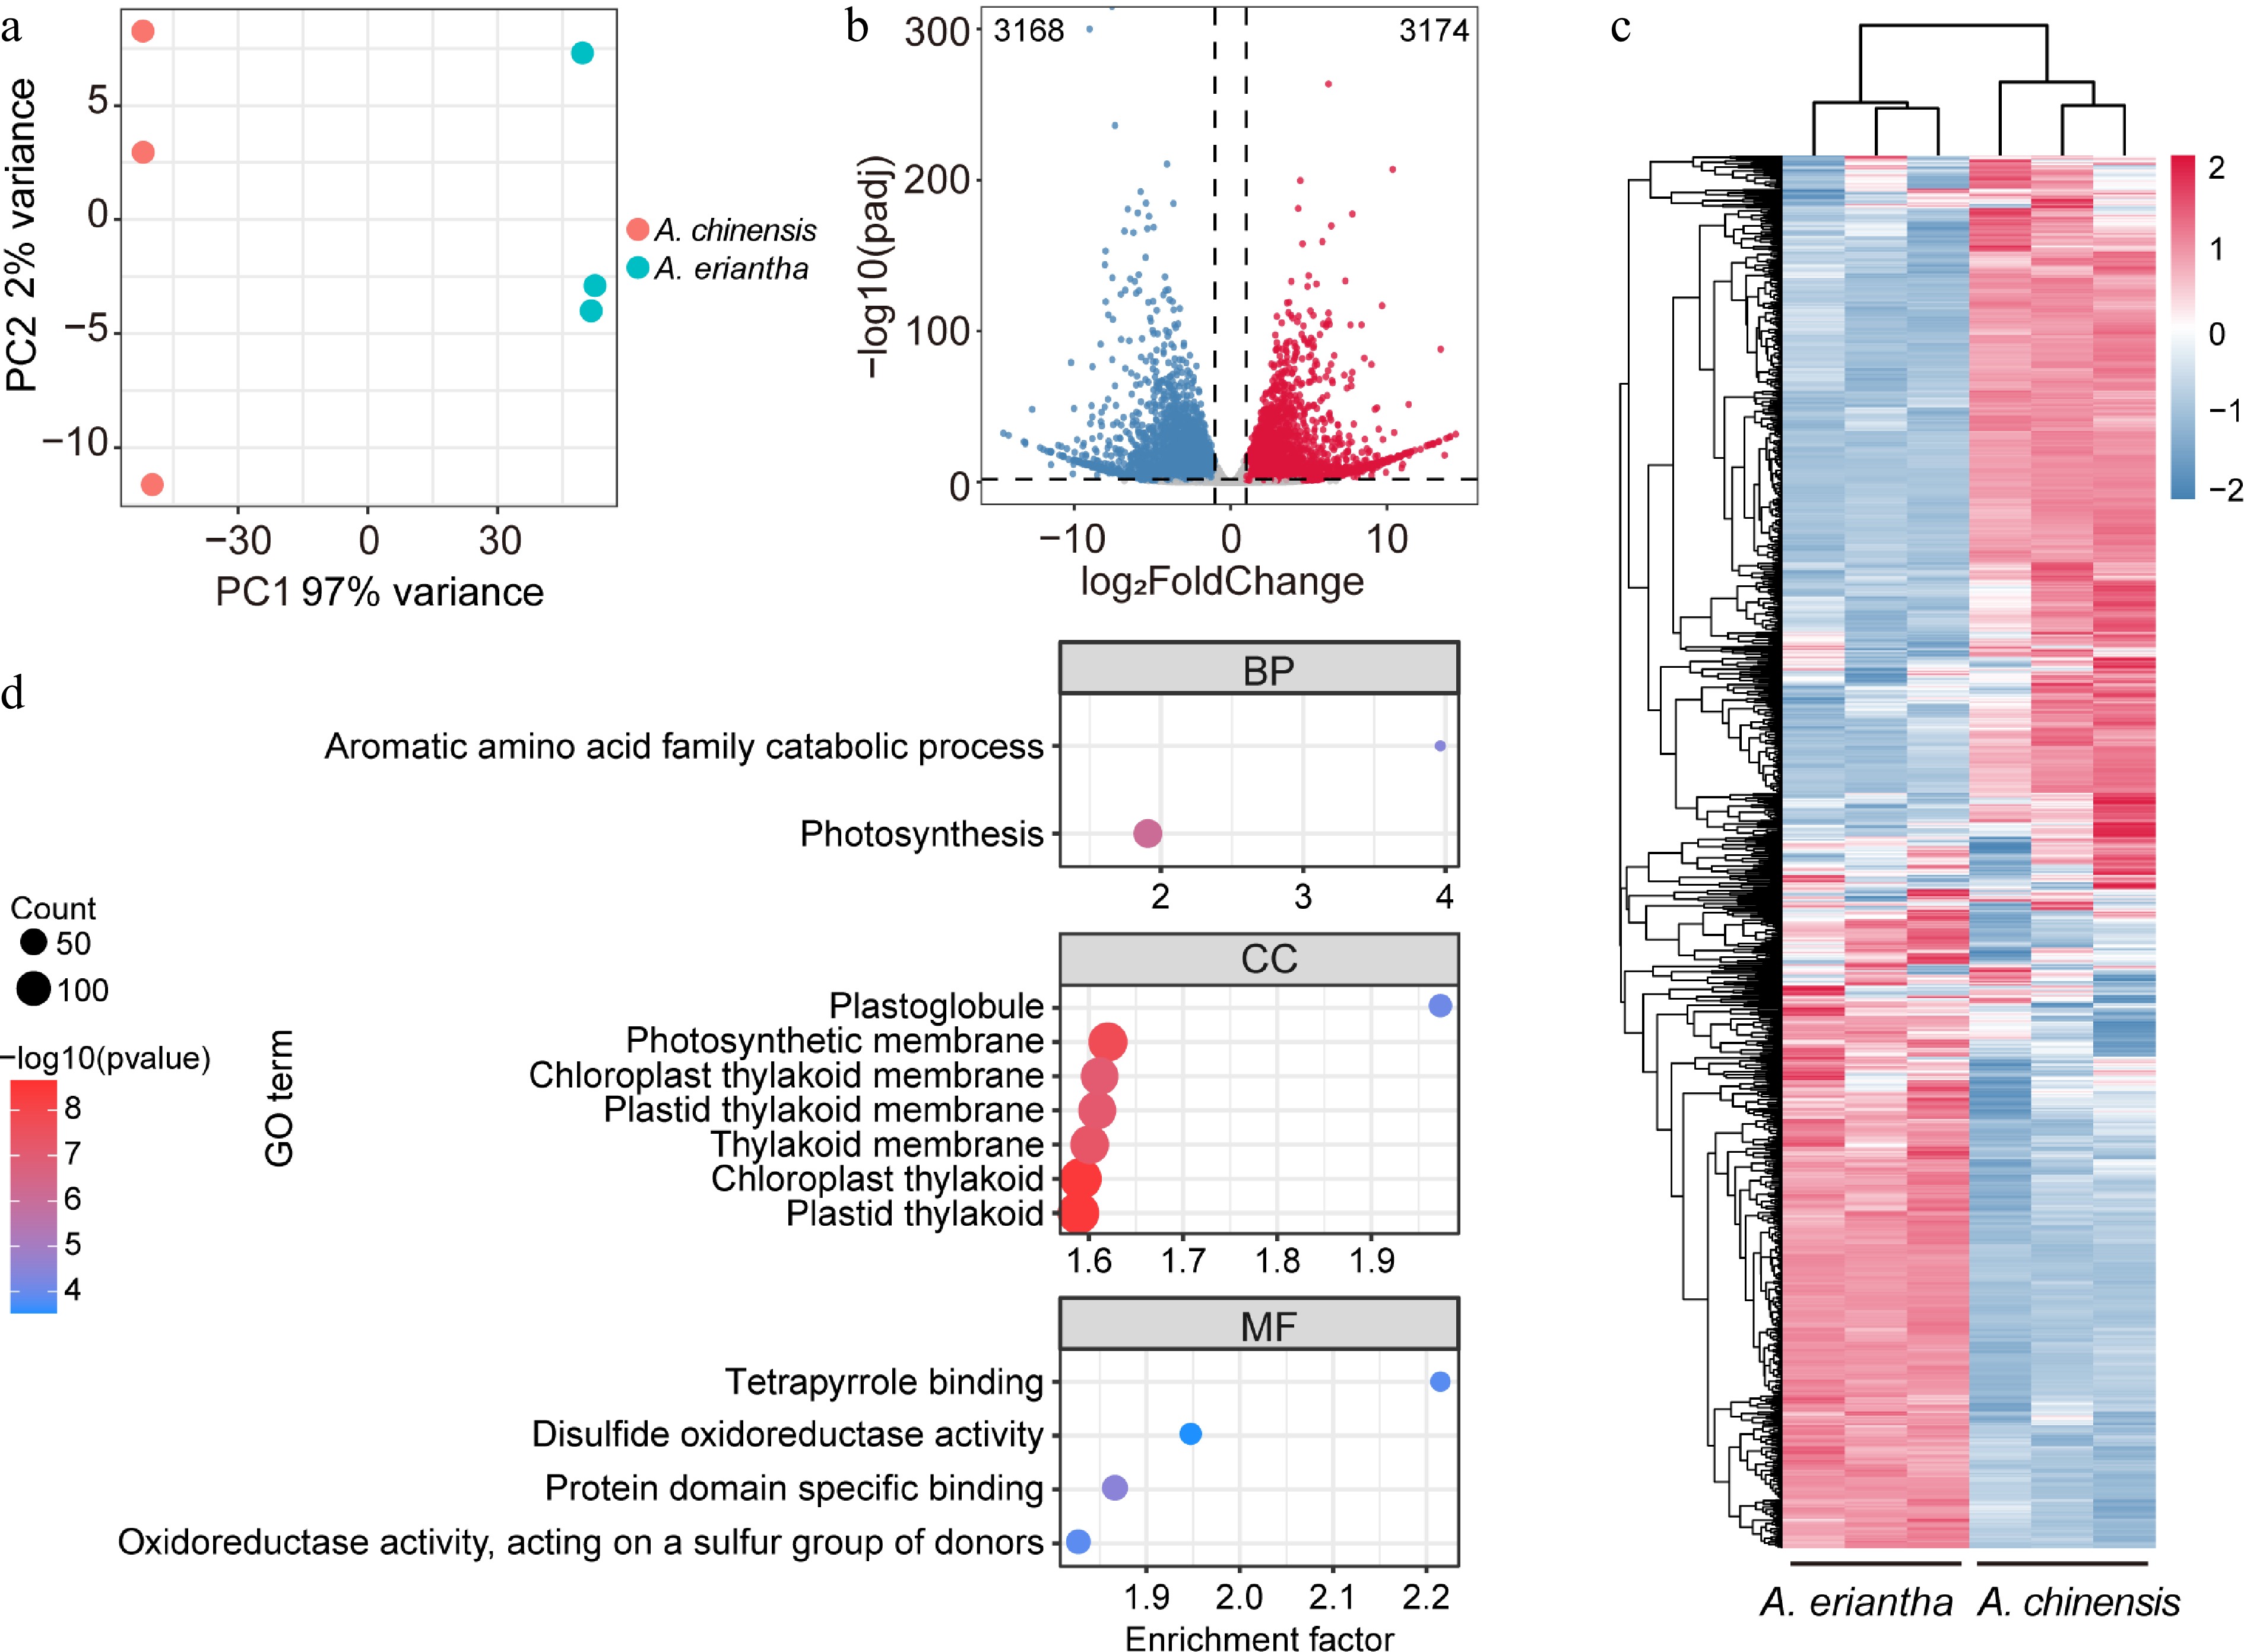
Figure 3.
Transcriptome dynamics of fruit samples for A. chinensis and A. eriantha. (a) Clustering of all fruit samples subjected to transcriptome analysis using Principal Component Analysis (PCA). (b) A volcano plot displaying the up-and downregulated differentially expressed genes (DEGs) when comparing fruit samples between A. chinensis and A. eriantha. (c) Heatmap with scaled expression value of DEGs in fruit samples of A. chinensis and A. eriantha. (d) Enriched components according to GO analysis.
-
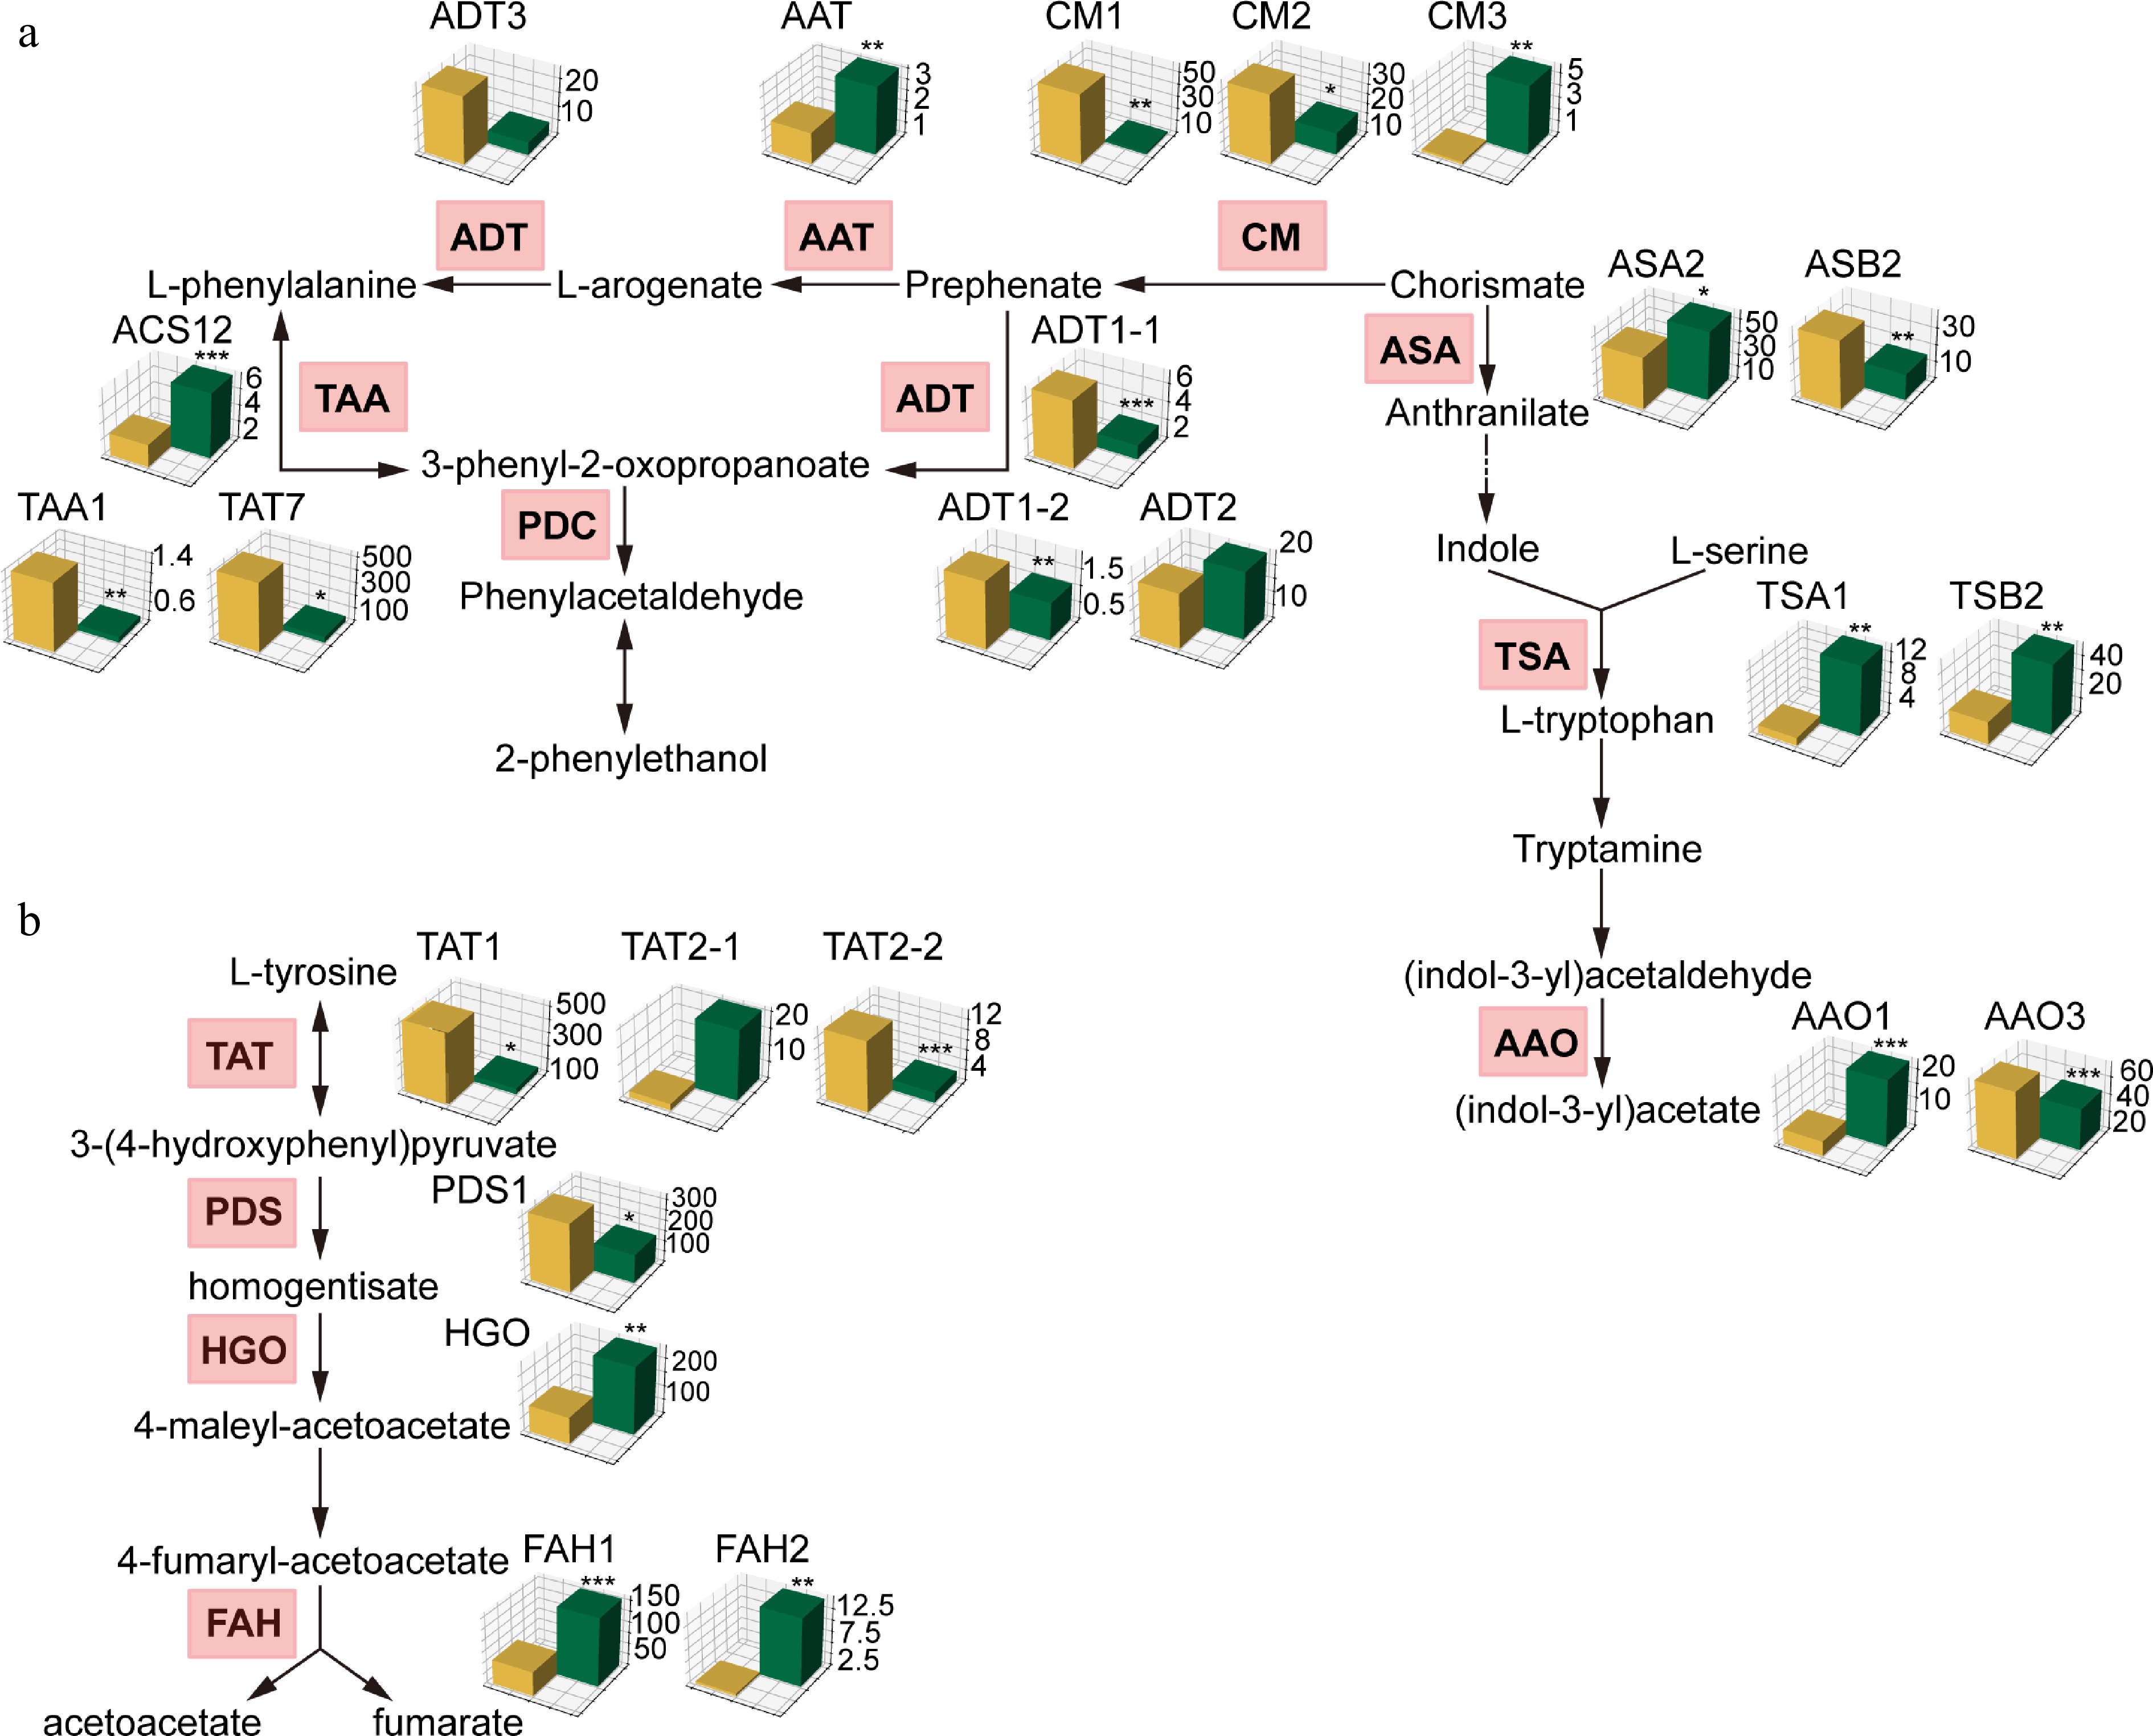
Figure 4.
Comparative transcriptomic analysis of genes involved in phenylalanine, tryptophan, and tyrosine metabolism pathways between A. chinensis and A. eriantha. Barplots of orthologous genes were generated using TPM value. * p < 0.05, ** p < 0.01, *** p < 0.001.
-
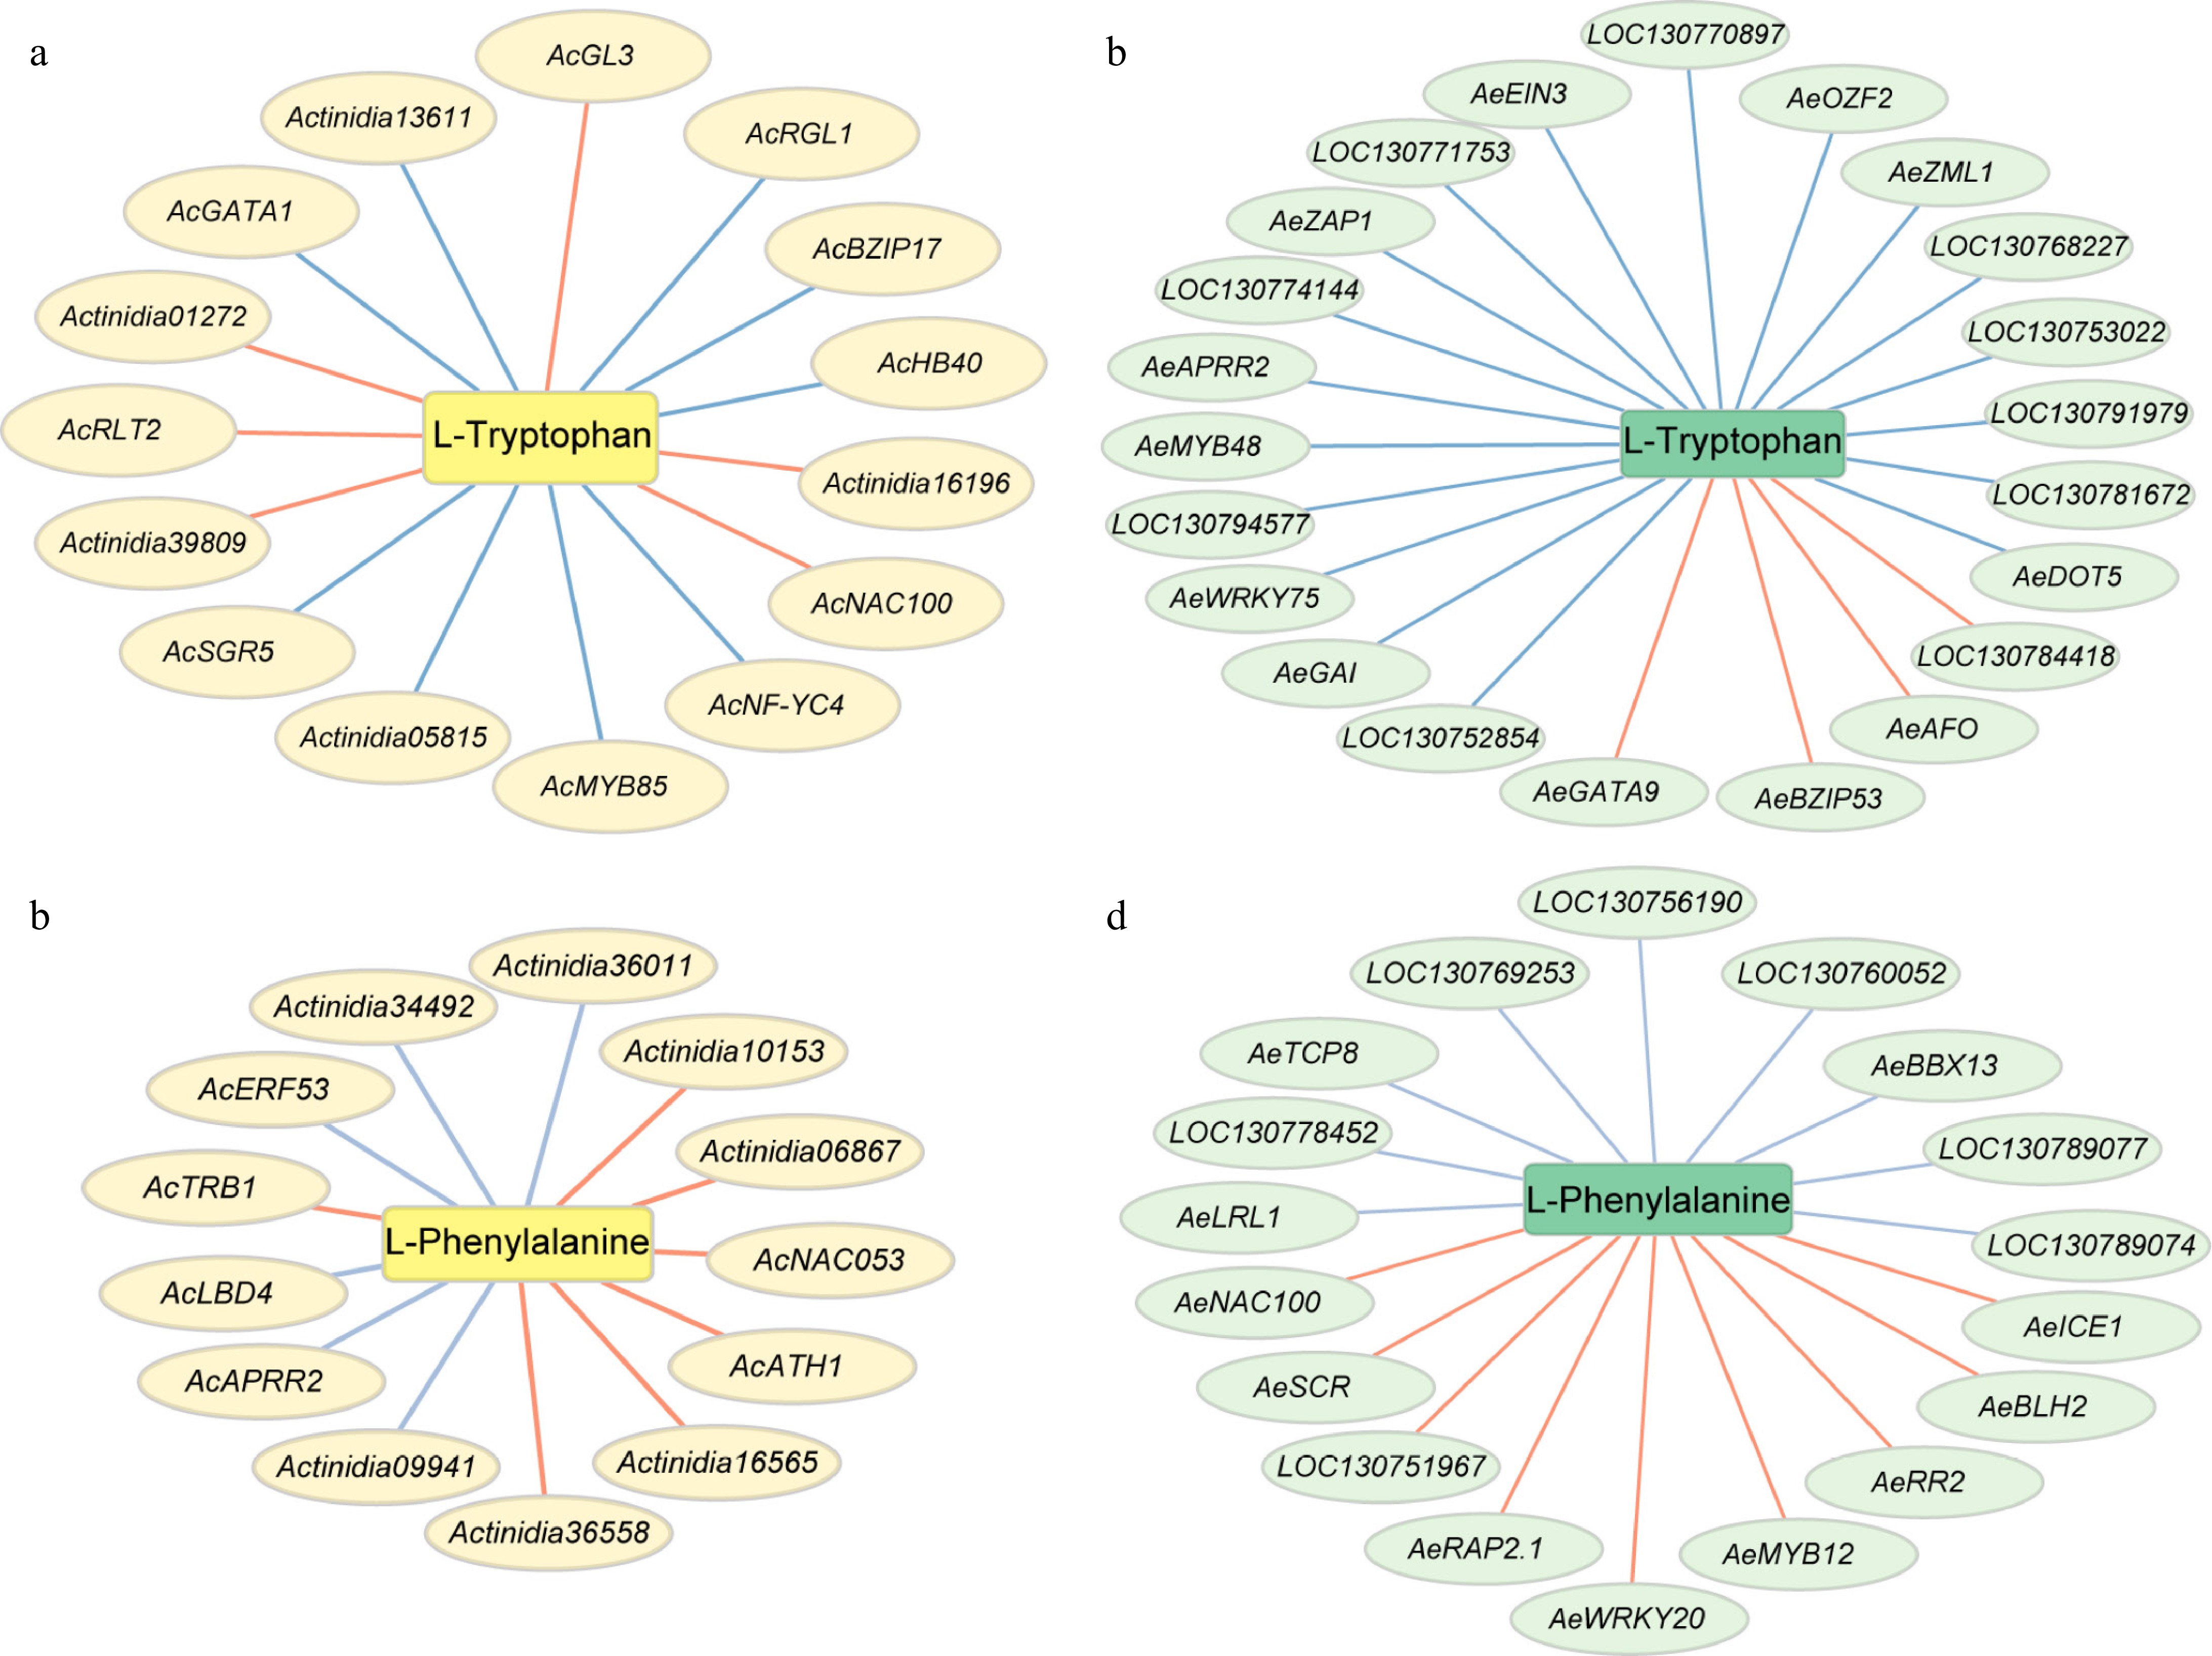
Figure 5.
Putative transcriptional regulatory network involved in phenylalanine, and tryptophan metabolism. Red lines indicate positive correlation, blue lines indicate negative correlation. (a) and (b) present regulatory network in A. chinensis, (c) and (d) present regulatory network in A. eriantha.
Figures
(5)
Tables
(0)