-
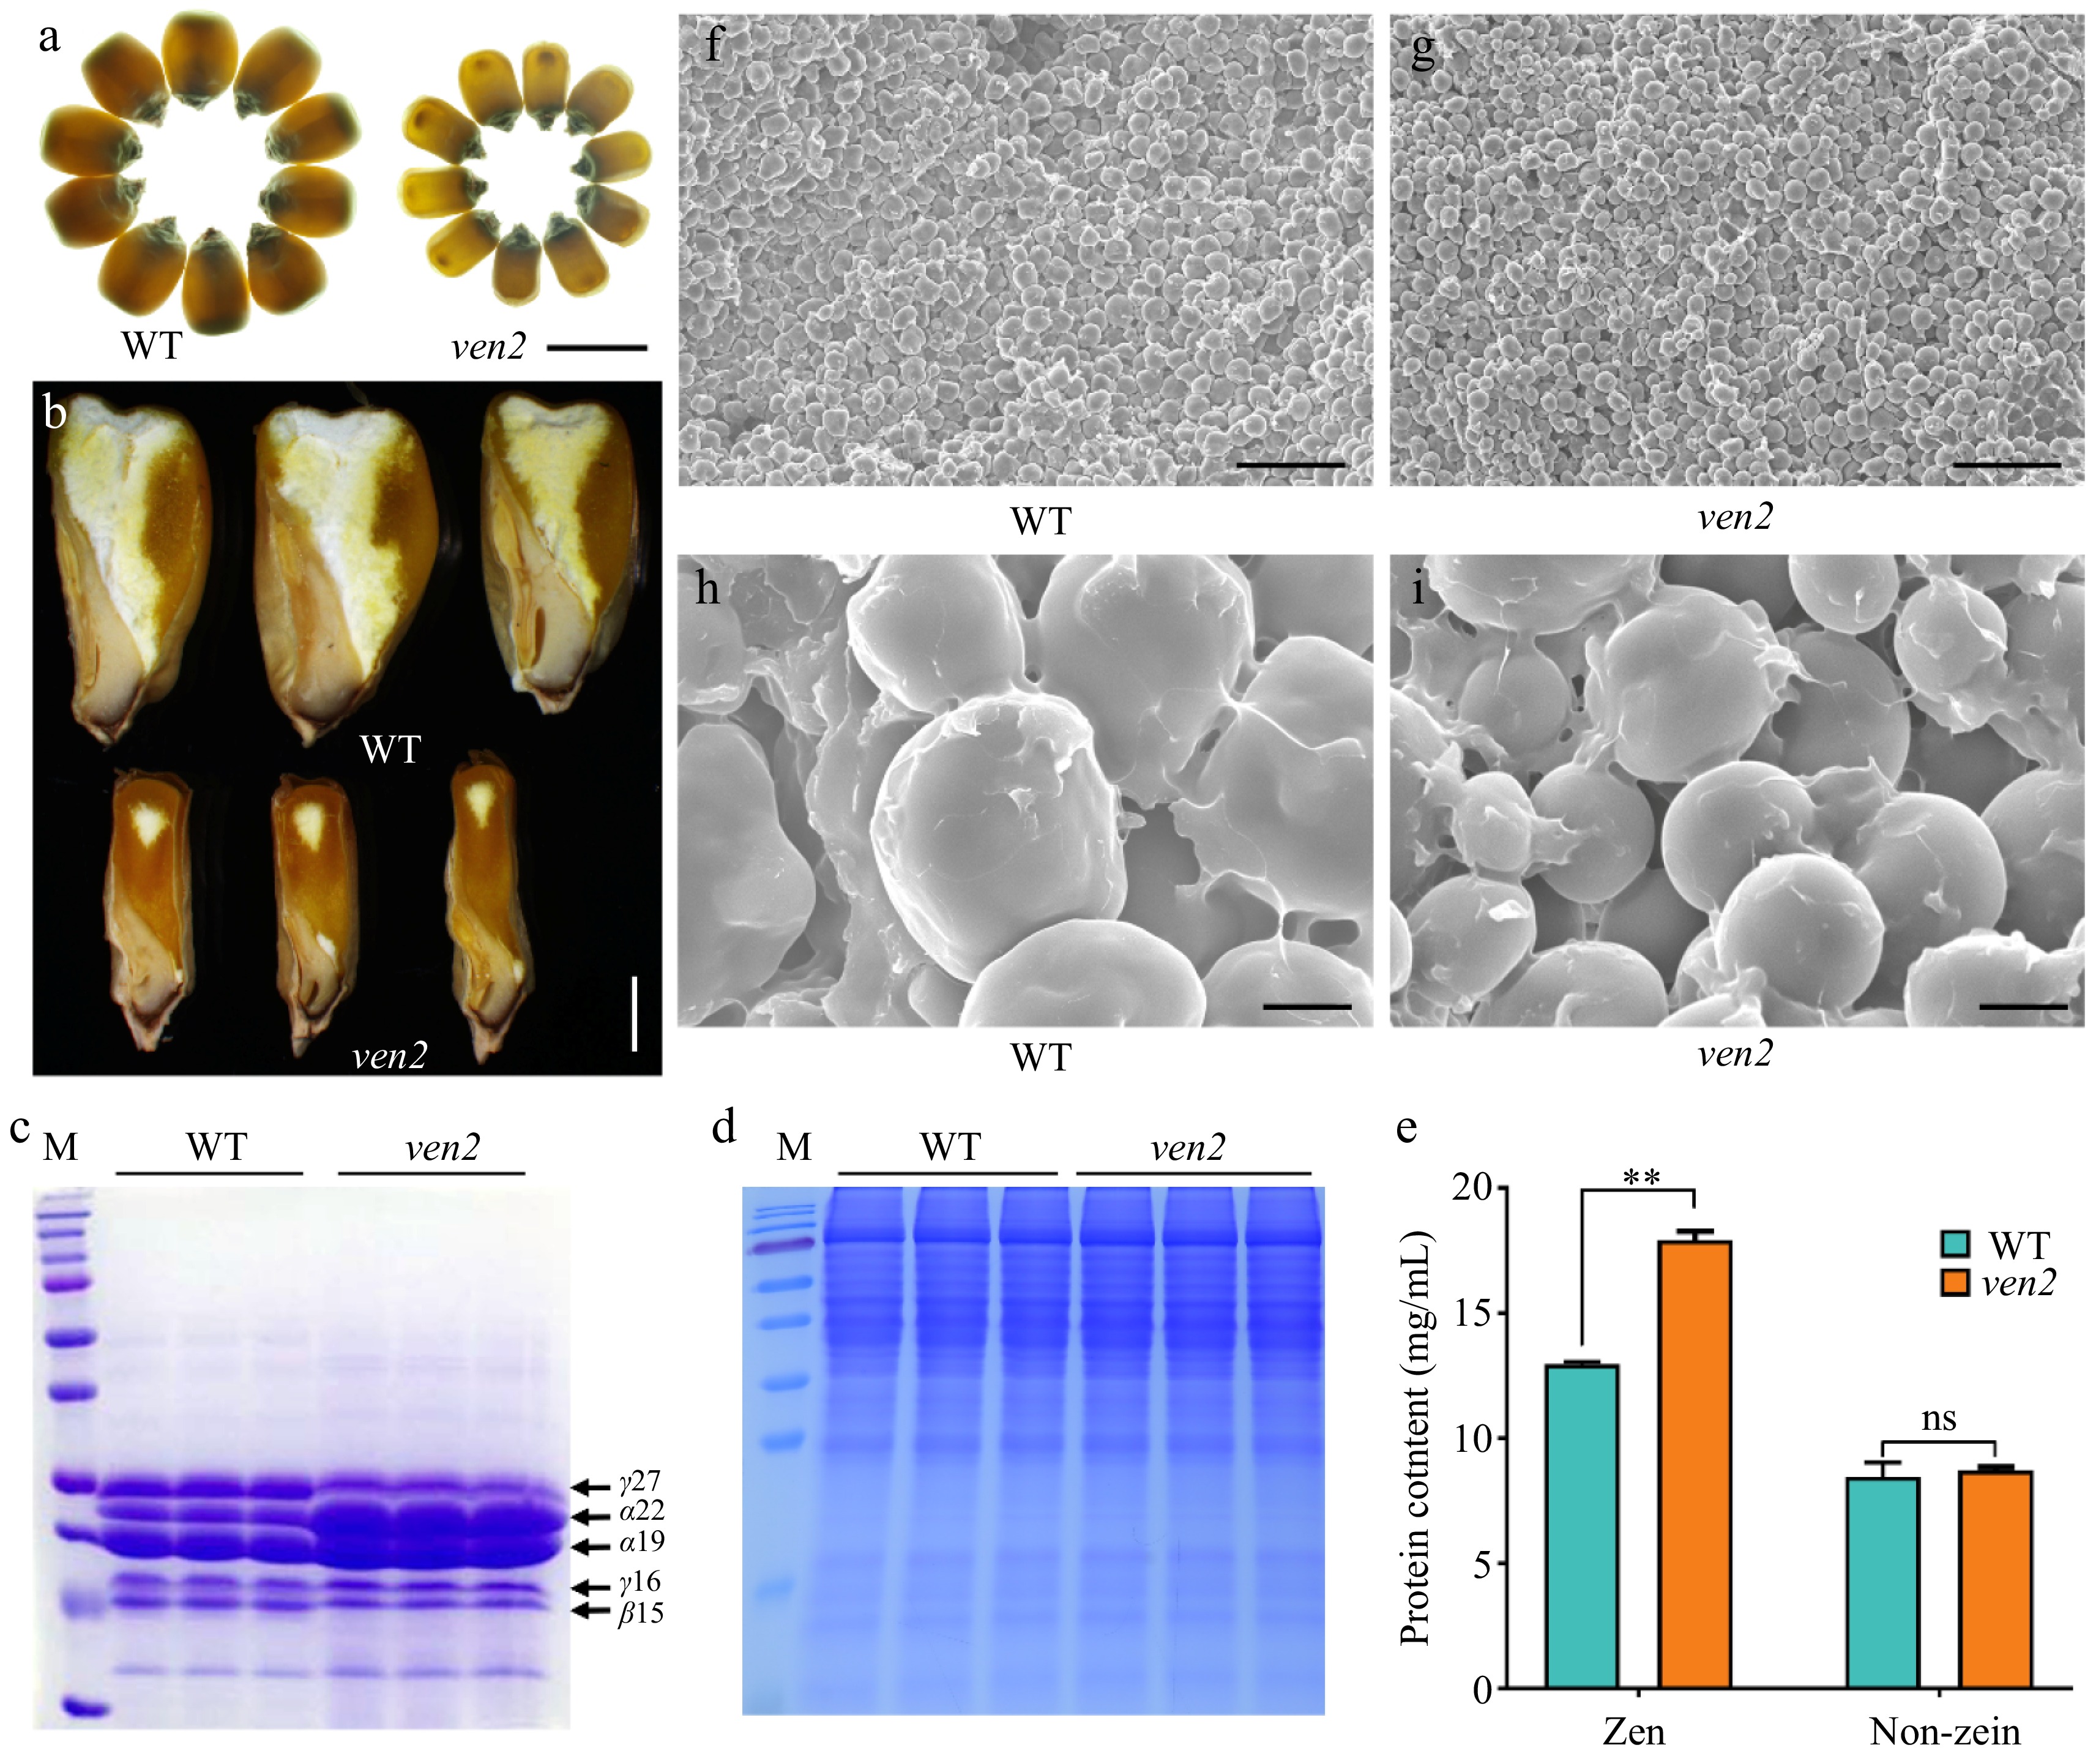
Figure 1.
Seed phenotypes of the WT and ven2 mutant. (a) WT and ven2 mature seeds viewed on a light box. Scale bars, 2 mm. (b) Sagittal sections of WT and ven2 mature seeds. Scale bars, 2 mm. SDS-PAGE analysis of (c) endosperm zein and (d) non-zein protein accumulation in WT and ven2 mutant. (e) Quantification of zein, non-zein protein contents in WT and ven2 mature endosperm. (f), (g) SEM of the WT and the ven2 endosperm cells at maturity. Scale bars, 50 μm. (h), (i) The magnified sections from the (f) and (g) panels. Scale bars, 5 μm.
-
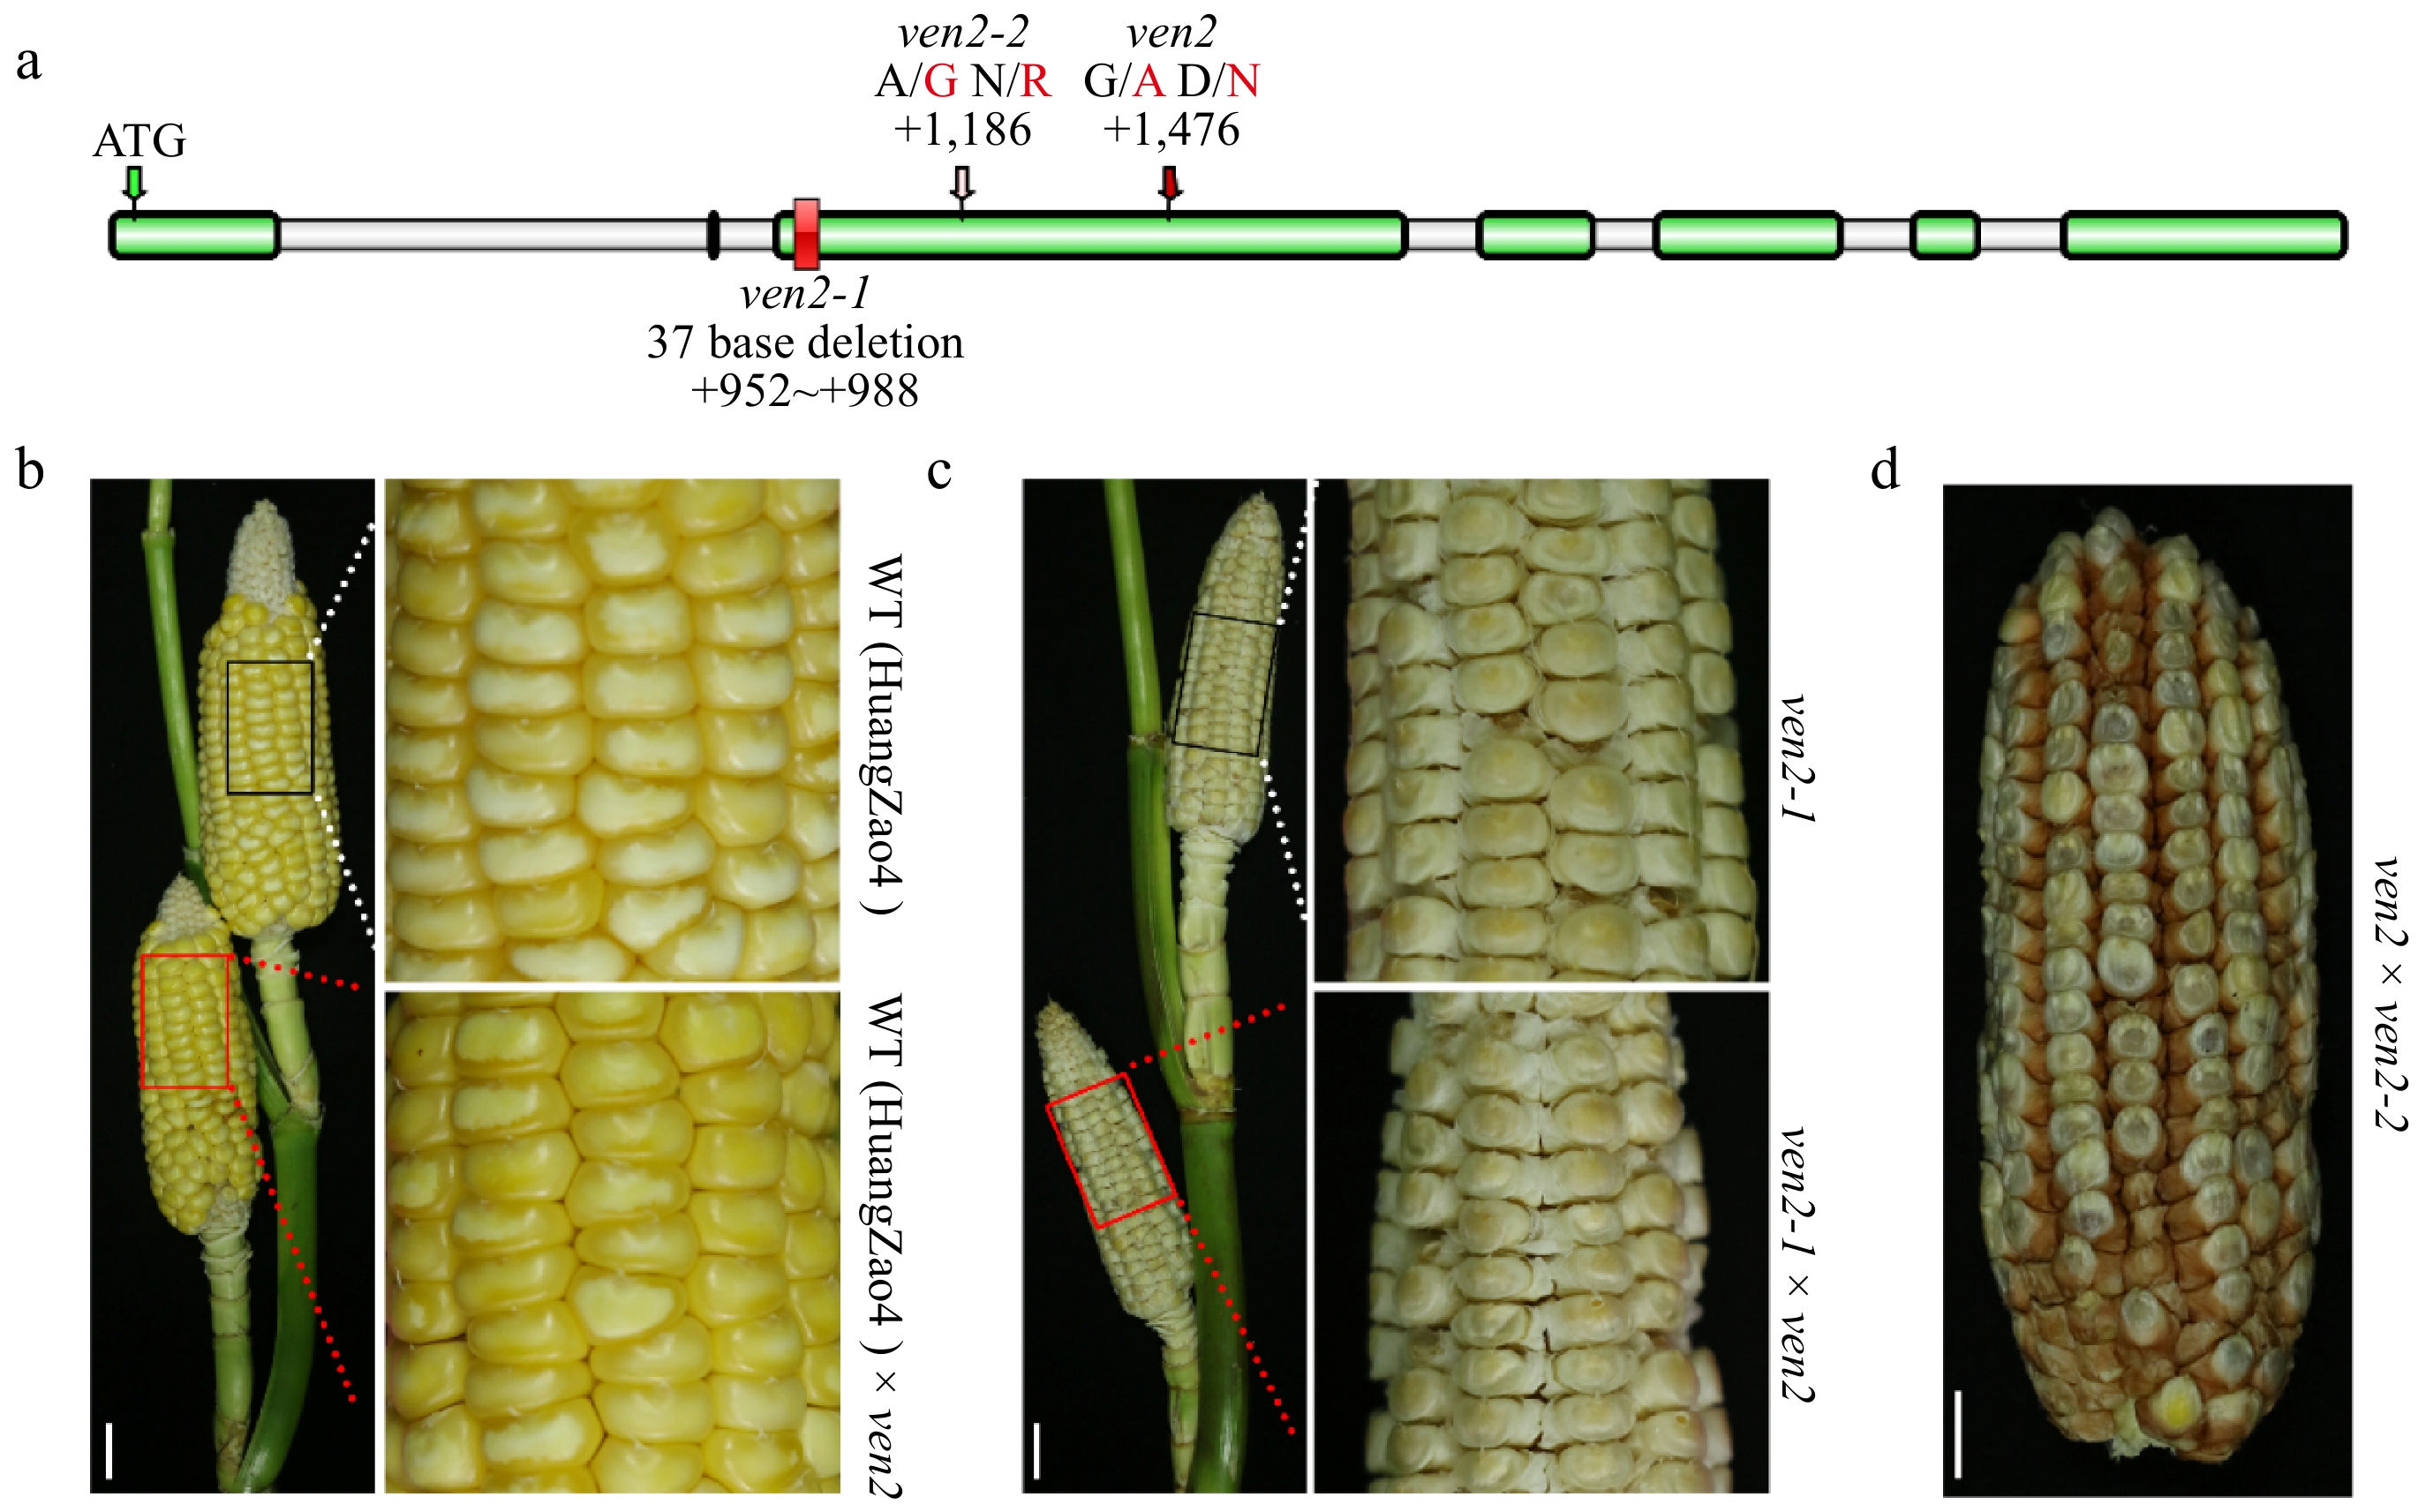
Figure 2.
Positional cloning and identification of Ven2. (a) Structure and mutation site of the Zm00001d003776 gene. Gray and green boxes represent introns and exons, respectively. (b) Allelism test using homozygous WT, ven2, ven2-1, and ven2-2. Scale bars, 3 cm.
-
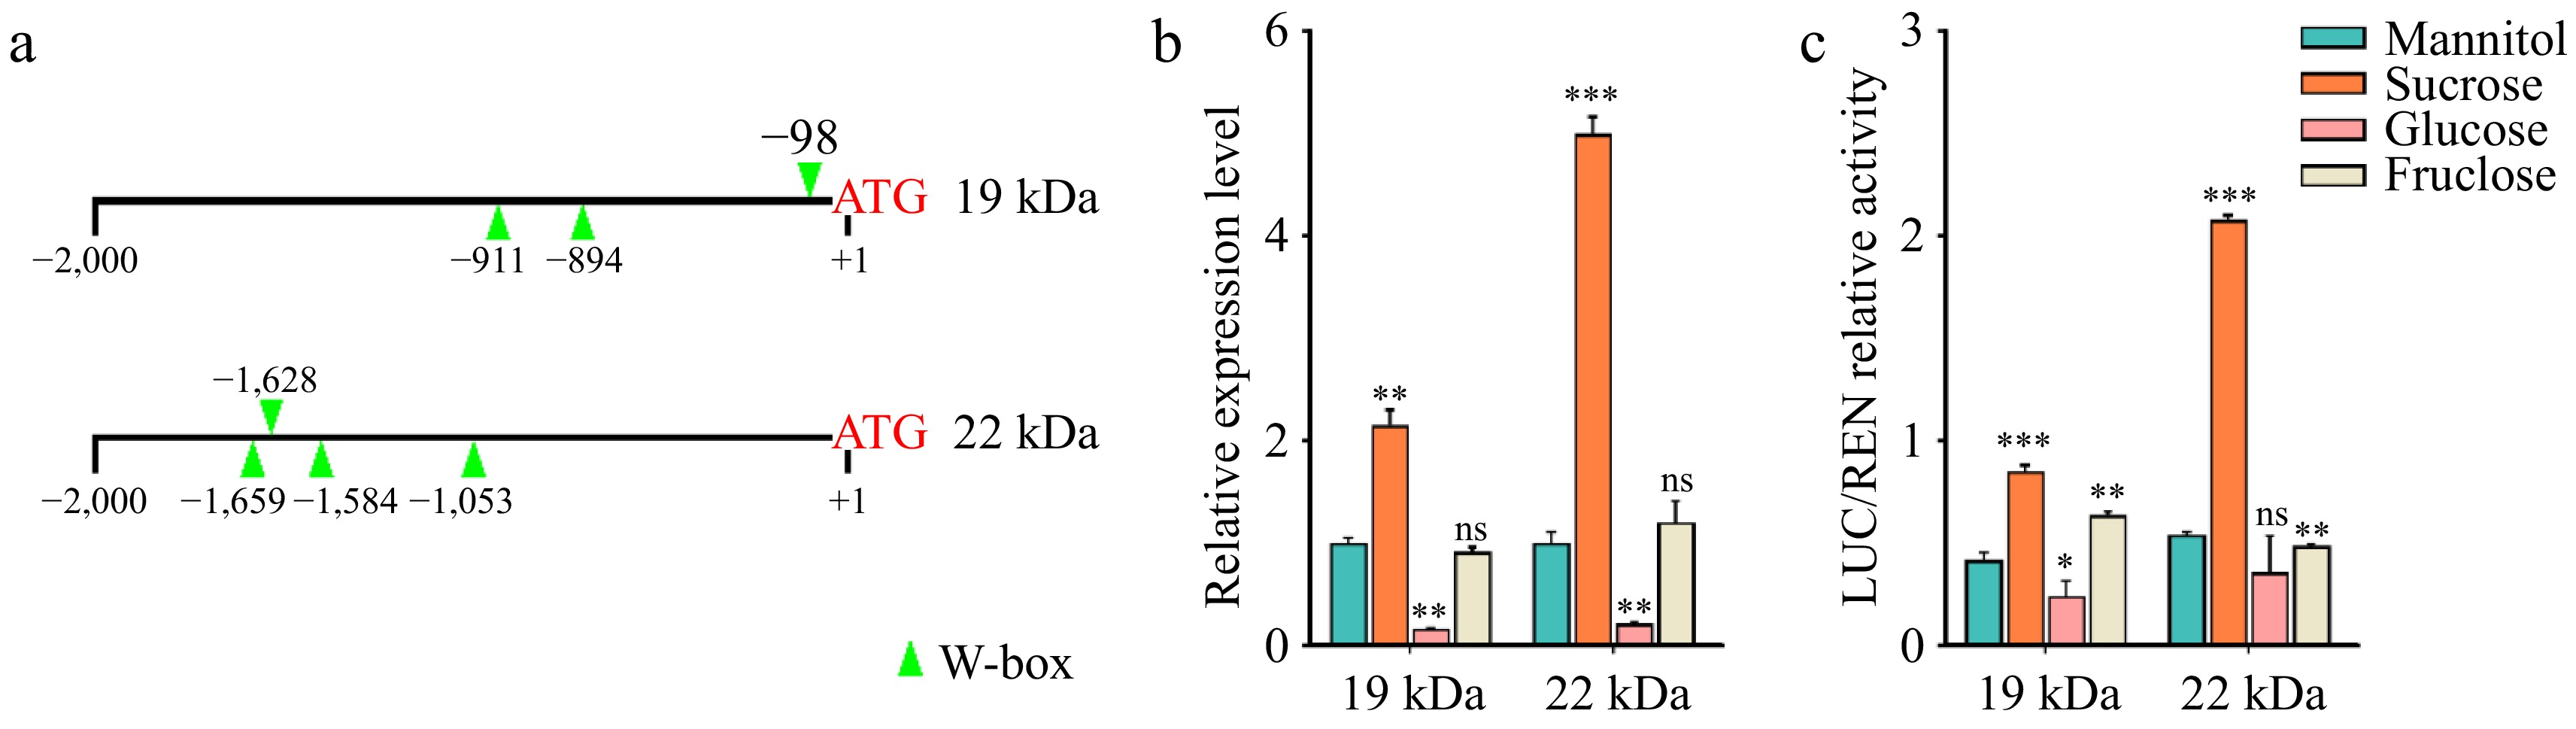
Figure 3.
Sucrose induces 19 kDa α-zein and 22 kDa α-zein gene expression. (a) Promoter analysis of 19 kDa α-zein and 22 kDa α-zein gene. W-box is a cis-acting element that responds to sugar signals. (b) Expression analysis of 19 kDa α-zein and 22kDa α-zein in different sugar treatment by qRT-PCR. Normalization was performed against the maize Actin gene (Zm00001d010159). Values represent the mean and SD of three biological replicates. **, p < 0.01; ***, p < 0.001; ns, no significant difference; student's t-test. (c) The LUC/REN relative activity of the promoter fragments including W-box of 19 kDa α-zein and 22 kDa α-zein gene. The expression level of REN was used as an internal control. Values represent the mean and SD of three biological replicates. *, p < 0.05; **, p < 0.01; ***, p < 0.001; ns, no significant difference; student's t-test.
-
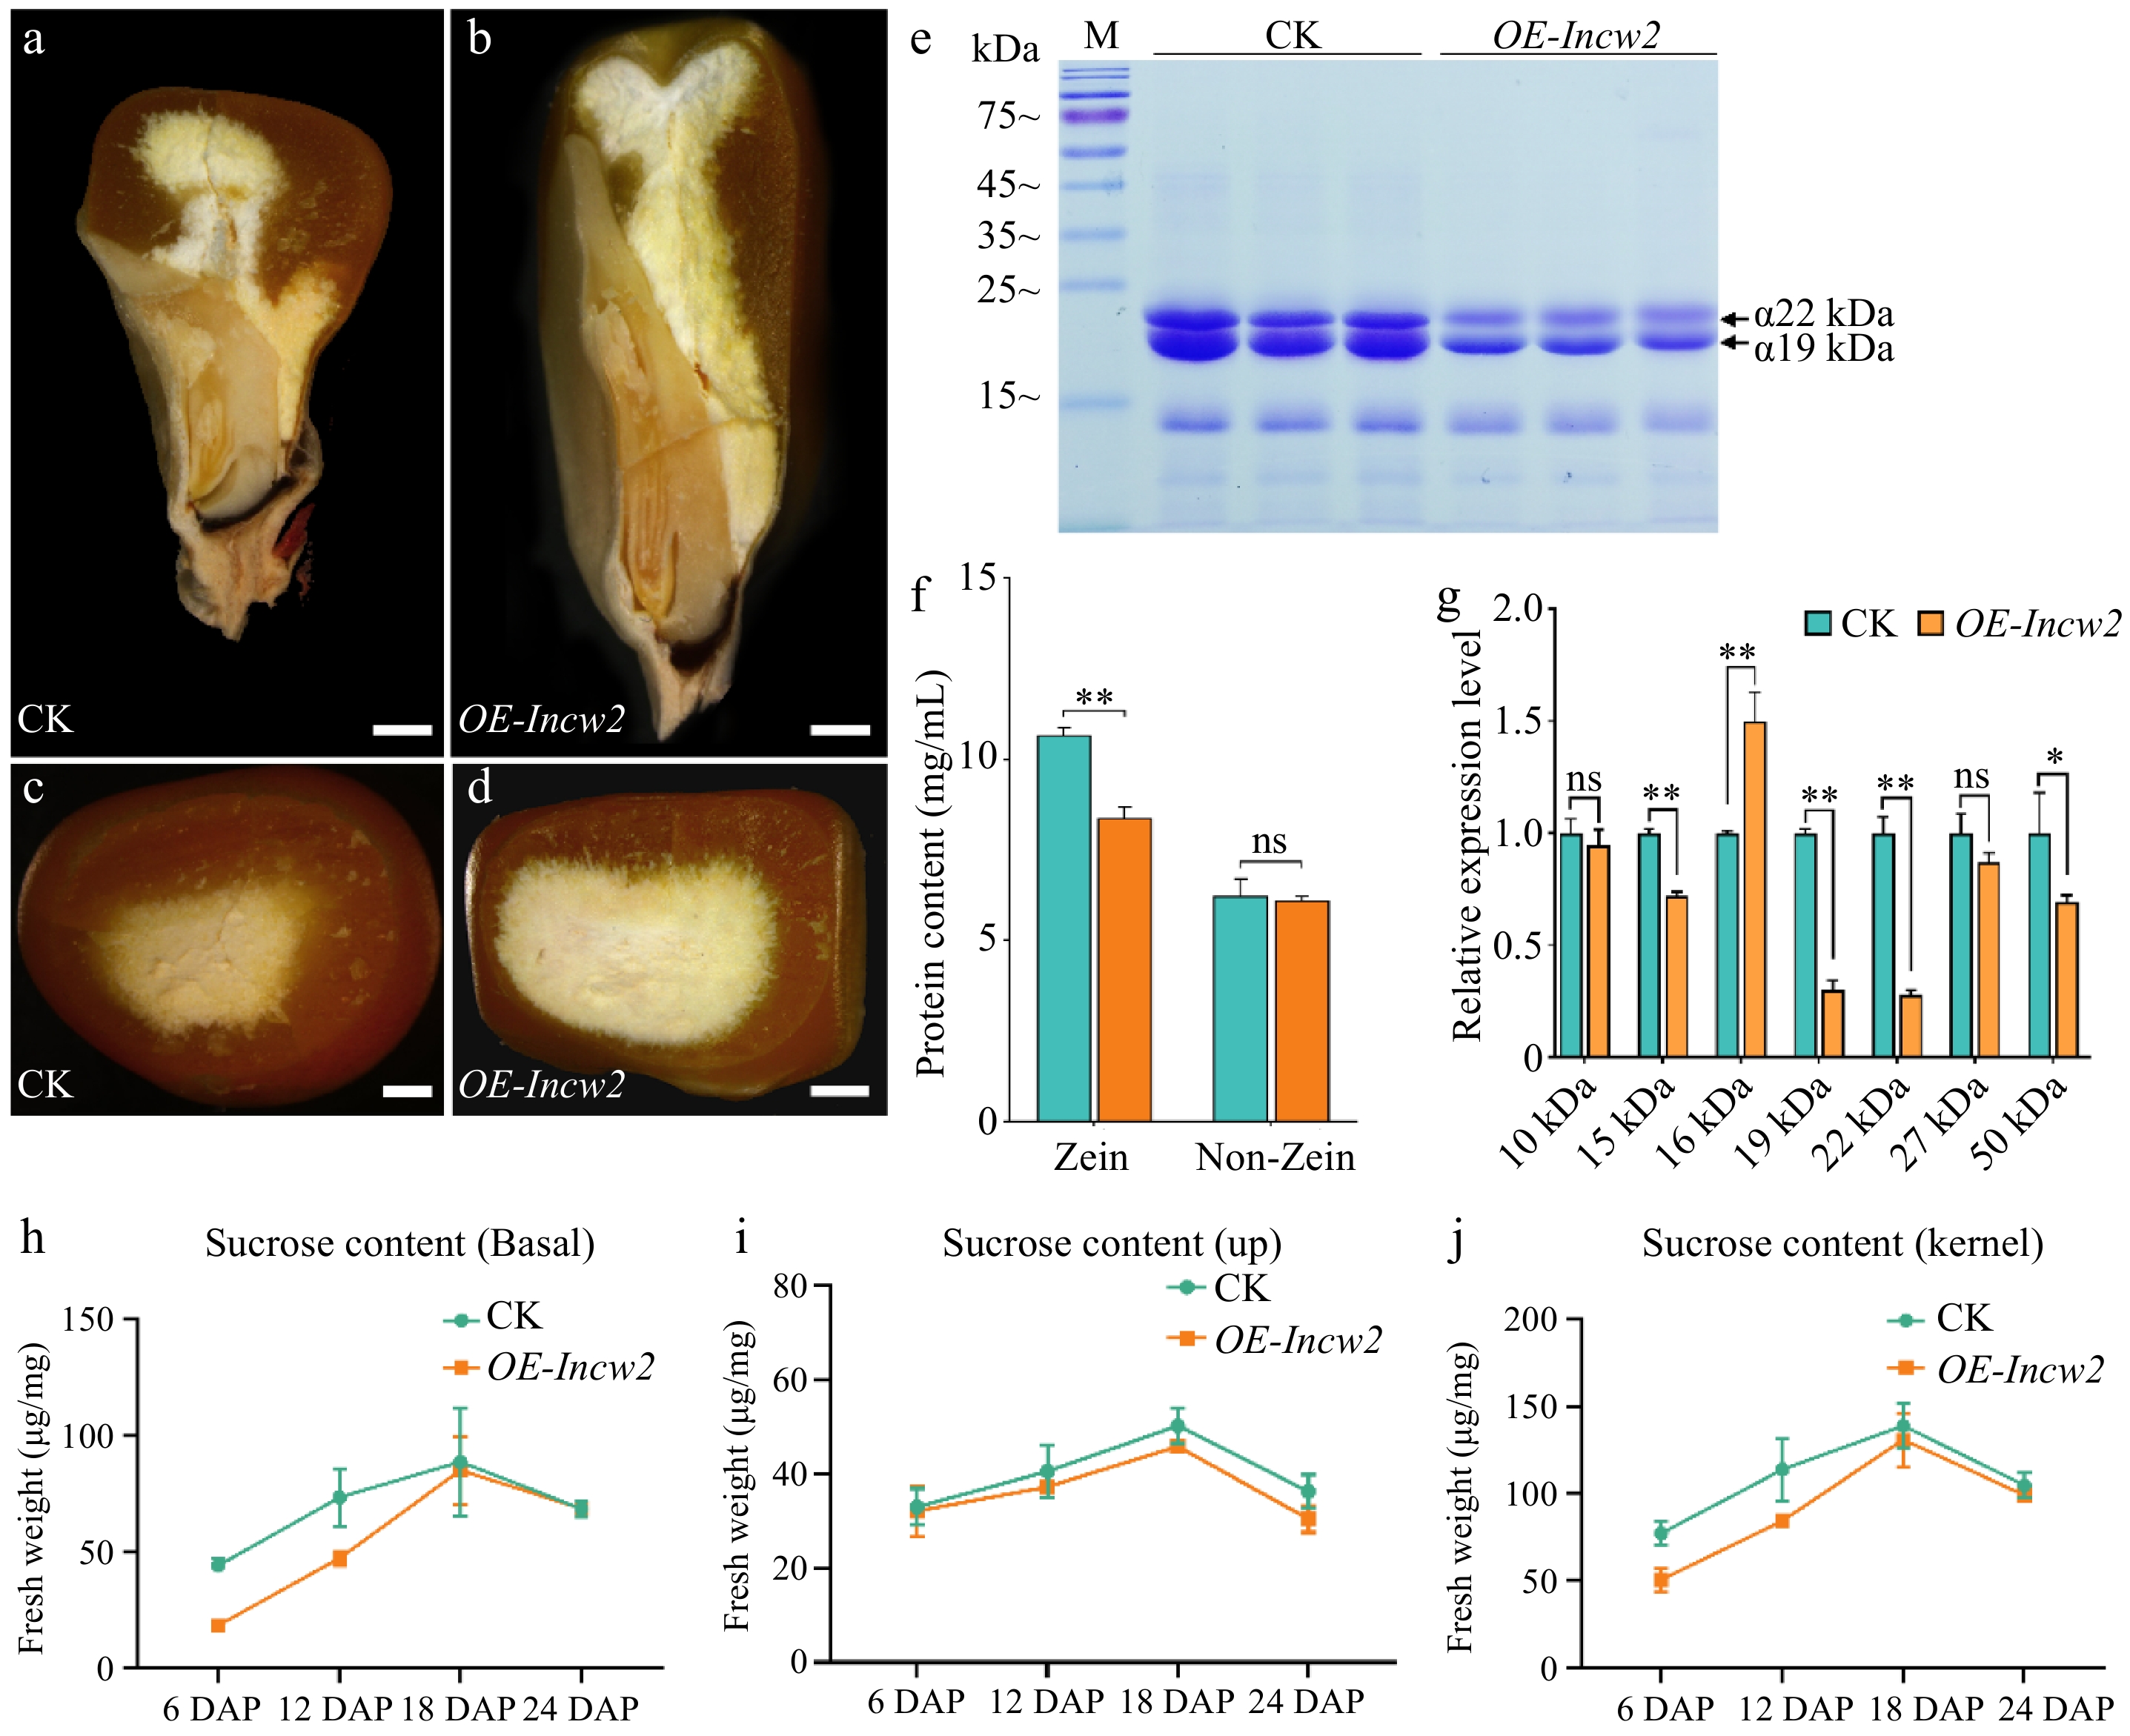
Figure 4.
Seed phenotypes of the CK and OE-Incw2. (a), (b) Longitudinal dissection of CK and OE-Incw2 mature seeds. CK, non-transgenic control. Scale bars, 2 mm. (c), (d) Transection of CK and OE-Incw2 mature seeds. Scale bars, 2 mm. (e) SDS-PAGE analysis of zein in CK and OE-Incw2. (f) Quantification of zein and non-zein contents in CK and OE-Incw2 mature endosperm. Values represent the mean and SD of three biological replicates. **, p < 0.01; ns, no significant difference; student's t-test. (g) qRT-PCR analysis of the expression of zein genes. *, p < 0.05; **, p < 0.01; ns, no significant difference; student's t-test. (h)−(j) Sucrose contents of CK and OE-Incw2 developing seeds. Values represent the mean and SD of three biological replicates.
-
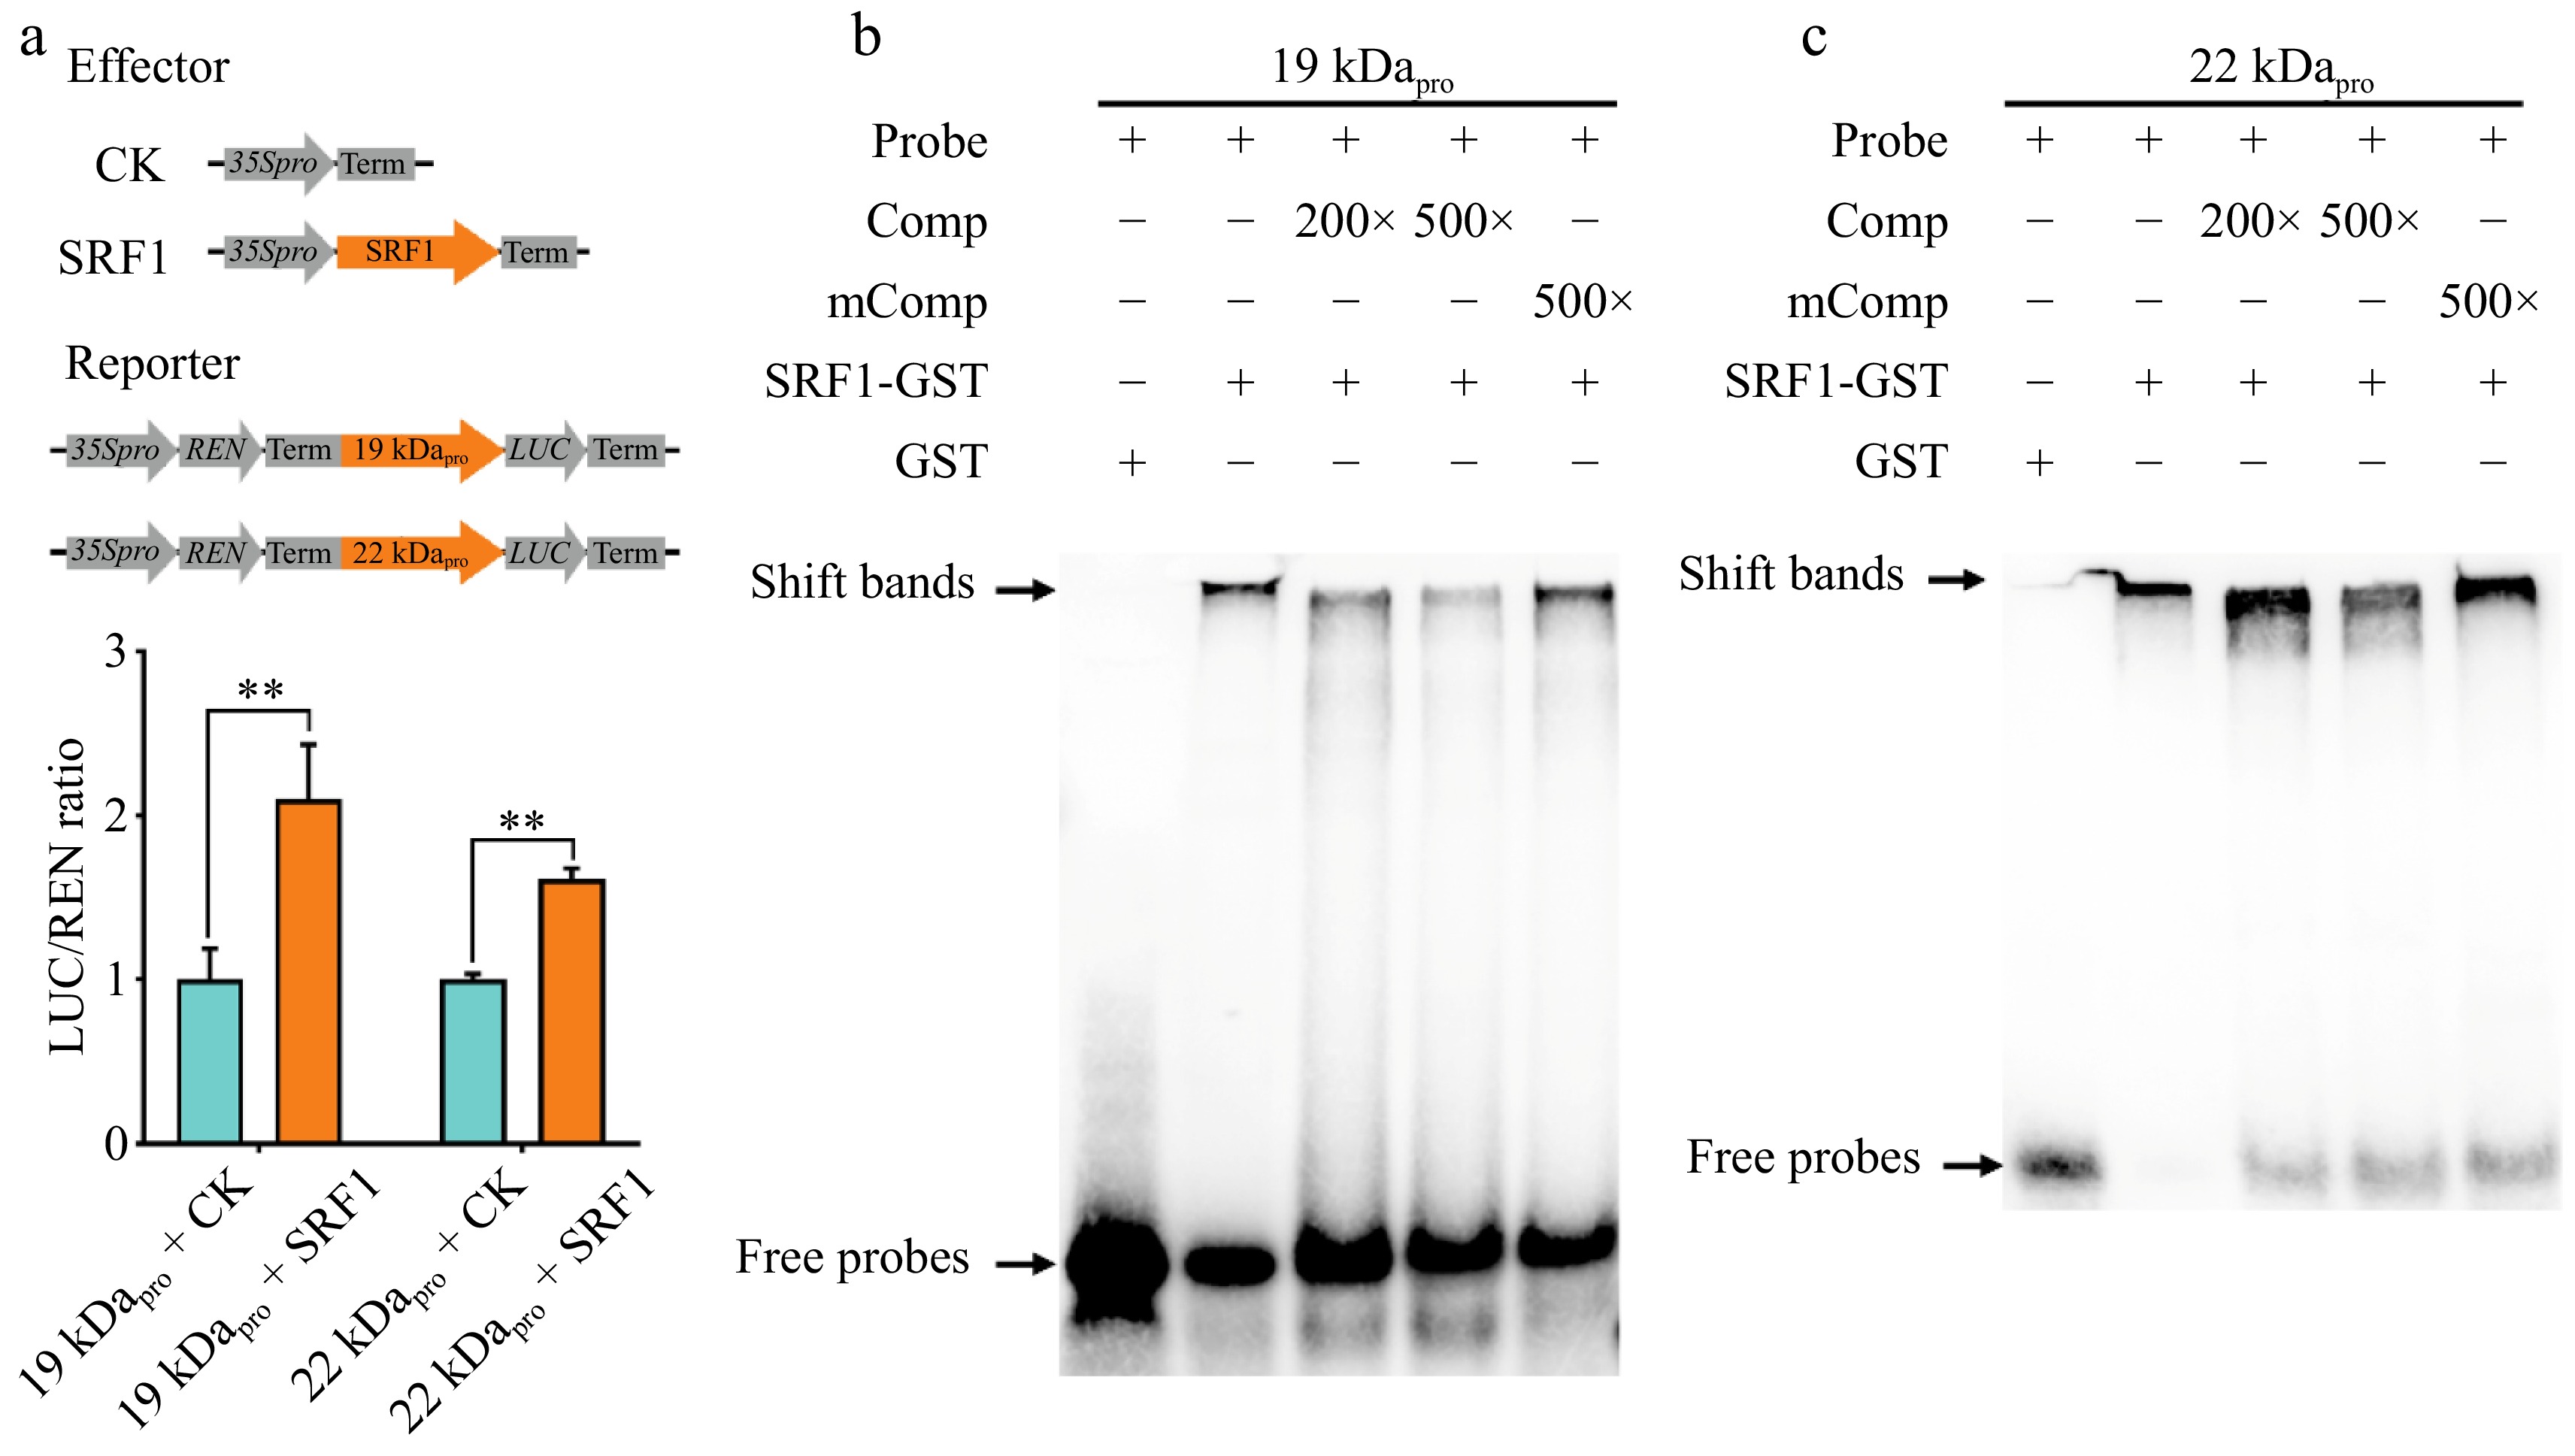
Figure 5.
Identification of cis-elements and the associated SRF1 for 19 kDa and 22 kDa promoter transactivation. (a) DLR assay of transactivation of the 19 kDa and 22 kDa zein genes promoter by SRF1 in tobacco leaves. (b), (c) EMSA of the specific binding of SRF1-GST to the W-box motifs in the 19 kDa and 22 kDa zein genes promoter. The normal and mutant probes were labeled with biotin. Unlabeled intact probes were used for competition. Comp, competing probes unlabeled with biotin.
-
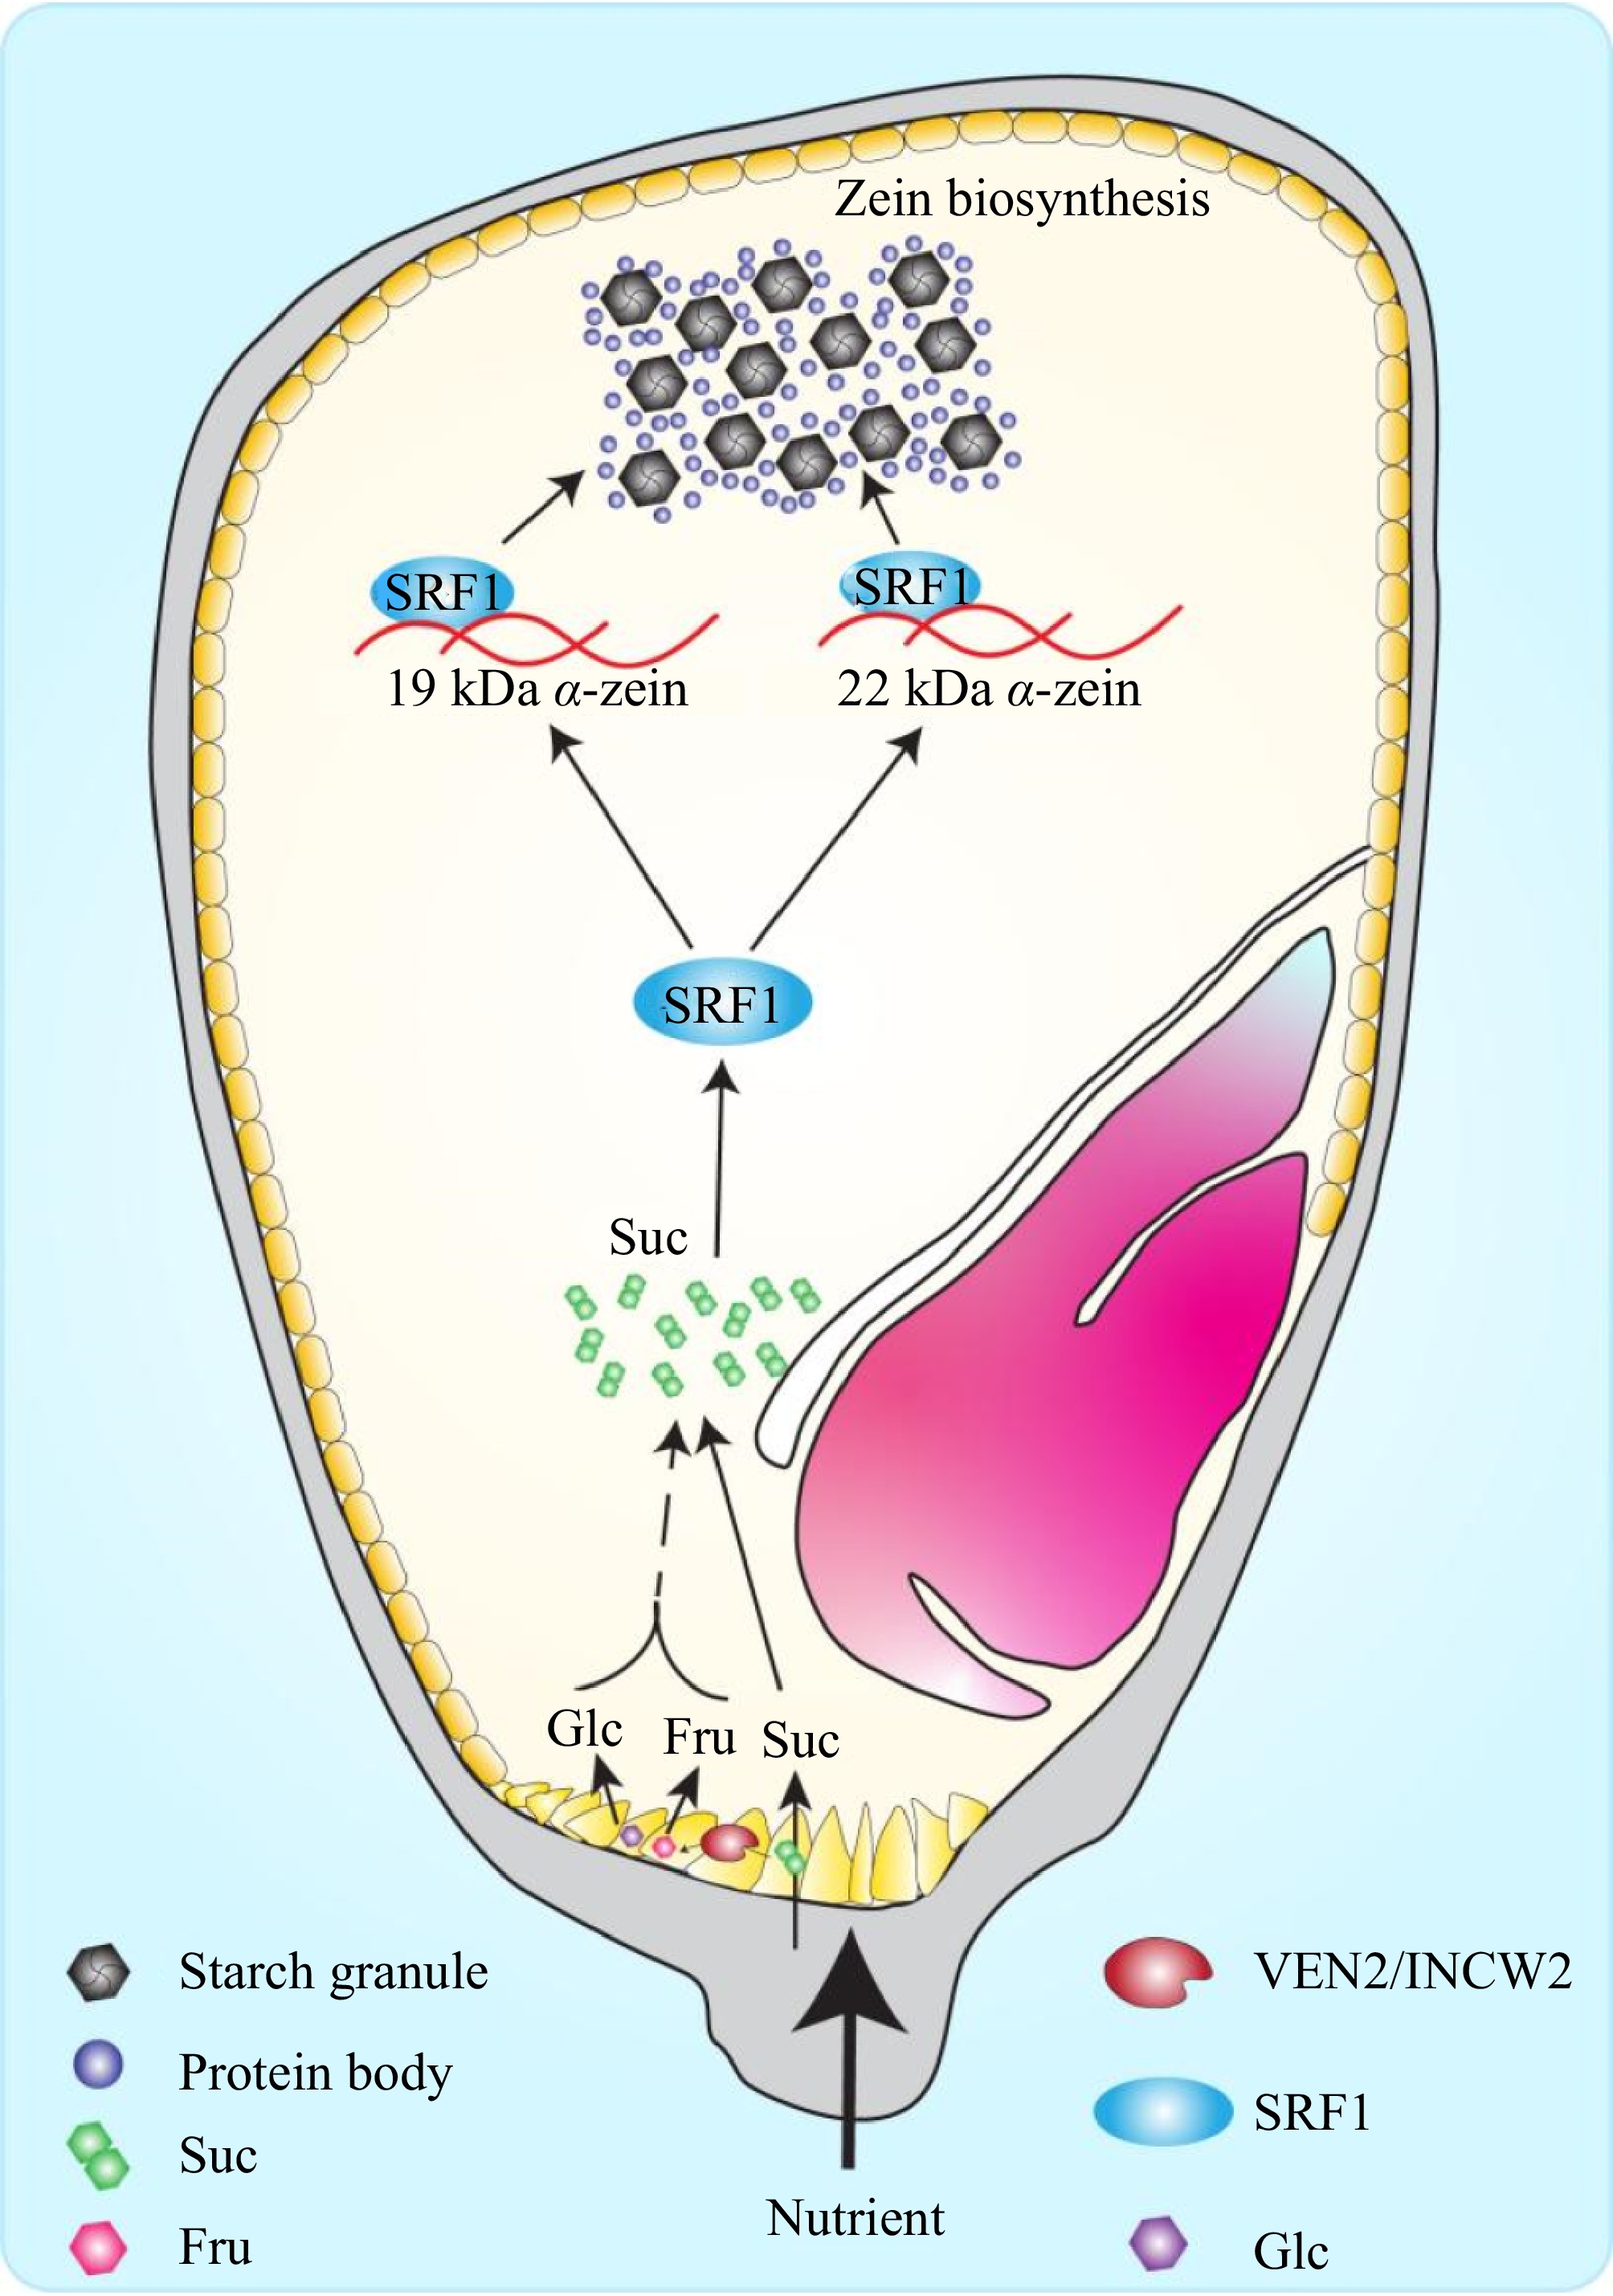
Figure 6.
A proposed model of sucrose content affects zein biosynthesis mediating by transcription factor SRF1. In the cell wall ingrowths, sucrose is hydrolyzed into hexoses (glucose and fructose) by VEN2/INCW2 and the apoplasmic sucrose and hexoses are translocated into endosperm cell. The transcription factor SRF1 responds to sucrose and regulates the expression of 19 kDa and 22 kDa α-zein by binding directly to their promoters, thereby mediating zein biosynthesis. Suc, sucrose; Fru, fructose; Glc, glucose.
Figures
(6)
Tables
(0)